Original Link: https://www.anandtech.com/show/7963/the-intel-haswell-refresh-review-core-i7-4790-i5-4690-and-i3-4360-tested
The Intel Haswell Refresh Review: Core i7-4790, i5-4690 and i3-4360 Tested
by Ian Cutress on May 11, 2014 3:01 AM EST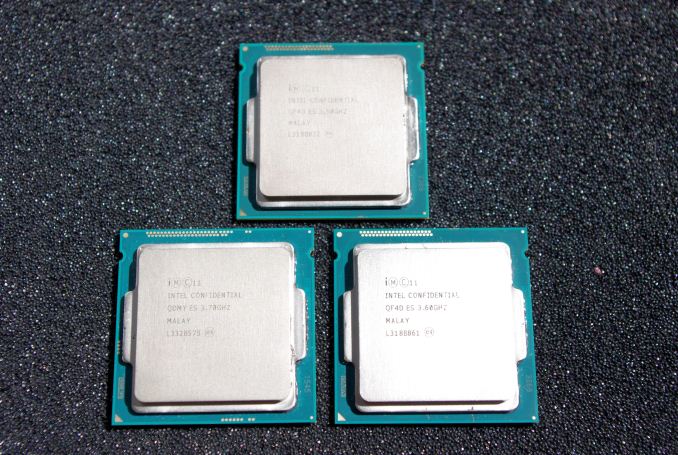
Computer processors for PC like devices fall into four broad categories, starting with the smartphone/tablet, then the notebook, the desktop and finally the extreme desktop/server. These segments have different cadence formats from each of the companies that compete between new designs. For longer cadences it makes sense to launch an improved product in the middle of that cadence taking advantage of minor production improvements. To that end, Intel is updating their June 2013 Haswell CPU line with a ‘Haswell Refresh’ – 20+ CPUs aimed to be faster at similar price points to the original Haswell release.
The Death of Desktop… or not
Mainstream media are all too ready to pounce on the end of the desktop. While it is true that casual computing is shifting towards smaller hand-held devices, in most ‘work’ type scenarios that involve more delicate interaction than just touch, the desktop is still king. The rise of smaller PC-like devices such as the Mac Mini, NUC and the BRIX now separate the desktop into two categories: human-limited content production against computer-limited content processing.
For human-limited content production, the smaller PC-like devices are ideal. Typically limited to faster dual core or slower quad core parts, a single storage drive and integrated graphics, these devices make their use in writing reports, writing reviews, browsing the internet, answering emails and minor photograph/video editing. The ultimate goal is that no matter how long you might be waiting for an email to send, or a photograph effect to be processed, the limiting factor is the technology between the keyboard and the monitor: the user.
For home use and most workplace scenarios, the smaller PC-like device makes sense. They end up using a mobile CPU variant that is binned for low power and voltage, and can make use of cloud storage for anything more substantial. For other users, where the goal is better graphics, enhanced detail, pure processing, a testing environment, a DRAM limited scenario or the need for grunt is paramount, then a full-desktop should be the answer.
The two main players are Intel and AMD. AMD focuses on specific workloads geared at integer type commands and are gambling on the heavy integration of the GPU for these type of workloads via OpenCL. Intel is king in general purpose single-threaded performance, wherein most software requires brute force down a single code path because that is the easiest way to write programs. Intel multiplies this out into many cores and many threads in order to allow more of these processes to run at once. This can be considered not the most power efficient way of designing a processor (more cores and more MHz can push efficiency out the window).
Both of these companies have a processor cadence. AMD recently released their Kaveri platform in January, following their Richland platform back in June 2013. Kabini was a half-node change on a different silicon platform (32nm SOI to 28nm SHP). On the Intel equation, ignoring the Atom and Extreme processor lines, the last full release was Haswell in June 2013. Before this was Ivy Bridge in April 2012. As part of Intel’s tick-tock strategy (a tick being a die shrink, a tock being an architecture update), Ivy Bridge was a tick from Sandy Bridge, and Haswell was a tock from Ivy Bridge. The next platform is Broadwell, a tick/die-shrink from 22nm to 14nm due out (by our estimates) somewhere near the end of the year. That makes Haswell to Broadwell a full 15 to 18-month gap with nothing in-between for the desktop space.
Having such a large gap between launches can make other companies, particularly the partners that depend on these releases, somewhat frustrated. A new product means an opportunity to promote new hardware and new designs, bringing in the profits. In an industry where sales revolve around new releases, there has to be some form of relevant cadence in order to tell shareholders when jumps in revenue are expected. In order to satiate both sides of the equation, Intel is today officially releasing two series of products. The first is the new 9-series chipsets for current Haswell CPUs and upcoming Broadwell processors. We will be looking at the performance of the chipset in more detail when it comes to motherboard reviews later this week. The second side of the launch is the Haswell Refresh processors – a set of 20+ CPUs at higher frequencies/better price points than the original Haswell release.
The 9-Series Chipsets
Today Intel is launching two mainstream 9-series chipsets, both evolutions from the 8-series platform. Z97 and H97 motherboards based on the new silicon also go on sale today, supporting the LGA1150 socket only. The primary purpose of these chipsets over the 8-series is to introduce more storage options, including SATA Express and M.2. As with the previous nomenclature, Z97 is the overclocking platform aimed at multiple GPUs and maximum everything whereas H97 is a cheaper option with Intel’s Small Business Advantage add-on with certain firmware versions.
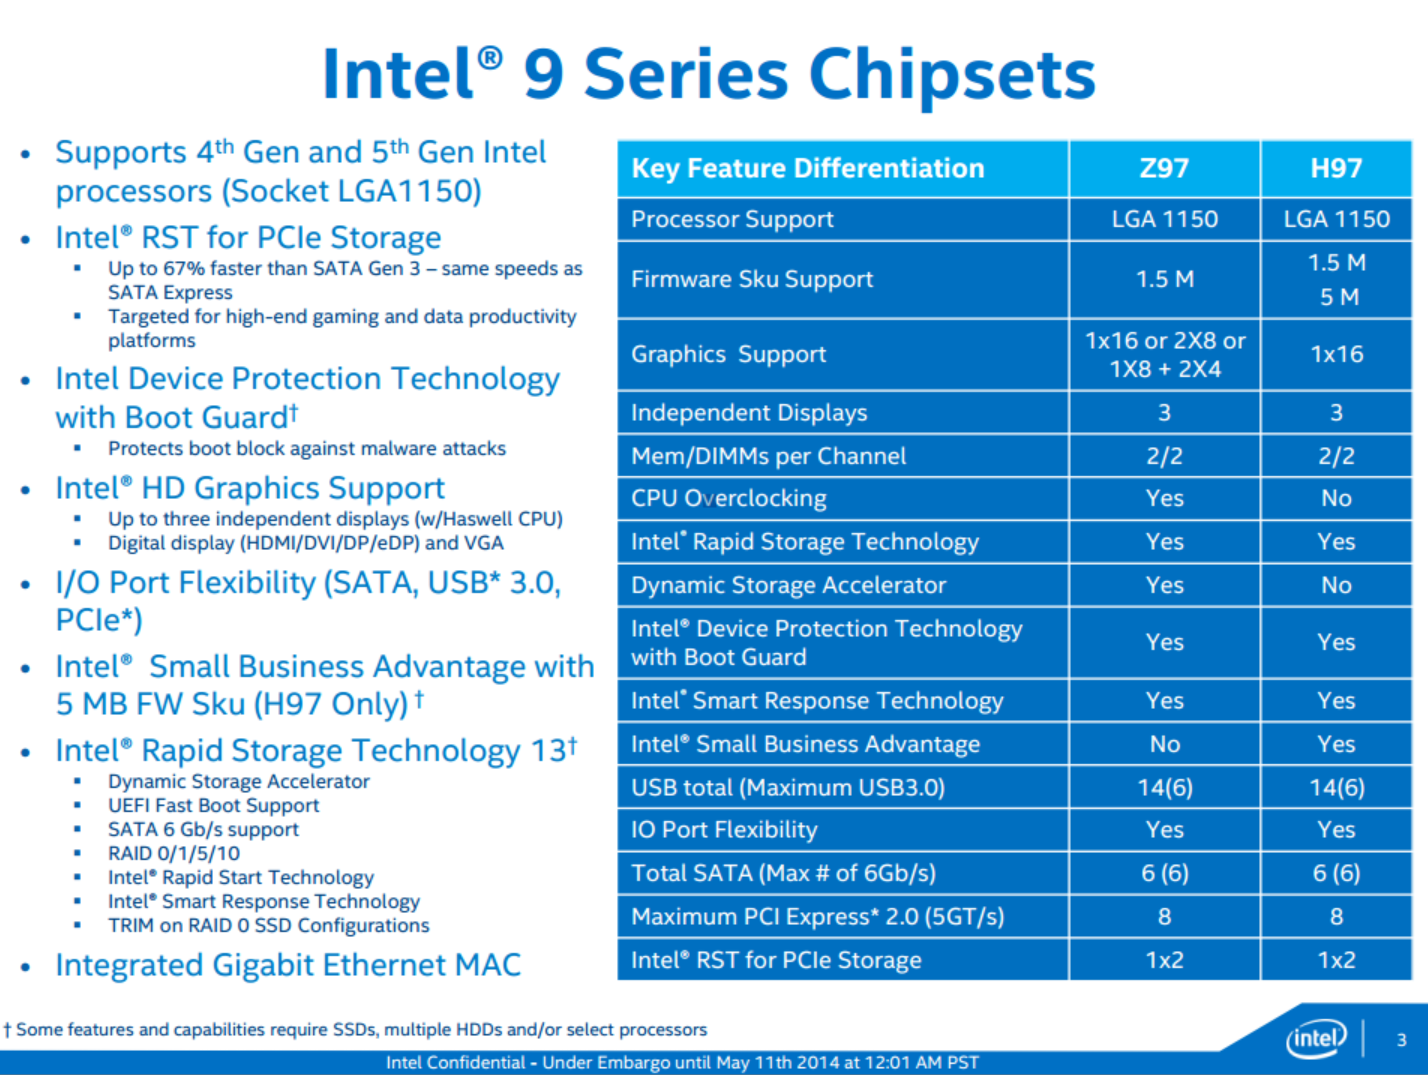
Rapid Storage Technology is now enabled for PCIe devices, allowing (we believe) integration of the SATA Express and M.2 devices into RAID arrays or SRT hybrids. Both of these chipsets will support current LGA1150 processors (Haswell) and future ones (Broadwell), and maintain Flex IO with up to six USB 3.0 and six SATA 6 Gbps (the same as 8-series). I mention the processor support based on the fact that Intel has not confirmed if Broadwell processors will work on the older 8-series chipsets. In fact when Intel announced the Haswell based Devil’s Canyon SKU back in March, we were told by Intel that this SKU is “supported on Intel® 9 series chipset. Intel® 8 series boards are not targeted for “Devil’s Canyon” support.”, which might mark Broadwell in the same vein.
With 9-series, Intel is enabling Rapid Storage Technology 13, allowing UEFI support, RAID 0/1/5/10 on chipset ports and TRIM in RAID 0 SSD configurations. With M.2 and SATA Express, the RST will solely be for a PCIe x2 slot, which means implementations like ASRock’s M.2 PCIe x4 on their Z97 Extreme6 might be excluded (the x4 is also routed via the CPU, not the chipset, which may be the reason).
The PCIe storage on 9-series is somewhat confusing. For clarity, let us return to the Flex IO system introduced with the 8-series:
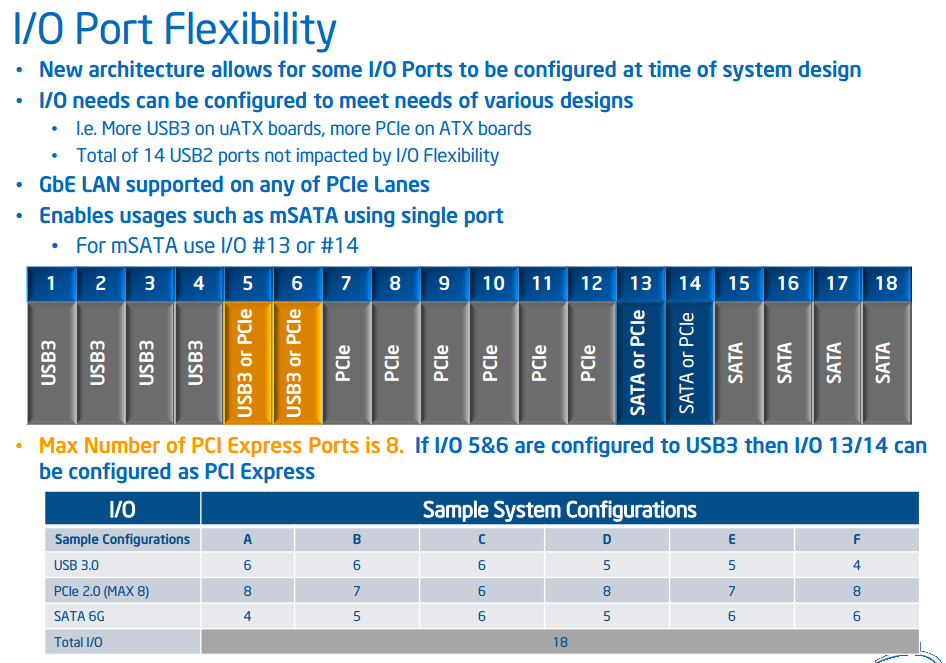
The chipset has access to 18 ports, four of which are USB 3.0, four are SATA 6 Gbps and 6 are PCIe. This leaves two sets of two, the first set can be configured for either USB 3.0 or PCIe, and the second set are either SATA or PCIe, but only a maximum of eight PCIe ports are possible. This is designed as a catch-all interface for different sized motherboards, where some can use more PCIe lanes, others can use more USB 3 ports, and so on. Eventually as the future of the chipset progresses, I see all these ports becoming flexible, though I would imagine we are a few years out from this.
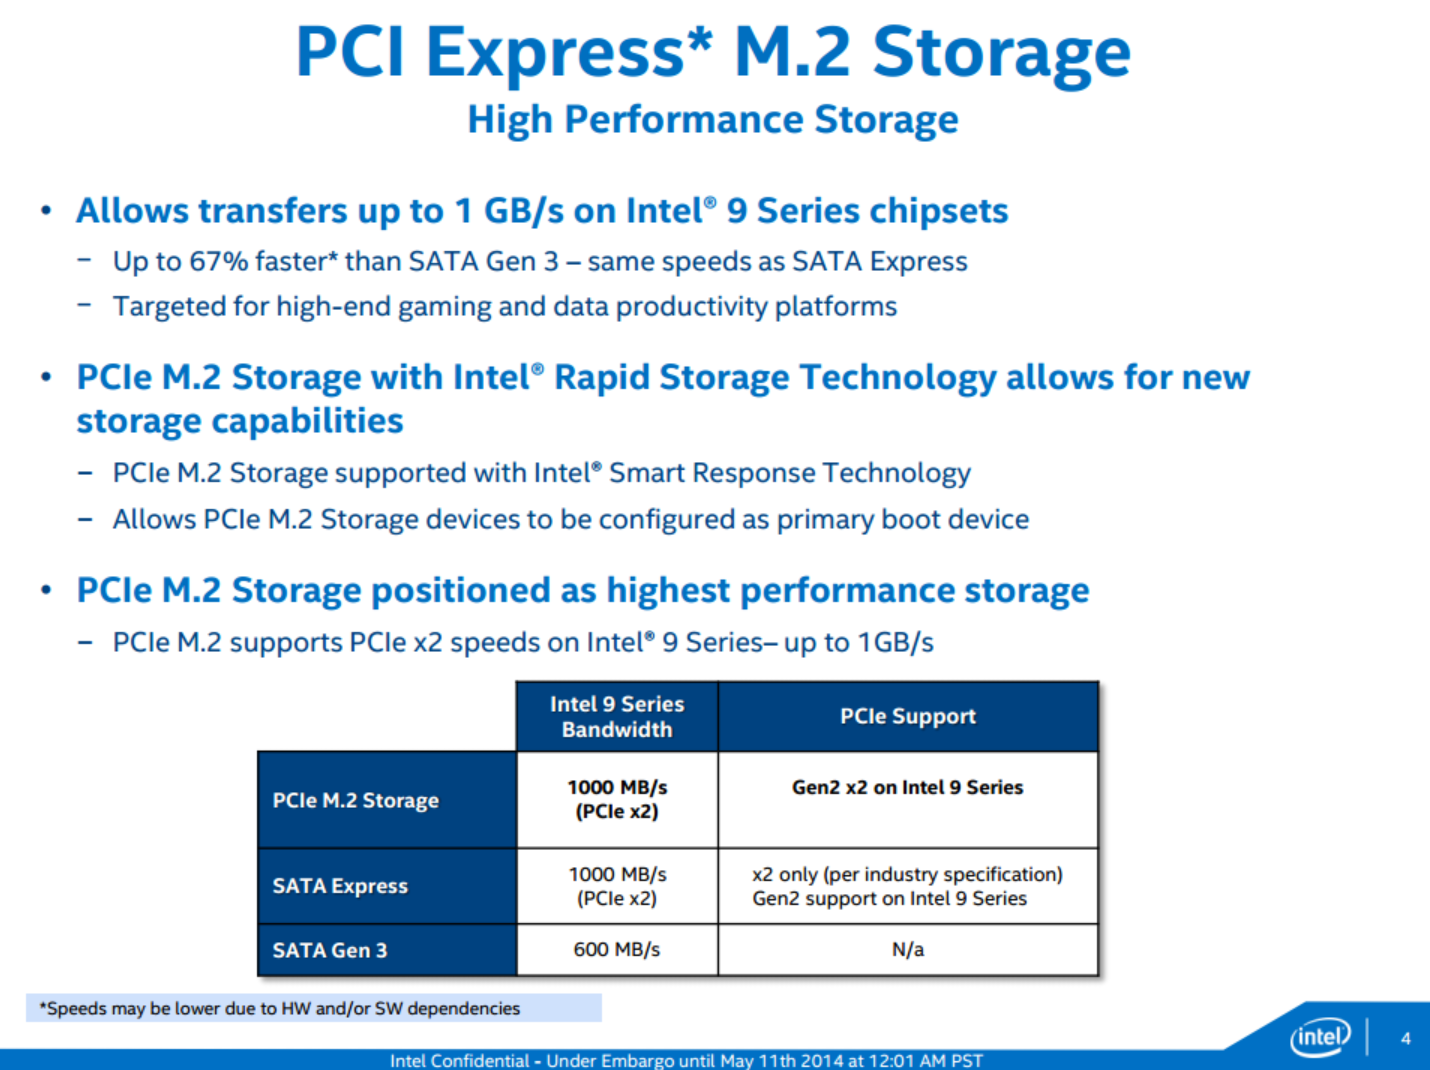
With the PCIe storage functionality, SATA Express and M.2, the lanes for both should come from the PCIe allocation. However, each connector can take advantage of having SATA ports as well:
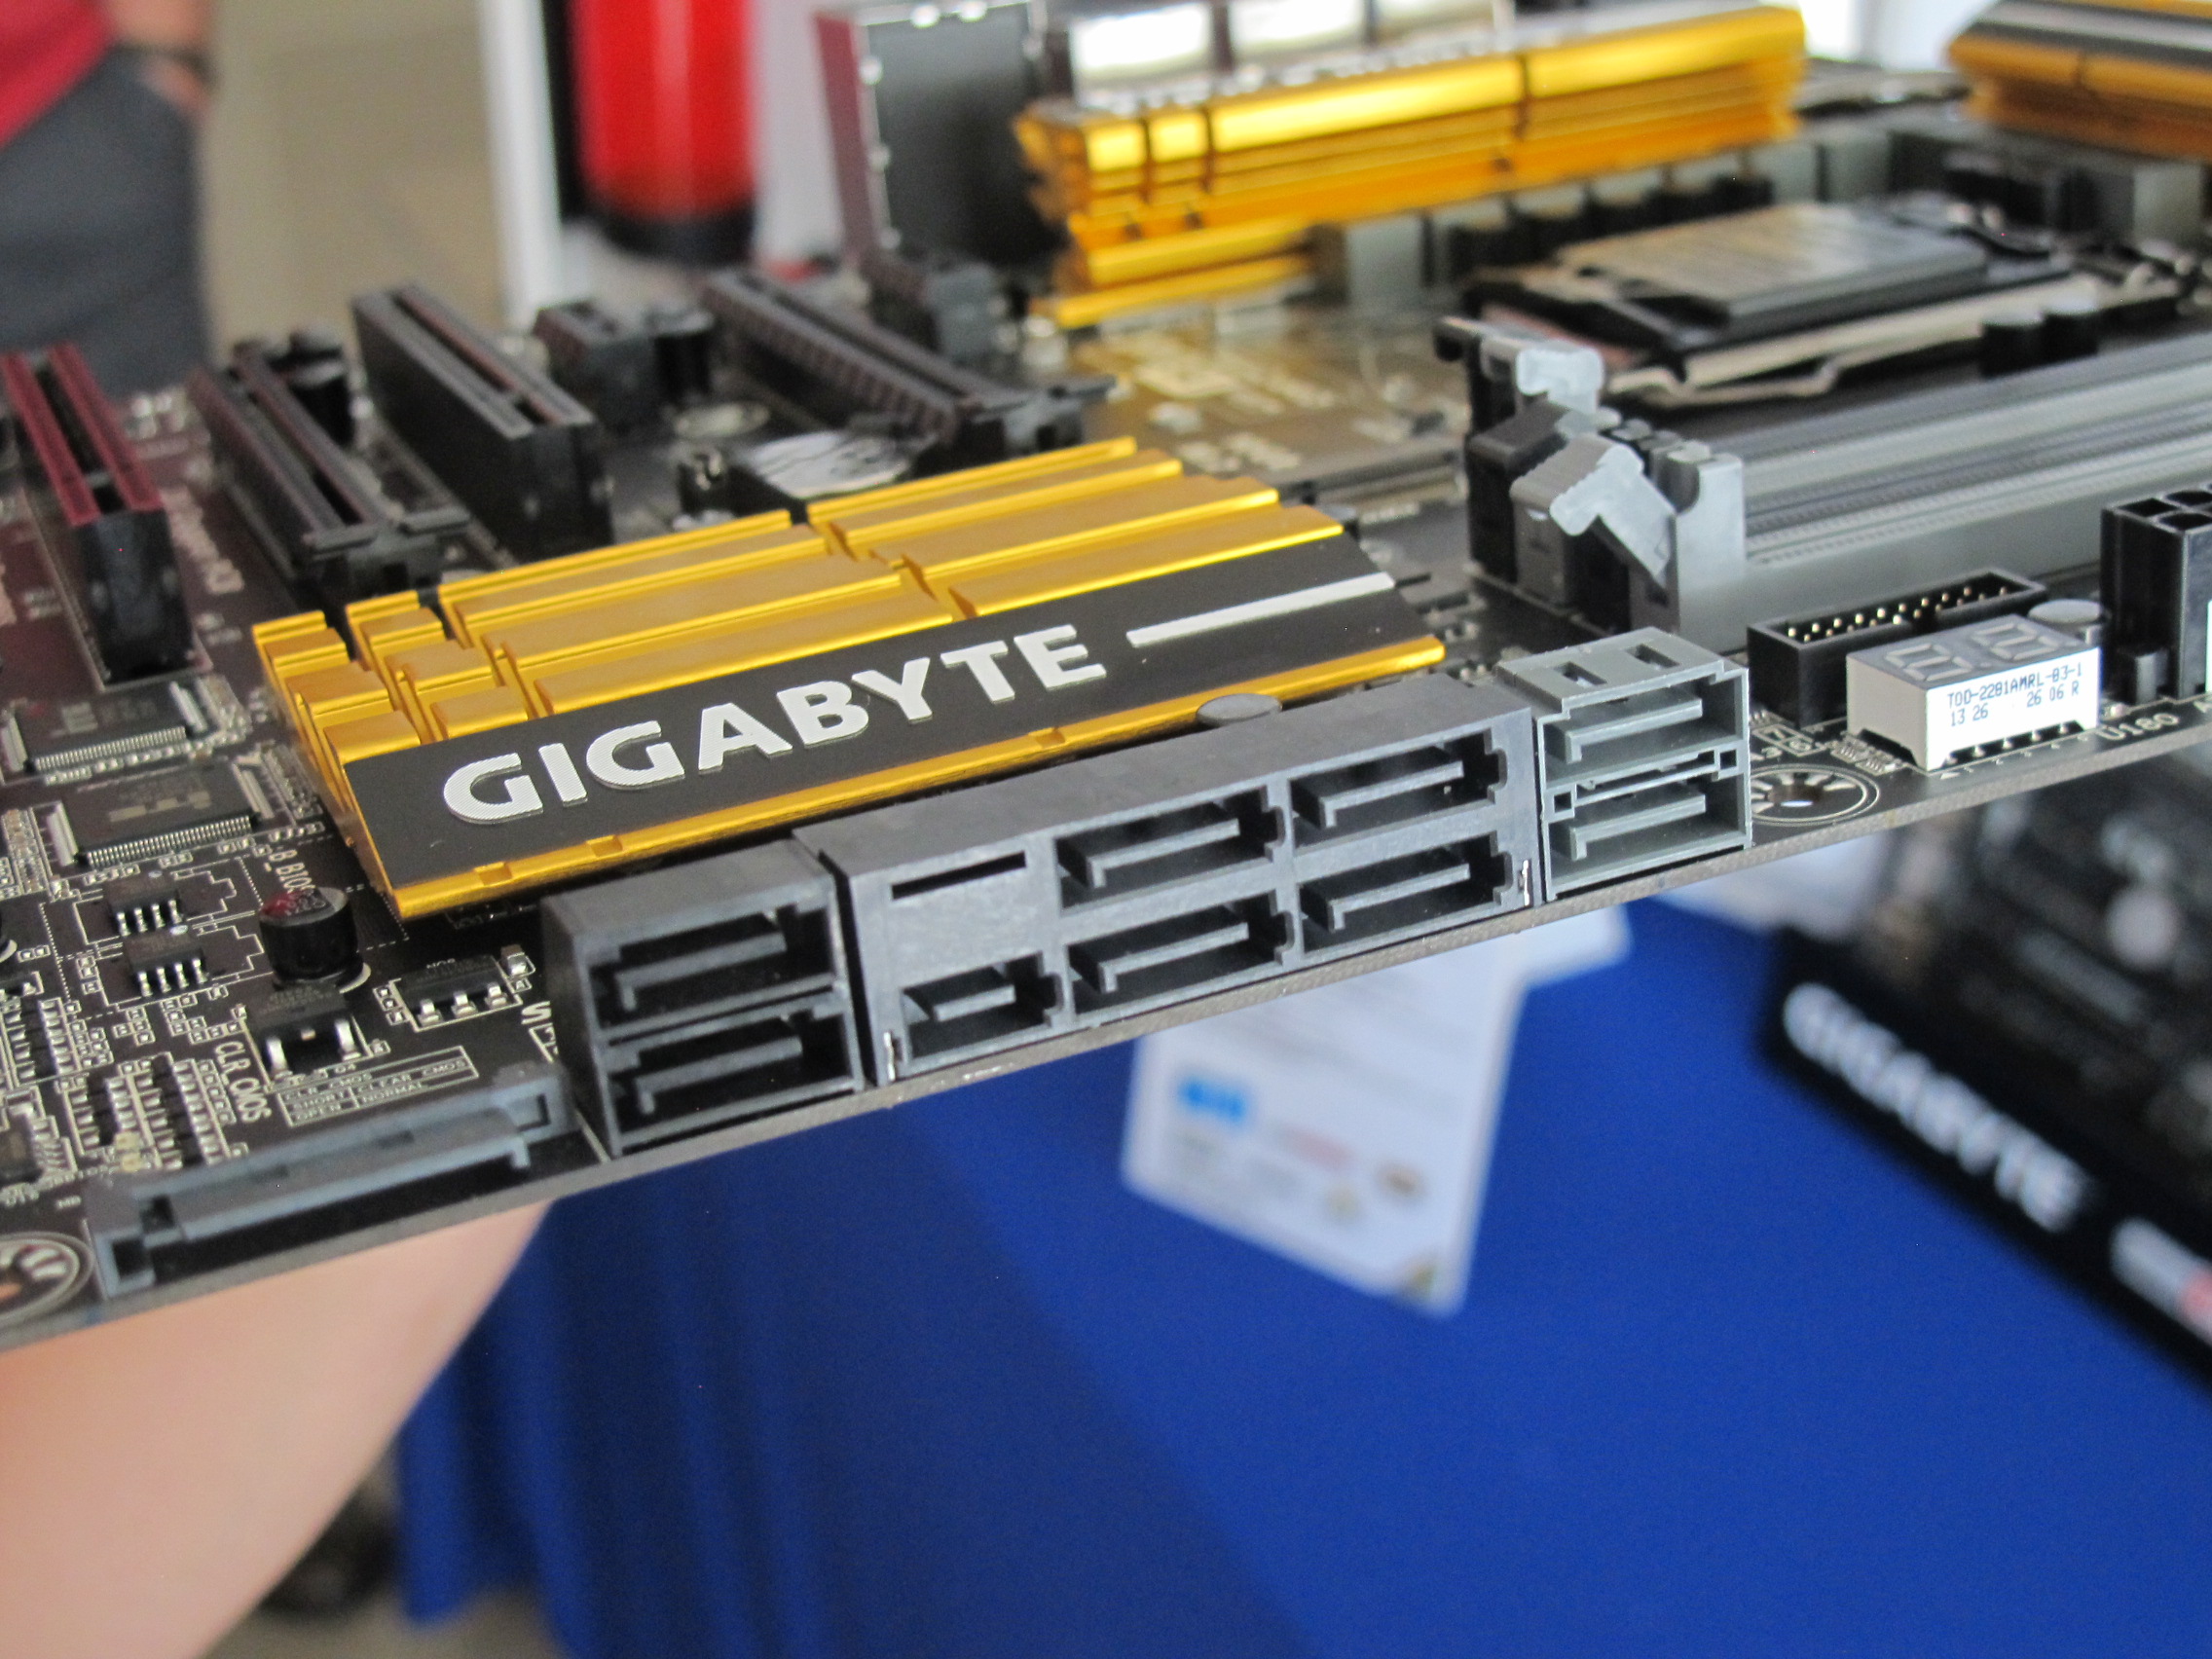
Thus the SATA ports with SATA Express will also be hooked up to the chipset ports for a mixed IO solution. With the motherboard shown above, an amicable solution is found: the two ports on the right are plain chipset SATA 6 Gbps ports. The combined mass in the middle is four SATA ports, two of which can be used instead for SATA Express duties or plain SATA, but not both. This means if SATA Express is used, two SATA ports are lost as well. Finally on the left is another set of two SATA 6 Gbps ports, this time from a controller. We will find that some motherboard manufacturers completely separate the SATA Express ports from the chipset, using a switch to change between a controller and SATA Express functionality instead. A motherboard manufacturer can also use a SATA Express controller, which uses two PCIe lanes and an internal switch/SATA controller to provide either SATA Express functionality or SATA ports.
M.2 (NGFF) is another part to this due to the mixed standard it operates. M.2 can be either SATA based or PCIe based, and the slots can be wired up differently. Technically the specification allows for four PCIe lanes and one SATA 6 Gbps port through the connector, although we might see motherboard manufacturers solely use a PCIe x2 connection as a result and SATA-based M.2 will not function. One might think that while M.2 was designed to unify the SFF storage standard for PCIe, it just happens to make things more complicated when motherboard manufacturers do not want to lose functionality.
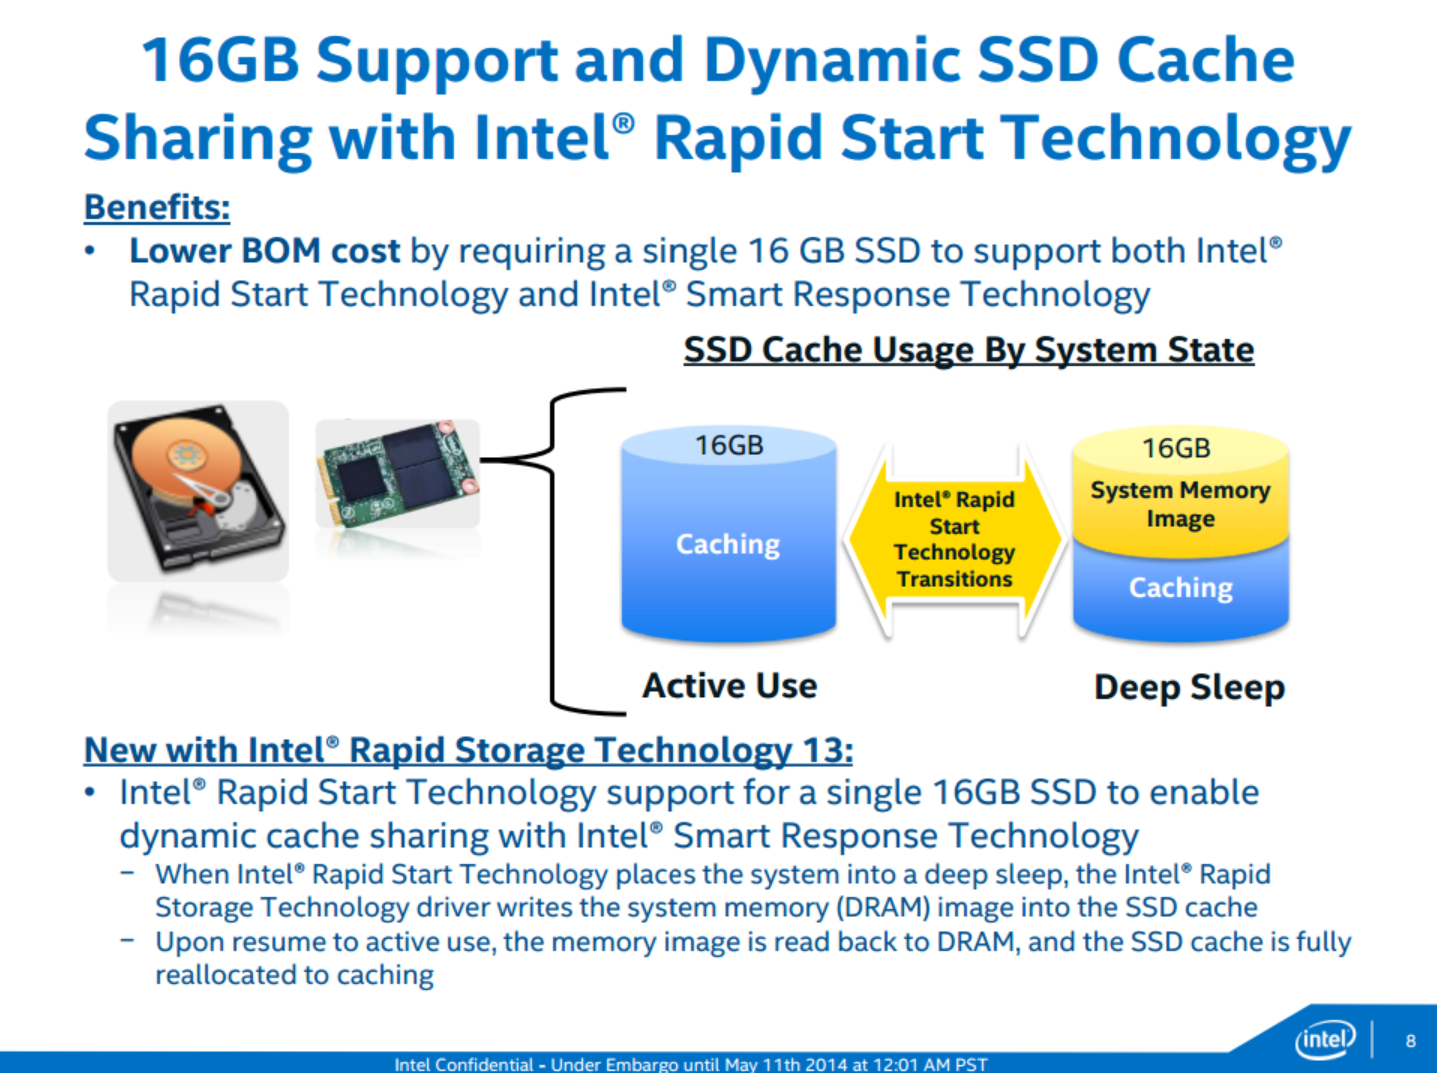
With RST13 / 9-series, Intel is now supporting Rapid Start Technology with 16 GB of storage. This would allow systems to enter a deep sleep, write the contents of DRAM to the SSD cache, and then resume to active use by doing the reverse copy. While Intel is promoting the lower BOM cost to entry for this platform, I see it a little differently. It would allow portable devices to have suitable storage soldered onto the motherboard (consuming a SATA port) and the system by default, even with an SSD, uses RST.
Chances are that the 9-series chipsets also include efficiency enhancements under the hood, but Intel only provides information regarding their consumer-facing adjustments. In that respect, the 9-series is only a relatively small bump in storage options. Everything else remains the same, or to put it another way, due to the storage options designing a motherboard gets a little harder.
All the major motherboard manufacturers will have 9-series based products up for purchase today, ranging from $120 to $400. We covered the leaked images from GIGABYTE, ASUS, MSI and ASRock in a short article a couple of weeks ago – some of the galleries are below. Stay tuned for full reviews of some of these motherboards in the next couple of weeks.


The Haswell Refresh Processors
As a species that thrives on getting things done quicker or cheaper, a processor refresh should be welcomed. For the refresh, Intel is launching a total of 42 new SKUs, 24 of which are desktop but not all of them will make it into the land of retail. Prices for batches of a thousand will range from $42 to $303 on the desktop and $75 to $434 in mobile. Cutting to the chase, the new desktop SKUs are:
| Intel Haswell Refresh CPU List (Desktop) | ||||||||
| New SKU | Cores | Base | Turbo | L3 Cache | IGP | TDP / W |
Intel List Price |
|
| Celeron G1840 | 2 / 2 | 2800 | - | 2 MB | HD (Haswell) | 53 | $42 | |
| Celeron G1840T | 2 / 2 | 2500 | - | 2 MB | HD (Haswell) | 35 | $42 | |
| Celeron G1850 | 2 / 2 | 2900 | - | 2 MB | HD (Haswell) | 53 | $52 | |
| Pentium G3240 | 2 / 2 | 3100 | - | 3 MB | HD (Haswell) | 53 | $64 | |
| Pentium G3240T | 2 / 2 | 2700 | - | 3 MB | HD (Haswell) | 35 | $64 | |
| Pentium G3440 | 2 / 2 | 3300 | - | 3 MB | HD (Haswell) | 53 | $75 | |
| Pentium G3440T | 2 / 2 | 2800 | - | 3 MB | HD (Haswell) | 35 | $75 | |
| Pentium G3450 | 2 / 2 | 3400 | - | 3 MB | HD (Haswell) | 53 | $86 | |
| Core i3-4150 | 2 / 4 | 3500 | - | 3 MB | HD 4400 | 54 | $117 | |
| Core i3-4150T | 2 / 4 | 3000 | - | 3 MB | HD 4400 | 35 | $117 | |
| Core i3-4350 | 2 / 4 | 3600 | - | 4 MB | HD 4600 | 54 | $138 | |
| Core i3-4350T | 2 / 4 | 3100 | - | 4 MB | HD 4600 | 35 | $138 | |
| Core i3-4360 | 2 / 4 | 3700 | - | 4 MB | HD 4600 | 54 | $149 | |
| Core i5-4460 | 4 / 4 | 3200 | 3400 | 6 MB | HD 4600 | 84 | $182 | |
| Core i5-4460S | 4 / 4 | 2900 | - | 6 MB | HD 4600 | 65 | $182 | |
| Core i5-4590 | 4 / 4 | 3300 | 3700 | 6 MB | HD 4600 | 84 | $192 | |
| Core i5-4590S | 4 / 4 | 3000 | 3700 | 6 MB | HD 4600 | 65 | $192 | |
| Core i5-4590T | 4 / 4 | 2000 | - | 6 MB | HD 4600 | 35 | $192 | |
| Core i5-4690 | 4 / 4 | 3500 | 3900 | 6 MB | HD 4600 | 84 | $213 | |
| Core i5-4690S | 4 / 4 | 3200 | 3900 | 6 MB | HD 4600 | 65 | $213 | |
| Core i5-4690T | 4 / 4 | 2500 | - | 6 MB | HD 4600 | 45 | $213 | |
| Core i7-4785T | 4 / 8 | 2200 | - | 8 MB | HD 4600 | 35 | $303 | |
| Core i7-4790 | 4 / 8 | 3600 | 4000 | 8 MB | HD 4600 | 84 | $303 | |
| Core i7-4790S | 4 / 8 | 3200 | 4000 | 8 MB | HD 4600 | 65 | $303 | |
| Core i7-4790T | 4 / 8 | 2700 | - | 8 MB | HD 4600 | 45 | $303 | |
Every new desktop processor is a 100-200 MHz upgrade from the one named xx2x lower but at the same price point. Back when the initial processor price lists were announced, I made different comparisons from Celeron to i7 depending on what was relevant. For example, in the Celeron category:
| Haswell Celeron | ||
|
Celeron G1840 2.8 GHz (New) |
Celeron G1830 2.8 GHz (Current) |
|
| CPU Speed | 2.8 GHz | 2.8 GHz |
| Cores | 2 | 2 |
| Threads | 2 | 2 |
| L2 Cache | 512 KB | 512 KB |
| L3 Cache | 2048 KB | 2048 KB |
| IGP | HD (Haswell) | HD (Haswell) |
| IGP Frequency | ? | 1050 |
| TDP | 53W | 53W |
| Price at Launch | $42 | $52 |
Here we already have a Celeron processor with the exact same speed as one of the Haswell Refresh SKUs, but because it has been on the market for longer it is actually cheaper while providing the same specifications.
At the top end i7, the i7-4790 should actually be a replacement for the i7-4771 which was released in September 2013:
| Haswell Core i7 | ||
|
Core i7-4790 (New) |
Core i7-4771 (Current) |
|
| CPU Speed | 3600 MHz / 4000 MHz | 3500 MHz / 3900 MHz |
| Cores | 4 | 4 |
| Threads | 8 | 8 |
| L2 Cache | 1024 KB | 1024 KB |
| L3 Cache | 8192 KB | 8192 KB |
| IGP | HD 4600 | HD 4600 |
| IGP Frequency | 350 / 1200 MHz | 350 MHz / 1200 MHz |
| TDP | 84W | 84W |
| Price at Launch | $303 | $314 (OEM) / $320 (box) |
By releasing new mainstream processors into the desktop market, as well as the 9-series chipsets, Intel has afforded the system integrators another chance to sell newer systems and not to stagnate with older models.
For most of the performance enthusiasts reading this review, the question you might well be asking yourself relates to the Haswell Refresh overclockable CPU. At this point in time it is clear that the i5-4670K and i7-4770K models do not have refresh counterparts, both of which are also more marketable to system integrators as well as desired by home users. There is a simple explanation to this.
Nothing fundamentally changes with these refresh processors. It is the same design underneath. Now that Intel has been making Haswell wafers, the process is slightly more efficient over time (ironing out production) and the processor bins can all be shifted. If Intel were to release new overclockable CPUs that were a simple speed bump but ultimately had no performance gain of the current overclocking CPUs, there might be a backlash.
To that end, Intel is going to release ‘Devil’s Canyon’ in due course. Devil’s Canyon has no official SKU name yet (i7-4970K or i7-4770X are my best guesses) but it was announced back in March as having an improved package and better thermal interface material. It will probably be the same silicon underneath as the i7-4770K due to the nature of the refresh, perhaps with a small design tweak that does not require new masks. We will review the new overclocking processor when we receive a sample from Intel, hopefully under something suitably extreme.
Today’s Review: The Intel Core i7-4790, i5-4690 and i3-4360
Back when Haswell was launched, we had only the chance to test the top line overclocking processor, the i7-4770K. This time around I was thankful to get the opportunity to expand our testing to the i5 and i3 segments of the processor line to find where they each stand in terms of performance. For comparison points we have the i7-4770K from our launch review, an i7-4765T from our ASRock M8 review, and an i3-4330 we picked up along the way.
| The Intel Haswell Refresh Review | ||||||
|
Core i7-4790 (New) |
Core i7-4770K | Core i7-4765T |
Core i5-4690 (New) |
Core i3-4360 (New) |
Core i3-4330 | |
| Price | $303 | $340 | $303 | $225 | $149 | $140 |
| Launch | 5/2014 | 6/2013 | 6/2013 | 5/2014 | 5/2014 | 9/2013 |
| Cores / Threads | 4/8 | 4/8 | 4/8 | 4/4 | 2/4 | 2/4 |
|
Base Frequency |
3600 | 3500 | 2000 | 3500 | 3700 | 3500 |
|
Turbo Frequency |
4000 | 3900 | 3000 | 3900 | - | - |
| IGP | HD 4600 | HD 4600 | HD 4600 | HD 4600 | HD 4600 | HD 4600 |
|
IGP Frequency |
350 | 350 | 350 | 350 | 600 | 350 |
| IGP Turbo | 1200 | 1250 | 1200 | 1200 | 1150 | 1150 |
| L3 Cache | 8 MB | 8 MB | 8 MB | 6 MB | 4 MB | 4 MB |
| TDP | 84 W | 84 W | 35 W | 84 W | 54 W | 54 W |
Assuming all goes as planned, the small increases in frequency should provide a ~3% increase in benchmarks compared to the older Haswell processors.
Multi-Core Enhancement Isn’t Much Of An Issue
CPU benchmarking can be a bit of a nightmare in the current climate, especially on Intel platforms where turbo modes are possible. Back in 2012 I wrote an extensive news piece about Multi-Core Enhancement titled ‘The Debate About Free MHz’, wherein it is not actually Intel that set the CPU frequency for the processors but the motherboard. Where Intel might have a 3500 MHz base frequency and a 3900 MHz turbo frequency, a motherboard can detect that setting and override it for 3900 MHz on all cores by default. One motherboard went as far as increasing the multiplier +1 over the Intel specifications. The upshot of this is in multi-threaded performance benchmarks, where due to the extra frequency the final result is higher than Intel specifications. MultiCore Enhancement also means that the same CPU in different motherboards will give different results out of the box.
Most motherboard manufacturers that use this tactic (MSI, ASRock, GIGABYTE and ASUS all have this feature), as far as I can tell, limit the option to overclockable SKUs, and it is only implemented when XMP is implemented.
On top of this, Windows can also be a culprit. In different power modes, users can specify the percentage of maximum CPU frequency depending on what power mode is in play. This relates more to portable devices, but it is configurable with desktop systems as well.
For our review, as we only have one overclockable CPU in the test, we can adjust appropriately. For our testing we actually run SYSMark 2014 as our first benchmark, as the install prefers a fresh OS image to work with. This generates a consistent power profile which we maintain for the rest of the benchmarks. Had we run SYSMark mid-way through our testing period, it may have ended up with variable results, so we aim to keep our environment consistent and maintainable.
Test Setup
We would like to thank the following companies for providing test-bed support:
Thank you to OCZ for providing us with PSUs and SSDs.
Thank you to G.Skill and ADATA for providing us with memory kits.
Thank you to Corsair for providing us with an PSU, CLC and memory.
Thank you to ASUS for providing us with the AMD HD7970 GPUs and some IO Testing kit.
Thank you to MSI for providing us with the NVIDIA GTX 770 Lightning GPUs.
Thank you to Rosewill for providing us with keyboards.
Thank you to ASRock for providing us with the 802.11ac wireless router for testing and other components.
| Test Setup | |
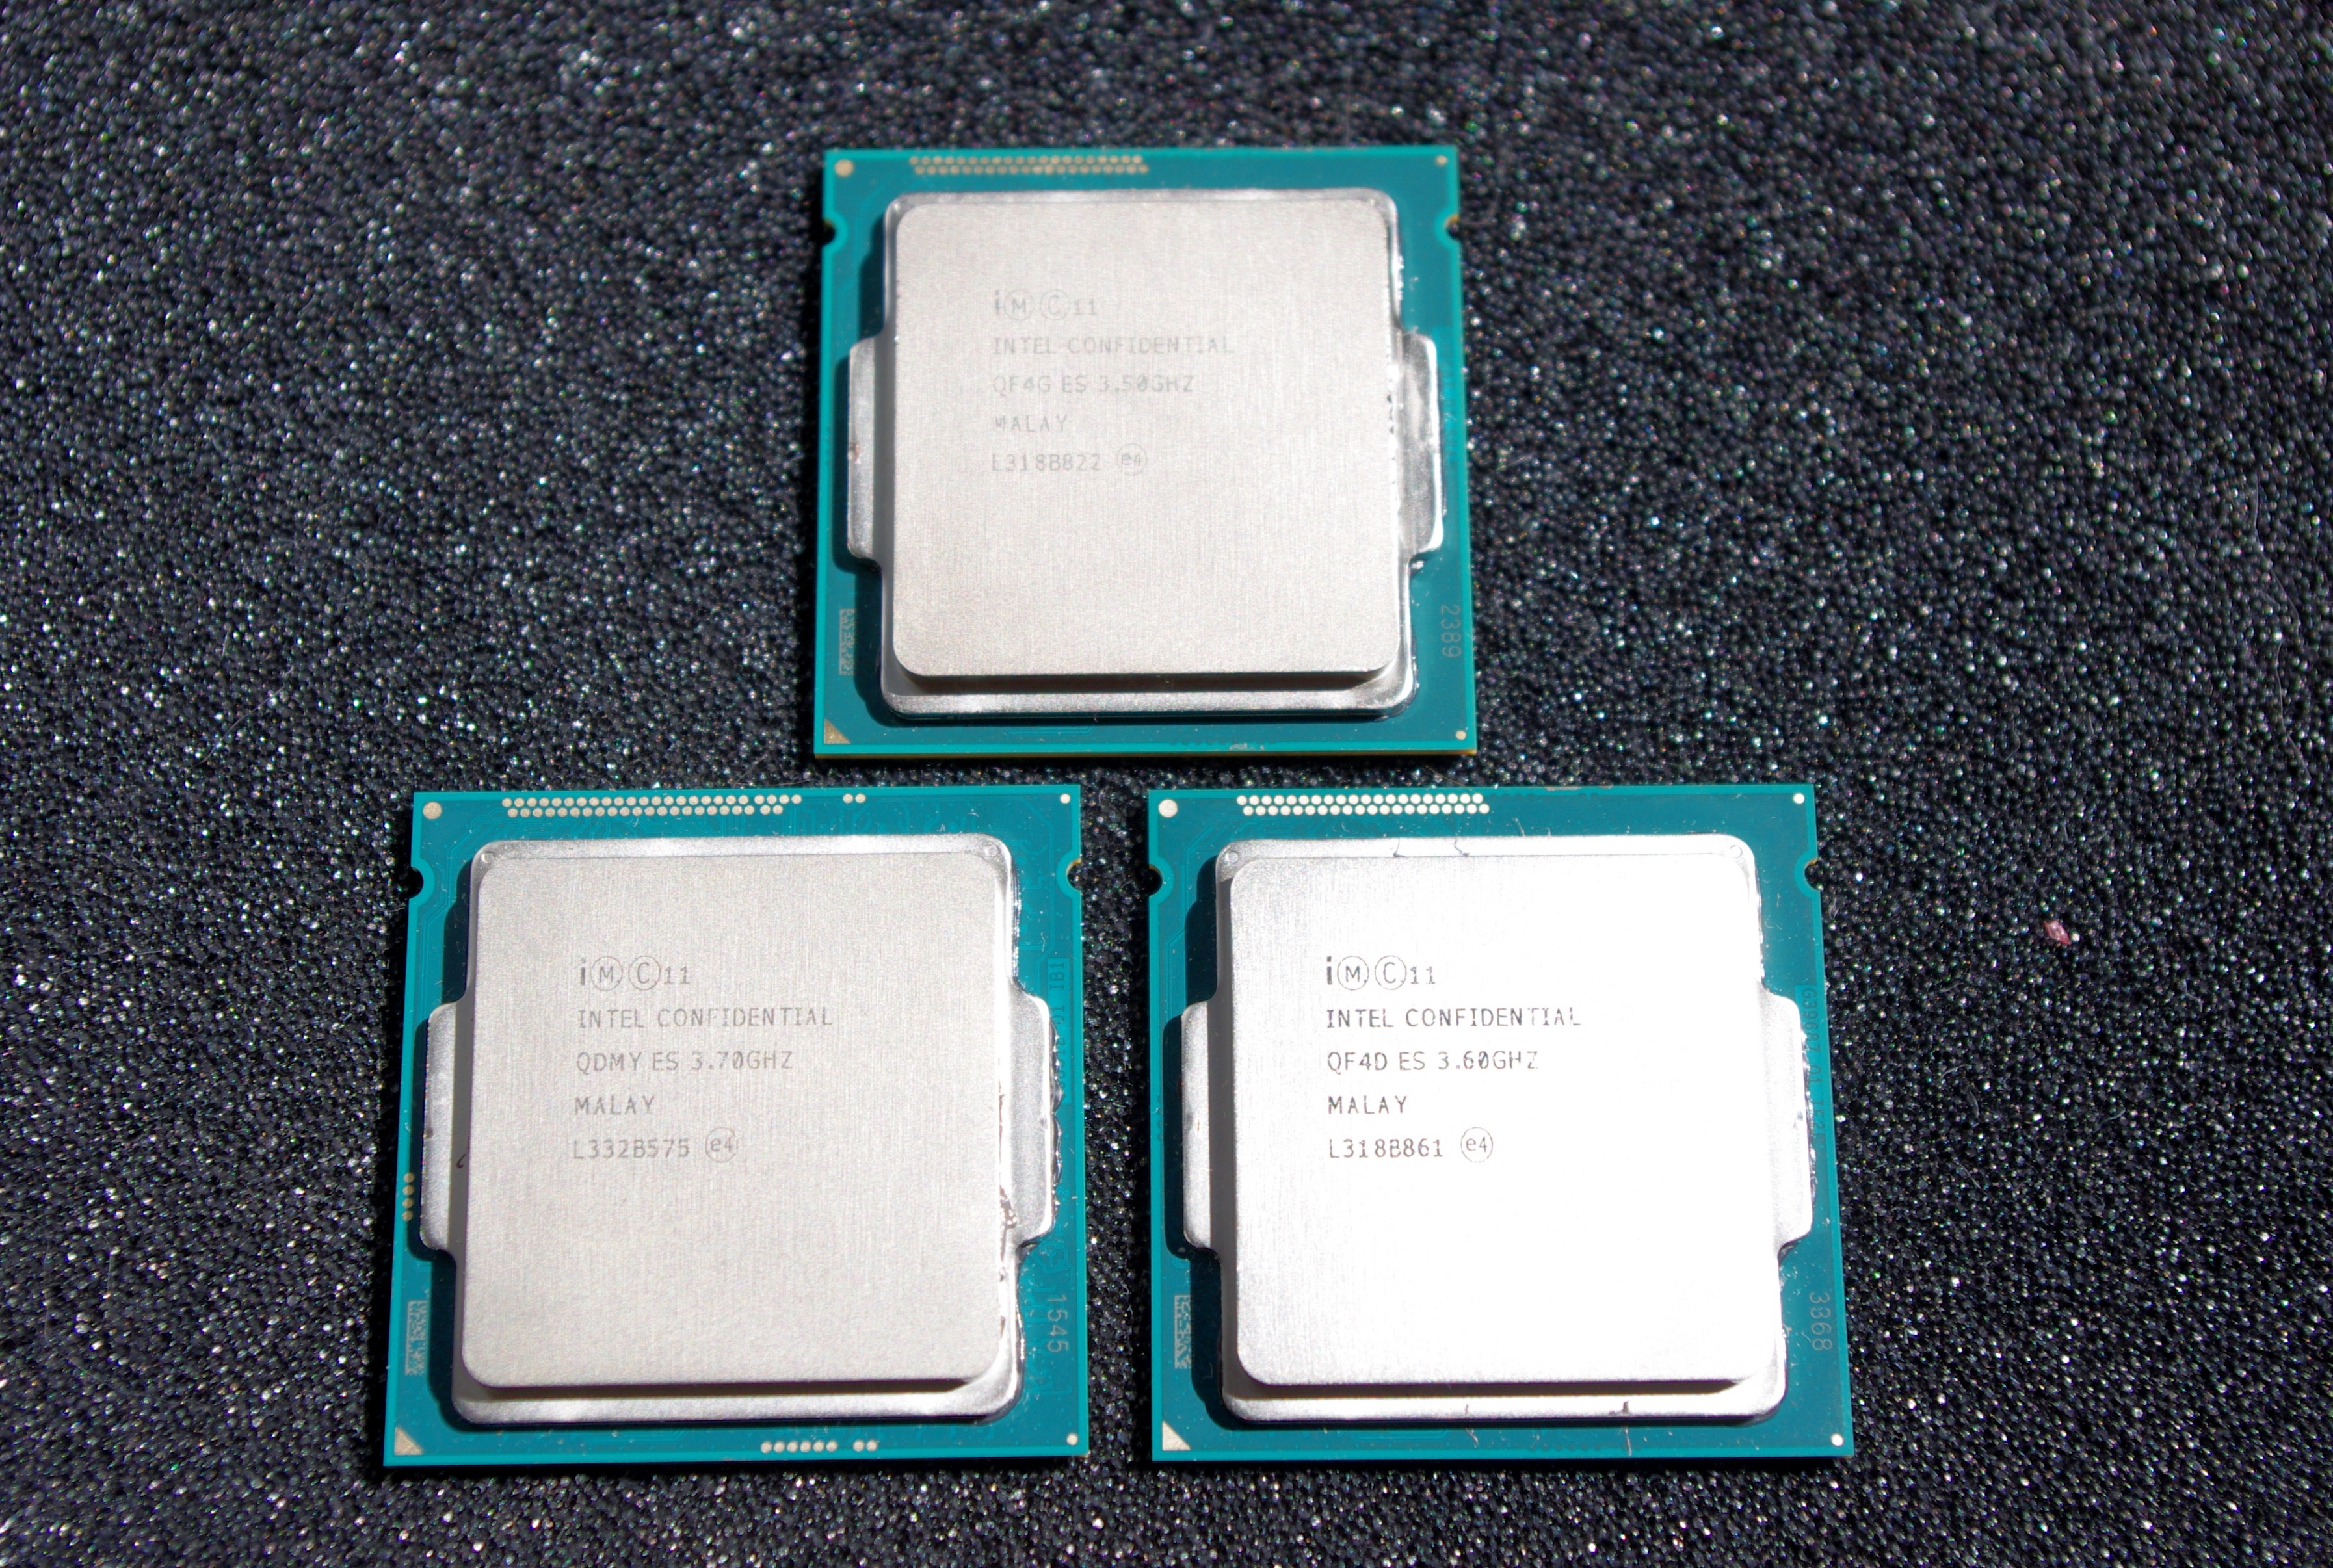
| Processor |
Intel Core i7-4790 ES (4C/8T, 3.6 GHz to 4.0 GHz) Intel Core i5-4690 ES (4C/4T, 3.5 GHz to 3.9 GHz) Intel Core i3-4360 ES (2C/4T, 3.7 GHz) |
| Motherboards |
ASRock Z97 Extreme6 ASUS Z97-Deluxe |
| Cooling |
Corsair H80i Thermalright TRUE Copper |
| Power Supply |
OCZ 1250W Gold ZX Series Corsair AX1200i Platinum PSU |
| Memory |
G.Skill RipjawsZ 4x4 GB DDR3-1866 8-9-9 Kit ADATA XPG 2x8 GB DDR3L-1600 9-11-9 Kit |
| Memory Settings | 1600 9-11-9-27 1T tRFC 240 |
| Video Cards |
MSI GTX 770 Lightning 2GB (1150/1202 Boost) ASUS HD7970 3GB (Reference) |
| Video Drivers |
Catalyst 13.12 WHQL NVIDIA Drivers 335.23 WHQL |
| Hard Drive | OCZ Vertex 3 256GB |
| Optical Drive | LG GH22NS50 |
| Case | Open Test Bed |
| Operating System | Windows 7 64-bit SP1 |
Following recent reviews, we have added several new benchmarks to our testing, including SYSMark and Unity-based testing methodology. At present we have only tested a few CPUs on these new benchmarks.
Power Consumption
For our power consumption tests, we take the system as a whole with a GTX 770 installed and test at idle, long idle (monitor turned off by the OS) and OCCT (artificial CPU load). We use the same PSU to keep efficiency on the same scale, although some of the data points are sub-20% efficienct for our power supply. This means that arbitrarily the qualitative comparison is more important than the quantitative comparison. Also of note is the Z97 motherboard we used for these tests implements an Adaptive voltage profile, meaning that artificial loads such as OCCT push the voltage higher than normal, increasing power consumption at load. Nevertheless the order of the results indicates a pattern from low power to high power.
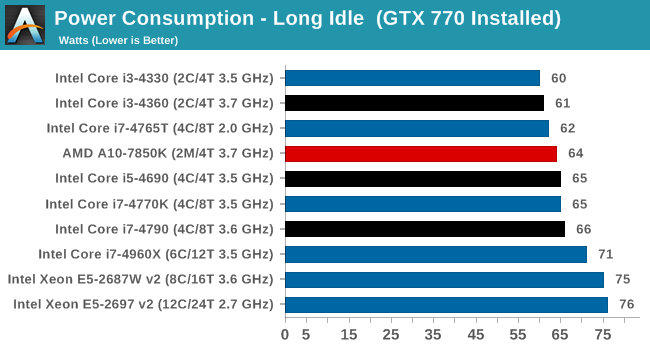
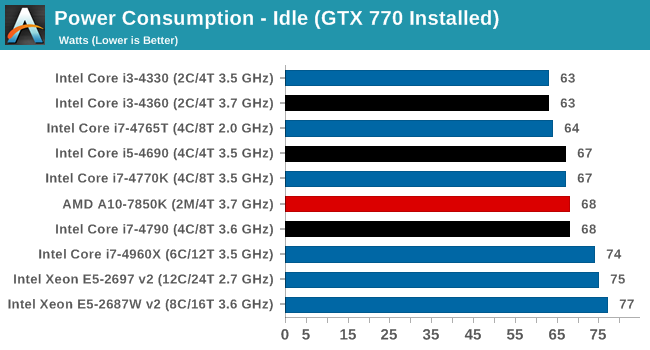
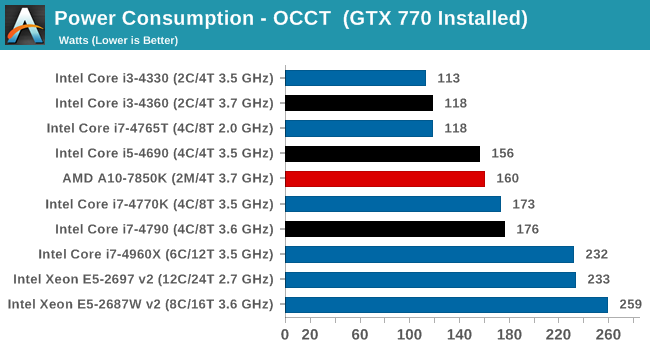
As expected, the 84W i7-4790 requires the most power, similar to the i7-4770K and i5-4690 that are also 84W.
Real World Benchmarks
2D to 3D Rendering –Agisoft PhotoScan v1.0: link
Agisoft Photoscan creates 3D models from 2D images, a process which is very computationally expensive. The algorithm is split into four distinct phases, and different phases of the model reconstruction require either fast memory, fast IPC, more cores, or even OpenCL compute devices to hand. Agisoft supplied us with a special version of the software to script the process, where we take 50 images of a stately home and convert it into a medium quality model. This benchmark typically takes around 15-20 minutes on a high end PC on the CPU alone, with GPUs reducing the time.
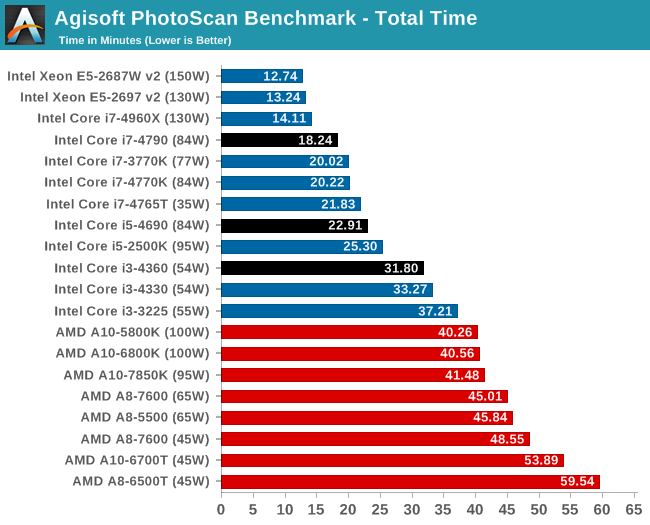
For Photoscan we see the incremental speedup with the i3 models, but the increased single thread speed of the i7 makes more of a difference.
Compression – WinRAR 5.0.1: link
Our WinRAR test from 2013 is updated to the latest version of WinRAR at the start of 2014. We compress a set of 2867 files across 320 folders totaling 1.52 GB in size – 95% of these files are small typical website files, and the rest (90% of the size) are small 30 second 720p videos.
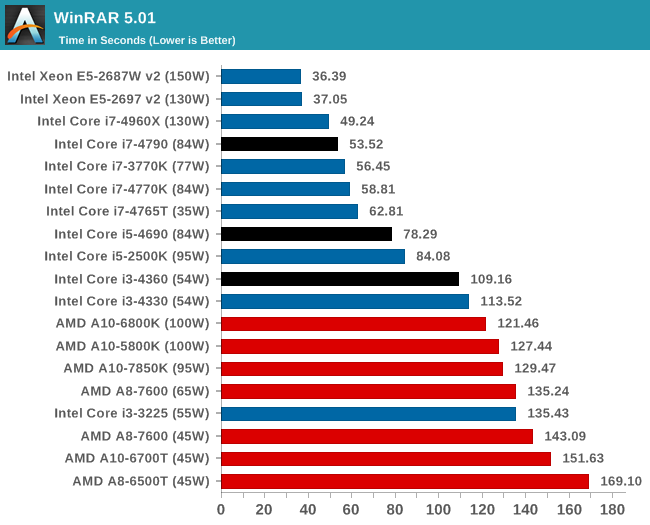
For WinRAR, the increase in the threads makes the most difference here, moving from i5-4690 to i7-4675T.
Image Manipulation – FastStone Image Viewer 4.9: link
Similarly to WinRAR, the FastStone test us updated for 2014 to the latest version. FastStone is the program I use to perform quick or bulk actions on images, such as resizing, adjusting for color and cropping. In our test we take a series of 170 images in various sizes and formats and convert them all into 640x480 .gif files, maintaining the aspect ratio. FastStone does not use multithreading for this test, and thus single threaded performance is often the winner.
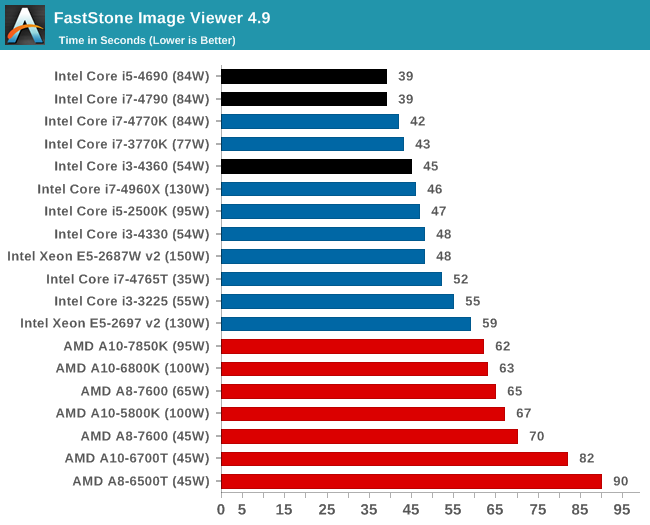
FastStone is all about the single thread speed.
Video Conversion – Xilisoft Video Converter 7: link
The XVC test I normally do is updated to the full version of the software, and this time a different test as well. Here we take two different videos: a double UHD (3840x4320) clip of 10 minutes and a 640x266 DVD rip of a 2h20 film and convert both to iPod suitable formats. The reasoning here is simple – when frames are small enough to fit into memory, the algorithm has more chance to apply work between threads and process the video quicker. Results shown are in seconds and time taken to encode.
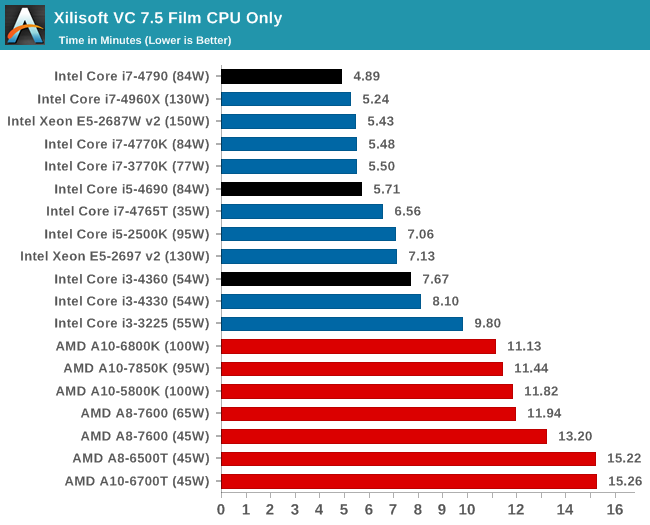
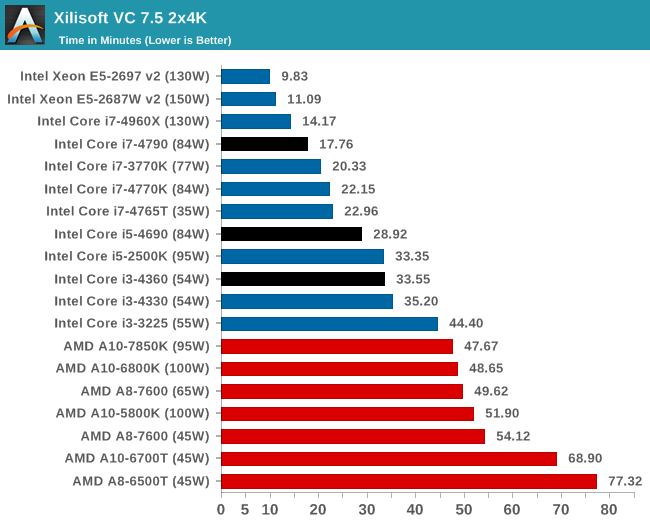
Small frames prefer more single thread MHz, whereas the dual 4K frame conversion prefers threads.
Video Conversion – Handbrake v0.9.9: link
Handbrake is a media conversion tool that was initially designed to help DVD ISOs and Video CDs into more common video formats. The principle today is still the same, primarily as an output for H.264 + AAC/MP3 audio within an MKV container. In our test we use the same videos as in the Xilisoft test, and results are given in frames per second.
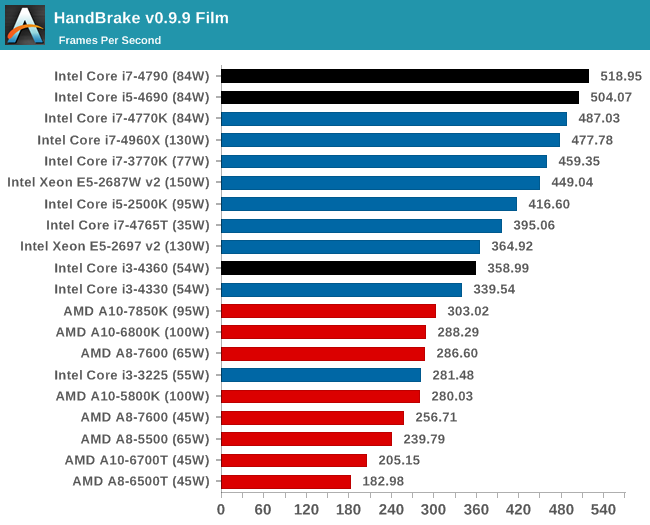
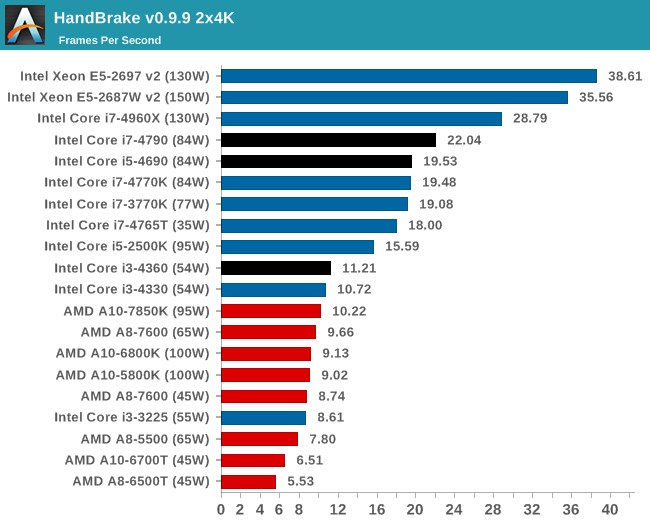
With Handbrake it would seem that it prefers actual cores rather than hyperthreading, given by the i5 and i7 being relatively close and 2x the i3.
SYSMark and Scientific Benchmarks
SYSmark 2014
SYSmark is developed by BAPCo, the Business Applications Performance Corporation, which includes in its current members Intel, Dell, Lenovo, Microsoft, Samsung, Sony, and Toshiba. The latest version of SYSmark, SYSmark 2014, uses the latest software packages from Adobe and Microsoft and meshes them together into a stringent testing package that can take a couple of hours to run. The end result gives marks for in office productivity, media creation and data/financial analysis sections as well as an overall result. SYSmark uses a standard office computer (an i3-4130 with a 500GB mechanical drive, 4GB DRAM, 1080p, integrated HD4400 graphics) to provide a benchmark score of ‘1000’, and all results are compared to this. Our testing runs the processors at 1080p with integrated graphics on an OCZ Vertex 3 240GB SSD.
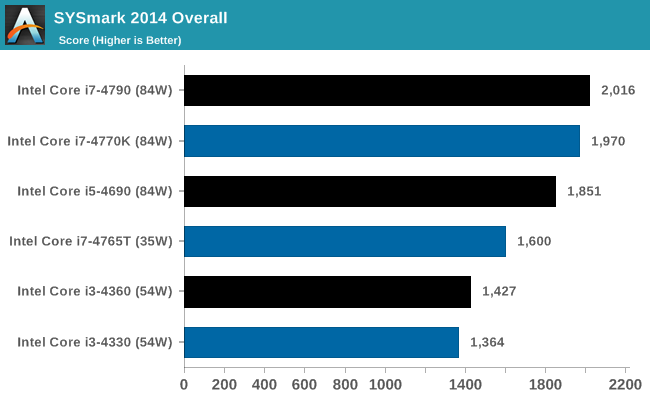
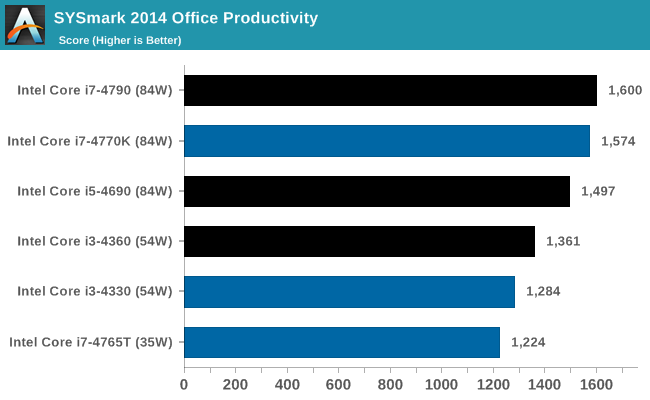
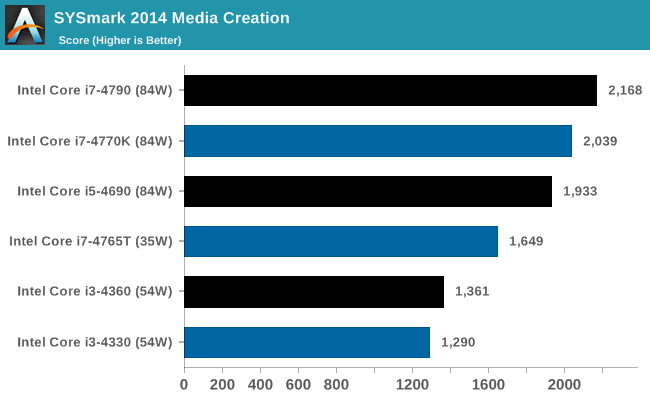
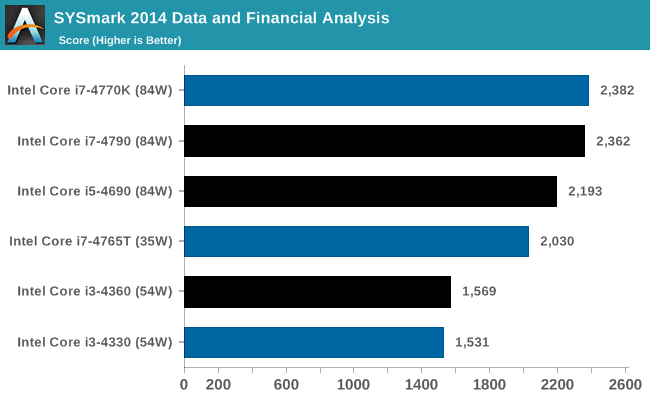
As we have not tested SYSmark 2014 with other CPUs yet, our results are rather limited, however the overall results are in line with what we would expect.
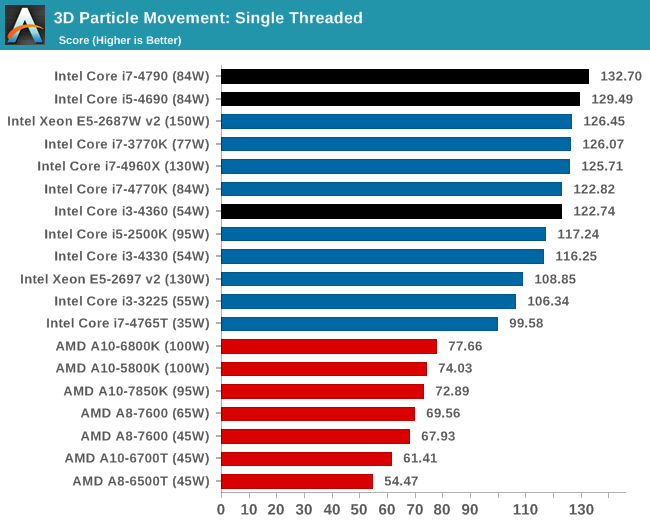
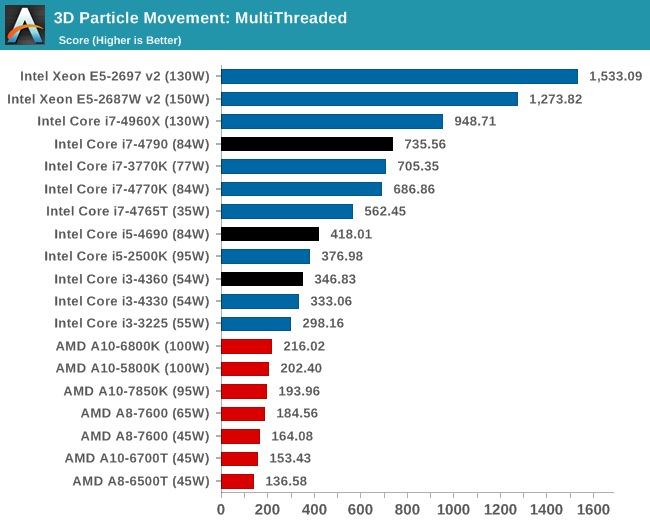
Point Calculations – 3D Movement Algorithm Test: link
3DPM is a self-penned benchmark, taking basic 3D movement algorithms used in Brownian Motion simulations and testing them for speed. High floating point performance, MHz and IPC wins in the single thread version, whereas the multithread version has to handle the threads and loves more cores.
CPU Synthetic Benchmarks
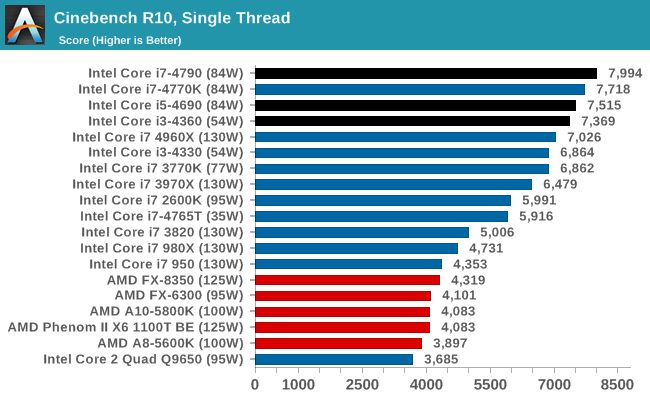
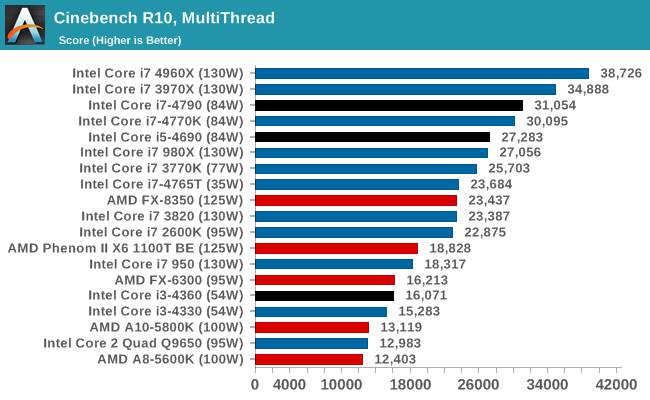
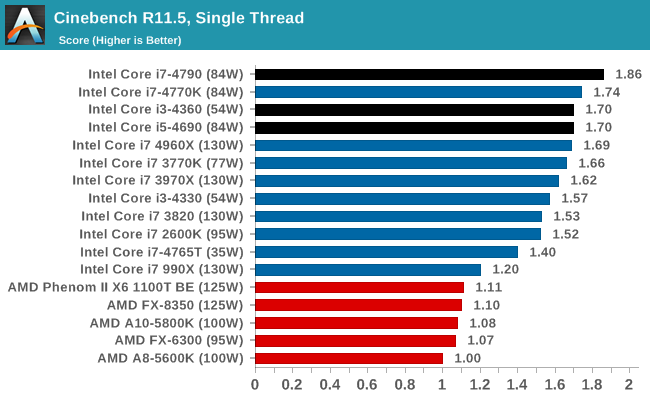
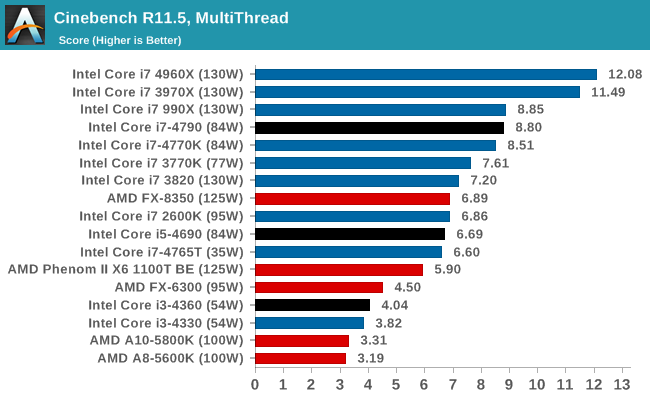
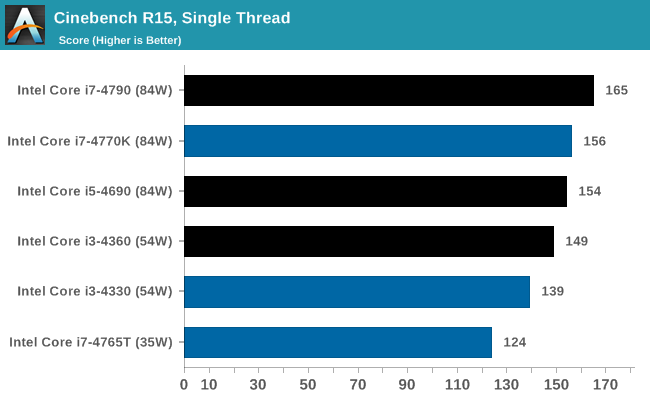
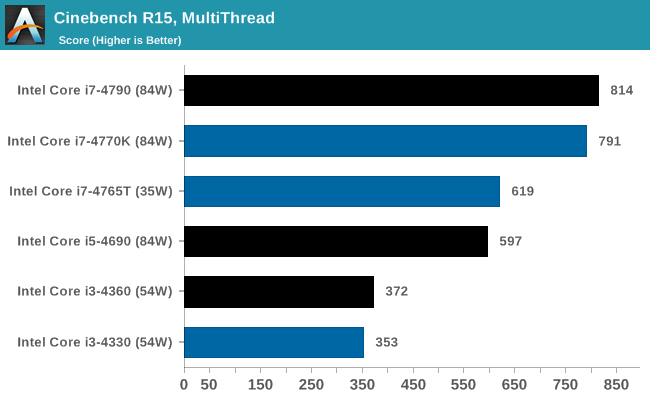
Content Creation - Cinebench
Based on MAXON’s CINEMA 4D animation software, Cinebench is used to determine the CPU and graphics performance via OpenGL. The software has gone through many iterations over the years, and here we use versions 10, 11.5 and 15 to compare single-threaded and multi-threaded CPU performance. As the generations increase, the software becomes more multithread aware and scales better, however for consistency with older results we keep the version 10 results in our database.
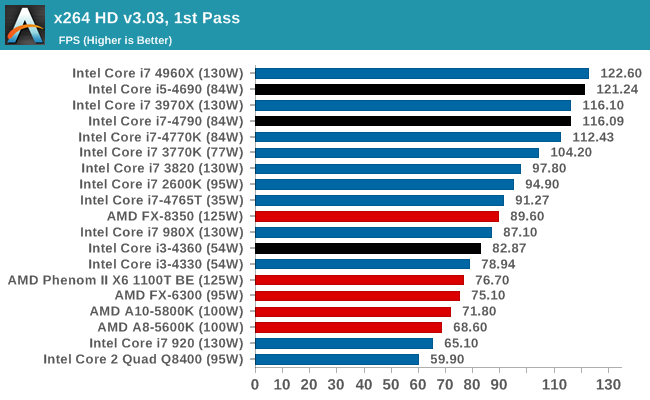
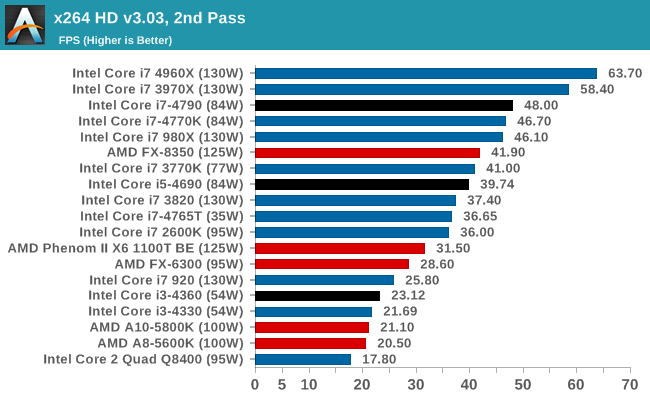
Video Conversion - x264 HD 3.03 Benchmark
Graysky's x264 HD test uses x264 to encode a 4Mbps 720p MPEG-2 source. The focus here is on quality rather than speed, thus the benchmark uses a 2-pass encode and reports the average frame rate in each pass.
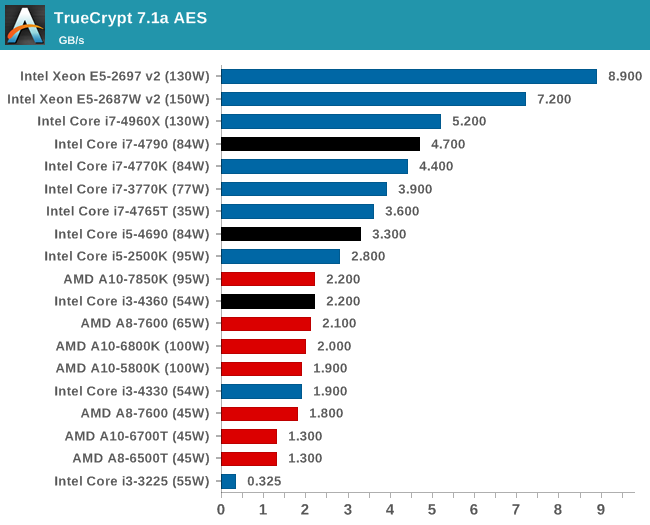
Encryption –TrueCrypt v0.7.1a: link
TrueCrypt is an off the shelf open source encryption tool for files and folders. For our test we run the benchmark mode using a 1GB buffer and take the mean result from AES encryption.
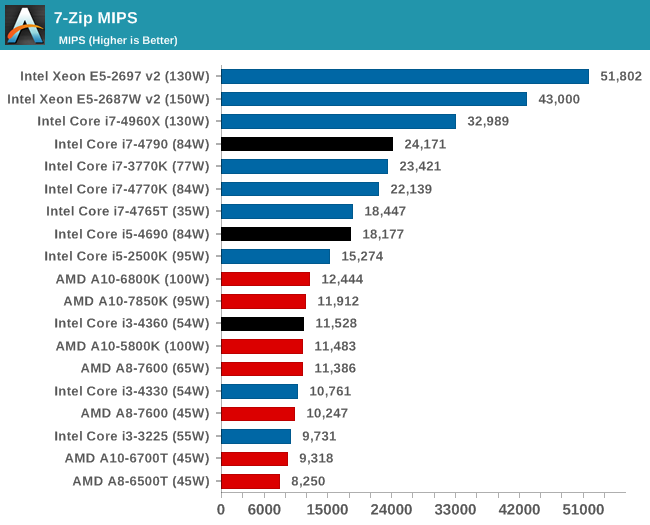
Synthetic – 7-Zip 9.2: link
As an open source compression tool, 7-Zip is a popular tool for making sets of files easier to handle and transfer. The software offers up its own benchmark, to which we report the result.
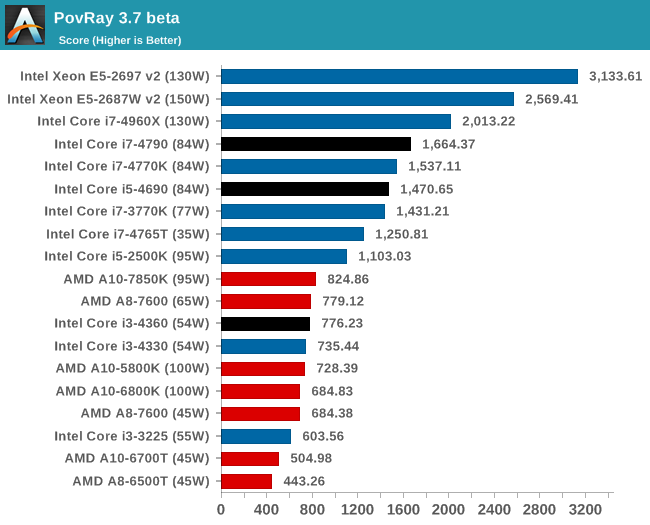
Rendering – PovRay 3.7: link
The Persistence of Vision RayTracer, or PovRay, is a freeware package for as the name suggests, ray tracing. It is a pure renderer, rather than modeling software, but the latest beta version contains a handy benchmark for stressing all processing threads on a platform. We have been using this test in motherboard reviews to test memory stability at various CPU speeds to good effect – if it passes the test, the IMC in the CPU is stable for a given CPU speed. As a CPU test, it runs for approximately 2-3 minutes on high end platforms.
Console Emulation –Dolphin Benchmark: link
At the start of 2014 I was emailed with a link to a new emulation benchmark based on the Dolphin Emulator. The issue with emulators tends to be two-fold: game licensing and raw CPU power required for the emulation. As a result, many emulators are often bound by single thread CPU performance, and general reports tended to suggest that Haswell provided a significant post to emulator performance. This benchmark runs a Wii program that raytraces a complex 3D scene inside the Dolphin Wii emulator. Performance on this benchmark is a good proxy of the speed of Dolphin CPU emulation, which is an intensive single core task using most aspects of a CPU. Results are given in minutes, where the Wii itself scores 17.53; meaning that anything above this is faster than an actual Wii for processing Wii code, albeit emulated.
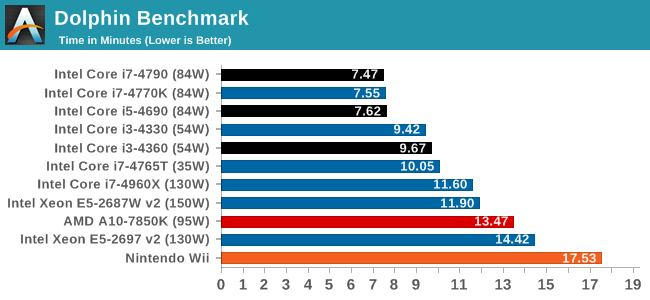
Dolphin relies very much on architecture as well as CPU single thread speed. It would also stand to reason that there is a small about of thread switching going on, given how far off the i3 and i7-4765T CPUs are.
Web Benchmarks
With certain classes of CPUs, using the IGP for web-based activities (such as those heavy in Javascript and HTML 5 elements) can be comparable to the higher end smartphone and tablet implementations. These tests help to emulate large, real-world web applications running inside mobile browsers. To this extent we use the following tests to compare the lower powered mobile devices through to the higher end desktop market.
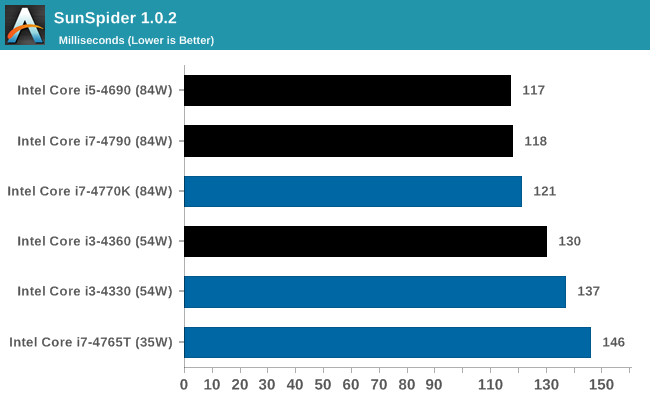
SunSpider 1.0.2: link
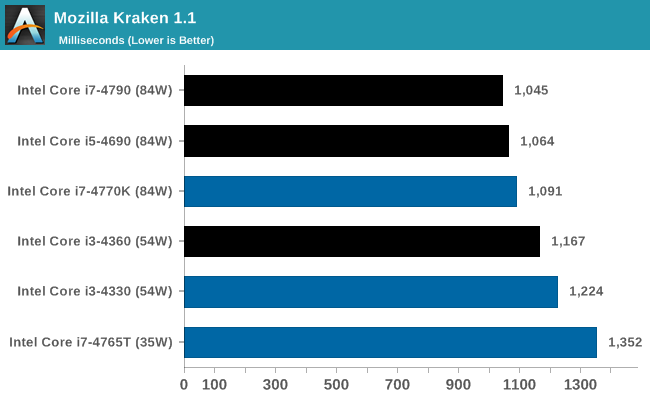
Mozilla Kraken 1.1: link
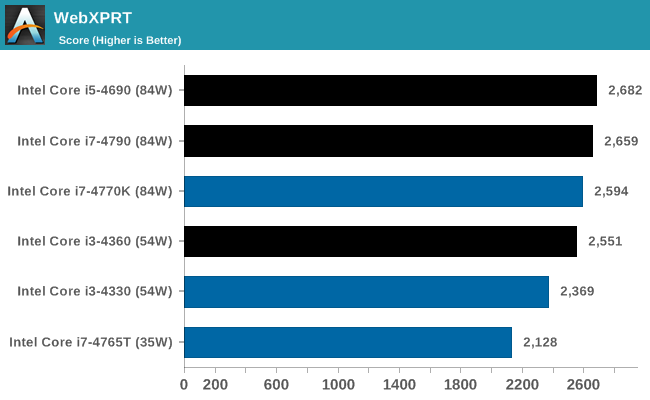
PT WebXPRT 2013: link
Google Octane 2: link
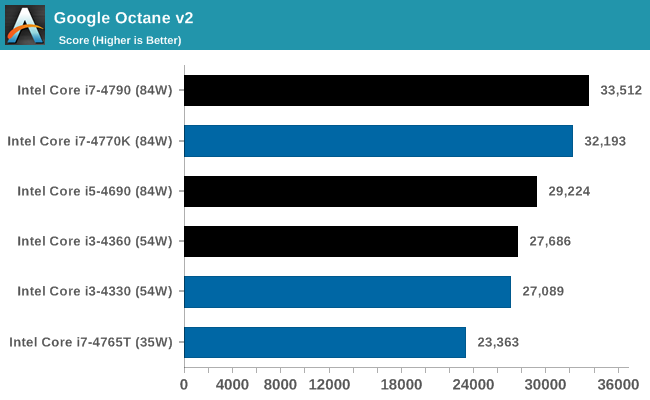
It would seem all of the web based benchmarks love CPU speed, and Octane responds well to having more threads available.
Gaming on Integrated Graphics
For our integrated graphics testing, we use most of the same gaming tests as our discrete gaming range, but at a lower resolution and quality settings (1280x1024, Low) in order to find a reasonable frame rate. Results are given in terms of average and minimum FPS reported. Each of the three CPUs in our test use GT2 / HD 4600 graphics and the same frequencies, meaning that the only difference is clock speeds and threads available. As a result, this should show us how relevant more cores and more threads are for Intel IGP gaming.
F1 2013
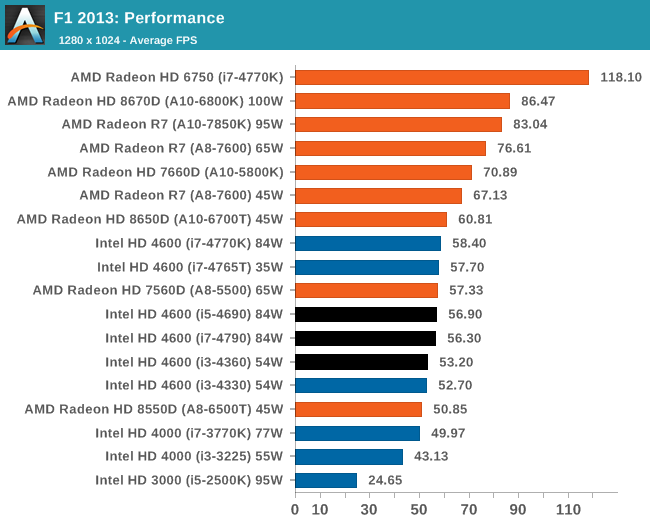
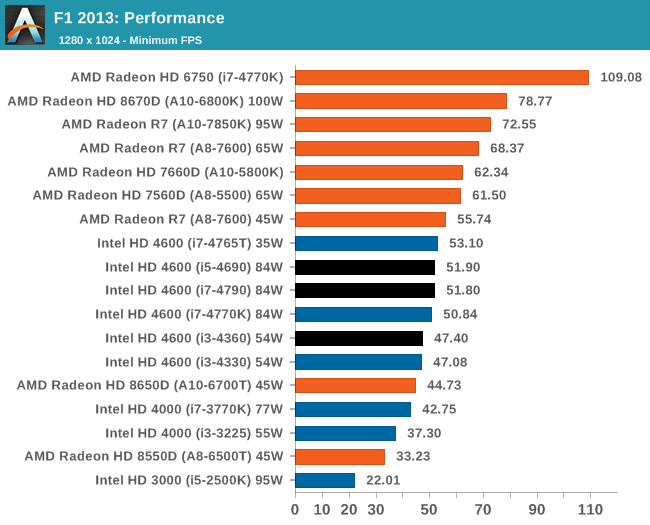
The HD 4600 at 1200 MHz falls just short of 60 FPS average on F1 2013, and moving up from the i3 seems to offer a 6% increase in minimum frame rates.
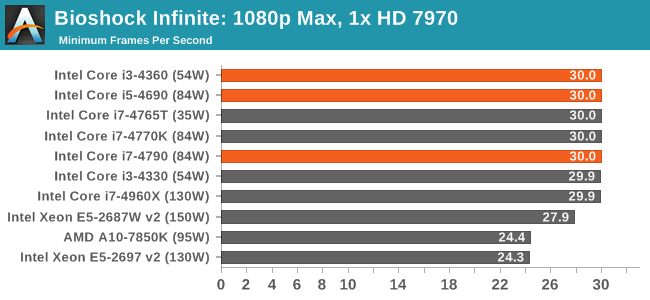
Bioshock Infinite
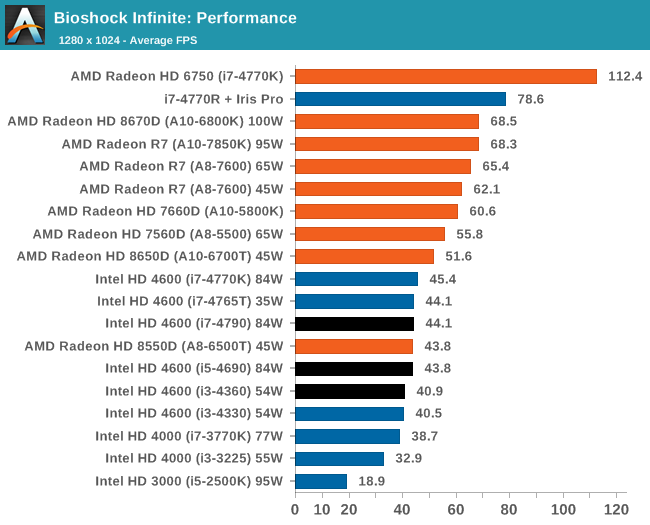
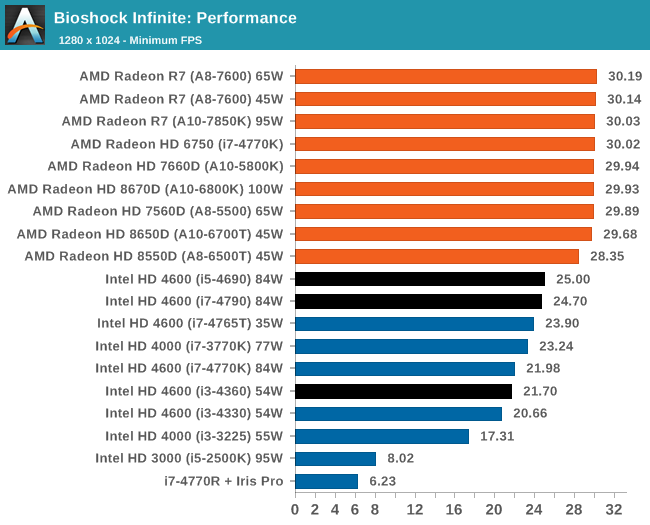
Bioshock Infinite seems memory bound a little, given how good Iris Pro is compared to the HD 4600 scores. There is almost a 10% jump from i3 to i5 here on average FPS and almost 20% in minimum FPS.
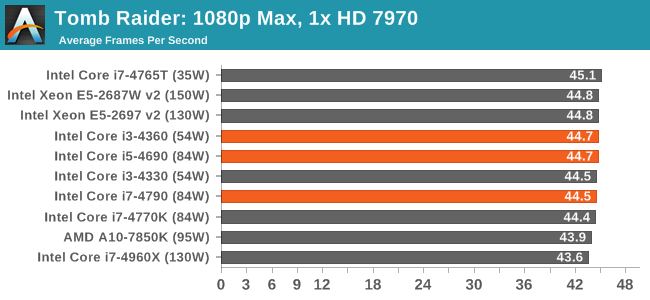
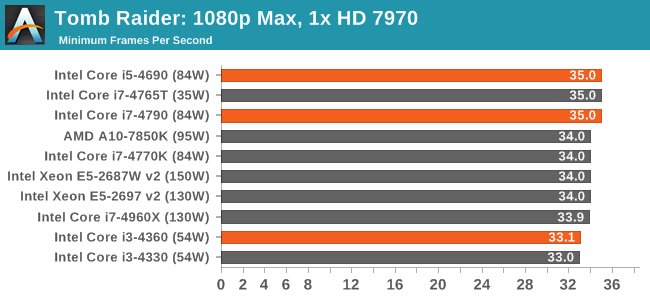
Tomb Raider
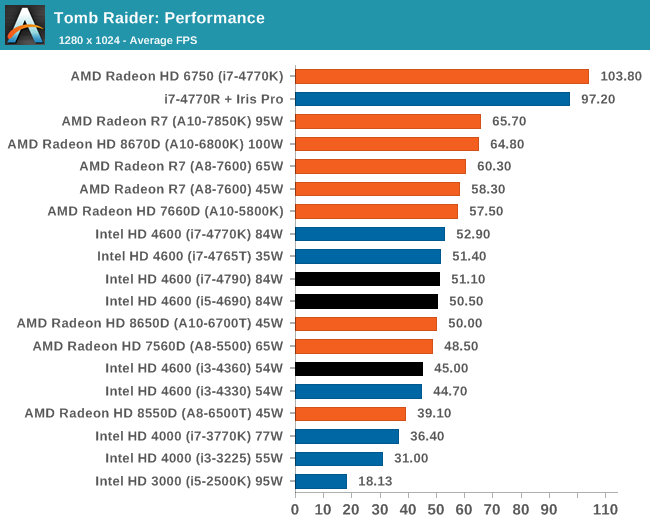
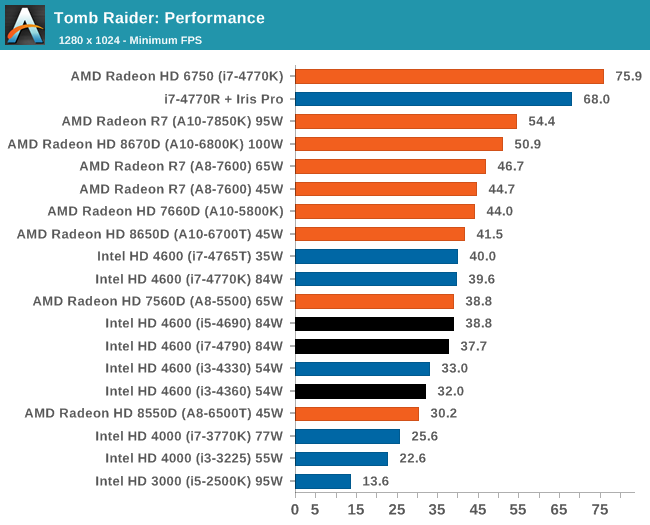
Tomb Raider with discrete GPUs is characteristally CPU agnostic, however moving from an i3 to an i5 gives and extra 5.5 FPS on average in our test.
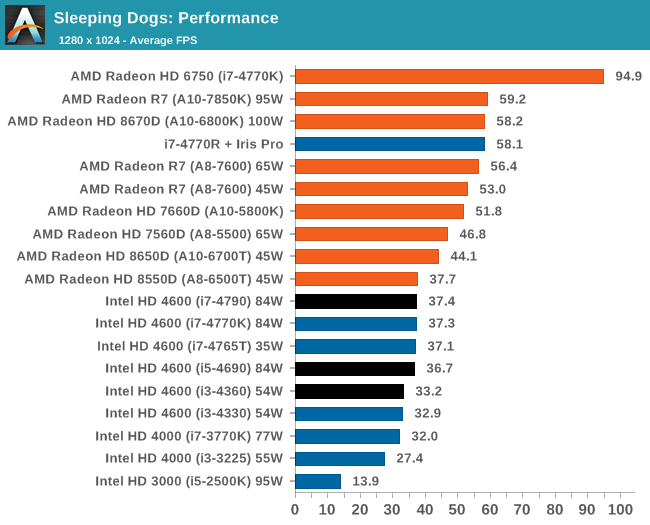
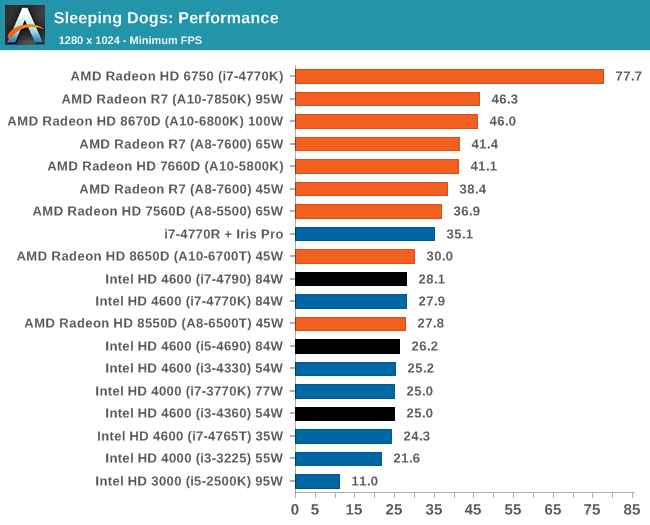
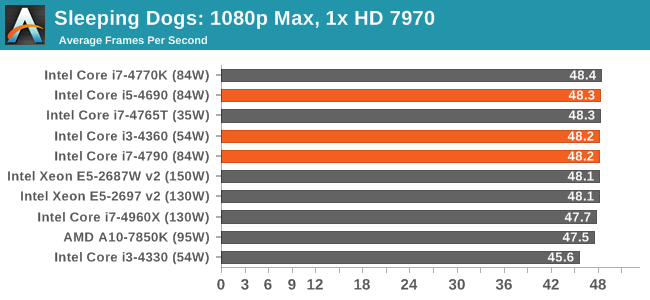
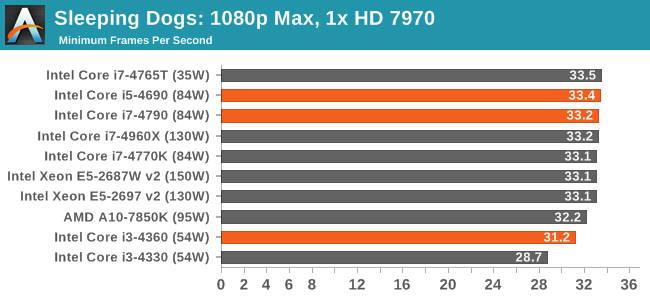
Sleeping Dogs
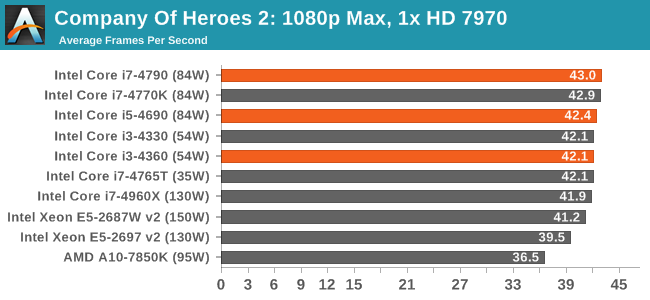
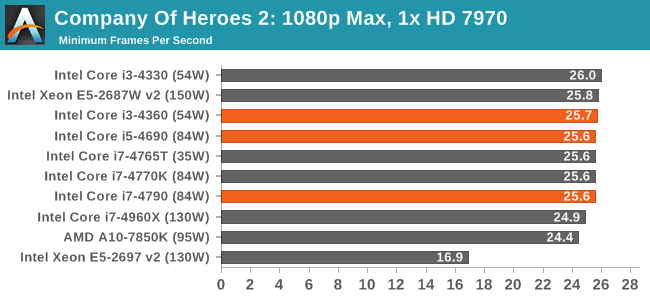
Company of Heroes 2
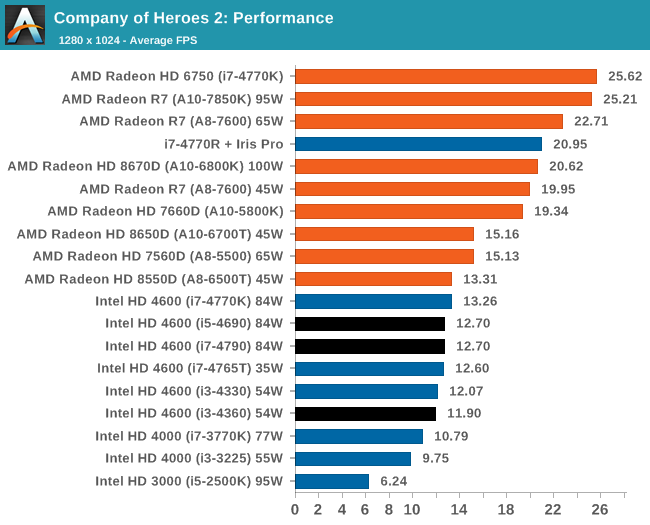
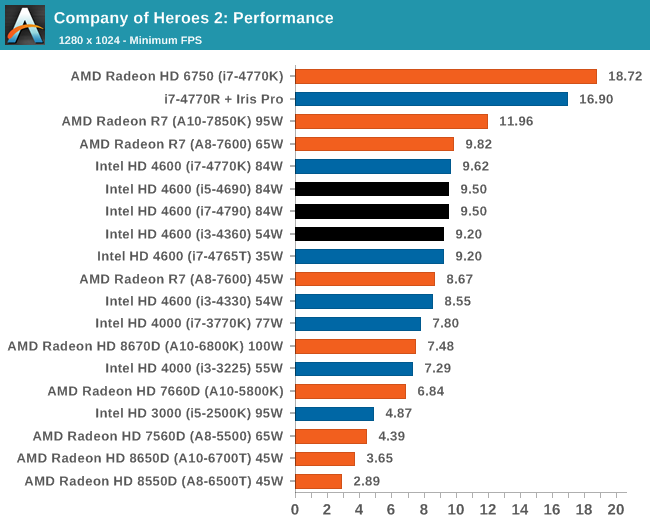
No IGP solution is that well prepared for COH2, although some AMD CPUs and Iris Pro do hit above 20 FPS. We may have to wait another generation to make it more playable and hit 30 FPS at our resolution settings.
Synthetic IGP Benchmarks
OpenCL – CompuBench: link
CompuBench is an OpenCL and RenderScript benchmark designed by Kishonti for both CPUs and any GPGPU capable device. While it offers almost two dozen tests, we select the more real-world tests in terms of fluid simulation and image analysis benchmarks and test on the CPU and IGP respectively. The CPU results are earlier in the review, and the IGP results are below.
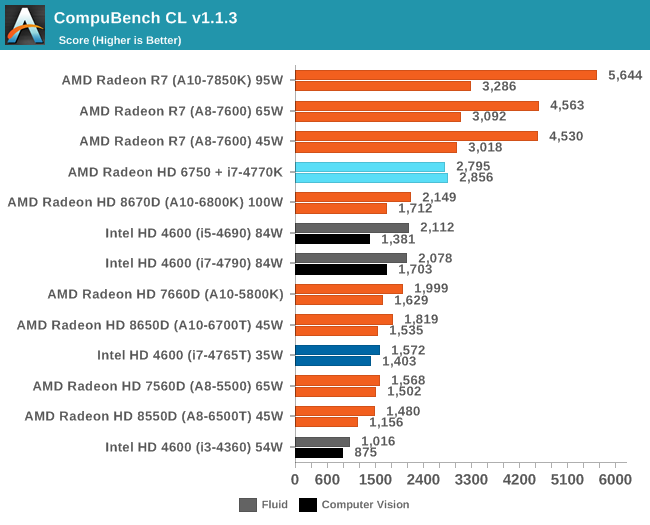
CompuBench responds well to actual cores, but not so much to threads, given by the close scores of the i5 and i7 CPUs. AMD still wins here.
Unity – Graphic Scene 720p: link
As part of my IGP testing I went searching for a couple of new Unity based benchmarks to help decipher the line between the desktop graphics solutions and those that are not so great. First up is a graphical humdinger, implementing a complex scene with lighting effects (including fluid simulation, shadows, SSAO, Bloom). We run the benchmark at 720p with the highest graphical settings, reporting the average FPS.
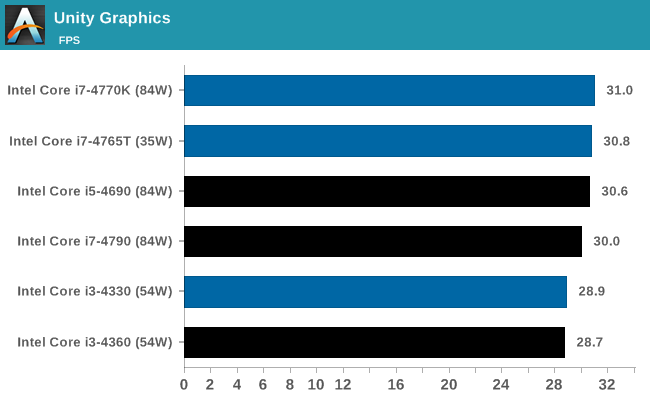
The HD 4600 seems relatively CPU agnostic for complex graphics in Unity. More GPU power seems needed.
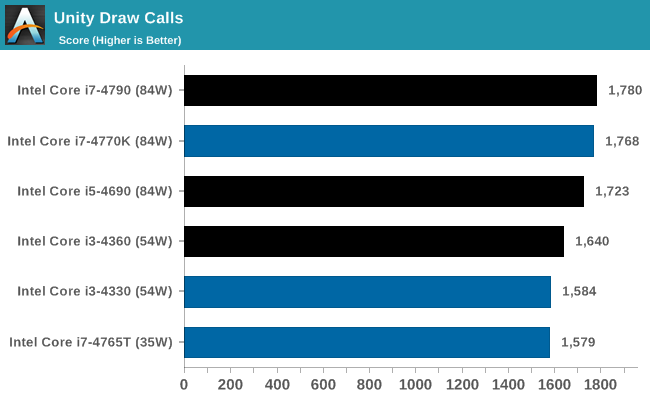
Unity – Draw Calls: link
Next up is a benchmark limited by draw calls rather than rendering complexity. The scene generates simple Nintendo Gamecube polygons that fall due to gravity and bounce around until stationary. The scene continuously spews out these polygons until three consecutive frames fall under a 20 FPS average. We run the benchmark at 720p at simple graphic settings to minimize the graphical complexity, take the number of consoles that spawn from each run and average over several runs.
3DMark
The synthetic tools from Futuremark have been on the benchmarking landscape for over a decade, with each generation designed to tackle new problems as either the CPUs or GPUs become too powerful. Here we test 3DMark 06, 3DMark 11 (Performance) and the latest 3DMark.
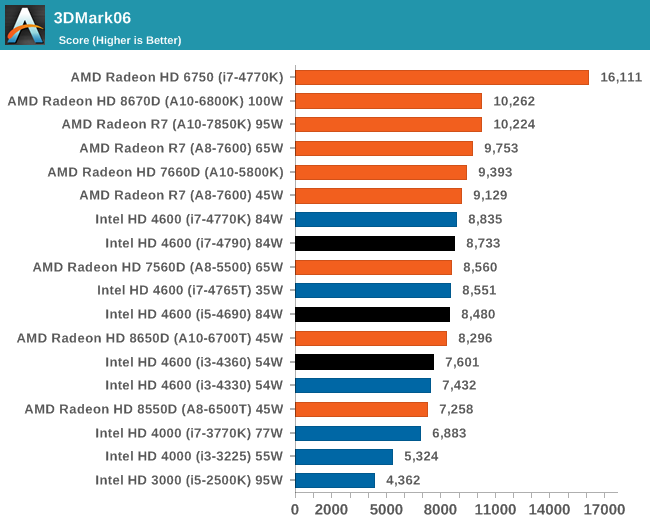
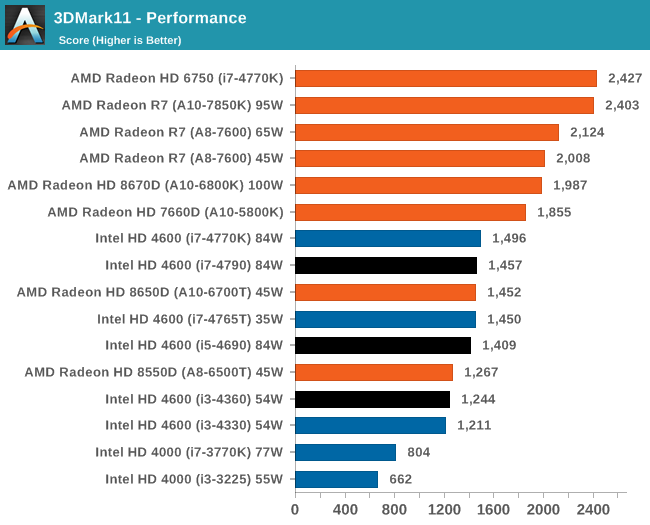
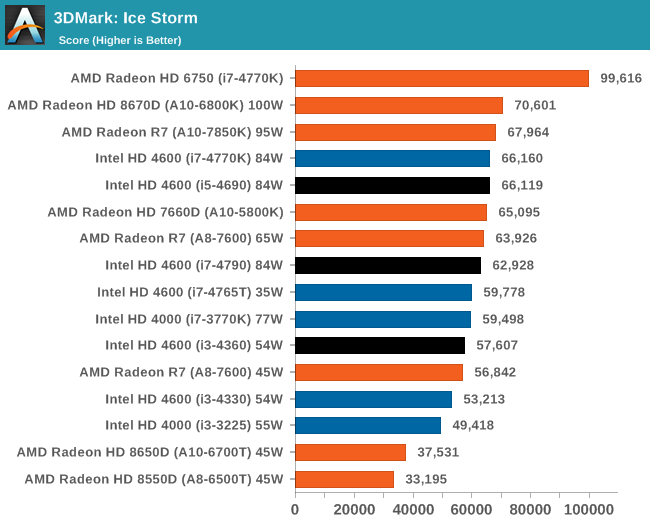
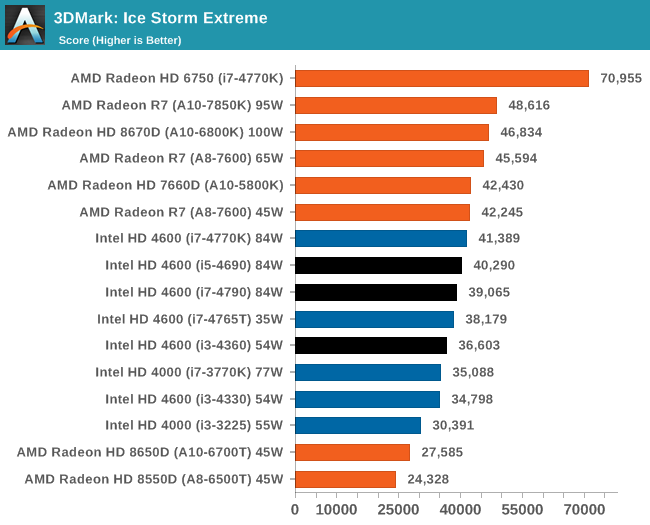
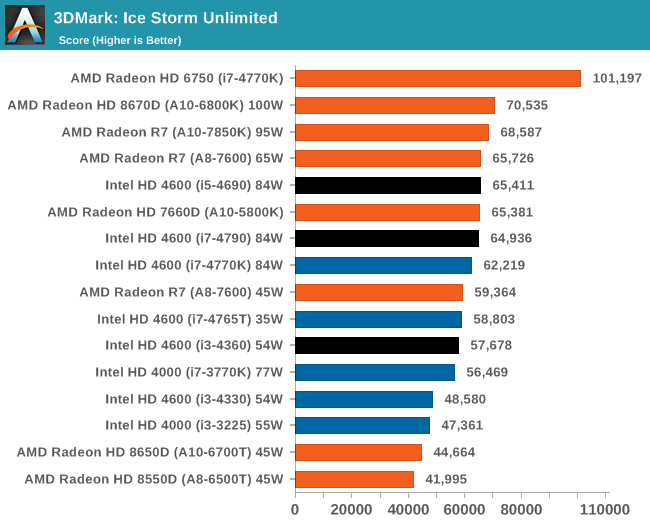
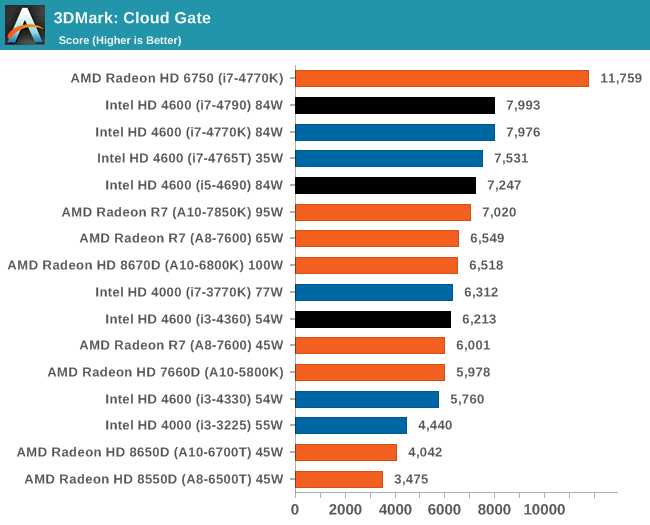
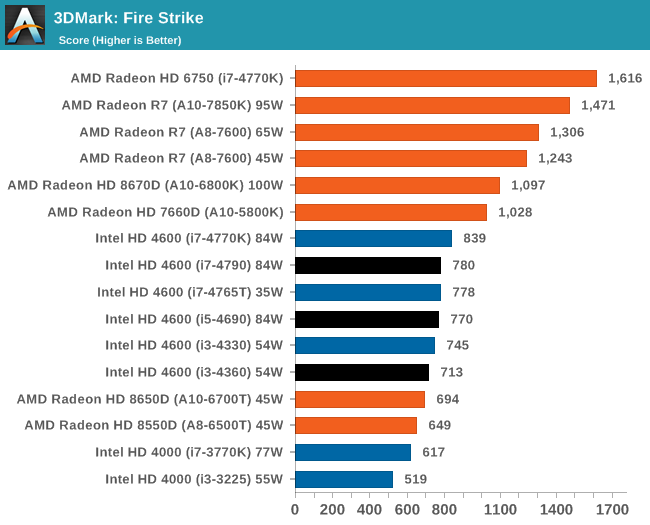
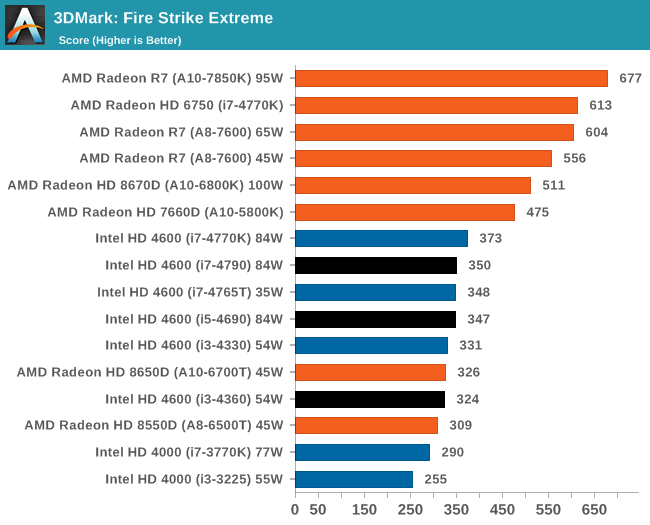
For CPU limited testing, such as Cloud Gate, the Intel i7 pulls ahead with the i5 quickly in tow. For the others, AMD has the lead.
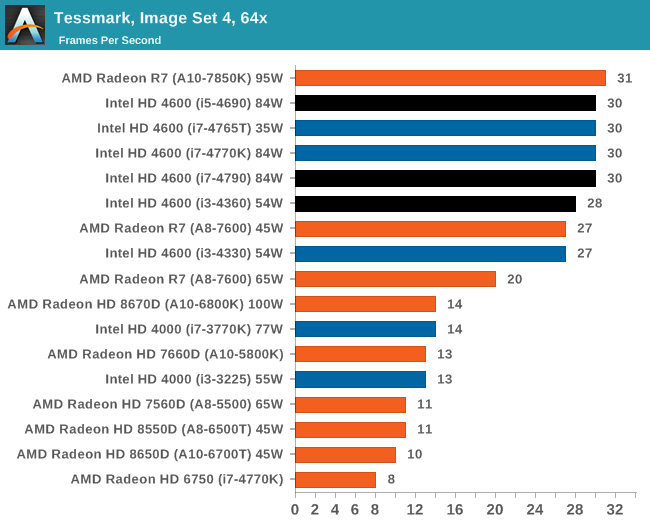
Tessmark
The latest version of TessMark is designed to focus on tessellation via OpenGL 4. We run the latest version of the benchmark using the high resolution map set at maximum tessellation while 1080p full screen, reporting the average FPS.
For our discrete GPU benchmarks, we have split them up into the different GPU configurations we have tested. We have access to both MSI GTX 770 Lightning GPUs and ASUS reference HD 7970s, for SLI and Crossfire respectively. These tests are all run at 1080p and maximum settings, reporting the average and minimum frame rates.
dGPU Benchmarks: 1x MSI GTX770 Lightning
F1 2013
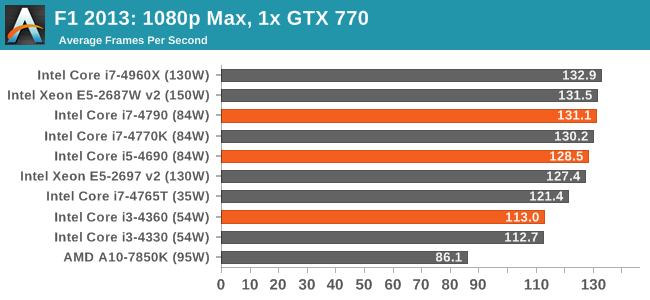
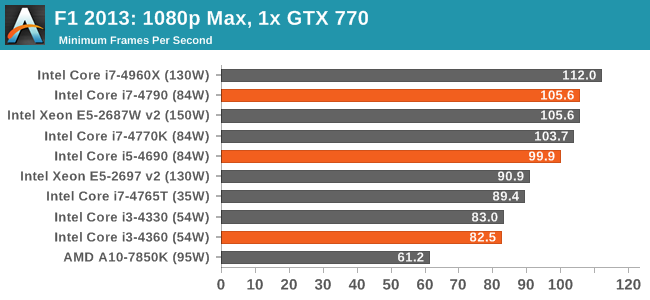
Using the i3 brings the frame rate down below 120 FPS average, with the minimum FPS up to 20% lower than the i5.
Bioshock Infinite
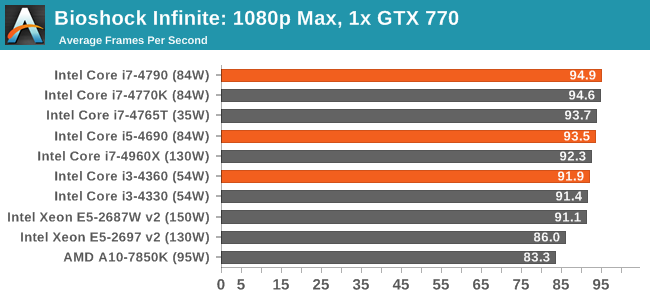
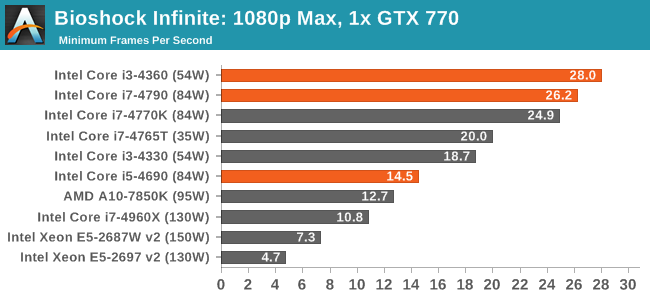
With Bioshock on single NVIDIA, it would seem that CPU power matters more in the minimum FPS values.
Tomb Raider
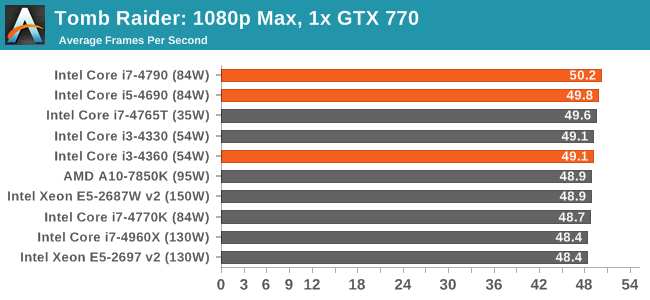
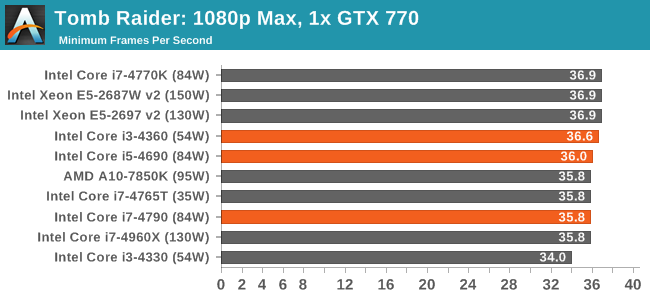
Tomb Raider is infamously CPU-agnostic, showing all CPUs hovering around or below 50 FPS average.
Sleeping Dogs
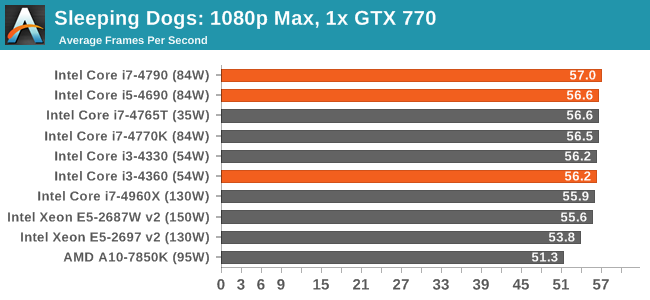
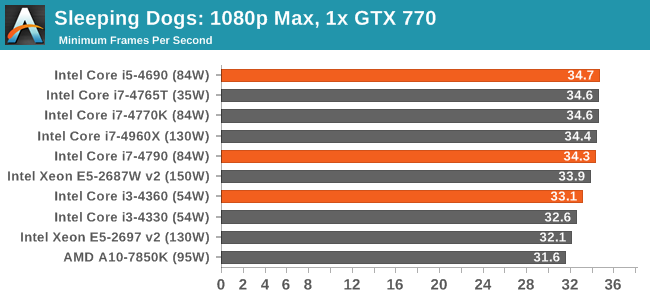
Similarly with Sleeping Dogs, it does not take much CPU power to hit peak FPS.
Company of Heroes 2
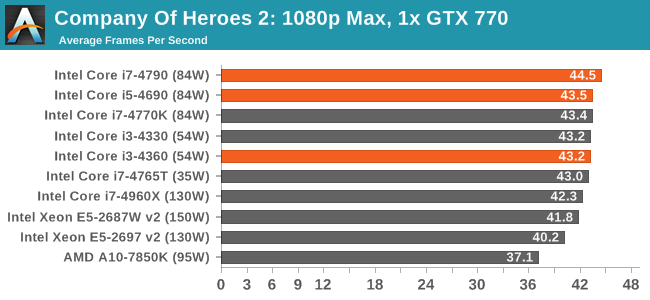
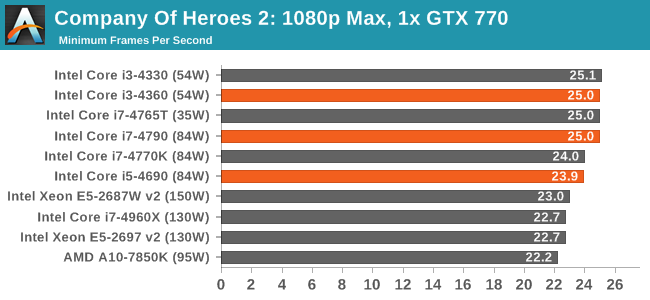
COH2 takes a strain on most graphics cards, but both average and minimum FPS are roughly the same for all three refresh CPUs.
Battlefield 4

For our discrete GPU benchmarks, we have split them up into the different GPU configurations we have tested. We have access to both MSI GTX 770 Lightning GPUs and ASUS reference HD 7970s, for SLI and Crossfire respectively. These tests are all run at 1080p and maximum settings, reporting the average and minimum frame rates.
dGPU Benchmarks: 2x MSI GTX770 Lightning
F1 2013
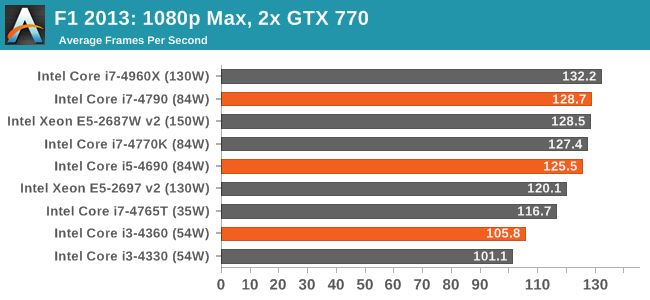
Despite the lack of scaling, moving to dual GPU puts a larger rift between the i3 and the other CPUs for average FPS in 2013.
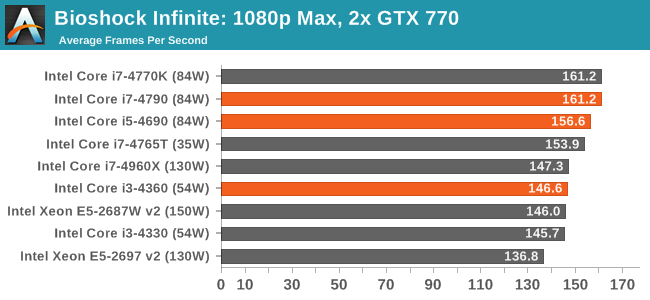
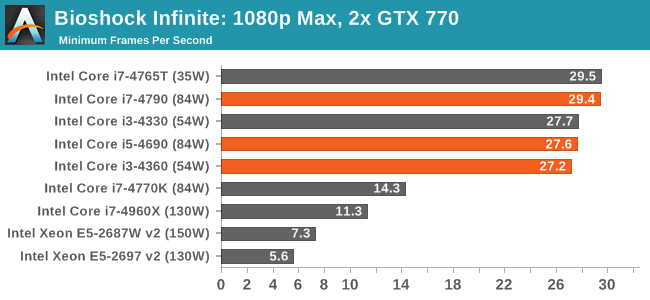
Bioshock Infinite
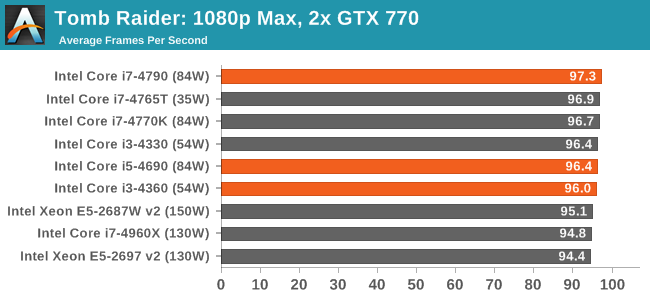
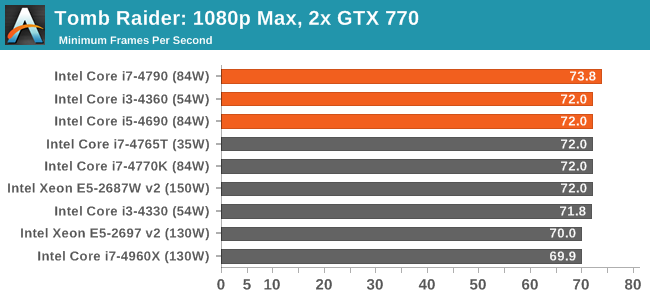
Tomb Raider
Sleeping Dogs
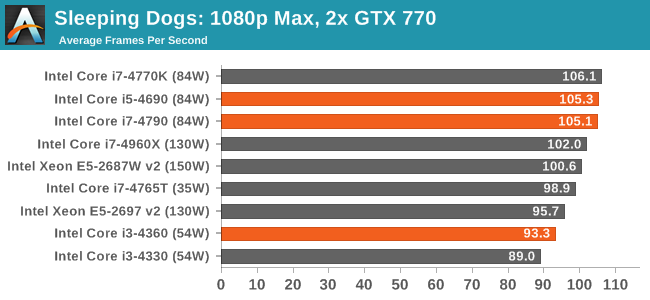
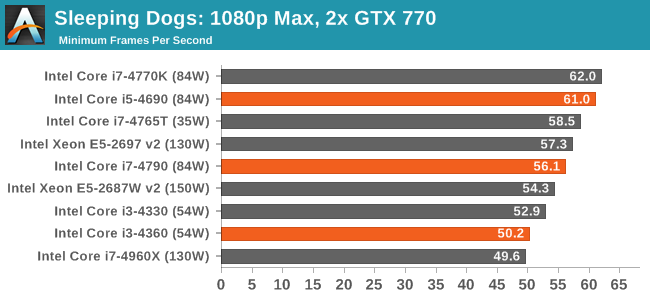
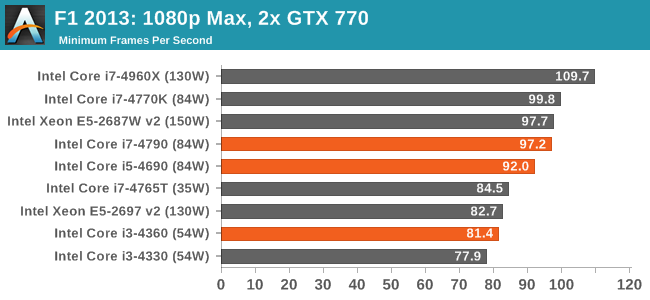
While average FPS takes a ~10% drop from i3 to i5, the same 10 FPS drop is seen in the minimum frame rates but this equates more to a ~20% decline.
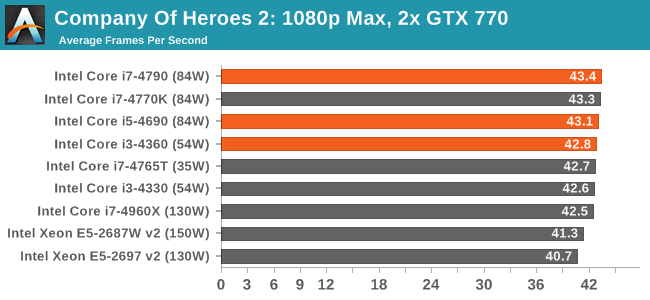
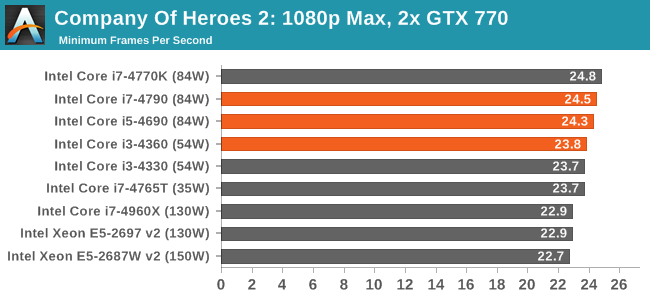
Company of Heroes 2
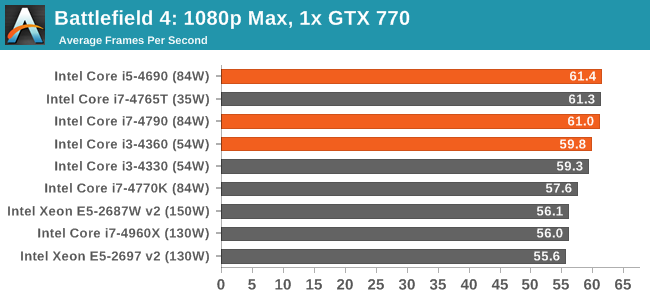
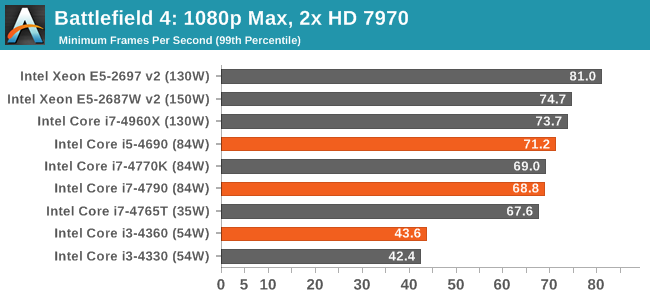
Battlefield 4
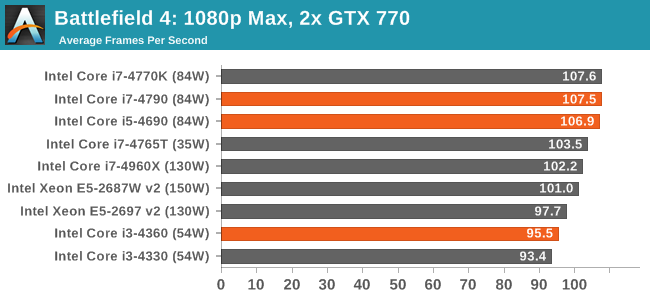
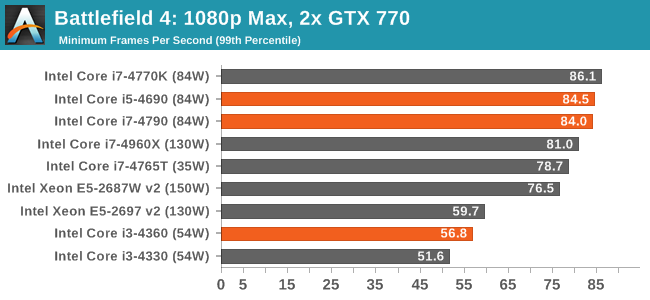
When you start adding the GPU horsepower, the i3 core count becomes a hindrance in minimum FPS values for BF4.
For our discrete GPU benchmarks, we have split them up into the different GPU configurations we have tested. We have access to both MSI GTX 770 Lightning GPUs and ASUS reference HD 7970s, for SLI and Crossfire respectively. These tests are all run at 1080p and maximum settings, reporting the average and minimum frame rates.
dGPU Benchmarks: 1x ASUS HD7970
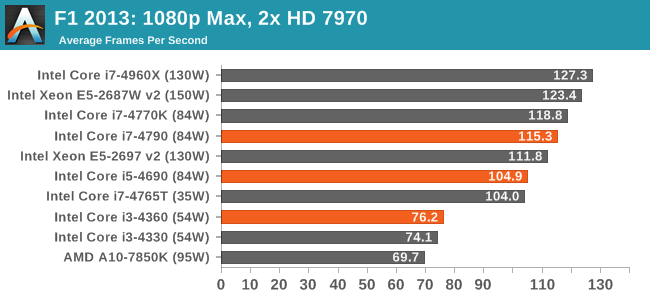
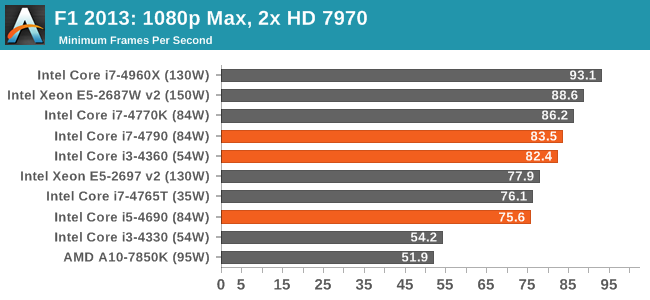
F1 2013
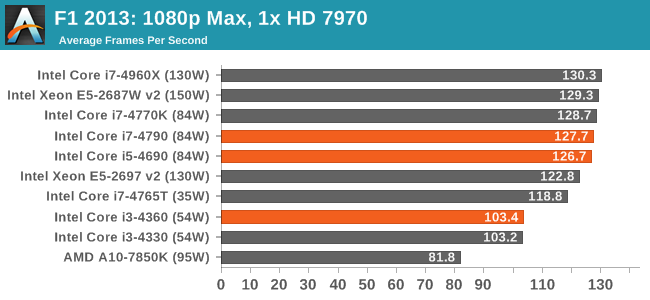
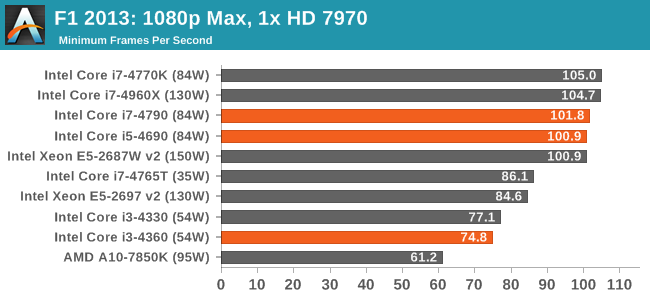
With a single 7970, the 25% minimum frame-rate difference between an i3 and an i5 is almost astonishing.
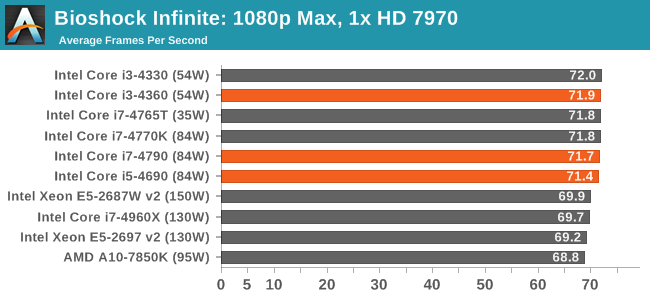
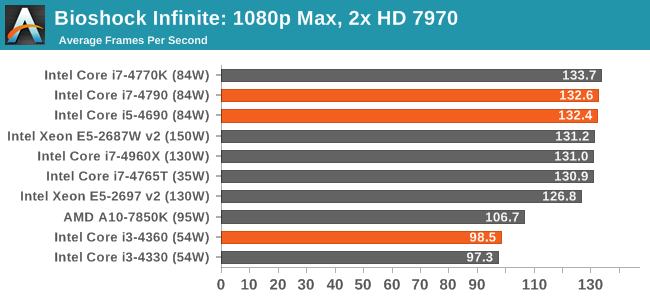
Bioshock Infinite
Tomb Raider
Sleeping Dogs
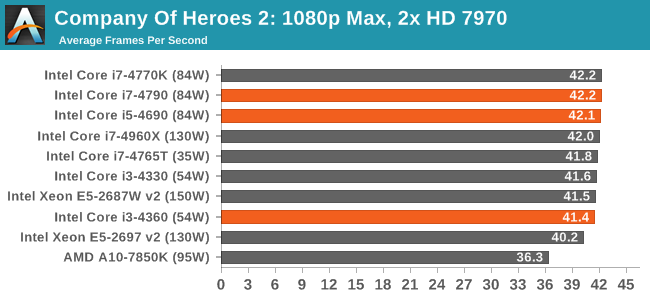
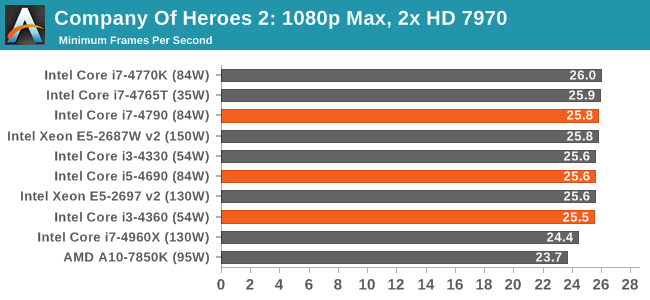
Company of Heroes 2
Battlefield 4
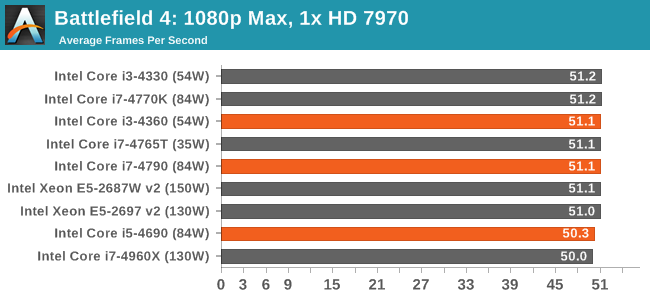
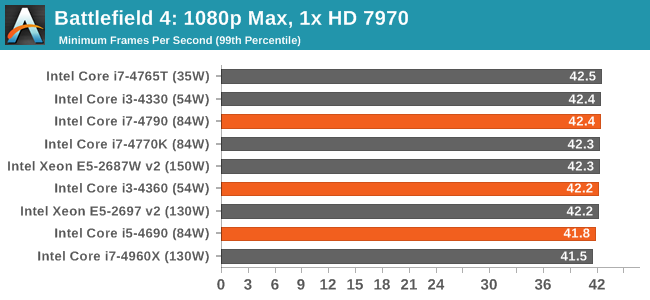
Analysis
Aside from F1 2013, using a single HD7970 does not seem to affect frame rates so much at 1080p with all the eye candy turned on.
For our discrete GPU benchmarks, we have split them up into the different GPU configurations we have tested. We have access to both MSI GTX 770 Lightning GPUs and ASUS reference HD 7970s, for SLI and Crossfire respectively. These tests are all run at 1080p and maximum settings, reporting the average and minimum frame rates.
dGPU Benchmarks: 2x ASUS HD7970
F1 2013
Bioshock Infinite
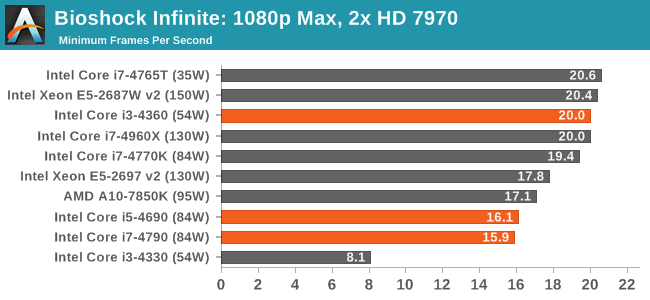
Moving up to two AMD GPUs puts the i3 on the back foot with Bioshock Infinite average frame rates, with the i5/i7 pulling a ~30% lead.
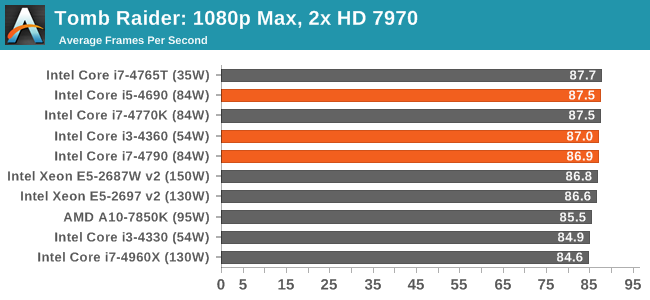
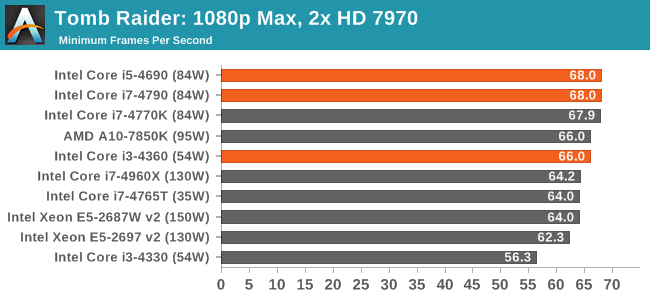
Tomb Raider
Sleeping Dogs
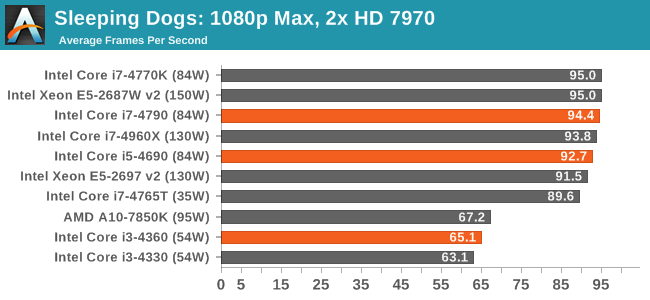
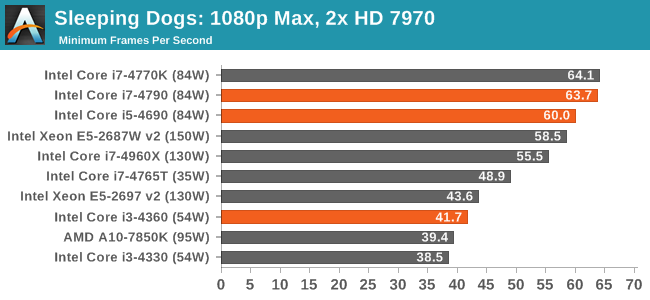
Sleeping Dogs matches Bioshock Infinite in that as the GPU power increases, the demands on the CPU does as well. As the i3 has two fewer cores, frame rates are struggling to get above 60 FPS with an i3, and you really need an i5 or i7 for 60 FPS minimum.
Company of Heroes 2
Battlefield 4
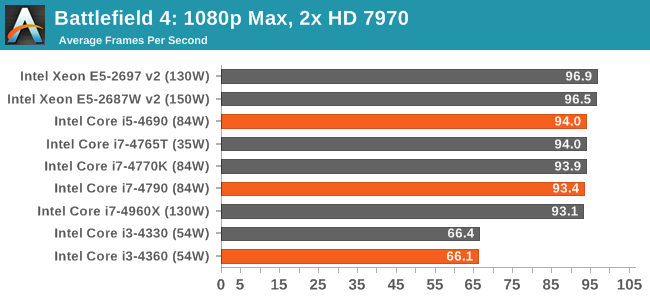
Battlefield is known for taking advantage of all the resources available, and while the added threads of the i7 does not seem to make much difference, the two fewer cores of the i3 show a 50% lead to the quad core counterparts compared to the i3.
Conclusions
When a company builds a product that evolves and adapts every generation, unless they are under strong competition on all fronts, the best and brightest will not be released on day one. The company can afford to be more casual in how it approaches the product stack. This allows for updates to be produced during downtime that are just a slightly more aggressive policy revision. In the land of processors, this means more stringent bins or tighter pricing methods. The Haswell Refresh is essentially this – Intel has a long time between major updates (ticks or tocks) and can launch a number of processors in the interim which are more competitive for price and/or performance until the next major update appears.
As expected, the Core i7-4790 CPU that we had beats the i7-4770K in each of the CPU benchmarks by a consistent margin due to the CPU frequency increase. In a similar vein, the IGP of the i7-4790 trails that of the i7-4770K due to the 50 MHz deficit on the side of the i7-4790. There are no surprises here, it has all gone by the book.
While our other CPU matchups were not as ideal as the i7, the i5 and i3 both show their respective positions in the table. The use of the i7-4765T as a low frequency, quad core CPU with HyperThreading also puts in an element of analysis, whereby removing the HyperThreading for the i5-4690 actually puts it ahead on several of the single threaded / high-register requirement benchmarks.
In discrete GPU testing, the CPUs all perform similarly in single GPU conditions. This showcases that high-end CPUs, even for modern games are not needed when it comes to discrete gaming capabilities. This seems especially true for Tomb Raider which comes across as completely CPU agnostic, choosing to offload as much of the work onto the GPU as possible.
In dual GPU conditions, we get more of a landscape of where the Haswell Refresh CPUs stand. The i3-4360, in the same PCIe arrangement as the i5 and i7 CPUs, fails to scale as well as the CPUs with more cores. This equates to about 10% in Sleeping Dogs/Battlefield 4 using the GTX 770s in SLI, or 30% in the same benchmarks using HD 7970s in CrossFire. For users enjoying the higher refresh rate monitors, such as 120 Hz or 144 Hz, this can make a significant difference. The inclusion of HyperThreading with the i7-4790 did not give any advantage in gaming compared to the i5-4690, except in the CPU benchmarks where each thread had minimal register requirements (PovRay, 3DPM).
On the IGP side all of our new CPUs were using the HD4600 solution making comparison straightforward. The i7 seems to have the clear advantage here, with up to 10% performance increase against the i3. The difference between the i7 and i5 however was minimal, but exaggerated in some of the synthetic tests such as 3DMark Cloud Gate which ends up more CPU bound.
For a lot of users interested in overclocking CPUs or who have already moved to Haswell, this refresh will seem almost pointless. It is a chance for Intel to combine the release of a new chipset with a series of CPUs so system integrators and retailers can start selling bundles. For the enthusiasts especially, the new overclocking-focused Devil’s Canyon and Pentium-K processors supposedly coming soon are being awaited with bated breath.
For new users looking to go Intel however, the Haswell Refresh is the new platform to get. It edges out the older CPUs either in terms of performance or price, but not in a massive excitement sort of way. Intel has played it safe, as you would expect when you have a performance advantage.
The last question to consider is if this is the right time to purchase: is there something new around the corner? For the enthusiast, the next generation of enthusiast CPUs (Haswell-E and X99) are due out in the second half of this year, however one would expect the entry point for this platform is around the $500 mark (CPU + motherboard + DRAM). For more mainstream uses, Intel has teased Broadwell news in the form of an unlocked Iris Pro CPU, however that seems to be due more towards the end of 2014/2015 if the Broadwell NUC roadmap is anything to go by. That would mean anyone buying a Haswell Refresh platform today, with a new CPU, would have until the end of the year before it is no longer the latest technology in the more casual desktop market. However, Broadwell processors are assumed to be LGA1150, the same as Haswell, meaning an upgrade should be as simple as replacing the CPU.


