Original Link: https://www.anandtech.com/show/9287/the-amd-a10-7700k-and-amd-a6-7400k-cpu-review
The AMD A10-7700K and AMD A6-7400K CPU Mini-Review
by Ian Cutress on May 27, 2015 9:00 AM EST
In recent months and quarters I have had discussions about why CPU manufacturers offer a number of processors each separated by $7 and 100 MHz. The obvious answer (but not always the logical answer) is to cater for what the customer wants by overloading them with choice. As a result, sometimes direct CPU comparisons can be difficult, as it requires testing every CPU released. Thankfully for AMD’s Kaveri, todays tests of the A10-7700K and A6-7400K plugs a few holes in our AMD benchmark numbers to allow those comparisons.
The Information
We recently reviewed the A8-7650K, a newer processor having been released at the turn of 2015, and thus a lot of the introduction on this page is going to mirror what we stated in that review, particularly when it comes to pricing, comparisons and the processor stack as a whole. We requested both the A10-7700K and the A6-7400K to fill in some of the gaps in our testing, though we do recognize they were released in mid-2014. This is unfortunately part of AMD’s Kaveri strategy – releasing one or two different SKUs each quarter to cover parts of the market. In this case, the A10-7700K is the lowest A10 part while the A6-7400K is one of the few single module (dual thread) available.
| AMD Kaveri Lineup | |||||||
| A10- 7850K |
A10- 7800 |
A10- 7700K |
A8- 7650K |
A8- 7600 |
X4 860K |
A6- 7400K |
|
| Price | $134 | $131 | $120 | $104 | $89 | $85 | $64 |
| Modules | 2 | 2 | 2 | 2 | 2 | 2 | 1 |
| Threads | 4 | 4 | 4 | 4 | 4 | 4 | 2 |
| Core Freq. (GHz) | 3.7-4.0 | 3.5-3.9 | 3.4-3.8 | 3.3-3.8 | 3.1-3.8 | 3.7-4.0 | 3.5-3.9 |
| Compute Units | 4+8 | 4+8 | 4+6 | 4+6 | 4+6 | 4+0 | 2+4 |
| Streaming Processors |
512 | 512 | 384 | 384 | 384 | N/A | 256 |
| IGP Freq. (MHz) | 720 | 720 | 720 | 720 | 720 | N/A | 756 |
| TDP | 95W | 65W | 95W | 95W | 65W | 95W | 65W |
| DRAM Frequency |
2133 | 2133 | 2133 | 2133 | 2133 | 1866 | 1866 |
| L2 Cache | 2x2MB | 2x2MB | 2x2MB | 2x2MB | 2x2MB | 2x2MB | 1MB |
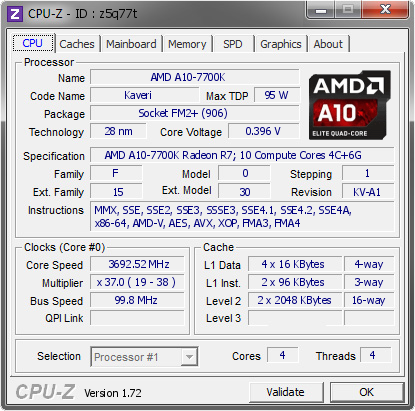
The A10-7700K differs by having a total of 10 compute units compared to the other A10 processors which have 12. This means that it has a high CPU and GPU speed, but fewer GPU cores to play with compared to the A10-7800 or A10-7850K. Compared to the A10-7800 also, we are dealing with the A10-7700K as a 95W part at $120, rather than a 65W part, but the A10-7700K is more geared towards overclocking which we cover later in the review.
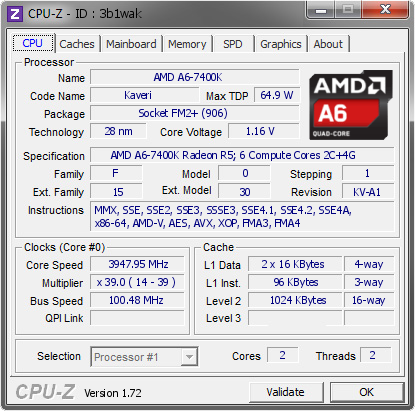


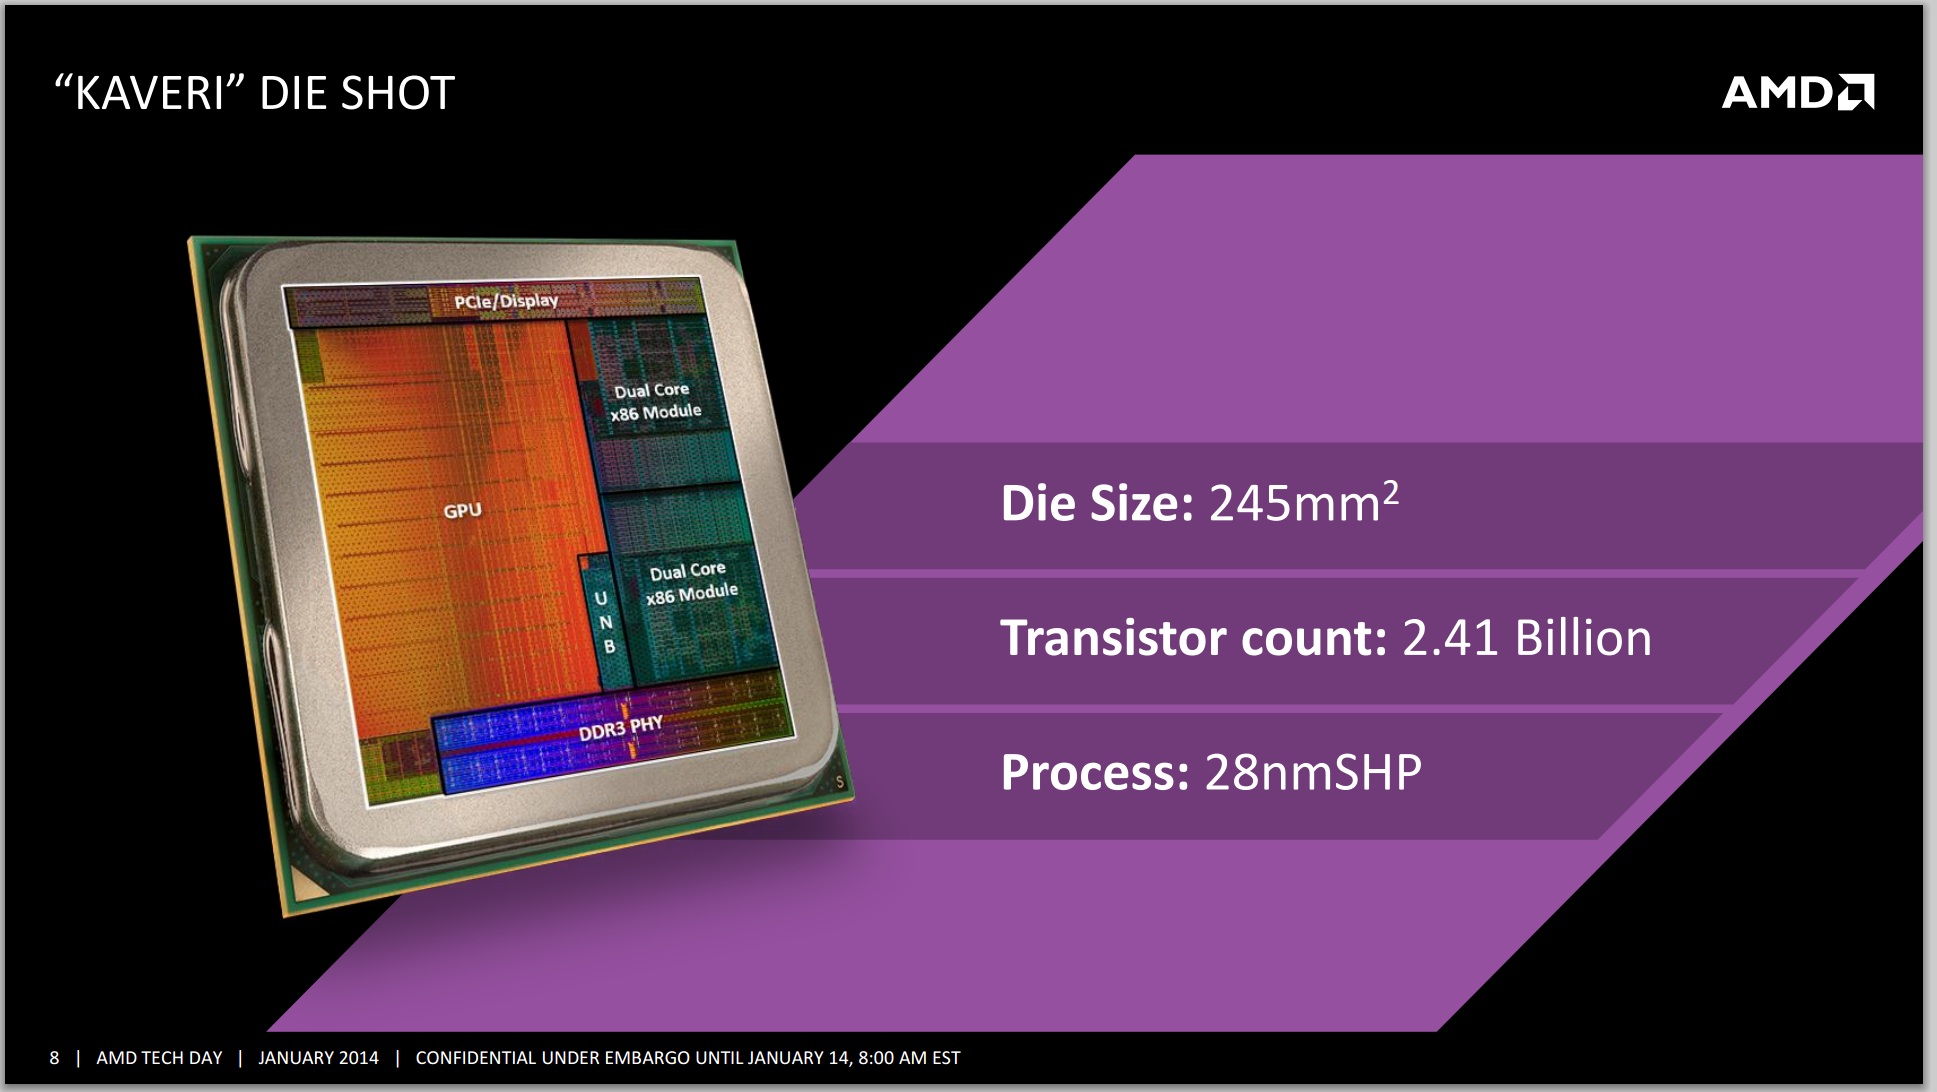
The A6-7400K sits at the bottom of the stack. That position and represents how AMD bins its processors, as the A6 still has all the same transistors. When the dies come out and are tested, if one of the modules is not working correctly it can be fused off from the rest of the processor and sold as a lower end part. The rest of the CPU is fine as represented by the high CPU frequencies, and it comes with a TDP of 65W at a low $64 price. The question becomes whether having only a single module (and two threads) is enough for it to power the 256 SPs in the graphics or if the CPU has the power for discrete cards now that more games are multithreaded. That being said, pairing it with a $70 R7 240 discrete card which has 320 SPs should, on paper at least, afford a good bump in graphics performance when in dual graphics mode for titles that can take advantage of it.
Competition and Market
For every tech product that comes out on the market, price is everything. A good product can become super obscure by virtue of a high price, or an overtly mediocre product might become interesting if it strikes a chord at a low price point. Then there is always a question of competition, understanding what a user can get at what price and whether there are features that make the experience worthwhile.
The downside for reviews at least is because in reality there are two prices for everything. The launch price dictates the initial interest, but subsequent price cuts over time can help drive sales. When we write a review, our thoughts are encapsulated at that specific moment in time, so if the price drops or it goes on sale, sometimes the level of recommendation might be skewed. In our last review, we experimented with this. We produced a table of AMD vs Intel at price points in the market:
| CPU/APU Comparion | ||||
| AMD Kaveri | Amazon Price on 5/27 |
Intel Haswell | ||
| $236 |
i5-4690K (4C/4T, 88W) |
3.5-3.9 GHz HD 4600 |
||
| $214 | i5-4590 (4C/4T, 84W) |
3.3-3.7 GHz HD 4600 |
||
| $189 | i5-4460 (4C/4T, 84W) |
3.2-3.4 GHz HD 4600 |
||
| $138 | i3-4330 (2C/4T, 54W) |
3.5 GHz HD 4600 |
||
| 3.7-4.0 GHz 512 SPs |
A10-7850K (2M/4T, 95W) |
$134 | ||
| 3.5-3.9 GHz 512 SPs |
A10-7800 (2M/4T, 65W) |
$131 | ||
| 3.4-3.8 GHz 384 SPs |
A10-7700K (2M/4T, 95W) |
$120 | i3-4130 (2C/4T, 54W) |
3.4 GHz HD 4400 |
| 3.3-3.8 GHz 384 SPs |
A8-7650K (2M/4T, 95W) |
$104 | ||
| $94 | Pentium G3430 (2C/2T, 53W) |
3.3 GHz HD (Haswell) |
||
| 3.1-3.8 GHz 384 SPs |
A8-7600 (2M/4T, 65W) |
$89 | ||
| 3.7-4.0 GHz No IGP |
X4 860K (2M/4T, 95W) |
$85 | ||
| $70 | Pentium G3258 (2C/2T, 53W) |
3.2 GHz HD (Haswell) |
||
| 3.5-3.9 GHz 256 SPs |
A6-7400K (1M/2T, 65W) |
$64 | ||
| $44 | Celeron G1840 (2C/2T, 53W) |
2.8 GHz HD (Haswell) |
||
This shows what is competing against what specifically at this time frame. One issue to consider is representing this in our benchmarking graphs. In our last review, the A8-7650K, we started quoting the pricing with the processors. Our graphs are not dynamic, and if we used the current price at the time of review, the later the review is arguably the better the recommendation. In that regard we decided to use the launch price of a product for our graphs to maintain a level of consistency.
What pricing we quote aside, looking at recent prices in the table above gives competition for both the A6-7400K and the A10-7700K. The A6-7400K sits below the Pentium G3258 which we reviewed last year and is Intel’s low end overclocking processor. The A10-7700K sits more against the i3-4130 at $120. For our comparisons in this review, we have numbers for the G3258 but the nearest Intel CPUs to the A10-7700K we have are the i3-4130T ($138) and the i3-4330 ($128).
All our results, both past and present, can be found in our online database Bench. As we test CPUs in the future, look out for those results as well.
Test Setup
We are using a new testing regime, starting from May 2015 including five recent games on different AMD and NVIDIA graphics cards from $70 to $560. A detailed breakdown of our testing can be found here, although for this review we will present a few of the more poignant tests while all the results can be found in Bench.
| Test Setup | ||||
| Processor | AMD A10-7700K | 2M / 4T | 3.4 GHz Base, 3.8 GHz Turbo |
95W |
| AMD A6-7400K | 1M / 2T | 3.5 GHz Base, 3.9 GHz Turbo |
65W | |
| Motherboard | GIGABYTE F2A88X-UP4 MSI A88X-G45 Gaming |
|||
| DRAM | G.Skill RipjawsZ 4x4GB DDR3-2133 9-11-10 | |||
| Low End GPU | Integrated ASUS R7 240 2GB DDR3 Dual Graphics with R7 240 |
|||
| Mid Range GPU | MSI R9 285 Gaming 2GB MSI GTX 770 Lightning 2GB |
|||
| High End GPU | MSI R9 290X Gaming LE 4GB ASUS GTX 980 Strix 4GB |
|||
| Power Supply | OCZ 1250W Gold | |||
| Storage Drive | Crucial MX200 1TB | |||
| Operating System | Windows 7.1 64-bit, Build 7601 | |||
| CPU Cooler | Cooler Master Nepton 140XL CLC | |||
Many thanks to...
We must thank the following companies for kindly providing hardware for our test bed:
Thank you to AMD for providing us with the R9 290X 4GB GPUs.
Thank you to ASUS for providing us with GTX 980 Strix GPUs and the R7 240 DDR3 GPU.
Thank you to ASRock and ASUS for providing us with some IO testing kit.
Thank you to Cooler Master for providing us with Nepton 140XL CLCs.
Thank you to Corsair for providing us with an AX1200i PSU.
Thank you to Crucial for providing us with MX200 SSDs.
Thank you to G.Skill and Corsair for providing us with memory.
Thank you to MSI for providing us with the GTX 770 Lightning GPUs.
Thank you to OCZ for providing us with PSUs.
Thank you to Rosewill for providing us with PSUs and RK-9100 keyboards.
AMD A10-7700K and AMD A6-7400K Overclocking
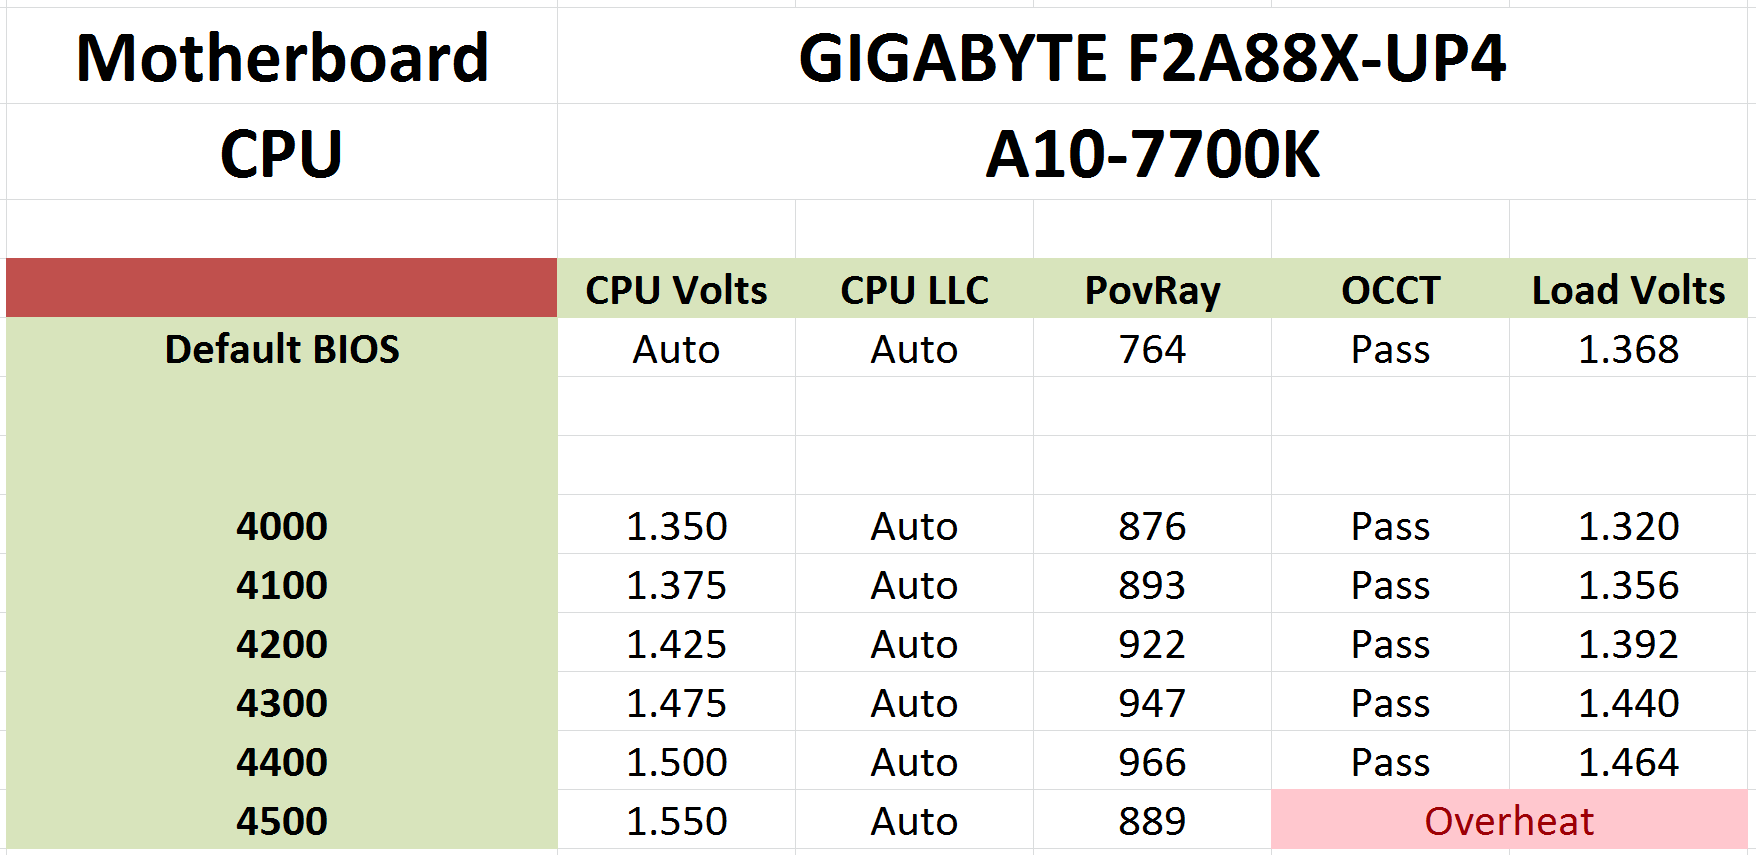
For the A10-7700K, we hit 4.4 GHz relatively easily with a small bump in voltage, however as we pushed higher frequency it required even more voltage to compensate which led to a quick route to overheating.
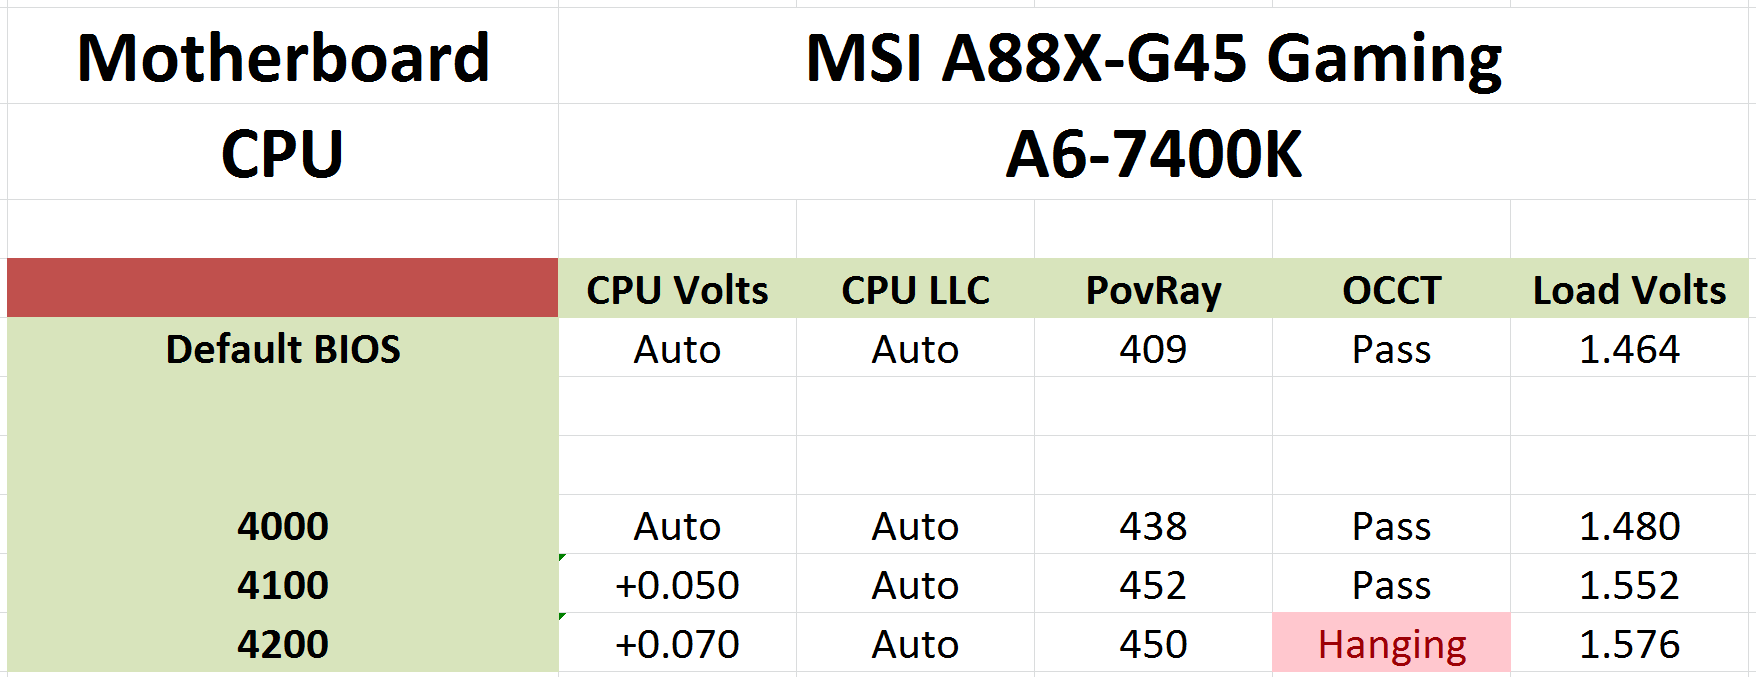
The A6-7400K starts with a high base frequency to begin with, but due to the disabled module on board it might have fewer heat generating areas and it could be construed that it might overclock more. In our testing, we had to change motherboards and the MSI has fewer overclocking options than the GIGABYTE, allowing only an offset voltage setting.
Office Performance
The dynamics of CPU Turbo modes, both Intel and AMD, can cause concern during environments with a variable threaded workload. There is also an added issue of the motherboard remaining consistent, depending on how the motherboard manufacturer wants to add in their own boosting technologies over the ones that Intel would prefer they used. In order to remain consistent, we implement an OS-level unique high performance mode on all the CPUs we test which should override any motherboard manufacturer performance mode.
All of our benchmark results can also be found in our benchmark engine, Bench.
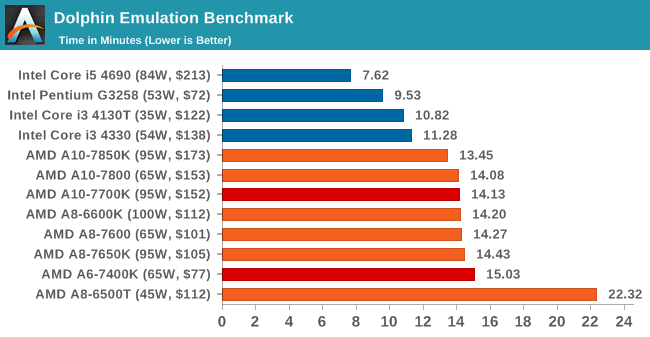
Dolphin Benchmark: link
Many emulators are often bound by single thread CPU performance, and general reports tended to suggest that Haswell provided a significant boost to emulator performance. This benchmark runs a Wii program that raytraces a complex 3D scene inside the Dolphin Wii emulator. Performance on this benchmark is a good proxy of the speed of Dolphin CPU emulation, which is an intensive single core task using most aspects of a CPU. Results are given in minutes, where the Wii itself scores 17.53 minutes.
WinRAR 5.0.1: link
Our WinRAR test from 2013 is updated to the latest version of WinRAR at the start of 2014. We compress a set of 2867 files across 320 folders totaling 1.52 GB in size – 95% of these files are small typical website files, and the rest (90% of the size) are small 30 second 720p videos.
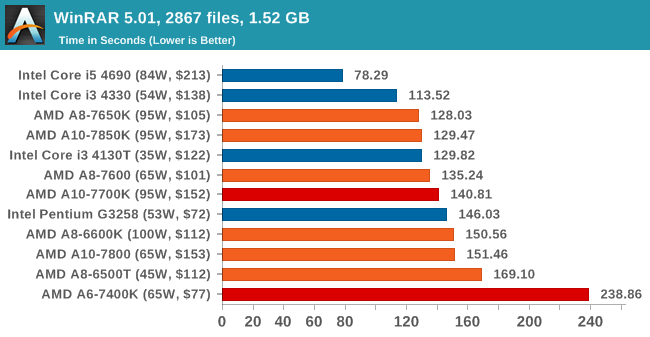
The single module of the 7400K shows the deficit in a slightly threaded workload.
Image Manipulation – FastStone Image Viewer 4.9: link
Similarly to WinRAR, the FastStone test us updated to the latest version. FastStone is the program I use to perform quick or bulk actions on images, such as resizing, adjusting for color and cropping. In our test we take a series of 170 images in various sizes and formats and convert them all into 640x480 .gif files, maintaining the aspect ratio. FastStone does not use multithreading for this test, and thus single threaded performance is often the winner.
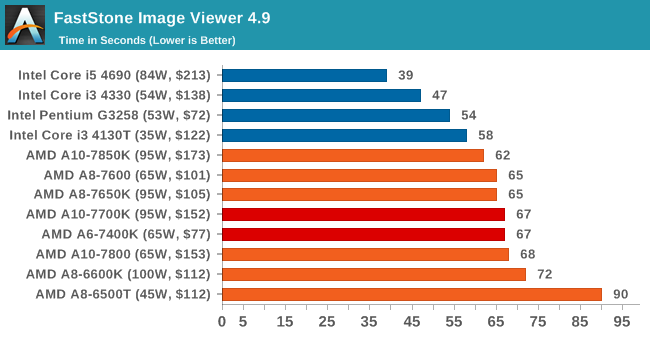
For a purely single threaded test, both of the AMD APUs performed similarly here.
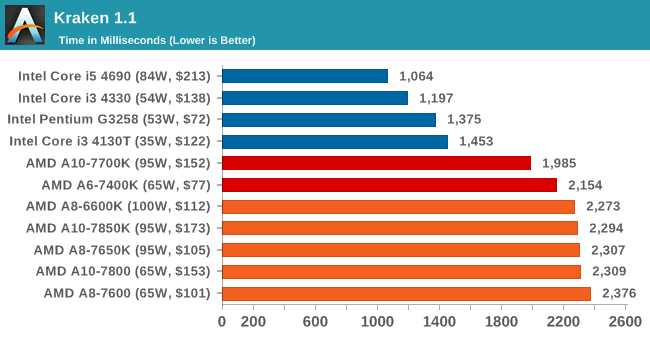
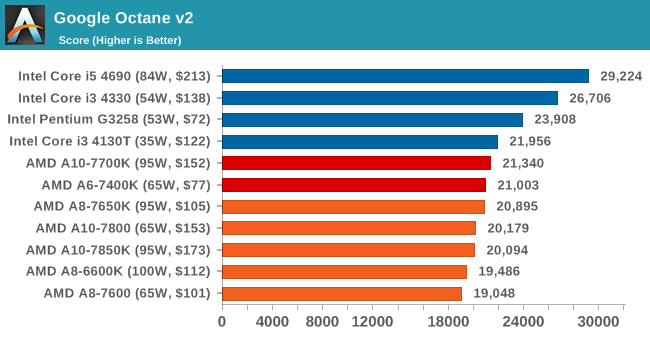
Web Benchmarks
On the lower end processors, general usability is a big factor of experience, especially as we move into the HTML5 era of web browsing. For our web benchmarks, we take well known tests with Chrome 35 as a consistent browser.
Mozilla Kraken 1.1
Google Octane v2
Professional Performance: Windows
We have a few benchmarks to characterise professional level performance on Windows.
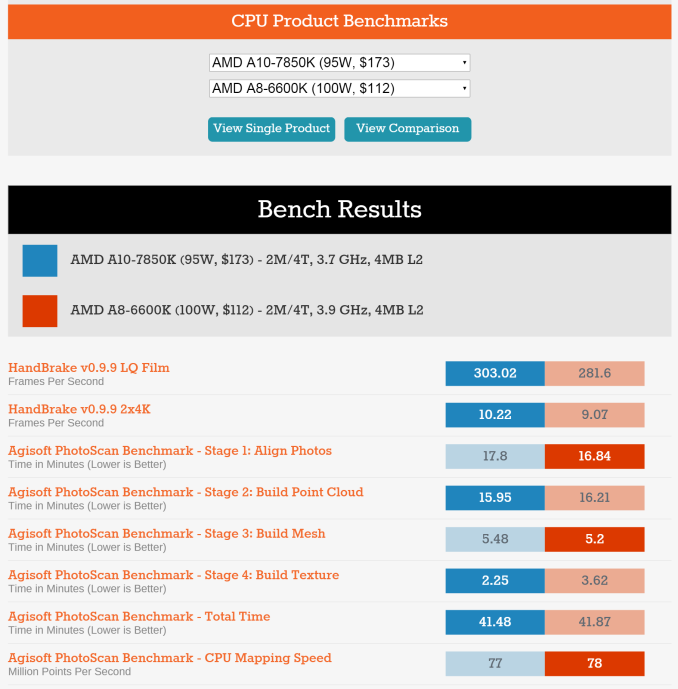
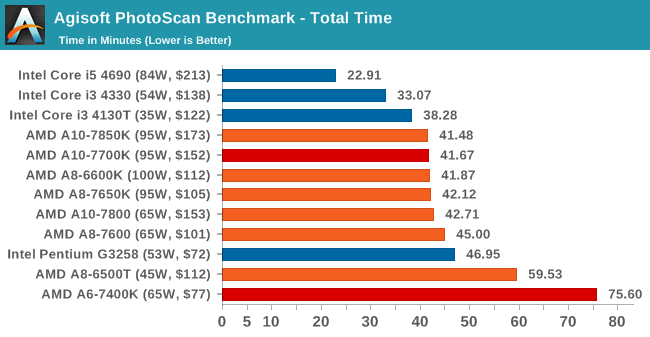
Agisoft Photoscan – 2D to 3D Image Manipulation: link
Agisoft Photoscan creates 3D models from 2D images, a process which is very computationally expensive. The algorithm is split into four distinct phases, and different phases of the model reconstruction require either fast memory, fast IPC, more cores, or even OpenCL compute devices to hand. Agisoft supplied us with a special version of the software to script the process, where we take 50 images of a stately home and convert it into a medium quality model. This benchmark typically takes around 15-20 minutes on a high end PC on the CPU alone, with GPUs reducing the time.
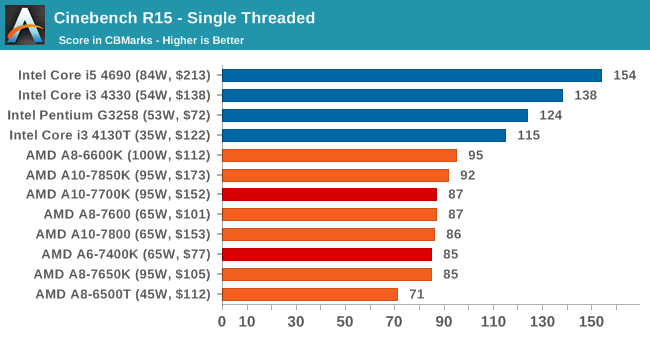
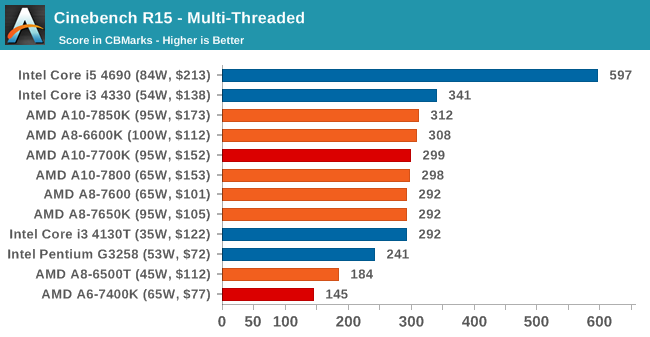
Cinebench R15
Cinebench is a benchmark based around Cinema 4D, and is fairly well known among enthusiasts for stressing the CPU for a provided workload. Results are given as a score, where higher is better.
Linux Performance
Built around several freely available benchmarks for Linux, Linux-Bench is a project spearheaded by Patrick at ServeTheHome to streamline about a dozen of these tests in a single neat package run via a set of three commands using an Ubuntu 11.04 LiveCD. These tests include fluid dynamics used by NASA, ray-tracing, OpenSSL, molecular modeling, and a scalable data structure server for web deployments. We run Linux-Bench and have chosen to report a select few of the tests that rely on CPU and DRAM speed.
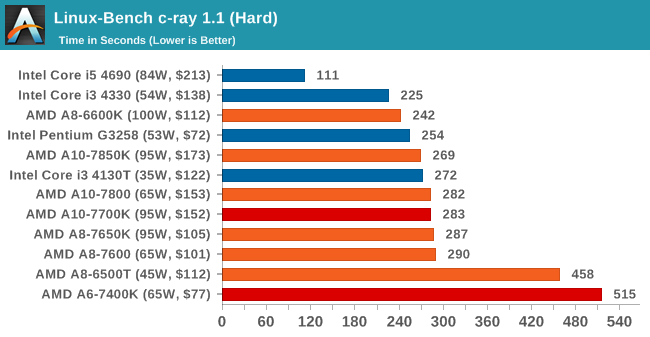
C-Ray: link
C-Ray is a simple ray-tracing program that focuses almost exclusively on processor performance rather than DRAM access. The test in Linux-Bench renders a heavy complex scene offering a large scalable scenario.
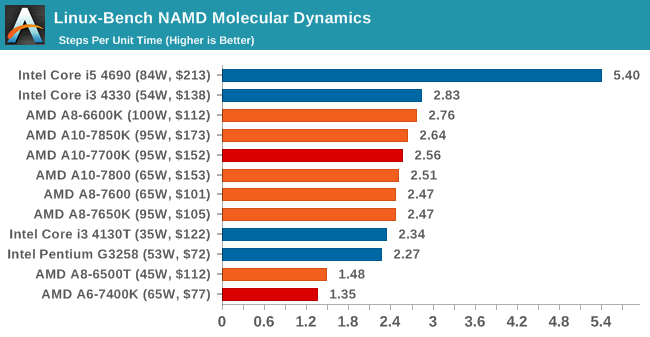
NAMD, Scalable Molecular Dynamics: link
Developed by the Theoretical and Computational Biophysics Group at the University of Illinois at Urbana-Champaign, NAMD is a set of parallel molecular dynamics codes for extreme parallelization up to and beyond 200,000 cores. The reference paper detailing NAMD has over 4000 citations, and our testing runs a small simulation where the calculation steps per unit time is the output vector.
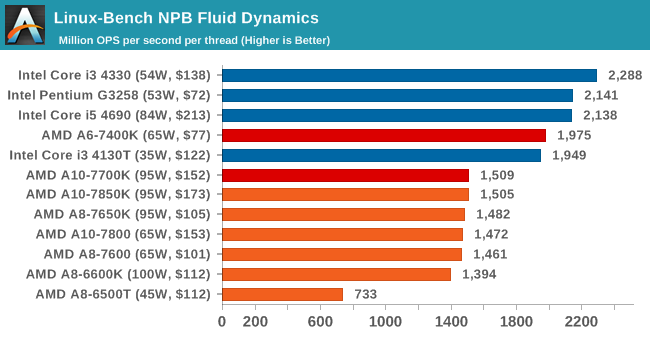
NPB, Fluid Dynamics: link
Aside from LINPACK, there are many other ways to benchmark supercomputers in terms of how effective they are for various types of mathematical processes. The NAS Parallel Benchmarks (NPB) are a set of small programs originally designed for NASA to test their supercomputers in terms of fluid dynamics simulations, useful for airflow reactions and design.
Gaming Benchmarks
As mentioned previously, this mini-review will focus on a few elements but all our data can be found in Bench, including tests with high end ($300+) graphics cards and some 4K testing.
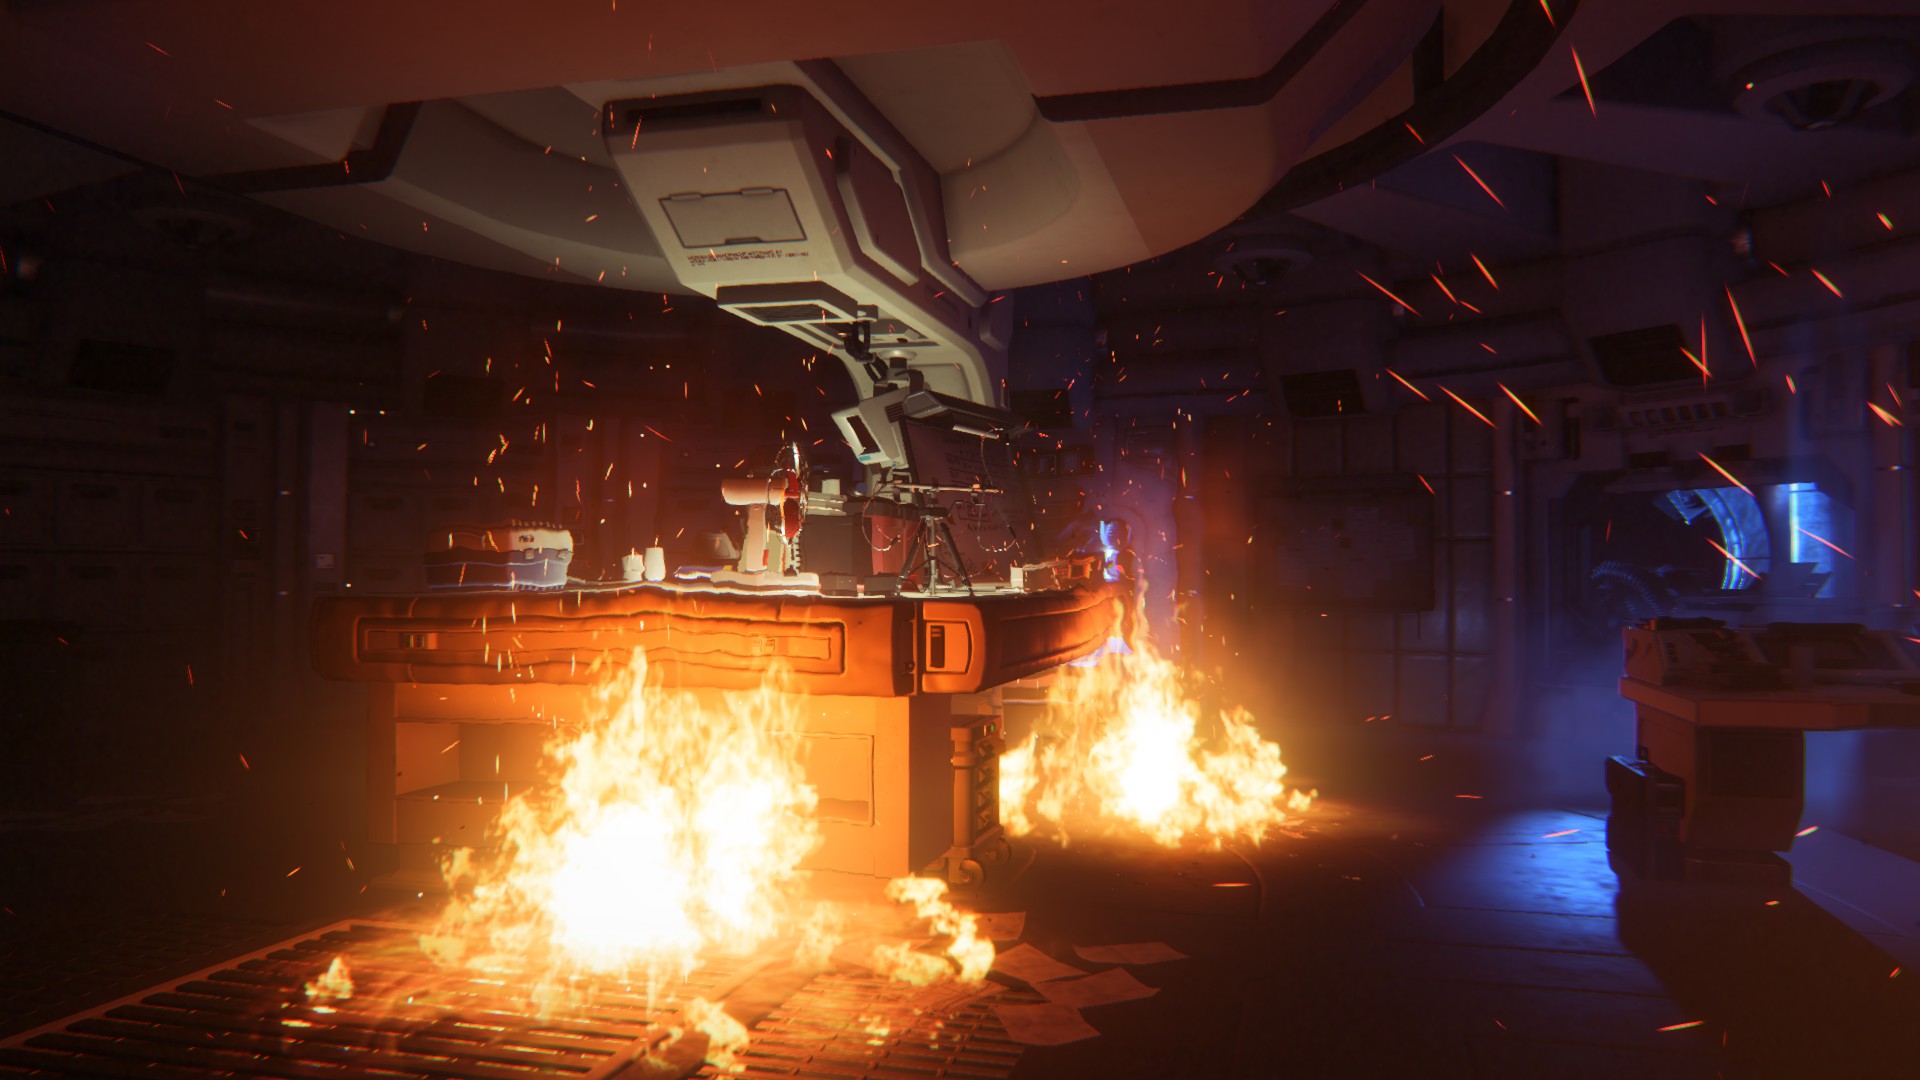
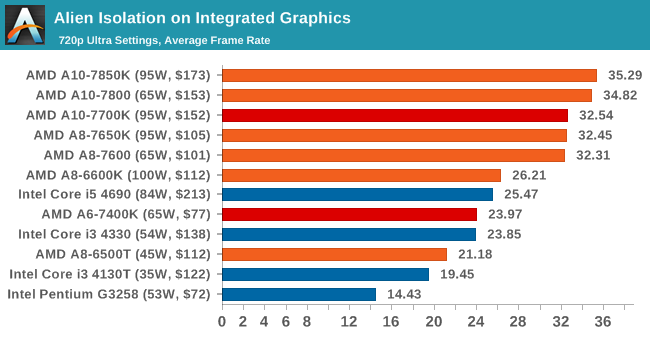
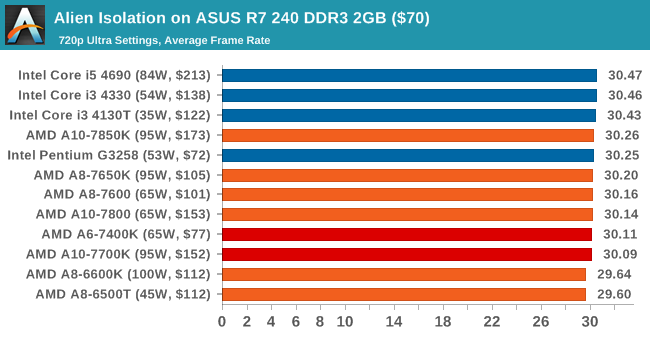
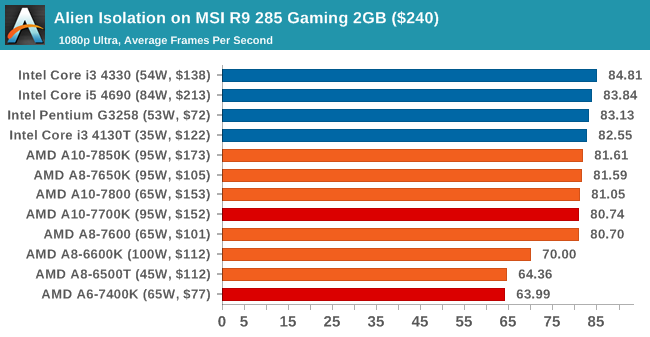
Alien: Isolation
If first person survival mixed with horror is your sort of thing, then Alien: Isolation, based off of the Alien franchise, should be an interesting title. Developed by The Creative Assembly and released in October 2014, Alien: Isolation has won numerous awards from Game Of The Year to several top 10s/25s and Best Horror titles, ratcheting up over a million sales by February 2015. Alien: Isolation uses a custom built engine which includes dynamic sound effects and should be fully multi-core enabled.
For low end graphics, we test at 720p with Ultra settings, whereas for mid and high range graphics we bump this up to 1080p, taking the average frame rate as our marker with a scripted version of the built-in benchmark.
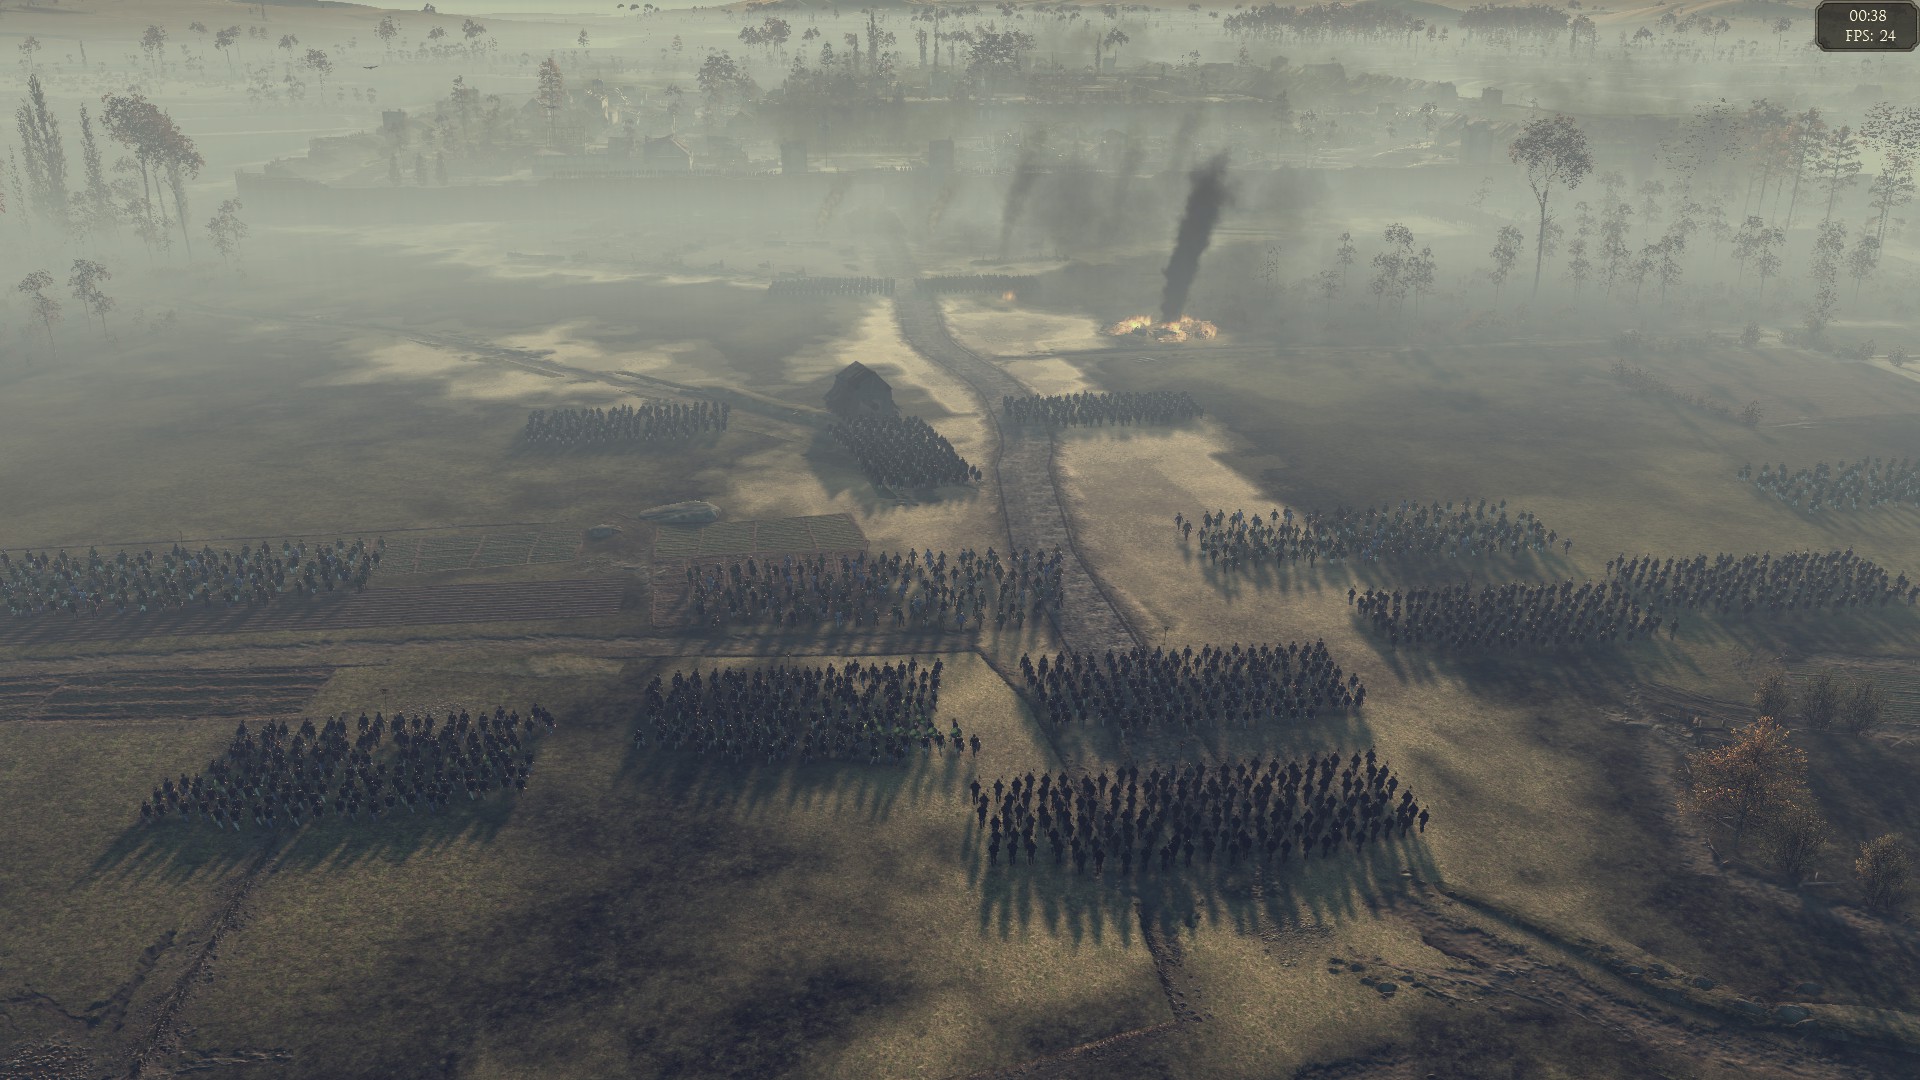
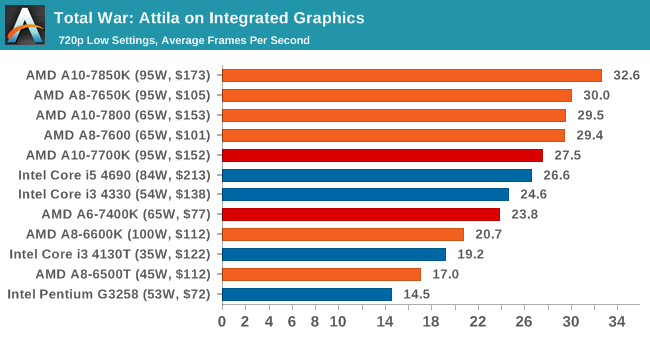
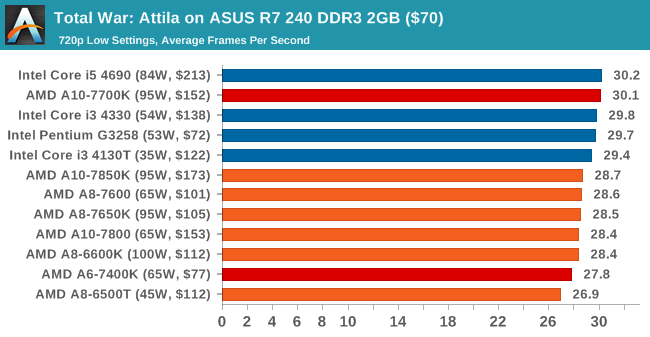
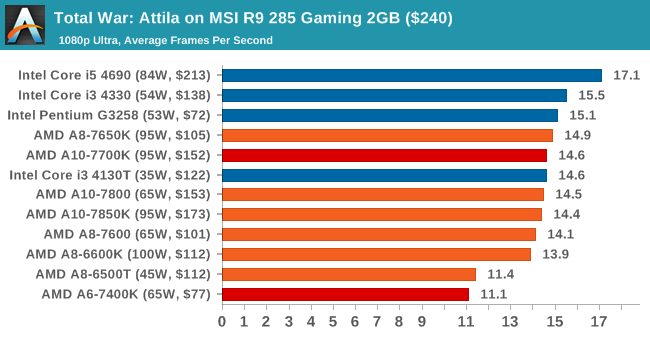
Total War: Attila
The Total War franchise moves on to Attila, another The Creative Assembly development, and is a stand-alone strategy title set in 395AD where the main story line lets the gamer take control of the leader of the Huns in order to conquer parts of the world. Graphically the game can render hundreds/thousands of units on screen at once, all with their individual actions and can put some of the big cards to task.
For low end graphics, we test at 720p with performance settings, recording the average frame rate. With mid and high range graphics, we test at 1080p with the quality setting. In both circumstances, unlimited video memory is enabled and the in-game scripted benchmark is used.
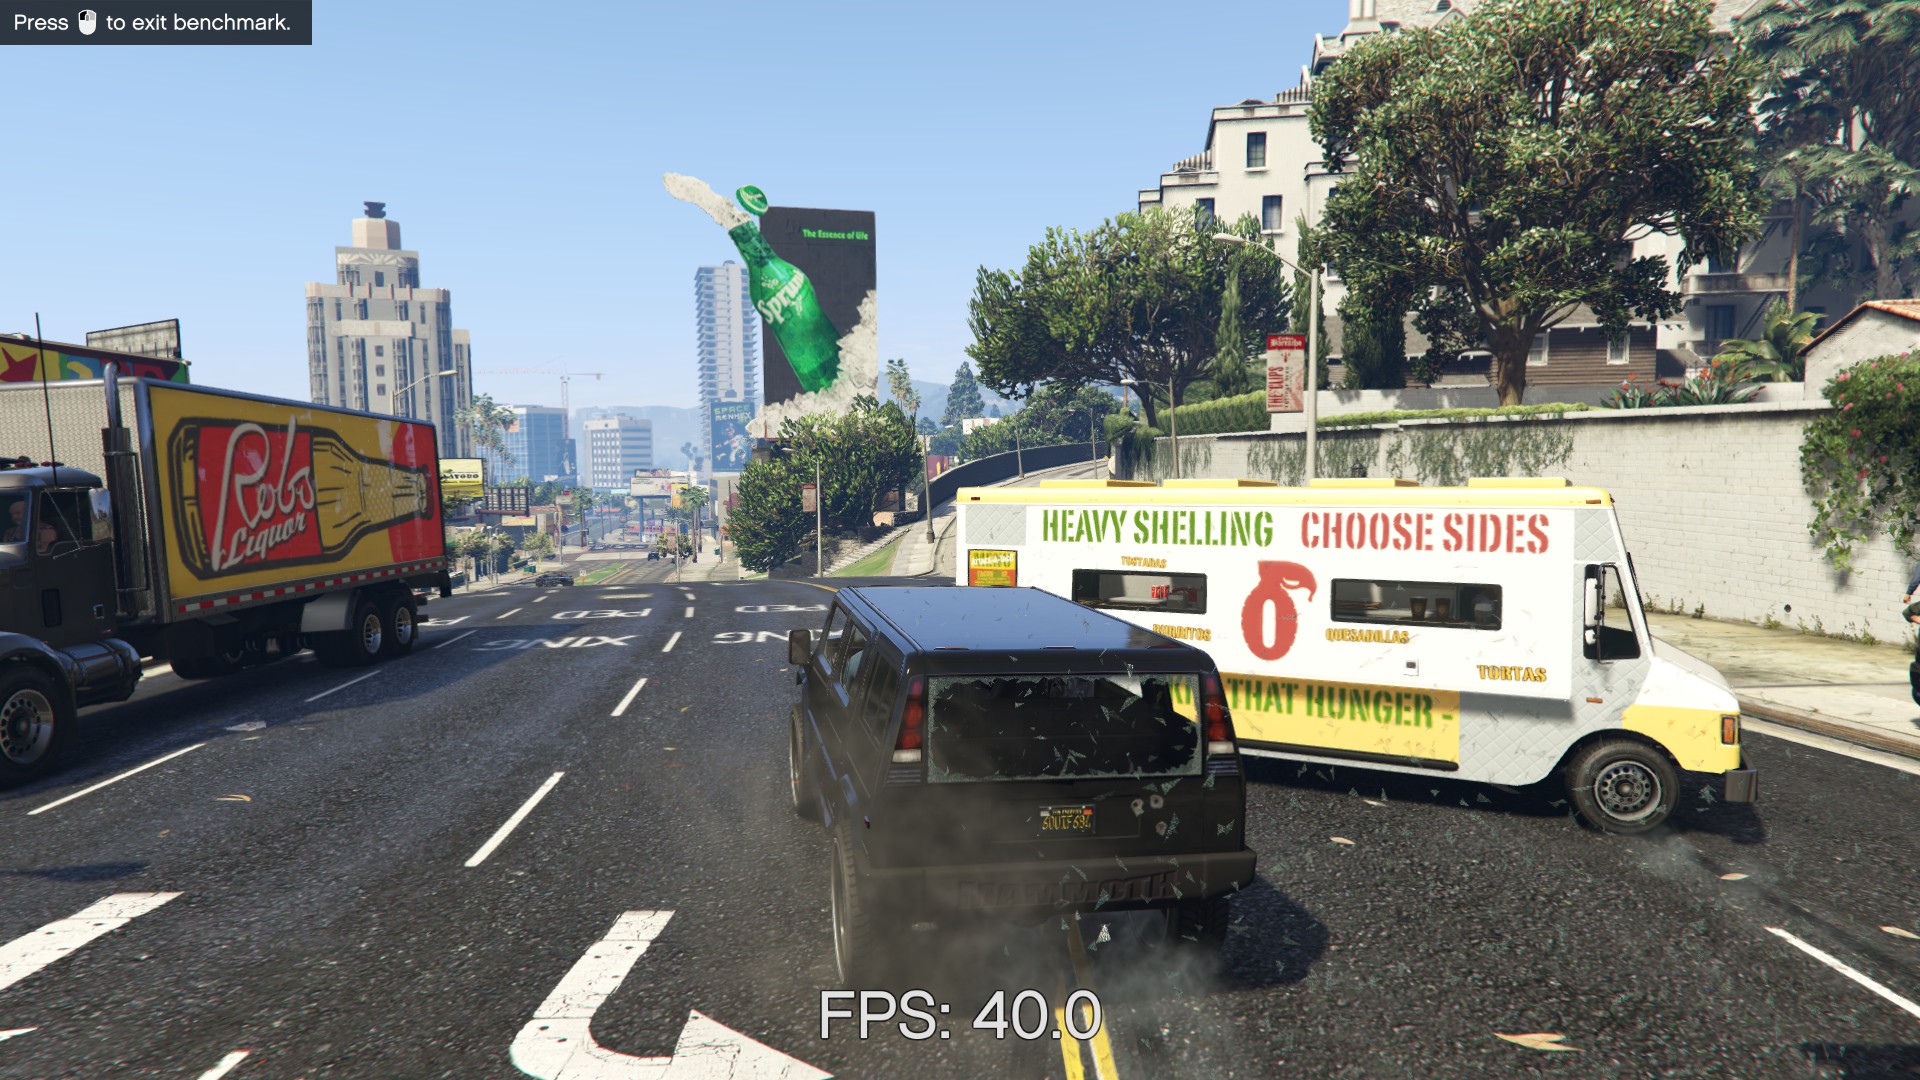
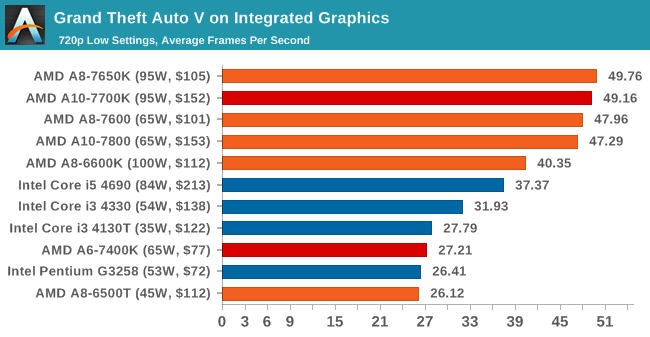
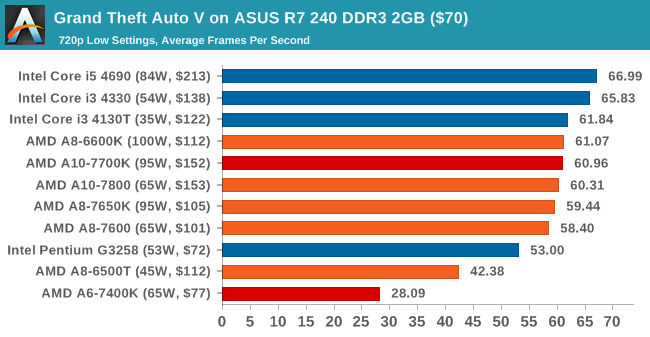
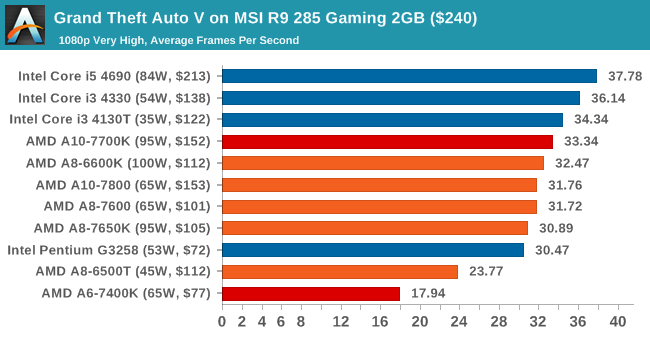
Grand Theft Auto V
The highly anticipated iteration of the Grand Theft Auto franchise finally hit the shelves on April 14th 2015, with both AMD and NVIDIA in tow to help optimize the title. GTA doesn’t provide graphical presets, but opens up the options to users and extends the boundaries by pushing even the hardest systems to the limit using Rockstar’s Advanced Game Engine. Whether the user is flying high in the mountains with long draw distances or dealing with assorted trash in the city, when cranked up to maximum it creates stunning visuals but hard work for both the CPU and the GPU.
For our test we have scripted a version of the in-game benchmark, relying only on the final part which combines a flight scene along with an in-city drive-by followed by a tanker explosion. For low end systems we test at 720p on the lowest settings, whereas mid and high end graphics play at 1080p with very high settings across the board. We record both the average frame rate and the percentage of frames under 60 FPS (16.6ms).
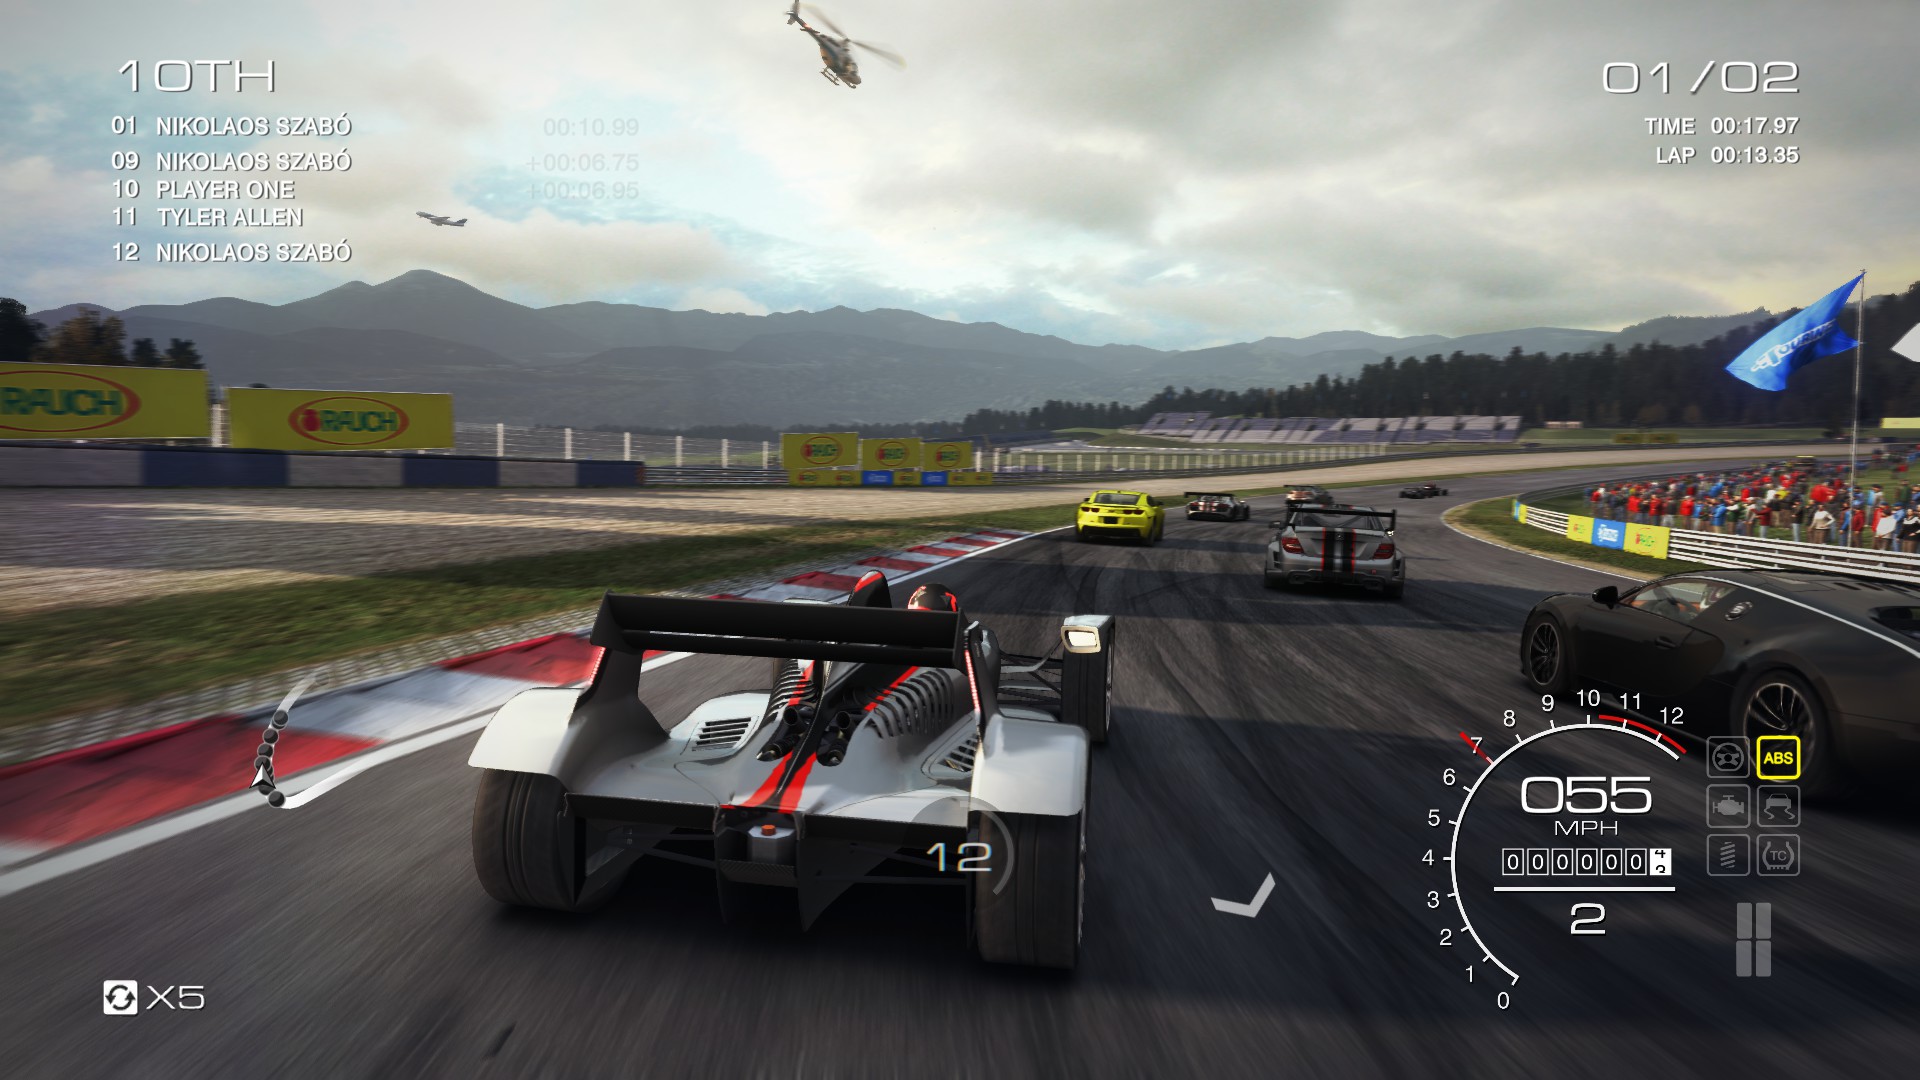
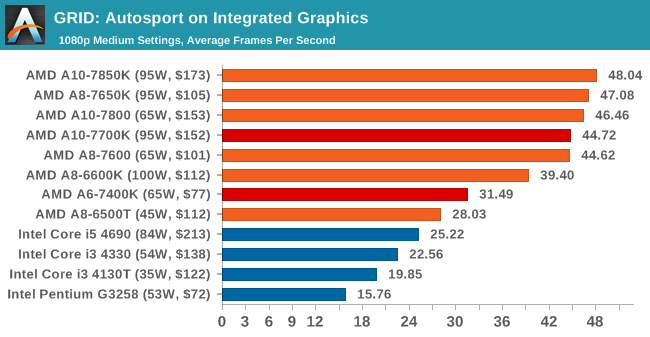
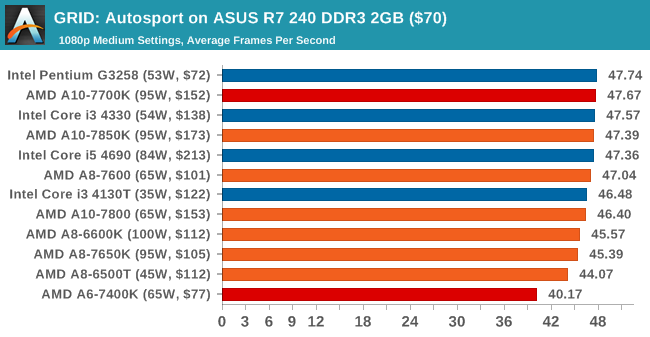
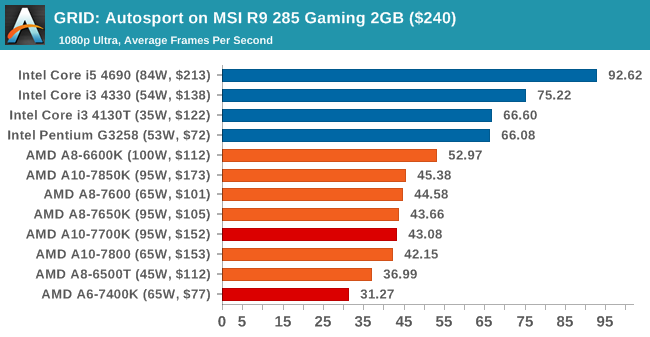
GRID: Autosport
No graphics tests are complete without some input from Codemasters and the EGO engine, which means for this round of testing we point towards GRID: Autosport, the next iteration in the GRID and racing genre. As with our previous racing testing, each update to the engine aims to add in effects, reflections, detail and realism, with Codemasters making ‘authenticity’ a main focal point for this version.
GRID’s benchmark mode is very flexible, and as a result we created a test race using a shortened version of the Red Bull Ring with twelve cars doing two laps. The car is focus starts last and is quite fast, but usually finishes second or third. For low end graphics we test at 1080p medium settings, whereas mid and high end graphics get the full 1080p maximum. Both the average and minimum frame rates are recorded.
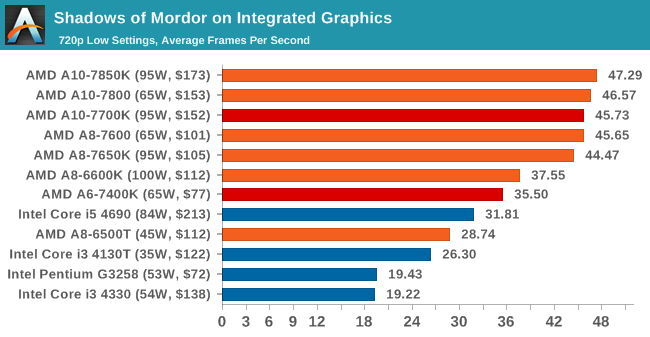
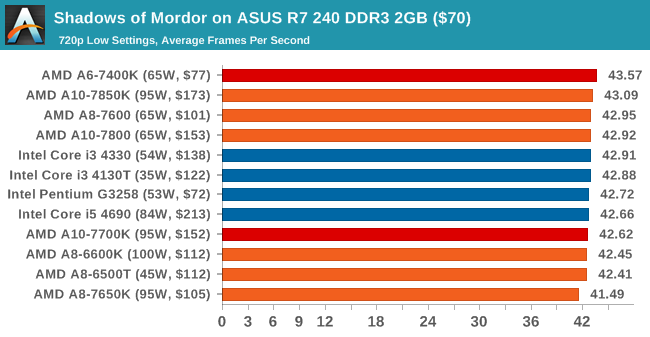
Middle-Earth: Shadows of Mordor
The final title in our testing is another battle of system performance with the open world action-adventure title, Shadows of Mordor. Produced by Monolith using the LithTech Jupiter EX engine and numerous detail add-ons, SoM goes for detail and complexity to a large extent, despite having to be cut down from the original plans. The main story itself was written by the same writer as Red Dead Redemption, and it received Zero Punctuation’s Game of The Year in 2014.
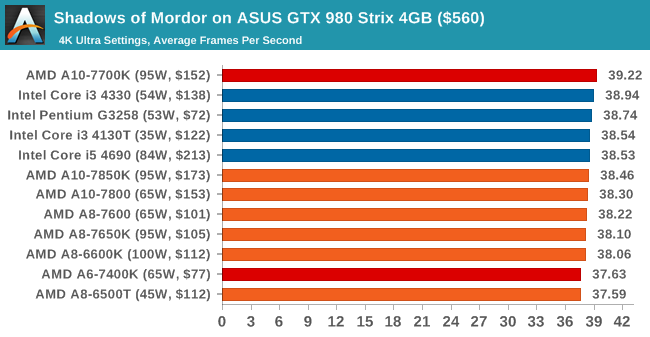
For testing purposes, SoM gives a dynamic screen resolution setting, allowing us to render at high resolutions that are then scaled down to the monitor. As a result, we get several tests using the in-game benchmark. For low end graphics we examine at 720p with low settings, whereas mid and high end graphics get 1080p Ultra. The top graphics test is also redone at 3840x2160, also with Ultra settings, and we also test two cards at 4K where possible.

![Shadows of Mordor on MSI R9 285 Gaming 2GB ($240) [Minimum FPS]](https://images.anandtech.com/graphs/graph9287/74558.png)
![Shadows of Mordor on ASUS GTX 980 Strix 4GB ($560) [Minimum FPS]](https://images.anandtech.com/graphs/graph9287/74592.png)
I added some 4K numbers here, just to see the difference at a higher resolution. It turns out that for average frame rates at least, Shadows of Mordor is CPU agnostic. A fast CPU gets a higher rating in minimum frames however.
AMD A10-7700K and AMD A6-7400K Conclusion
I started this mini-review stating that the question of the number of processors that both Intel and AMD produce all seem to differ by 100 MHz and $7, and that I had received questions as to why this is the case. Ultimately a lot of recommendations for computer components start to revolve around ‘Well for $10 more, you could get this’, and at some point you are considering something that costs $50 more. There has to be a point where you stop, especially if an IT department or system builder wants to go through and develop 200+ machines in a month.
Intel and AMD currently have different approaches to this. Intel likes to launch a big part of its stack all at once. Sometimes it will launch individual units outside this, or it will start a new line-up with one or two units then introduce the bulk later. With Haswell for example, on the socketed CPU space, we have 50 different CPUs varying in price, power, frequency, core count, threading and integrated graphics. Imagine the poor reviewer that has to test them all (insert here that I’d love to test them to get all the data, if I had time and could source them)!
AMD’s approach to Kaveri is to dribble rather than gush. Rather than overload the user base (both end-users and commercial) with a large haystack of parts, they launched two or three SKUs on day one, then one or two every 6-12 weeks since. This has some benefits, namely the improvement of the production process over time, the repeated opportunities to market new products and the opportunity to re-educate potential clients through the media. The downside of this strategy is one similar to starting with Swiss cheese and then filling in the holes – if a client wants a SKU with particular characteristics but the company does not have it, then they will go look for something else and take their money with them. It’s a method that acts as a double edged sword.
As AnandTech’s CPU editor, I get to play with a lot more SKUs than most. This means both the big shiny halo products, such as the 8-core goliaths, but also some of the higher volume dual core stuff which is more in line with a budget PC or mass PC build. With AMD’s strategy, as they have fewer processors overall, our coverage can be a little more complete than the others. AMD sampled us both the A10-7700K and the A6-7400K for this purpose, and we hope to work closely with them for future launches and get the best comparison list of their product stack.
Back to the SKUs tested for this mini-review, we can tell that the A10-7700K keeps up with the other A10 parts in our CPU testing, but as it has two fewer compute units in the integrated graphics it can lag behind a little and is more in line with the A8 processors in that regard, essentially making it more of a hybrid part. The A6-7400K fits into that budget CPU line at $64, and the results show this in both our CPU and GPU testing. The single module performs well enough in single threaded environments, but doesn’t have enough legs for the big tasks and can be swamped easily. Despite having two threads, the Bulldozer based design still has single-threaded like behavior in some tests. That being said, the graphics tests are a mixed bag. For titles that can use more threads, I can’t help but feel that it is a little held back, even at 256 SPs. For other titles, it performs on par with other processors almost double its price. Dual Graphics mode unfortunately was not possible with the A6, and it was also noticeable that some games (Shadows of Mordor in particular) took longer to load with only one module.
To say AMD’s APUs are like marmite (you either love them or hate them) is to gloss over a more complex issue. AMD’s design has its plus points and its negative points, a fact that AMD marketing knows when I speak to them. Nevertheless, they have to focus on the plus points, which include gaming at equivalent price points, DX12 support, OpenCL performance and moving forward with HSA. Using the right tool for the right job should now be considered a cliché, but it rings true when it comes to technology and more so than ever when innovative methods are continually being fashioned. Based on AMD’s Financial Analyst Day and their recent exposure into HBM (I highly suggest reading Ryan’s awesome writeup on it), I can safely say that I want to see an APU with HBM in the future. Despite the inevitability that AMD already know that people want one, I told them anyway. We will have to wait and see.


