Original Link: https://www.anandtech.com/show/7567/smartphone-audio-quality-testing
Smartphone Audio Quality Testing
by Chris Heinonen on December 8, 2013 5:15 PM EST- Posted in
- Audio
- Smartphones
- Mobile
- Tablets
- Testing
We spend a lot of time watching and listening to our smartphones and tablets. The younger you are the more likely you are to turn to them for watching a movie or TV show instead of an actual TV. For a lot of us it is our primary source of music with our own content or streaming services. Very rarely when new phones or tablets are announced does a company place any emphasis on the quality of the audio.
Display quality also used to receive very little attention. As more and more people reported on the display performance, more companies started to take notice. Now benefits like “Full sRGB gamut” or “dE < 3” are touted on new products. So now we are going to introduce a new set of testing for smart phones and tablets, audio performance.
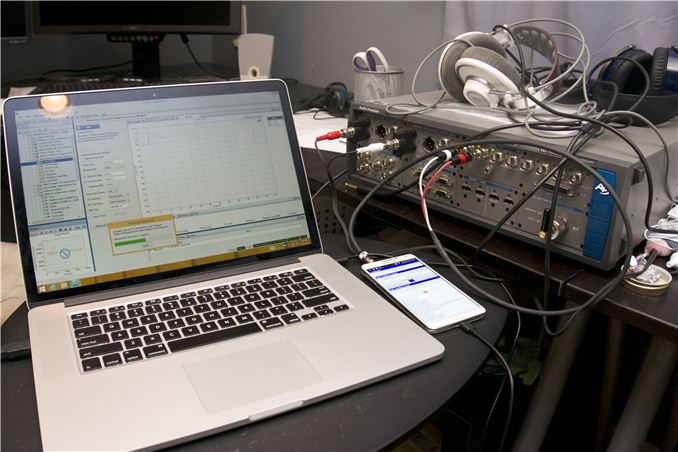
To do this right we went to the same company that all the manufacturers go to: Audio Precision. Based out of Beaverton, OR, Audio Precision has been producing the best audio test equipment out there for over 25 years now. From two channel analog roots they now also test multichannel analog, HDMI, Optical, Coaxial, and even Bluetooth. Their products offer resolution that no one else can, which is why you will find them in the test and production rooms of almost any company.
Just recently they introduced a brand new set of audio tests for Android devices. Combined with one of their audio analyzers, it allows us to provide performance measurements beyond what has been possible before. Using an Audio Precision APx582 analyzer we set out to analyze a selection of Android phones to see what performance difference we can find. More phones and tablets will follow as these tests can be run.
The Test Platform
The test platform is the Audio Precision APx series of audio analyzers. For this initial set of tests I used an APx 582 model, which has two analog outputs and 8 channels of analog inputs. The outputs are not necessary as all of the test tones are provided by Audio Precision for playback on the devices. For each set of tests we can add a load, simulated or real, to see how the device handles more demanding headphones. For this article I am sticking with only a set of the updated Apple Earbuds. They are probably the most common headphone out there and easy to acquire to duplicate testing. For future tests the other loads will be AKG K701 headphones and Grado SR60 headphones. Both models are popular, and I happen to own them.
There are a few main tests we are going to use for all these reviews. Those key tests are maximum output level, Total Harmonic Distortion + Noise (THD+N), Frequency Response, Dynamic Range (as defined by AES17), and Crosstalk. These tests are the exact same ones that manufacturers will be running to verify their products. Most of these tests will be run at maximum output levels. Most amplifiers perform best at close to their maximum levels, as the residual noise compared to the signal decreases, and so that is what they are typically tested at.
We might add more tests as we decide they are relevant to our testing. I will also attempt to go back and fill in as much data as possible from previously reviewed devices as time permits. Now to look at the tests and see our results for our initial set of phones.
THD+N is a measure of the total harmonic distortion and noise compared to the signal. The lower the number, the less distortion and noise there is relative to the fundamental frequency. THD+N is measured by driving a 1 kHz sine wave at maximum volume. Because there is always some inherent background noise, the THD+N is almost always lowest at maximum output so that is used for the measurement.
There are two results that we take from this: a sine wave and a FFT spectrum. On the sine wave both channels should line up perfectly, and it should be as close to an accurate sine wave as possible. On the FFT we want to see a peak at 1 kHz and everything else as low as possible. The most common artifact you will see are harmonic sidebands at multiples of 1 kHz.
For an example of data that looks good, here is the sine wave of the iPhone 5. We see a sine wave that is good, with channels that overlap perfectly and no deviation. This is what we expect to see.
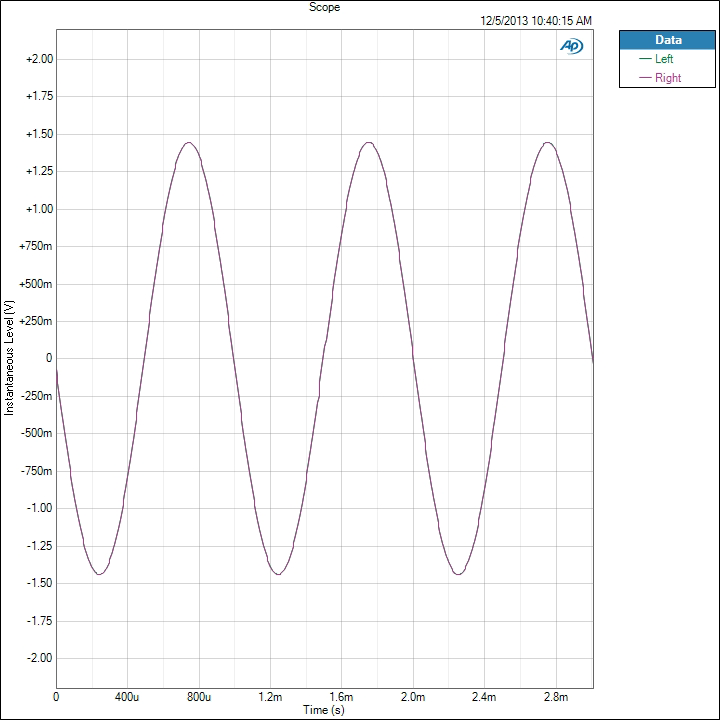
Now for a different example we look at the Nexus 5. Run at maximum volume we see that the left channel is clipping in the sine wave. Likely the power to the headphone amplifier is not enough to drive both channels and so this is the result. UPDATE: Tested this with 4.4.1 and no change.
The iPhone 5 produces a THD+N ratio of 0.003134% while because of the clipping, the Nexus 5 is producing 13.789197%. Any level over 1% is considered to be past the clipping point of an amplifier and it seems that the Nexus 5 cannot be driven at maximum volume. I tested two samples to verify, and on both the performance is identical.
Now if we look at the FFT for this test, we see how this distortion is showing up. First, the iPhone 5 is very quiet.
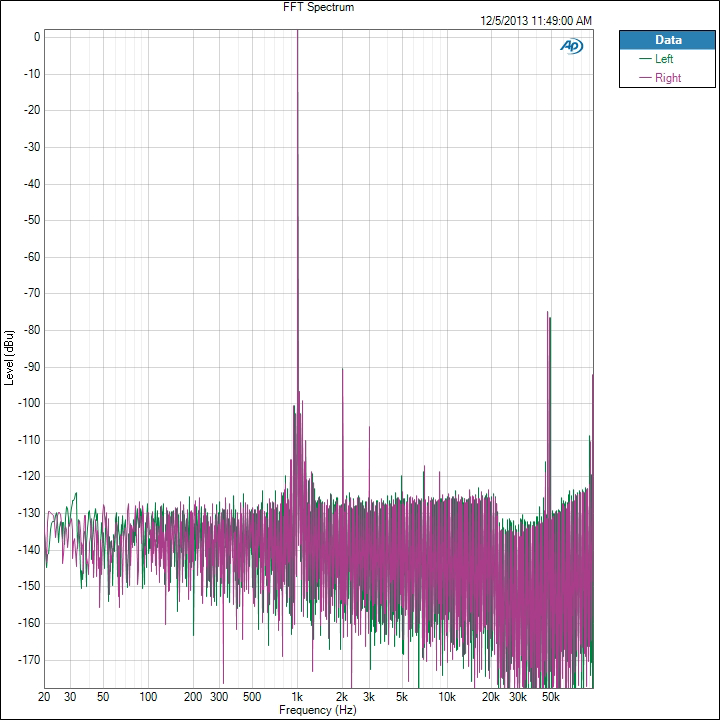
There is a 2 kHz peak that is -93 dB below the fundamental frequency, and the 3rd harmonic at 3 kHz is over -109 dB below it. All the harmonics past that are at -120 dB below the fundamental tone. There is some noise out at 50 kHz but this is so far past the level of human hearing that it is safely ignored. Now the Nexus 5 FFT.
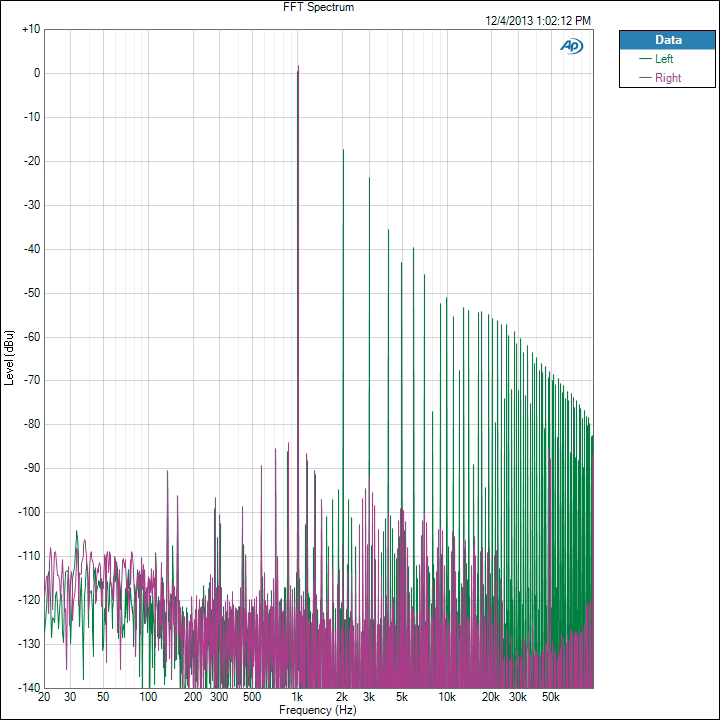
We see the right channel, which didn’t clip, looks good. The 2nd harmonic is -111 dB and the 3rd harmonic is -93 dB. On the left channel the 2nd harmonic is only -18 dB and the 3rd harmonic is -24 dB. Even at the 9th harmonic we are still only -52 dB below the fundamental tone. This is causing these incredibly high THD+N numbers that we are seeing on the Nexus 5. We will see more detail of this on a later test as well.
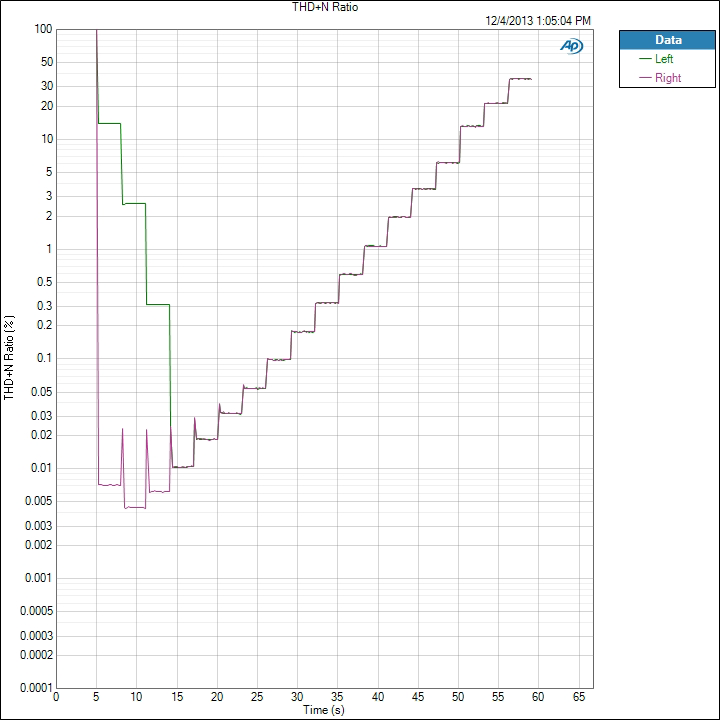
We also chart THD+N vs. Frequency. Here is the chart for the Note 3.
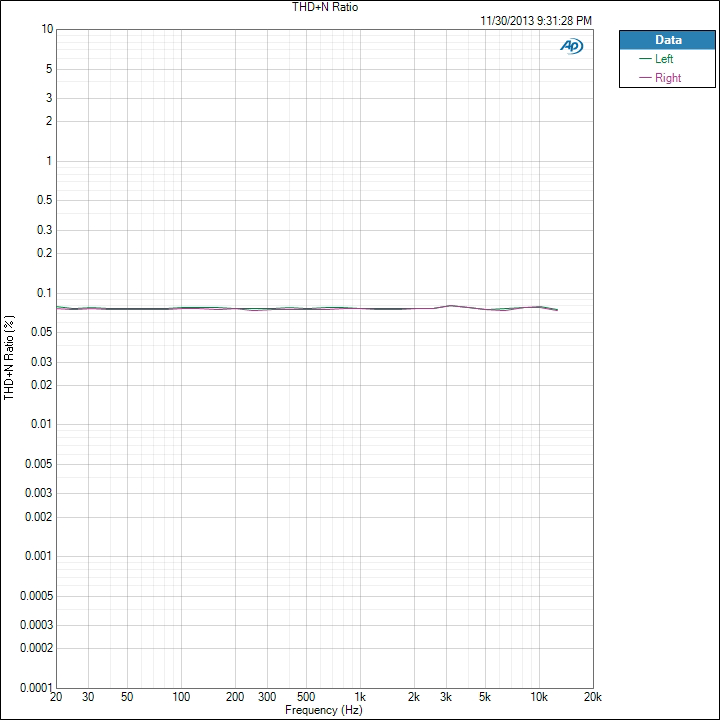
We see that THD+N is basically right below 0.08% for the whole spectrum. It moves up and down slightly, but is very constant. Now here is that Nexus 5 data.
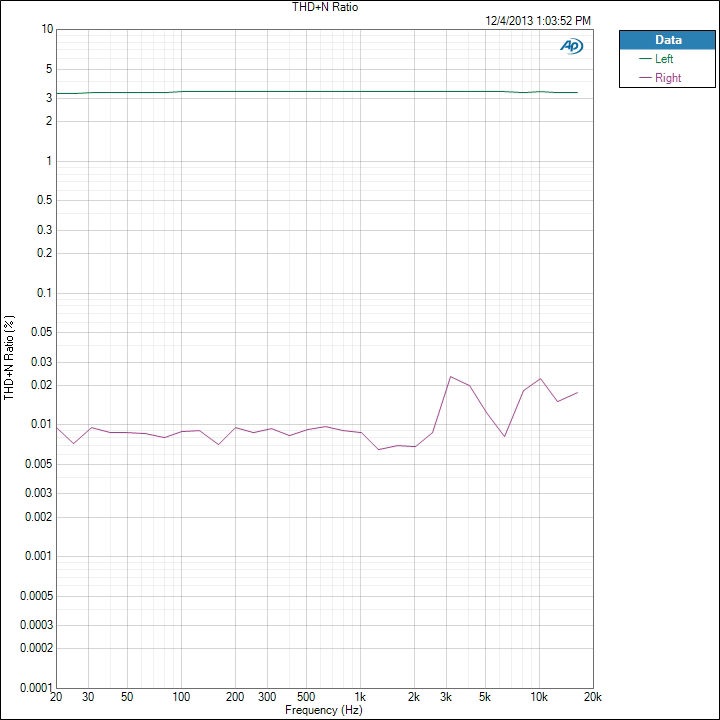
We see that the right channel is around 0.01% THD+N while the left channel, the clipped one, is over 3%. If we ran the Nexus 5 at a lower volume level we would see totally different results, as you’ll find out later, but this is how devices are typically measured.
Maximum Level
The maximum output level is derived from the 1kHz test tone used to determine THD+N. The higher the output from the headphone jack, the louder it can drive a pair of headphones. More importantly, having more power available means when you have dynamic music passages that call for power you are less likely to clip the waveform.
There is no chart to show here, just a number that the Audio Precision gives us. In our test data, the most powerful phone was the iPhone 5, at 32.46 mW of power. Next is the Nexus 5 at 22.24 mW, though we can’t drive it that high. Then the Note 3 at 11.81 mW and finally the Galaxy S4 at 3.895 mW. Doubling the power, from 4 mW to 8 mW, produces a 3 dB increase in volume level. 3 dB is the smallest change in volume levels we can easily hear. So even though the iPhone 5 produces 32 mW vs. 4 mW, that is only a 9 dB difference in volume. 10 dB is doubling the volume, so it isn’t even twice as loud. If you have demanding headphones, you will want as much power as you can get.
Frequency Response
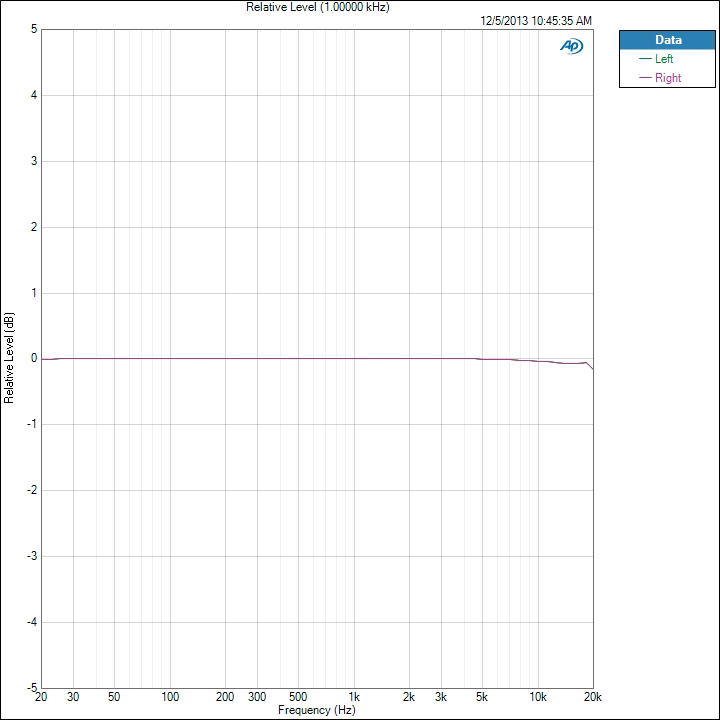
To measure the frequency response we measure a set of 61 tones from 20 Hz to 20 kHz. All of these are then equalized to 1 kHz so we can see the maximum deviation from that level. An ideal phone will be perfectly flat here and allow you to adjust this with an EQ setting, or though your taste in headphones. On this test our best performing phone is the Galaxy S4, as seen here.
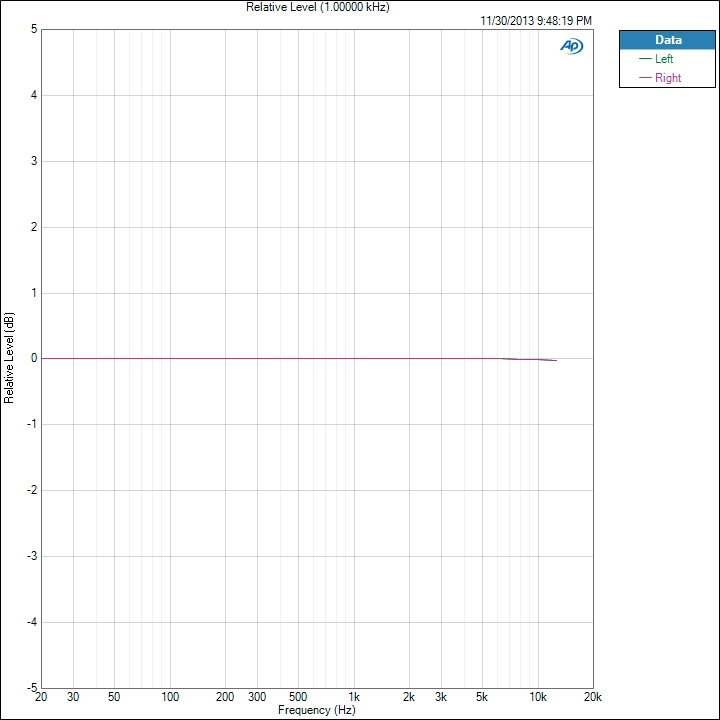
The total variation from 1 kHz is only 0.014 dB which is very good. The worst performing phone is the iPhone 5, but its variation is only 0.089 dB.
The iPhone 5 also picked up the 20 kHz tone while the Samsung and many others missed it. If we dropped this tone then it might be just as flat. The iPhone 5 test was run slightly differently, as it can't run the Android test program, which might account for this. For a phone with a different response, here is the HTC One with Beats enabled. Other HTC One testing is still in progress as I write this article.
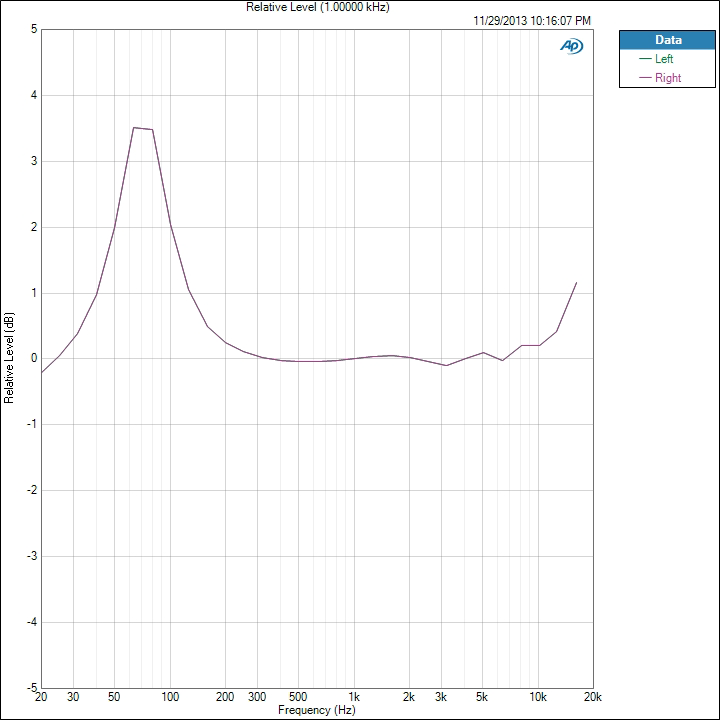
Here we see that Beats is adding a +3.5 dB boost from 60 Hz to 90 Hz, but the deviation from 0 dB goes from 30Hz to 300 Hz. Past 6.5 kHz we also see a rise in the treble. People often mistake boosted treble for extra detail, which is likely the reasoning behind this. As we see it is far different than the other two examples we looked at.
Dynamic Range
The dynamic range of the phone indicates the difference between the loudest possible sound and the background noise. The more residual noise in the background, the lower the dynamic range. Phones with more powerful amplifier sections will typically produce a greater dynamic range. The residual noise level is often constant, so as the overall volume level increases the difference between the music and the noise increases as well.
The best performer here is the iPhone 5 again, with 92.214 dB of range. The worst is the Nexus 5 with only 89.332 dB. A difference of 3 dB is not something I would concern myself over. If we see a phone or tablet that drops down below 80 dB then I will start to show more concern.
Crosstalk
Crosstalk, like dynamic range, is just a number here. This is the measurement how much signal leaks from one channel into another. If an instrument should only be in the right ear, some of that signal will leak into the left ear, but we want that as low as possible. The results are expressed in -dB, or how much quieter one ear is than the intended ear.
On the Note 3 we see a wonderful crosstalk measurement of -117.2 dB so the sounds in one ear are -117 dB quieter in the other ear. This makes them impossible to hear. The worst is the iPhone 5, with only -75.624 dB of isolation.
Stepped Response
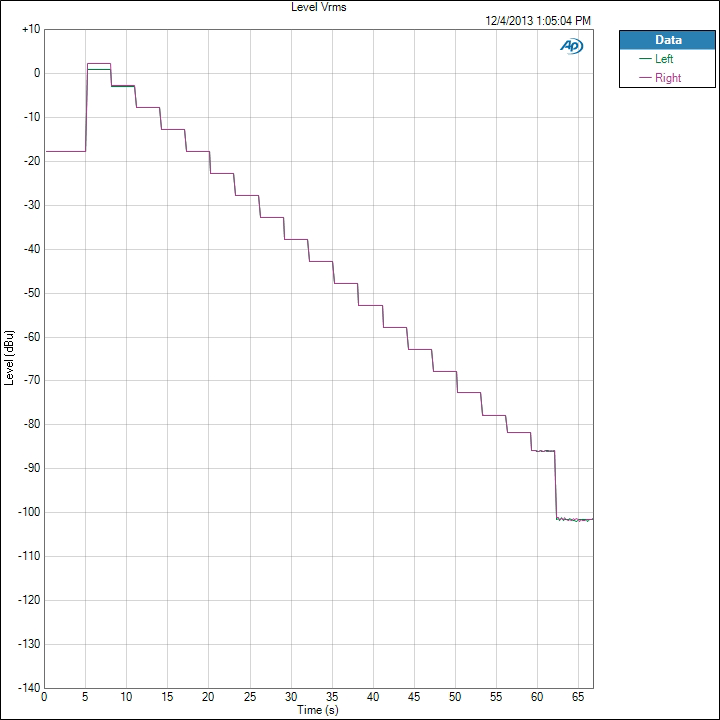
The stepped response uses a 1 kHz 0 dBFS tone but measures output level from maximum volume to minimum volume. We can see how large the volume steps are and how many there are. It doesn’t produce a number we can use, but it ties back into our other results. For a good example, we can look at the Note 3.

We see steps that are around -5 dBu each. The final level is muted and just the background noise of the device. Each step is clean and even but as we get lower and lower we see noise start to intrude. This is the background noise starting to become audible in the signal. The flatter the levels are, the quieter it will be. Now, let us look at the Nexus 5.
Notice at the very top how the right and left channels do not overlap. That is the clipping we talked about at the very beginning. It isn’t until the 4th volume setting that the level difference is down to nothing. Because of this, I would consider the top 3 volume settings of the Nexus 5 as ones that should be avoided. They each have enough THD+N introduced into them that it will sound poor, and one ear will be louder than the other.
In many of the examples you have seen so far, you notice that the Nexus 5 has a large issue with the left channel at peak volume levels. As Brian mentions in his Nexus 5 review, it is based on a similar platform to the LG G2 but it isn't identical. Because there are similarities I want to test it out and see if it has the same issue that I see on the Nexus 5.
The test that is causing the large issue on the Nexus 5 is a 1 kHz sine wave, at -0dBFS, at maximum volume. This is the loudest sound that any device will be asked to produce. If you're familiar with the trends in music mixing the past two decades you'll know that a peak of -0dBFS is not all that uncommon now. This chart at NPR shows the average and peak levels for the most popular songs over the past thirty years. Two decades ago testing for -0dBFS might not have been important but it is now. So lets look at this image from the Nexus 5 again.
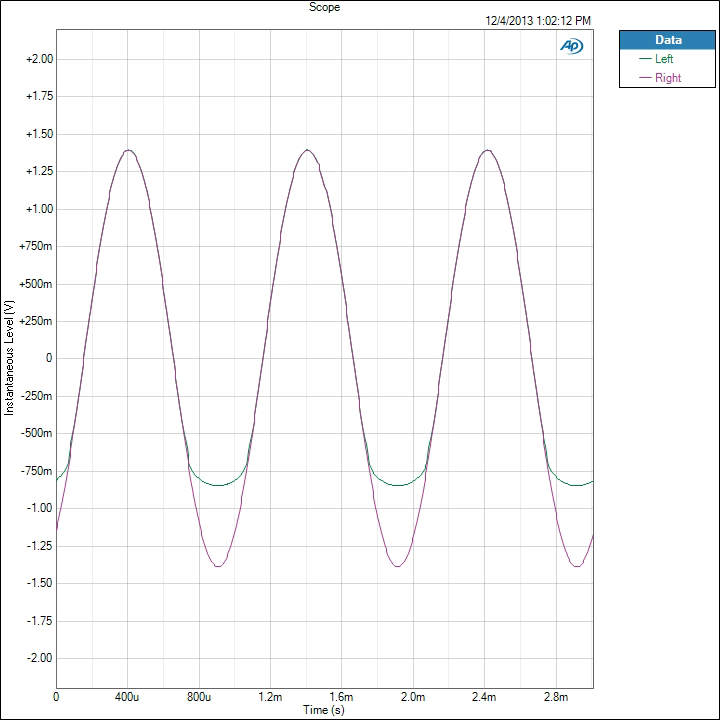
Now for comparison, we will look at the LG G2.
This looks much better. However the LG G2 is still putting out 0.546528% THD+N into the left channel while only outputting 0.003338% into the right channel. So there is still some imbalance going on here. So why is the issue so much less on the G2 than on the Nexus 5?
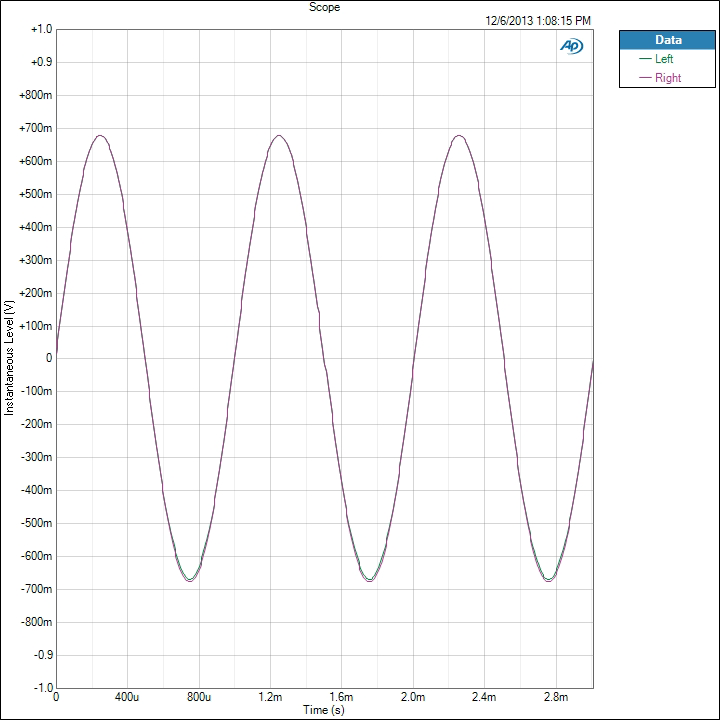
The key to this is looking at the scale on the graphs here. While the Nexus 5 peaks are up close to 1.3-1.4V, the G2 has peaks that don't even reach 700mV. Looking at the actual numbers the G2 has a Vrms level of 475.3 mVrms while the Nexus 5 checks in at 843.6 mVrms for the left channel and 982 mVrms for the right channel. The G2 is placing far less stress on its headphone amplifier and keeping it from the output levels that cause this excessive clipping in the Nexus 5.
To look in more detail, we have THD+N Ratio charts for the stepped level sweep that we looked at earlier. First, lets look at the Nexus 5.
We see that the first three volume levels, 15-13, have THD+N distortion over 0.3% for the left ear, while they are below 0.01% for the right ear. From level 12 and below the THD+N levels are practically equal. Now to see how this data on the G2 looks.

We see the first volume step has 0.55% THD+N or so for the left ear, but the right ear is down at a similar level to level 14 on the Nexus 5. The next step drops it to 0.03% which is way, way below where it is on the Nexus 5 at that point. By step 13 they are equal.
The conclusion I pull from this is that both the G2 and the Nexus 5 have the exact same flaw right now. However, the G2 has attempted to hide it by reducing the maximum output level of their headphone amplifier. The Nexus 5 can play louder, but only with far more distortion. Given this I would expect there to be an update to the Nexus 5 at some point that lowers the maximum headphone level to something closer to the G2.
However this doesn't mean that the Nexus 5 is certainly worse to use with headphones. The top 3 settings are ones I would avoid due to the left channel issue, but I might avoid the top 1-2 settings on the G2 as well. If we consider 1% THD+N to be the maximum allowable level, that leaves 8 volume steps on the Nexus 5 that are usable. The G2 has 9 steps that are available to you, and 10 if you consider 0.03% THD+N in one ear to be OK (it probably is).
In the end, the G2 won't play as loud as the Nexus 5 will, but you don't want to play that loud anyway. It has more usable volume steps than the Nexus 5, and otherwise very similar numbers. I'll be interested to see if either of them make further changes to their maximum output levels to remove this issue.
Right now we have full data on four phones and partial data on a few more. We are working to compile as much data as possible to provide an overall look at the quality of audio from smartphones available today. The largest difference in current models is the power of the headphone output as some are much better equipped to drive more demanding headphones than others. As we compile data on more and more products we hope to see more differences arise.
We also have not seen much difference with different loads applied to the headphones. We will continue to test all three sets of headphones but the data here is for the Apple Earbuds. If different loads provide different results, then we will certainly report those different numbers in the future. It also appears that running Android phones in the automated routine causes the 20 kHz tone to be left out of the frequency response test. Humans usually can't hear this, I certainly can't, and so there isn't a huge amount of real-world ramification to this. It causes the reported THD+N to exclude that tone and provides a better result that phones that play it back. For the future, this will be done manually.
Here are the four phones we currently have, and more phones are being tested and reported on as quickly as possible to be added here.


Many readers have been asking for audio testing on phones and tablets, and we are happy to be able to deliver it now. Because I live far away from Brian and Anand, I can’t easily access units they are reviewing so audio data may not run the same day a review is published. I do hope to be able to add it on to everything in the future so that all of our reviews will be as in-depth as possible, from processor to software, display to audio.
I also have to thank Audio Precision for their loan of the APx582 and their access to their offices and support staff. Without that these tests would not be possible. I also wanted to use their equipment as it is the reference standard for the industry and there can be no doubt about its quality. As I do a lot of AV testing as well, I found that more generic sound card methods of testing are becoming limited as the capabilities of products exceeds what they can easily measure. There are no such worries with the Audio Precision.
I also look forward to feedback from readers on the information here, and what else you would like to see tested going forward. Hopefully this will provide another set of data to help you determine if a product will fit your needs, and which vendors are trying to push performance in all categories.


