Original Link: https://www.anandtech.com/show/7337/corsair-force-ls-240gb-review
Corsair Force LS (240GB) Review
by Kristian Vättö on September 25, 2013 12:00 AM EST
Like many manufacturers without a NAND fab or controller technology, Corsair's SSD portfolio has focused a lot on SandForce based SSDs, but Corsair has been exploring other options as well. Corsair has used controllers from SandForce, Marvell, LAMD and even Indilinx if we go all the way back to SATA 3Gbps times. In other words, that's most of the licensable controllers, although two of them are now out of the licensing game as Indilinx is owned by OCZ and SK Hynix acquired LAMD a while back (technically you can still get a license for LAMD's controllers but SK Hynix forces you to use their NAND).
With fewer controllers available to license, the times for OEMs like Corsair are getting tougher. The SandForce SSD market is still extremely competitive due to the fact that so many OEMs are using SandForce's controllers and the room for differentiation is more or less non-existent. In order to keep their SSD lineup versatile and competitive, Corsair had to look elsewhere for the controller.
The controller manufacturers are not limited to the ones we usually see and there are a handful of options if you're willing to try a not-so-proven solution. As a result Corsair has partnered with Phison for the Force LS. Phison isn't a completely unknown player in the mainstream SSD market as Crucial used their PS3105 controller in their V4 SSD, but that didn't turn out too well. (In short, the V4 was among the slowest SSDs we have ever tested.) MyDigitalSSD has relied heavily on Phison's controllers but again performance isn't particularly compelling. Out of the bigger SSD OEMs, none has given Phison a chance until now.
Phison's big draw is obviously pricing. Licensing SandForce is relatively expensive and there's not much room left for profit margin if you want to price your SSD competitively (which is what you need to do if you want to get sales). Marvell is a more cost efficient option but all you get is the silicon with no firmware or software stack (whereas a SandForce license includes all that). If you have a team of engineers capable of providing a competitive firmware, Marvell can be a good choice; if not, Marvell is not your cup of tea. Phison's business model is similar to SandForce, i.e. they deliver you the whole package, making them a viable option for OEMs without a firmware engineering team. Unfortunately I don't have any specific numbers but I believe Phison's solutions are noticeably cheaper than SandForce's. I don't think Phison's silicon itself is very high power, making it cheap to fab and Phison's controller/firmware as a whole is not as complex as SandForce's, which reduces engineering and validations costs.
| Corsair Force LS Specifications | |||
| Capacities (GB) | 60, 120, 240 | ||
| Controller | Phison PS3108 | ||
| NAND | 19nm Toshiba MLC | ||
| Sequential Read | 560MB/s | ||
| Sequential Write | 535MB/s | ||
| 4KB Random Read | 50K IOPS | ||
| 4KB Random Write | 62K IOPS | ||
| Power (max/idle) | 4.6W / 0.6W | ||
| Warranty | 3 years | ||
Specification wise the Force LS is a close match to MyDigitalSSD's BP4, although that shouldn't come as a surprise since the two share the same hardware. Corsair is offering the Force LS in only three capacities, topping out at 240GB, which is fairly typical for budget SSDs. The controller can support larger capacities (MyDigitalSSD offers a 960GB BP4) but the idea behind offering limited capacities is to steer buyers of higher capacity SSDs towards the more expensive models (like Neutron GTX).
Interestingly, the Force LS will not be available in the US at all. That's unusual since components are rarely region specific unlike e.g. mobile phones where technical and operator limitations come into play. While this is atypical, I can see Corsair's reasoning behind the decision. The US SSD market is way more populated than for example the European market. Most of the smaller manufacturers don't have supply channels in Europe so the market is really dominated by the few big manufacturers that have presence everywhere. With fewer smaller players in the market, I think Corsair saw a niche for a low cost SSD and decided to concentrate on the market where it has the biggest potential.
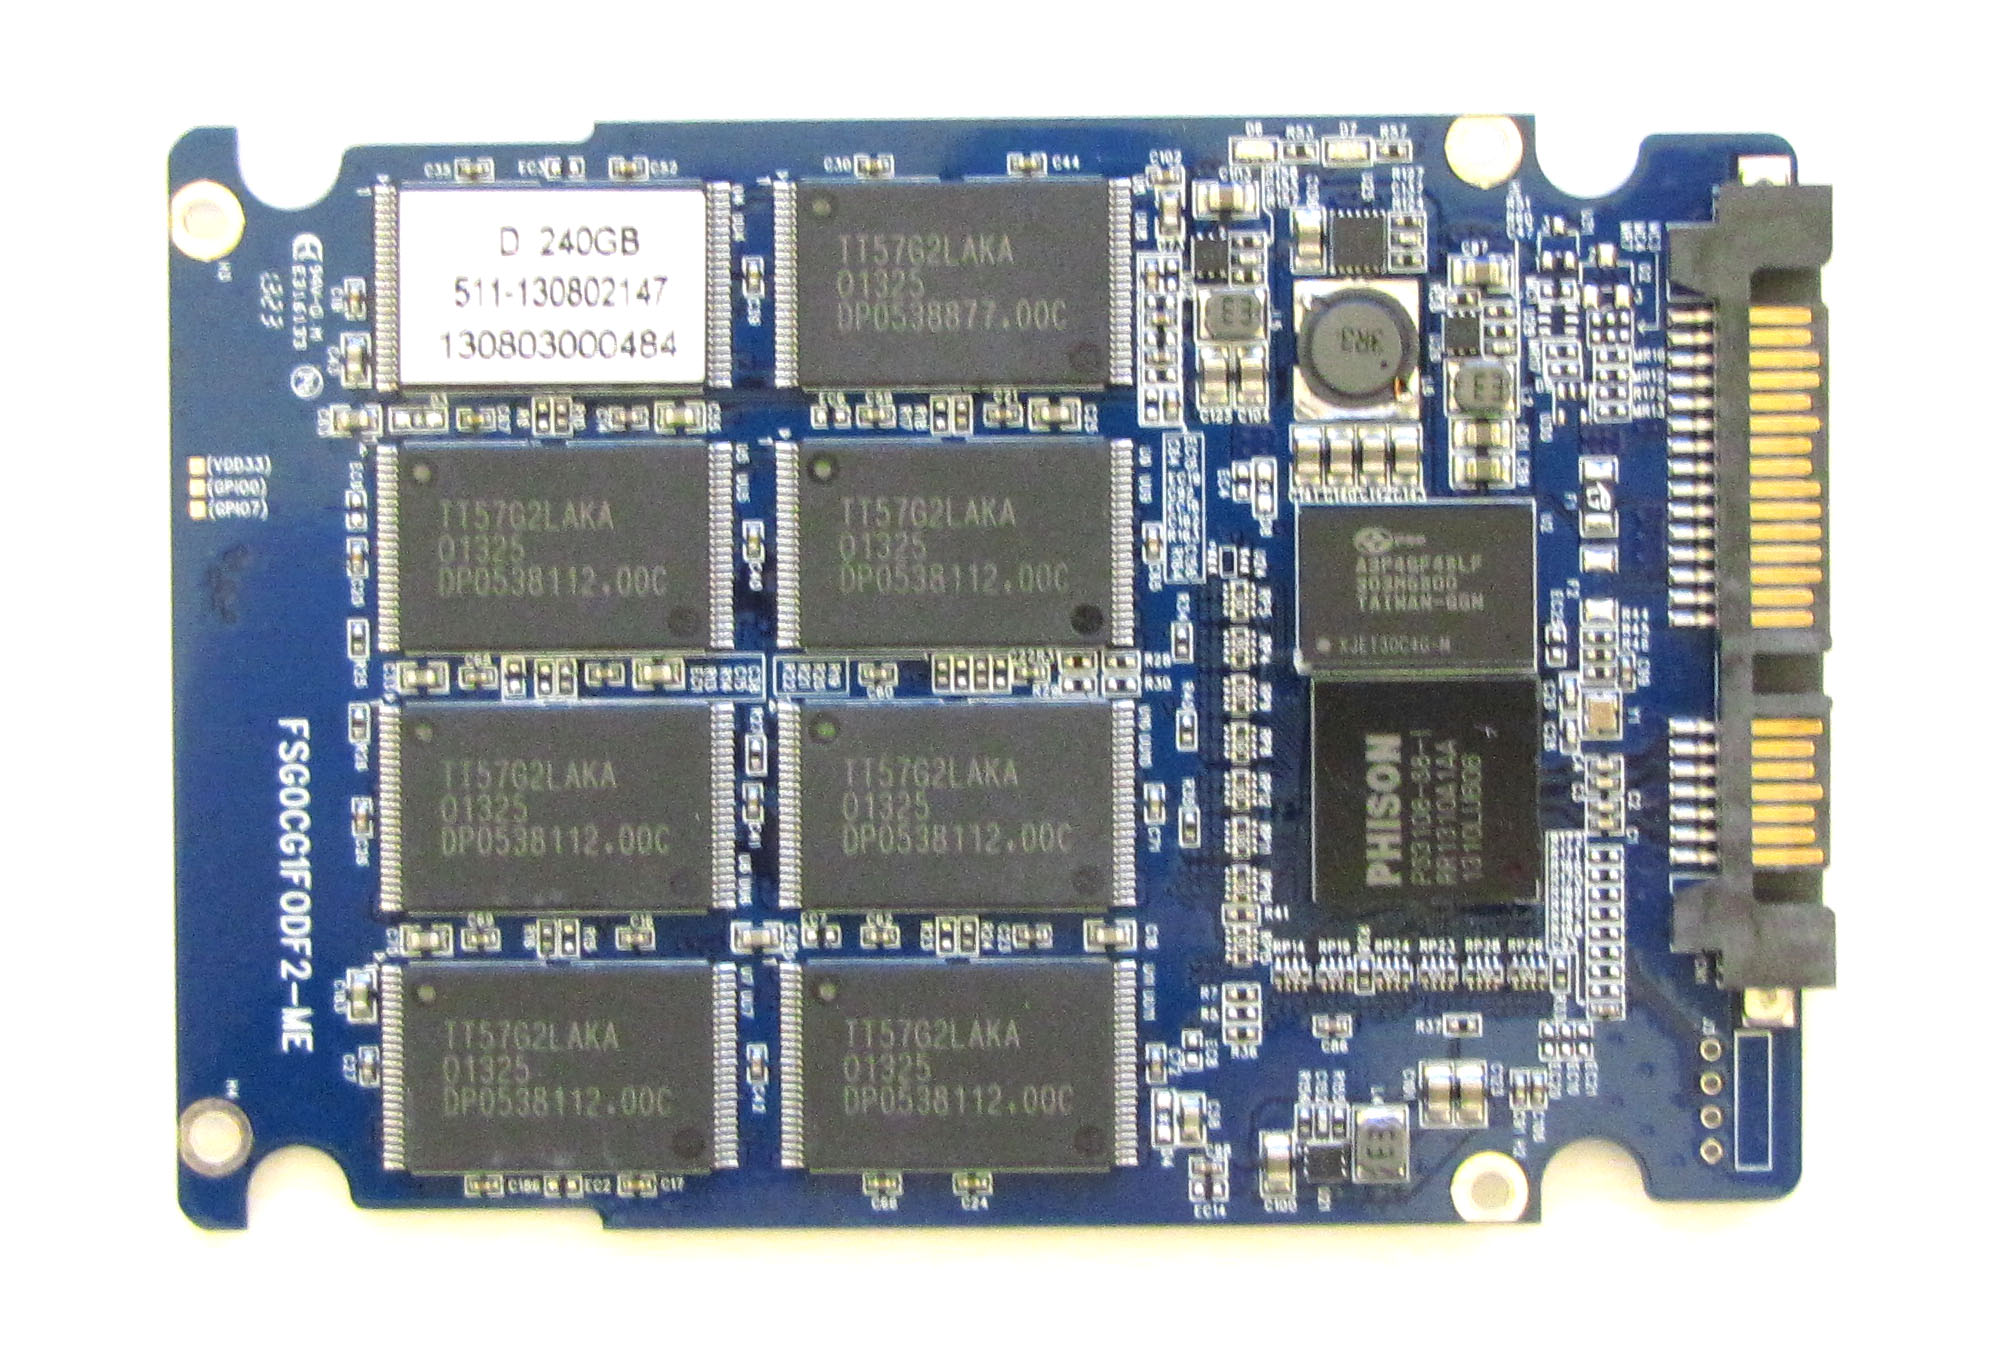
Internally the Force LS consists of 16 NAND packages (eight per side), which works out to be 16GB per package (i.e. each package has two 8GB dies). There's also 512MB of DRAM from Powerchip Technology (the smaller SKUs have 256MB). The firmware is currently a stock version straight from Phison and my review sample shipped with version 5.8. For comparison, the firmware in MyDigitalSSD's BP4 was 4.3, so I would expect some improvement compared to the BP4.
Test System
| CPU | Intel Core i5-2500K running at 3.3GHz (Turbo and EIST enabled) |
| Motherboard | AsRock Z68 Pro3 |
| Chipset | Intel Z68 |
| Chipset Drivers | Intel 9.1.1.1015 + Intel RST 10.2 |
| Memory | G.Skill RipjawsX DDR3-1600 4 x 8GB (9-9-9-24) |
| Video Card |
XFX AMD Radeon HD 6850 XXX (800MHz core clock; 4.2GHz GDDR5 effective) |
| Video Drivers | AMD Catalyst 10.1 |
| Desktop Resolution | 1920 x 1080 |
| OS | Windows 7 x64 |
Thanks to G.Skill for the RipjawsX 32GB DDR3 DRAM kit
Performance Consistency
In our Intel SSD DC S3700 review Anand introduced a new method of characterizing performance: looking at the latency of individual operations over time. The S3700 promised a level of performance consistency that was unmatched in the industry, and as a result needed some additional testing to show that. The reason we don't have consistent IO latency with SSDs is because inevitably all controllers have to do some amount of defragmentation or garbage collection in order to continue operating at high speeds. When and how an SSD decides to run its defrag and cleanup routines directly impacts the user experience. Frequent (borderline aggressive) cleanup generally results in more stable performance, while delaying that can result in higher peak performance at the expense of much lower worst-case performance. The graphs below tell us a lot about the architecture of these SSDs and how they handle internal defragmentation.
To generate the data below we take a freshly secure erased SSD and fill it with sequential data. This ensures that all user accessible LBAs have data associated with them. Next we kick off a 4KB random write workload across all LBAs at a queue depth of 32 using incompressible data. We run the test for just over half an hour, nowhere near what we run our steady state tests for but enough to give a good look at drive behavior once all spare area fills up.
We record instantaneous IOPS every second for the duration of the test and then plot IOPS vs. time and generate the scatter plots below. Each set of graphs features the same scale. The first two sets use a log scale for easy comparison, while the last set of graphs uses a linear scale that tops out at 40K IOPS for better visualization of differences between drives.
The high level testing methodology remains unchanged from our S3700 review. Unlike in previous reviews however, we vary the percentage of the drive that gets filled/tested depending on the amount of spare area we're trying to simulate. The buttons are labeled with the advertised user capacity had the SSD vendor decided to use that specific amount of spare area. If you want to replicate this on your own all you need to do is create a partition smaller than the total capacity of the drive and leave the remaining space unused to simulate a larger amount of spare area. The partitioning step isn't absolutely necessary in every case but it's an easy way to make sure you never exceed your allocated spare area. It's a good idea to do this from the start (e.g. secure erase, partition, then install Windows), but if you are working backwards you can always create the spare area partition, format it to TRIM it, then delete the partition. Finally, this method of creating spare area works on the drives we've tested here but not all controllers are guaranteed to behave the same way.
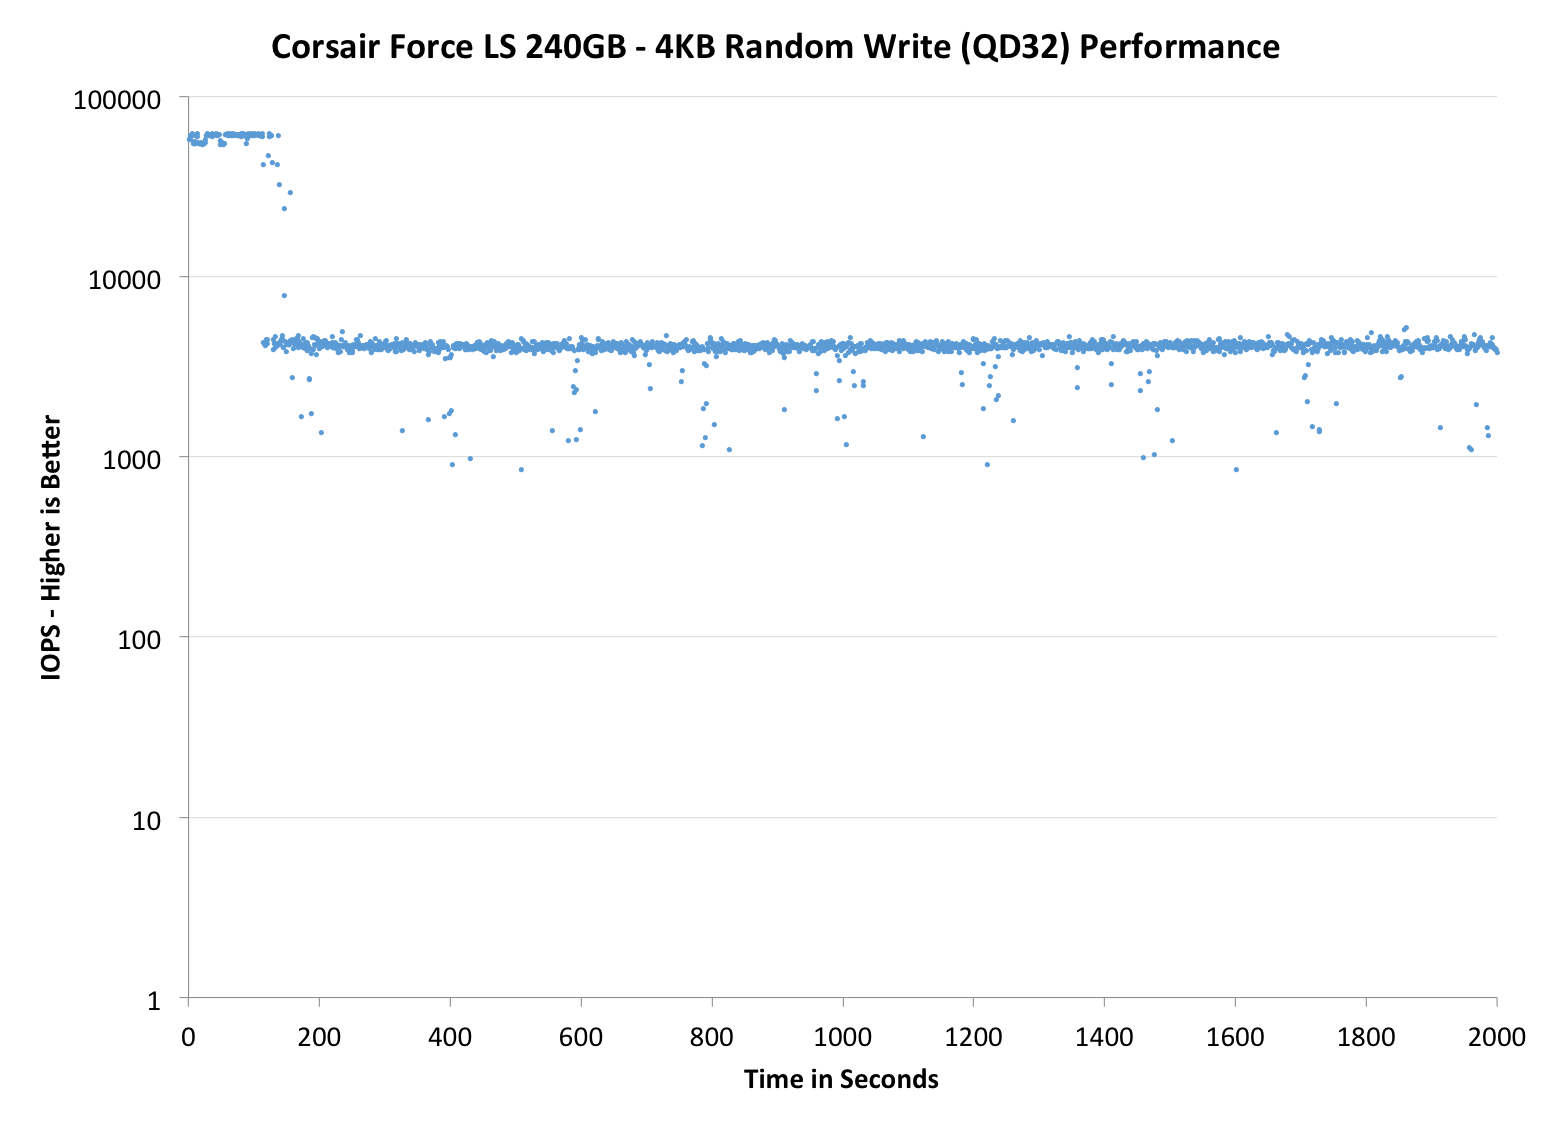
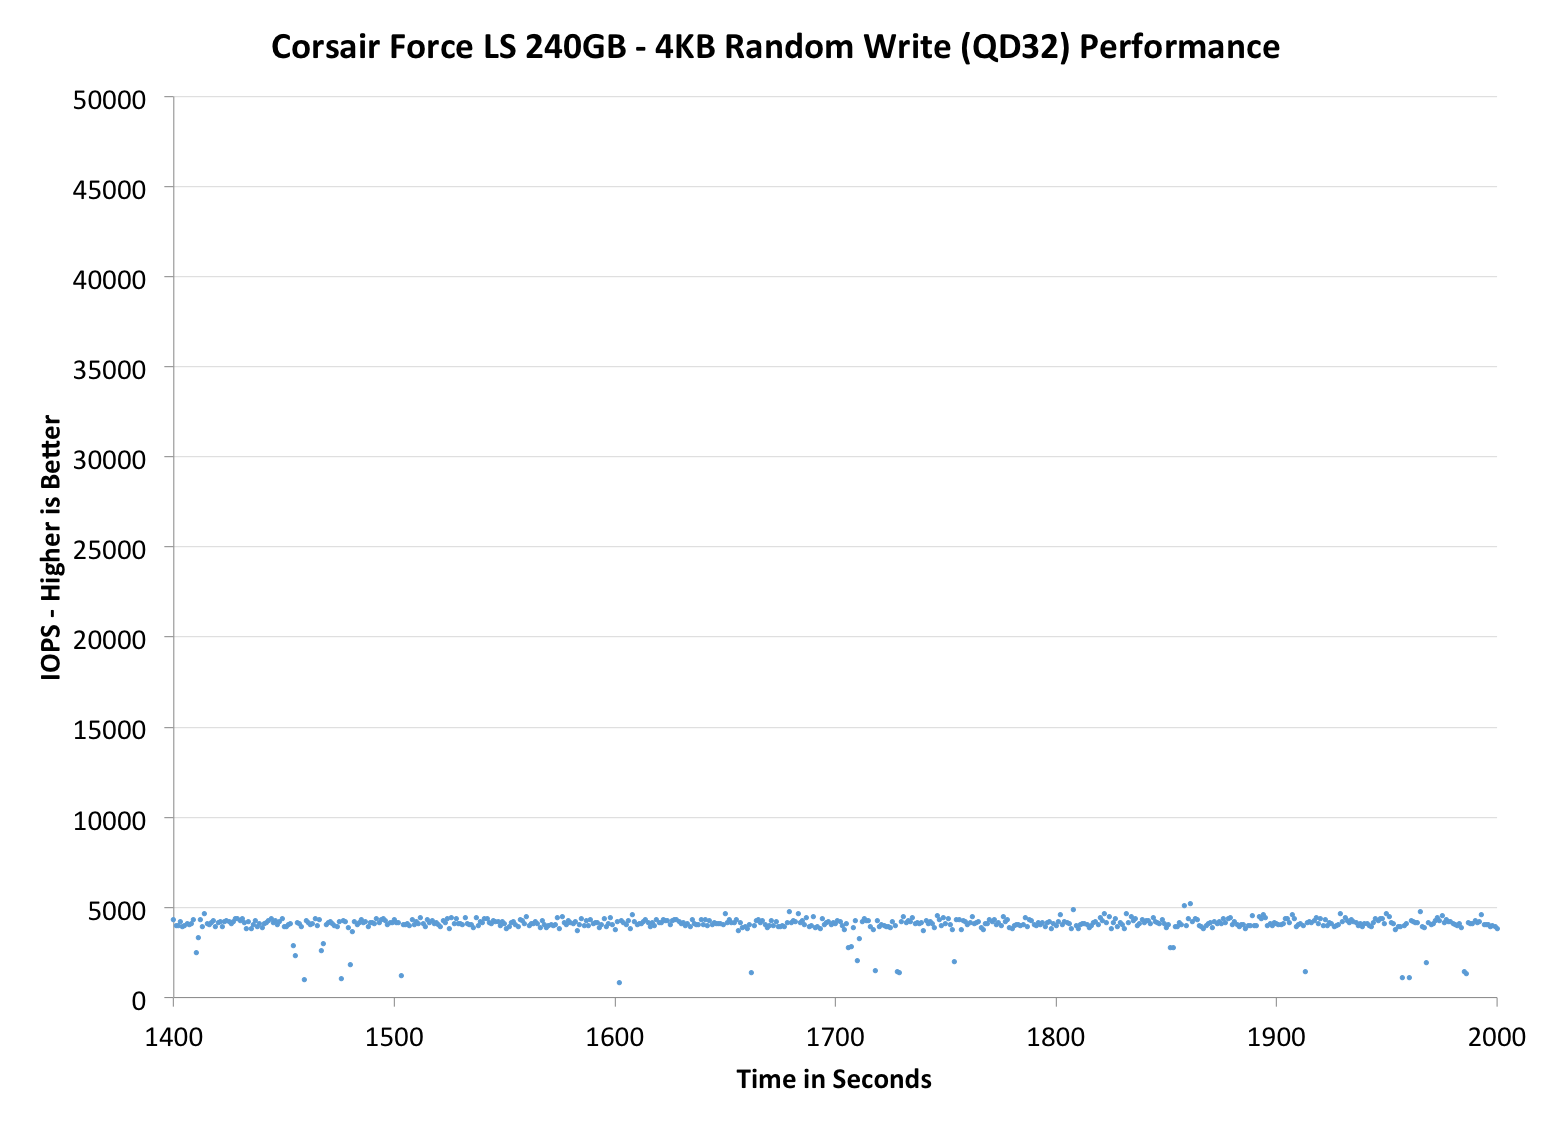
The first set of graphs shows the performance data over the entire 2000 second test period. In these charts you'll notice an early period of very high performance followed by a sharp dropoff. What you're seeing in that case is the drive allocating new blocks from its spare area, then eventually using up all free blocks and having to perform a read-modify-write for all subsequent writes (write amplification goes up, performance goes down).
The second set of graphs zooms in to the beginning of steady state operation for the drive (t=1400s). The third set also looks at the beginning of steady state operation but on a linear performance scale. Click the buttons below each graph to switch source data.
 |
|||||||||
| Corsair Force LS 240GB | Corsair Neutron 240GB | Samsung SSD 840 EVO 250GB | Kingston SSDNow V300 240GB | Samsung SSD 840 Pro 256GB | |||||
| Default | |||||||||
| 25% OP | - | ||||||||
Performance consistency with the Force LS is okay for a budget drive. It's clearly nowhere near the Neutron but compared to Samsung SSD 840 EVO and Pro, it's not bad (though keep in mind that the Force LS has more over-provisioning by default). What's a bit of a letdown is the fact that increasing the over-provisioning doesn't really improve IO consistency. The time it takes to enter steady-state is longer but the actual steady-state performance is essentially unchanged.
 |
|||||||||
| Corsair Force LS 240GB | Corsair Neutron 240GB | Samsung SSD 840 EVO 250GB | Kingston SSDNow V300 240GB | Samsung SSD 840 Pro 256GB | |||||
| Default | |||||||||
| 25% OP | - | ||||||||
 |
|||||||||
| Corsair Force LS 240GB | Corsair Neutron 240GB | Samsung SSD 840 EVO 250GB | Kingston SSDNow V300 240GB | Samsung SSD 840 Pro 256GB | |||||
| Default | |||||||||
| 25% OP | - | ||||||||
TRIM Validation
Our performance consistency tests take a deeper dive into the worst-case performance than our old TRIM/garbage collection tests did but the HD Tach method is still handy for checking TRIM functionality. Like before, I filled the drive with sequential data and then tortured with 4KB random writes (QD=32, 100% LBA) for 30 minutes:
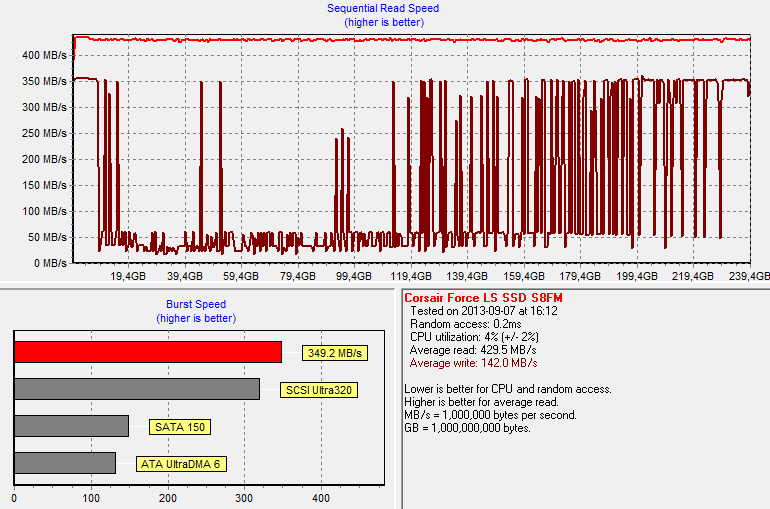
Worst-case performance is pretty low as we saw in the IO consistency tests. However, Phison's garbage collection is rather aggressive as during a single HD Tach pass the performance increases from ~30MB/s to a peak of 350MB/s.

A single TRIM pass recovers performance back to the original ~360MB/s.
AnandTech Storage Bench 2013
When Anand built the AnandTech Heavy and Light Storage Bench suites in 2011 he did so because we didn't have any good tools at the time that would begin to stress a drive's garbage collection routines. Once all blocks have a sufficient number of used pages, all further writes will inevitably trigger some sort of garbage collection/block recycling algorithm. Our Heavy 2011 test in particular was designed to do just this. By hitting the test SSD with a large enough and write intensive enough workload, we could ensure that some amount of GC would happen.
There were a couple of issues with our 2011 tests that we've been wanting to rectify however. First off, all of our 2011 tests were built using Windows 7 x64 pre-SP1, which meant there were potentially some 4K alignment issues that wouldn't exist had we built the trace on a system with SP1. This didn't really impact most SSDs but it proved to be a problem with some hard drives. Secondly, and more recently, we've shifted focus from simply triggering GC routines to really looking at worst-case scenario performance after prolonged random IO.
For years we'd felt the negative impacts of inconsistent IO performance with all SSDs, but until the S3700 showed up we didn't think to actually measure and visualize IO consistency. The problem with our IO consistency tests is that they are very focused on 4KB random writes at high queue depths and full LBA spans—not exactly a real world client usage model. The aspects of SSD architecture that those tests stress however are very important, and none of our existing tests were doing a good job of quantifying that.
We needed an updated heavy test, one that dealt with an even larger set of data and one that somehow incorporated IO consistency into its metrics. We think we have that test. The new benchmark doesn't even have a name, we've just been calling it The Destroyer (although AnandTech Storage Bench 2013 is likely a better fit for PR reasons).
Everything about this new test is bigger and better. The test platform moves to Windows 8 Pro x64. The workload is far more realistic. Just as before, this is an application trace based test—we record all IO requests made to a test system, then play them back on the drive we're measuring and run statistical analysis on the drive's responses.
Imitating most modern benchmarks Anand crafted the Destroyer out of a series of scenarios. For this benchmark we focused heavily on Photo editing, Gaming, Virtualization, General Productivity, Video Playback and Application Development. Rough descriptions of the various scenarios are in the table below:
| AnandTech Storage Bench 2013 Preview—The Destroyer | ||||||||||||
| Workload | Description | Applications Used | ||||||||||
| Photo Sync/Editing | Import images, edit, export | Adobe Photoshop CS6, Adobe Lightroom 4, Dropbox | ||||||||||
| Gaming | Download/install games, play games | Steam, Deus Ex, Skyrim, Starcraft 2, BioShock Infinite | ||||||||||
| Virtualization | Run/manage VM, use general apps inside VM | VirtualBox | ||||||||||
| General Productivity | Browse the web, manage local email, copy files, encrypt/decrypt files, backup system, download content, virus/malware scan | Chrome, IE10, Outlook, Windows 8, AxCrypt, uTorrent, AdAware | ||||||||||
| Video Playback | Copy and watch movies | Windows 8 | ||||||||||
| Application Development | Compile projects, check out code, download code samples | Visual Studio 2012 | ||||||||||
While some tasks remained independent, many were stitched together (e.g. system backups would take place while other scenarios were taking place). The overall stats give some justification to what we've been calling this test internally:
| AnandTech Storage Bench 2013 Preview—The Destroyer, Specs | |||||||||||||
| The Destroyer (2013) | Heavy 2011 | ||||||||||||
| Reads | 38.83 million | 2.17 million | |||||||||||
| Writes | 10.98 million | 1.78 million | |||||||||||
| Total IO Operations | 49.8 million | 3.99 million | |||||||||||
| Total GB Read | 1583.02 GB | 48.63 GB | |||||||||||
| Total GB Written | 875.62 GB | 106.32 GB | |||||||||||
| Average Queue Depth | ~5.5 | ~4.6 | |||||||||||
| Focus | Worst-case multitasking, IO consistency | Peak IO, basic GC routines | |||||||||||
SSDs have grown in their performance abilities over the years, so we wanted a new test that could really push high queue depths at times. The average queue depth is still realistic for a client workload, but the Destroyer has some very demanding peaks. When we first introduced the Heavy 2011 test, some drives would take multiple hours to complete it; today most high performance SSDs can finish the test in under 90 minutes. The Destroyer? So far the fastest we've seen it go is 10 hours. Most high performance SSDs we've tested seem to need around 12—13 hours per run, with mainstream drives taking closer to 24 hours. The read/write balance is also a lot more realistic than in the Heavy 2011 test. Back in 2011 we just needed something that had a ton of writes so we could start separating the good from the bad. Now that the drives have matured, we felt a test that was a bit more balanced would be a better idea.
Despite the balance recalibration, there's just a ton of data moving around in this test. Ultimately the sheer volume of data here and the fact that there's a good amount of random IO courtesy of all of the multitasking (e.g. background VM work, background photo exports/syncs, etc...) makes the Destroyer do a far better job of giving credit for performance consistency than the old Heavy 2011 test. Both tests are valid; they just stress/showcase different things. As the days of begging for better random IO performance and basic GC intelligence are over, we wanted a test that would give us a bit more of what we're interested in these days. As Anand mentioned in the S3700 review, having good worst-case IO performance and consistency matters just as much to client users as it does to enterprise users.
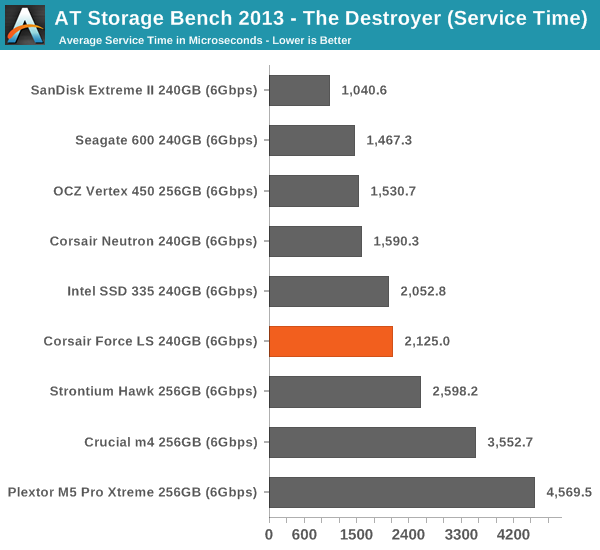
We're reporting two primary metrics with the Destroyer: average data rate in MB/s and average service time in microseconds. The former gives you an idea of the throughput of the drive during the time that it was running the Destroyer workload. This can be a very good indication of overall performance. What average data rate doesn't do a good job of is taking into account response time of very bursty (read: high queue depth) IO. By reporting average service time we heavily weigh latency for queued IOs. You'll note that this is a metric we've been reporting in our enterprise benchmarks for a while now. With the client tests maturing, the time was right for a little convergence.
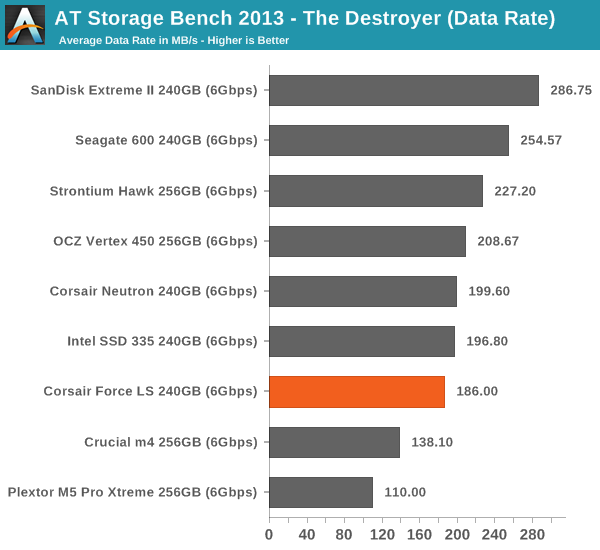
Our new Storage Bench 2013 reillustrates the IO consistency results. The Force LS does okay but it's clearly far behind the fastest SSDs of today. For an average user this shouldn't be an issue as the SSD shouldn't end up in steady-state in a TRIM supported environment but for a heavy user this can be a concern.
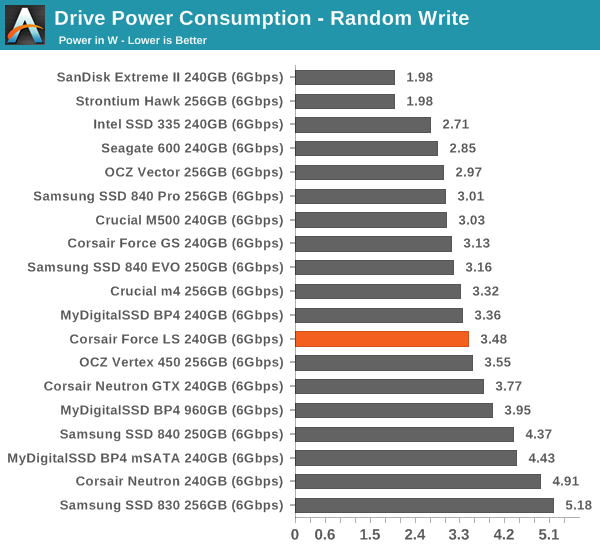
Random Read/Write Speed
The four corners of SSD performance are as follows: random read, random write, sequential read and sequential write speed. Random accesses are generally small in size, while sequential accesses tend to be larger and thus we have the four Iometer tests we use in all of our reviews.
Our first test writes 4KB in a completely random pattern over an 8GB space of the drive to simulate the sort of random access that you'd see on an OS drive (even this is more stressful than a normal desktop user would see). I perform three concurrent IOs and run the test for 3 minutes. The results reported are in average MB/s over the entire time. We use both standard pseudo randomly generated data for each write as well as fully random data to show you both the maximum and minimum performance offered by SandForce based drives in these tests. The average performance of SF drives will likely be somewhere in between the two values for each drive you see in the graphs. For an understanding of why this matters, read our original SandForce article.
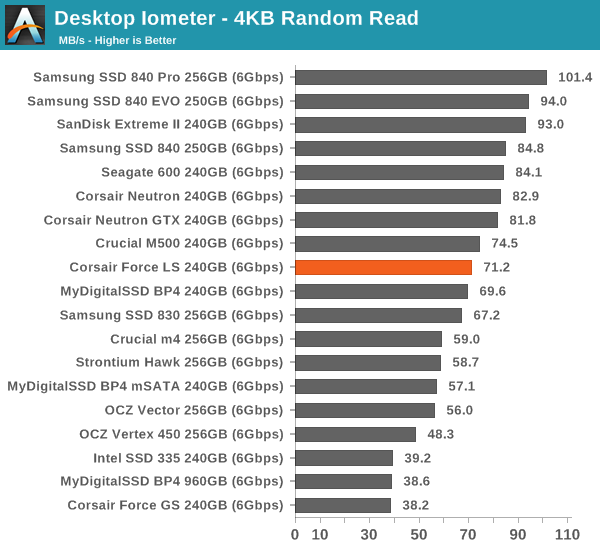
It looks like random read performance has received some improvements in the latest firmware, making the Force LS 14MB/s faster than MyDigitalSSD's BP4.
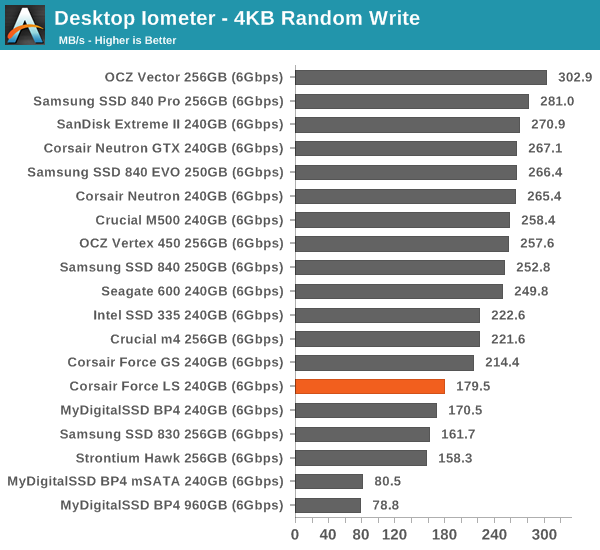
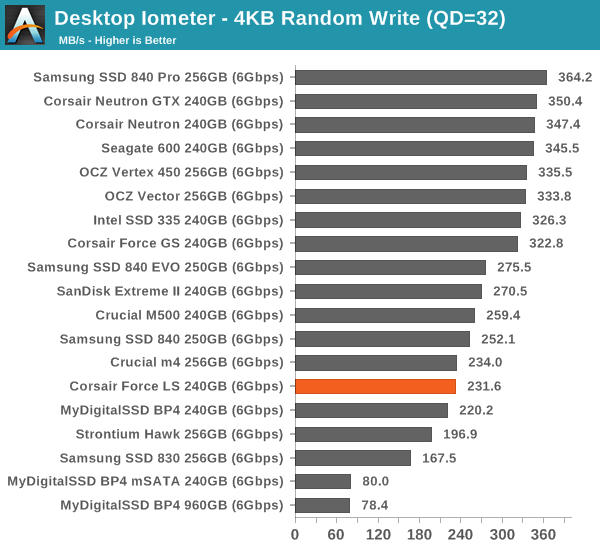
Random write performance is also marginally better than BP4's but overall it's Phison's biggest issue. Dealing with random writes has always been the toughest job for manufacturers, especially if you're aiming to make a budget SSD. It's good to see some improvement on this front but Phison must step up their game if they're looking to play in the high-end series.
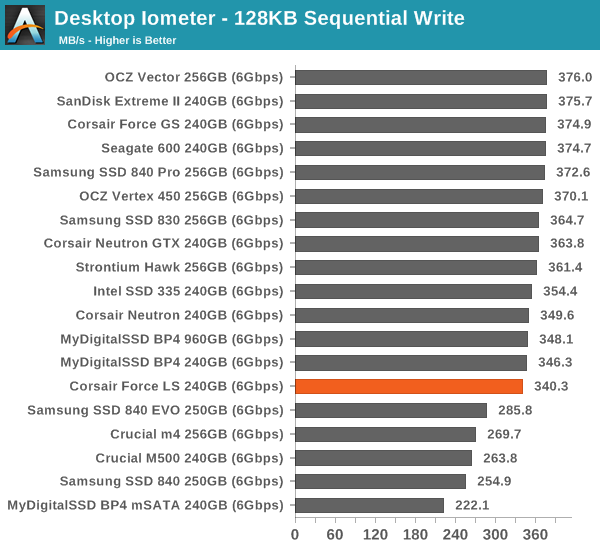
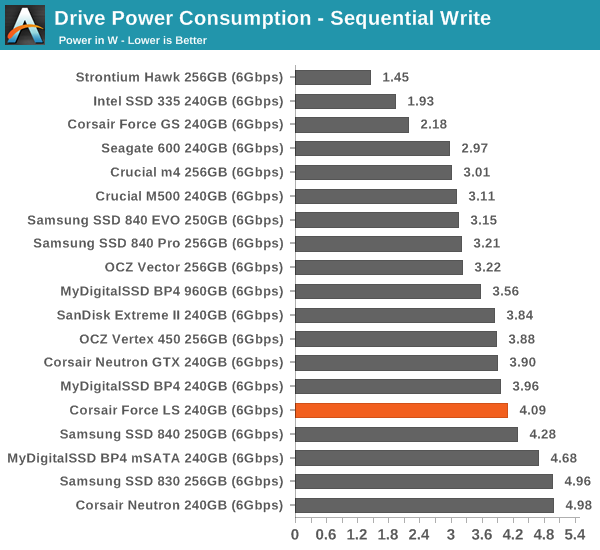
Sequential Read/Write Speed
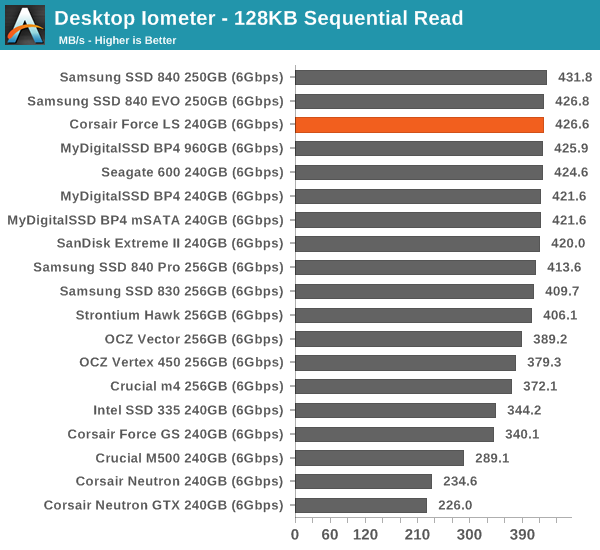
Sequential transfers are much easier to deal with and that we can see in the results. Read performance is top-of-the-class and write performance is not far behind the fastest models.
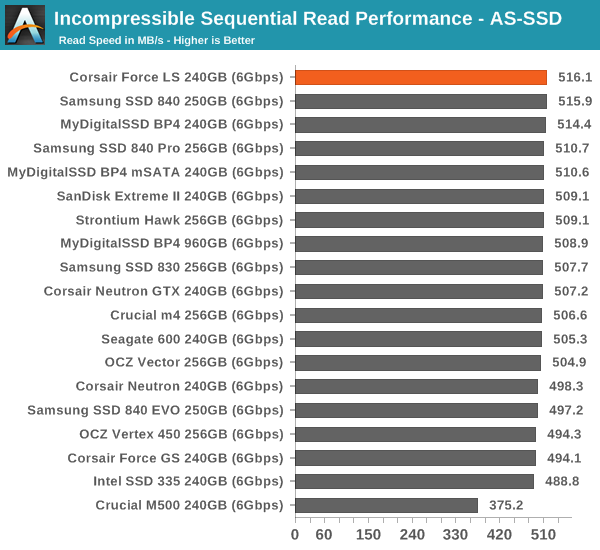
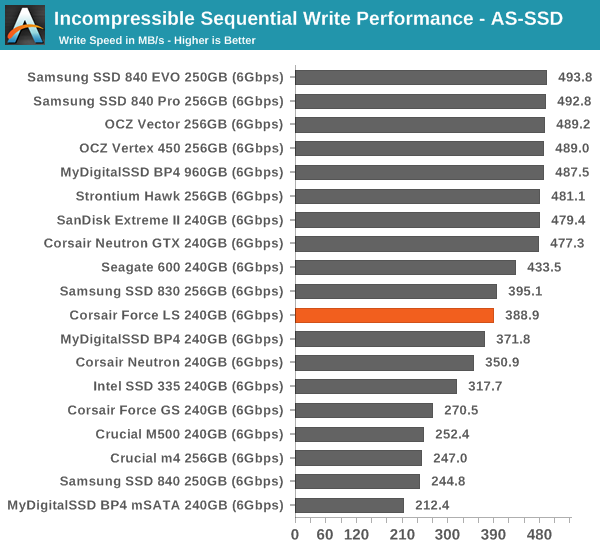
AS-SSD Incompressible Sequential Read/Write Performance
Performance vs. Transfer Size
ATTO is a useful tool for quickly benchmarking performance across various transfer sizes. You can get the complete data set in Bench. The Force LS has surprisingly great read performance at all IO sizes. As we saw in the previous page, sequential read speed is the strength of Force LS (or more accurately Phison) and the graph below emphasizes that. Write performance is also good but not outstanding like the read performance.


AnandTech Storage Bench 2011
Two years ago we introduced our AnandTech Storage Bench, a suite of benchmarks that took traces of real OS/application usage and played them back in a repeatable manner. Anand assembled the traces out of frustration with the majority of what we have today in terms of SSD benchmarks.
Although the AnandTech Storage Bench tests did a good job of characterizing SSD performance, they weren't stressful enough. All of the tests performed less than 10GB of reads/writes and typically involved only 4GB of writes specifically. That's not even enough exceed the spare area on most SSDs. Most canned SSD benchmarks don't even come close to writing a single gigabyte of data, but that doesn't mean that simply writing 4GB is acceptable.
Originally we kept the benchmarks short enough that they wouldn't be a burden to run (~30 minutes) but long enough that they were representative of what a power user might do with their system. Later, however, we created what we refer to as the Mother of All SSD Benchmarks (MOASB). Rather than only writing 4GB of data to the drive, this benchmark writes 106.32GB. This represents the load you'd put on a drive after nearly two weeks of constant usage. And it takes a long time to run.
1) The MOASB, officially called AnandTech Storage Bench 2011—Heavy Workload, mainly focuses on the times when your I/O activity is the highest. There is a lot of downloading and application installing that happens during the course of this test. Our thinking was that it's during application installs, file copies, downloading, and multitasking with all of this that you can really notice performance differences between drives.
2) We tried to cover as many bases as possible with the software incorporated into this test. There's a lot of photo editing in Photoshop, HTML editing in Dreamweaver, web browsing, game playing/level loading (Starcraft II and WoW are both a part of the test), as well as general use stuff (application installing, virus scanning). We included a large amount of email downloading, document creation, and editing as well. To top it all off we even use Visual Studio 2008 to build Chromium during the test.
The test has 2,168,893 read operations and 1,783,447 write operations. The IO breakdown is as follows:
| AnandTech Storage Bench 2011—Heavy Workload IO Breakdown | ||||
| IO Size | % of Total | |||
| 4KB | 28% | |||
| 16KB | 10% | |||
| 32KB | 10% | |||
| 64KB | 4% | |||
Only 42% of all operations are sequential; the rest ranges from pseudo to fully random (with most falling in the pseudo-random category). Average queue depth is 4.625 IOs, with 59% of operations taking place in an IO queue of 1.
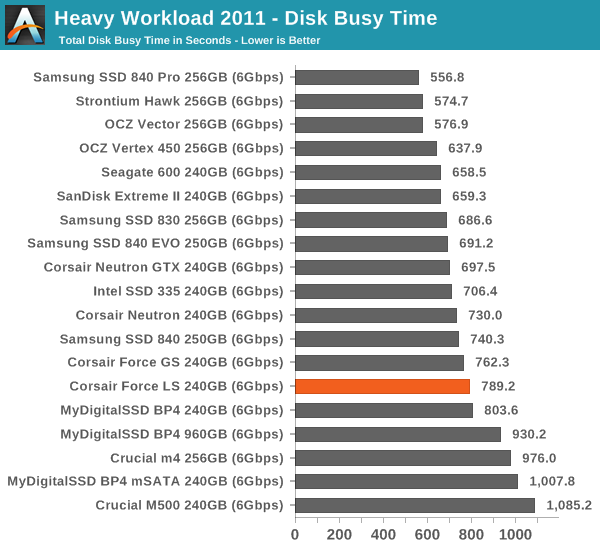
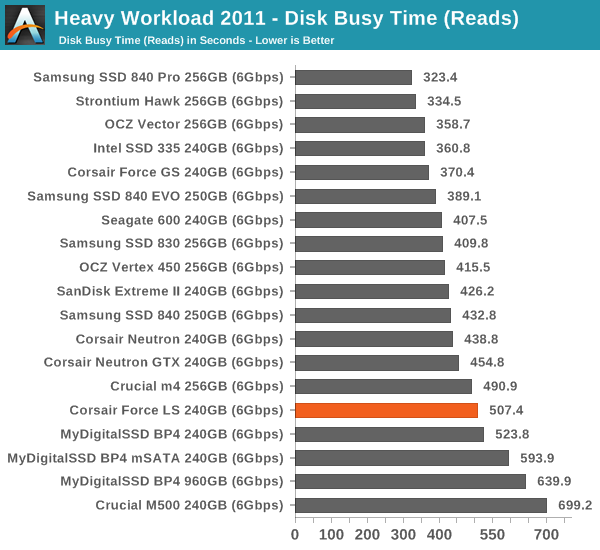
Many of you have asked for a better way to really characterize performance. Simply looking at IOPS doesn't really say much. As a result we're going to be presenting Storage Bench 2011 data in a slightly different way. We'll have performance represented as Average MB/s, with higher numbers being better. At the same time we'll be reporting how long the SSD was busy while running this test. These disk busy graphs will show you exactly how much time was shaved off by using a faster drive vs. a slower one during the course of this test. Finally, we will also break out performance into reads, writes, and combined. The reason we do this is to help balance out the fact that this test is unusually write intensive, which can often hide the benefits of a drive with good read performance.
There's also a new light workload for 2011. This is a far more reasonable, typical every day use case benchmark. It has lots of web browsing, photo editing (but with a greater focus on photo consumption), video playback, as well as some application installs and gaming. This test isn't nearly as write intensive as the MOASB but it's still multiple times more write intensive than what we were running last year.
We don't believe that these two benchmarks alone are enough to characterize the performance of a drive, but hopefully along with the rest of our tests they will help provide a better idea. The testbed for Storage Bench 2011 has changed as well. We're now using a Sandy Bridge platform with full 6Gbps support for these tests.
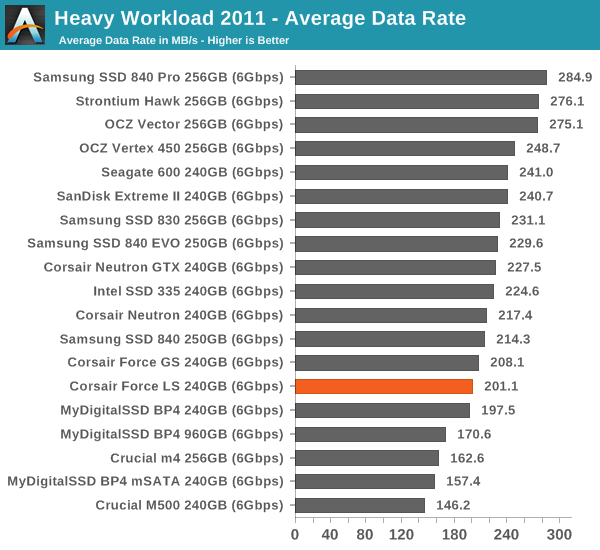
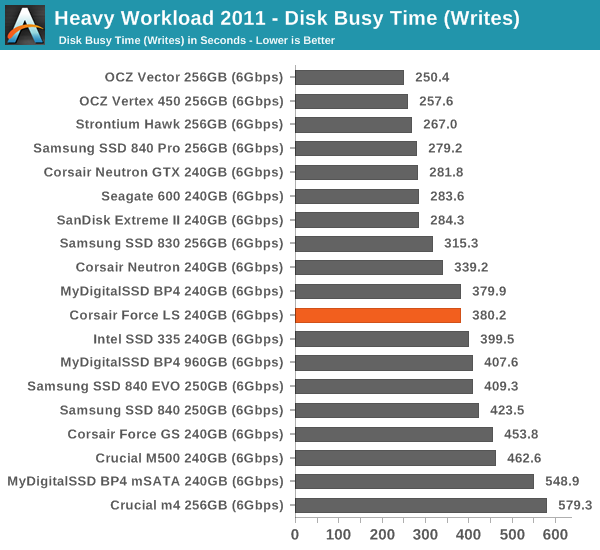
AnandTech Storage Bench 2011—Heavy Workload
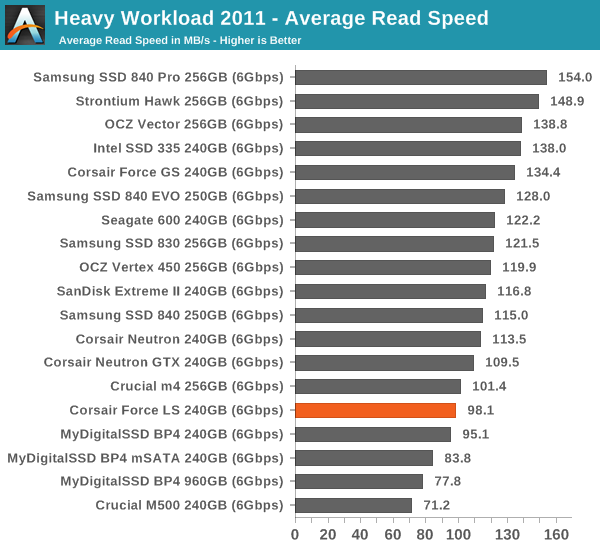
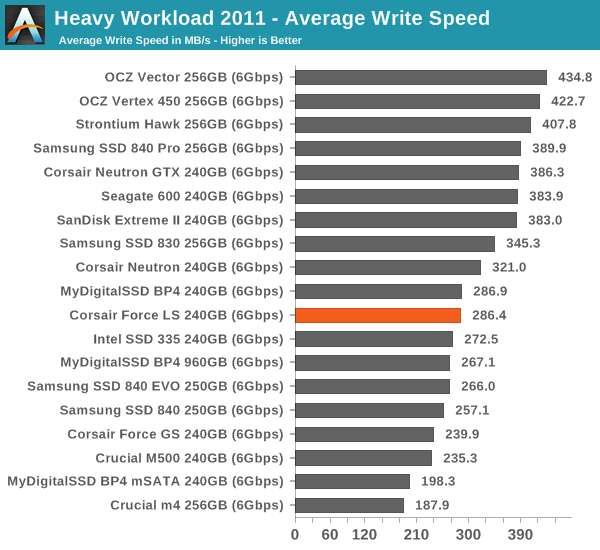
We'll start out by looking at average data rate throughout our heavy workload test. The Corsair Force LS (and Phison) tend to be in the bottom third of the graphs, but overall performance is still reasonable for a budget drive.
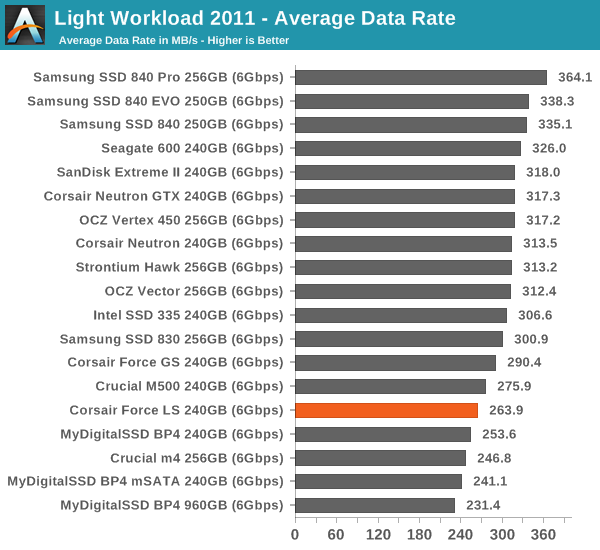
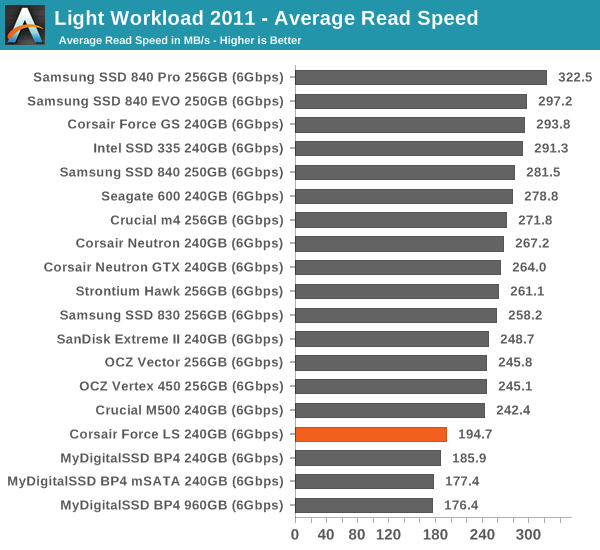
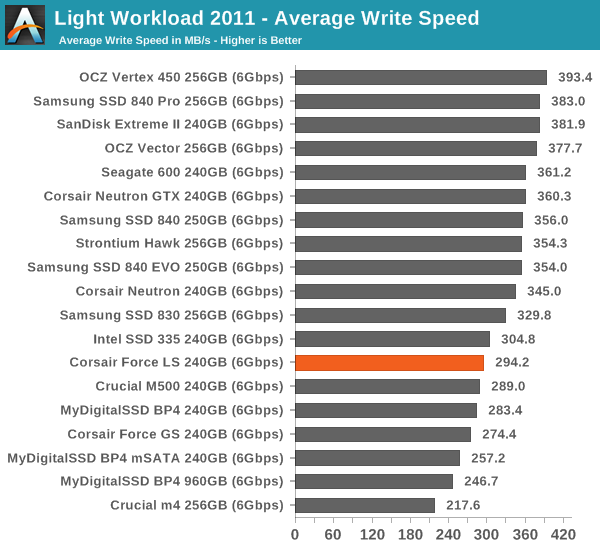
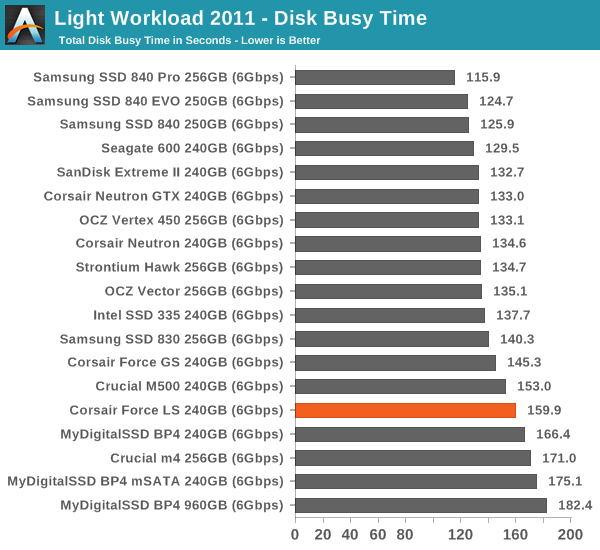
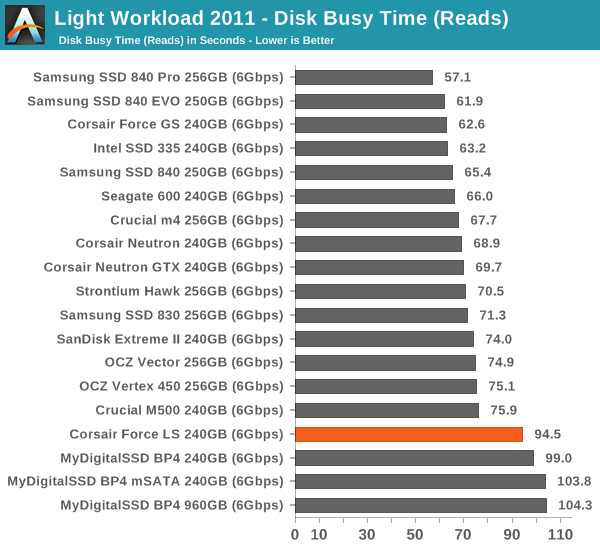
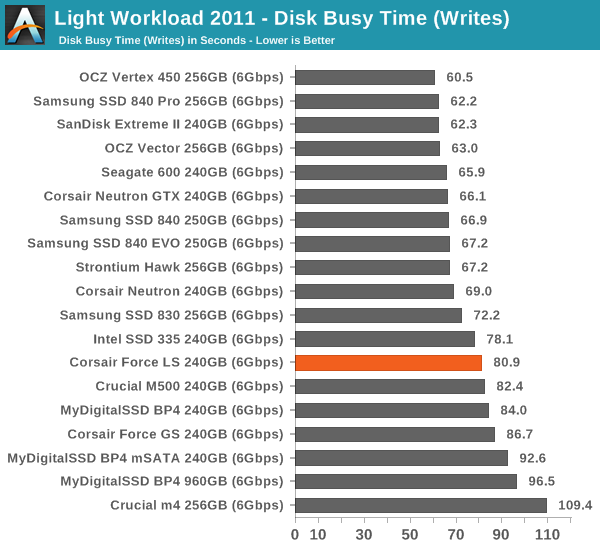
AnandTech Storage Bench 2011—Light Workload
Our light workload actually has more write operations than read operations. The split is as follows: 372,630 reads and 459,709 writes. The relatively close read/write ratio does better mimic a typical light workload (although even lighter workloads would be far more read centric). The I/O breakdown is similar to the heavy workload at small IOs, however you'll notice that there are far fewer large IO transfers:
| AnandTech Storage Bench 2011—Light Workload IO Breakdown | ||||
| IO Size | % of Total | |||
| 4KB | 27% | |||
| 16KB | 8% | |||
| 32KB | 6% | |||
| 64KB | 5% | |||
As with the Heavy 2011 Workload, the Light testing again puts the Force LS in the bottom third of our charts. While that may look bad in comparison to the faster SSDs, we're still looking at a massive speedup relative to hard drives and even HDD + SSD caching solutions, and that's the target market for budget SSDs.
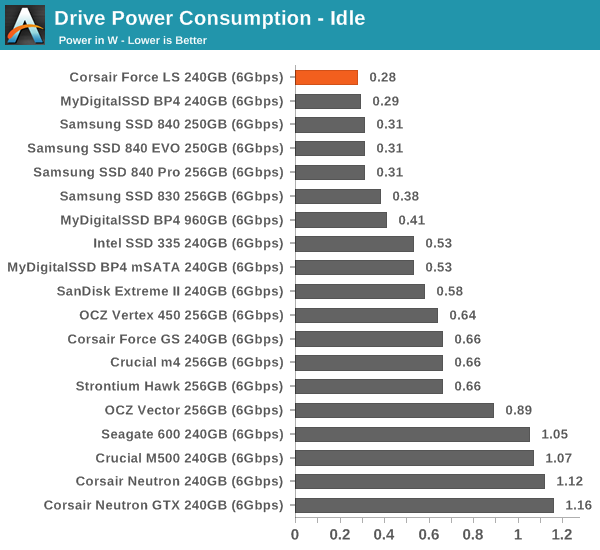
Power Consumption
Power consumption at idle is extremely low, which should make the Force LS a good option for laptop users. Under load the power draw gets higher but the the load figures aren't a concern, and in practice the SSD will be idle far more often than not.
Final Words
Like most budget products, the conclusion depends on pricing. The Force LS is a low-end drive by today's standards but with the right price, it can be a competitive offering. Since Corsair does not offer the Force LS in the states, I can't rely on my regular NewEgg price comparison, so I decided to use Scan.co.uk, a large British component etailer. The prices in the table don't include UK's 20% VAT as I tried to make the prices as comparable to the US market as possible (£1 = $1.6019).
| Scan.co.uk Price Comparison (9/21/2013) | |||
| 60/64GB | 120/128GB | 240/256GB | |
| Corsair Force LS | £45.60 ($73) | £73.12 ($117) | £128.24 ($205) |
| Corsair Neutron | N/A | £79.12 ($127) | £131.25 ($210) |
| Corsair Force GS | N/A | £75.12 ($120) | £139.24 ($223) |
| Crucial M500 | N/A | £71.56 ($115) | £119.24 ($191) |
| Intel SSD 520 | N/A | £88.12 ($141) | £134.24 ($215) |
| OCZ Vertex 450 | N/A | £70.12 ($112) | £155.25 ($249) |
| Samsung SSD 840 EVO | N/A | £72.12 ($116) | £119.25 ($191) |
The problem with most budget SSDs is that they aren't cheap enough, and that's Corsair's Force LS problem as well. For about the same or less, you can get a Samsung SSD 840 EVO or Crucial M500, both of which are great SSDs. Even out of Corsair's own lineup, the Force GS is priced similarly at 120GB and the Neutron is only slightly more expensive at 240GB. I can't see where Force LS falls in Corsair's lineup—the Neutron (GTX) is without a doubt Corsair's high-end offering and at least the idea behind the Force LS is for it to be a low cost model but unfortunately its pricing does not reflect that. Of course, prices fluctuate and it's possible that retailers are pricing the Force LS a bit higher as it's new (prices tend to drop when the product gets older).
All in all, I have hard time recommending anything for budget SSD use other than the Samsung SSD 840 EVO at the moment. Usage of TLC NAND gives Samsung a price advantage and with the upgrades Samsung made in the EVO compared to the regular 840, the performance is on-par with most MLC based SSDs. With the right price, I can see myself recommending the Force LS to an average user but it must be noticeably cheaper than the 840 EVO and others to be worth the saving. A couple dollars (or Euros) simply isn't enough to warrant the "budget" label, and considering you can find sales on some of the better drives on occasion that are well below the above prices, patient users are advised to wait for a good sale rather than settle for a slightly cheaper but slower SSD.
Ironically (given our introduction), if you're looking for an inexpensive SSD these days, your best bet is likely going to be one of the many SandForce SF-2281 drives. The 240GB SF-2281 drives are routinely available for around $170/£105, sometimes less. Performance may not be better than the other SSDs, but the competition among SandForce licensees has pushed prices down about as low as they'll go. That at least makes them worthy of the "budget" label, whereas the Force LS in practice only ends up costing slightly less than the Neutron.


