Original Link: https://www.anandtech.com/show/6325/crucial-v4-256gb-review
Crucial v4 (256GB) Review
by Kristian Vättö on November 22, 2012 1:01 PM ESTIntroduction
The biggest reason why SSDs have not become truly mainstream (yet) is price. While prices have come down significantly over the last year, you are are still paying roughly $0.75 per GB, whereas hard drives can usually bought for less than $0.10 per GB. For an enthusiast, it shouldn’t be a problem to pay up to ten times more per GB if it yields significantly better performance, but the consumer market is much harder to convince. Most aren’t ready spend hundreds of dollars on a single component, especially if there is a cheaper alternative that is sufficient. In this case, hard drives also offer more capacity, which can make it very hard for consumers to understand the benefits of an SSD.
Besides price, there is another problem. Most SSDs sold today are SATA 6Gbps but the vast majority of computers are only compatible with older and slower SATA 1.5Gbps and 3Gbps standards. That means consumers who don’t have a SATA 6Gbps compatible computer will not be able to take advantage of the extra IO bandwidth that the SATA 6Gbps SSDs offer, and it may feel pointless to pay for something you can’t use. Of course, there are previous generation SSDs that are SATA 3Gbps but they aren’t necessarily cheaper due to the use of more expensive NAND (2Xnm vs 3Xnm).
However, almost any SSD is faster than a traditional hard drive, be that 2.5” 5400RPM, 3.5” 7200RPM or even a 10,000RPM VelcoiRaptor. Crucial sees that there is a market for low-end SSDs, which are not as fast as today’s fastest drives but offer a more affordable $/GB ratio. The v4 SSD is specifically targeted at consumers with SATA 3Gbps and due to the usage of a cheaper controller, Crucial was able to price the drive below its 6Gbps counterparts...but is it priced low enough to really sell?
| Crucial v4 Specifications | ||||
| Capacity | 32GB | 64GB | 128GB | 256GB |
| NAND | Micron 25nm synchronous MLC NAND | |||
| Controller | Phison PS3105 | |||
| Sequential Read | 200MB/s | 230MB/s | 230MB/s | 230MB/s |
| Sequential Write | 60MB/s | 100MB/s | 175MB/s | 190MB/s |
| 4K Random Read | 10K IOPS | 10K IOPS | 10K IOPS | 10K IOPS |
| 4K Random Write | 1.2K IOPS | 2.4K IOPS | 4K IOPS | 4K IOPS |
Performance wise the v4 is significantly behind SATA 6Gbps SSDs. Sequential speeds are actually fairly normal for SATA 3Gbps SSDs but random speeds are awful to get straight to the point. Even the Intel SSD 320 has three to four times higher random read/write speeds and it's a year and a half old drive, so the random performance is really not good by today's standards. We'll soon see how the random speeds impact real world performance, but the specs aren't overwhelming.
| NewEgg Price Comparison (11/22/2012) | ||||
| Capacity | 32GB | 60/64GB | 120/128GB | 240/256GB |
| Crucial v4 | $50 | $65 | $85 | $160 |
| Crucial m4 | N/A | $73 | $110 | $200 |
| Samsung 830 | N/A | $70 | $104 | $200 |
| Intel SSD 330 | N/A | $70 | $104 | $140 |
| Plextor M5S | N/A | $50 | $110 | $200 |
| OCZ Vertex 4 | N/A | $80 | $75 | $160 |
| OCZ Agility 4 | N/A | $75 | $95 | $165 |
| Mushkin Enhanced Chronos | N/A | $65 | $100 | $165 |
As for the pricing, the v4 is cheaper compared to it's big brother m4 but there are other, faster SSDs that offer similar pricing. For example the Mushkin Enhanced Chronos is only $5-15 more expensive depending on the capacity and there are others such as Kingston SSDNow V+200 and OCZ Agility 3 that are priced equivalently. Samsung's 830 drives are also regularly on sale, and we've seen the 128GB drive go for as little as $85 with the 256GB now routinely on sale for $170 or so (or $190 for the kit). Even if you're stuck with a 3Gbps SATA connection, it's a safe bet that $5 to $10 more will get you much better performance. How much better? We'll get to that on page three....
The Crucial v4
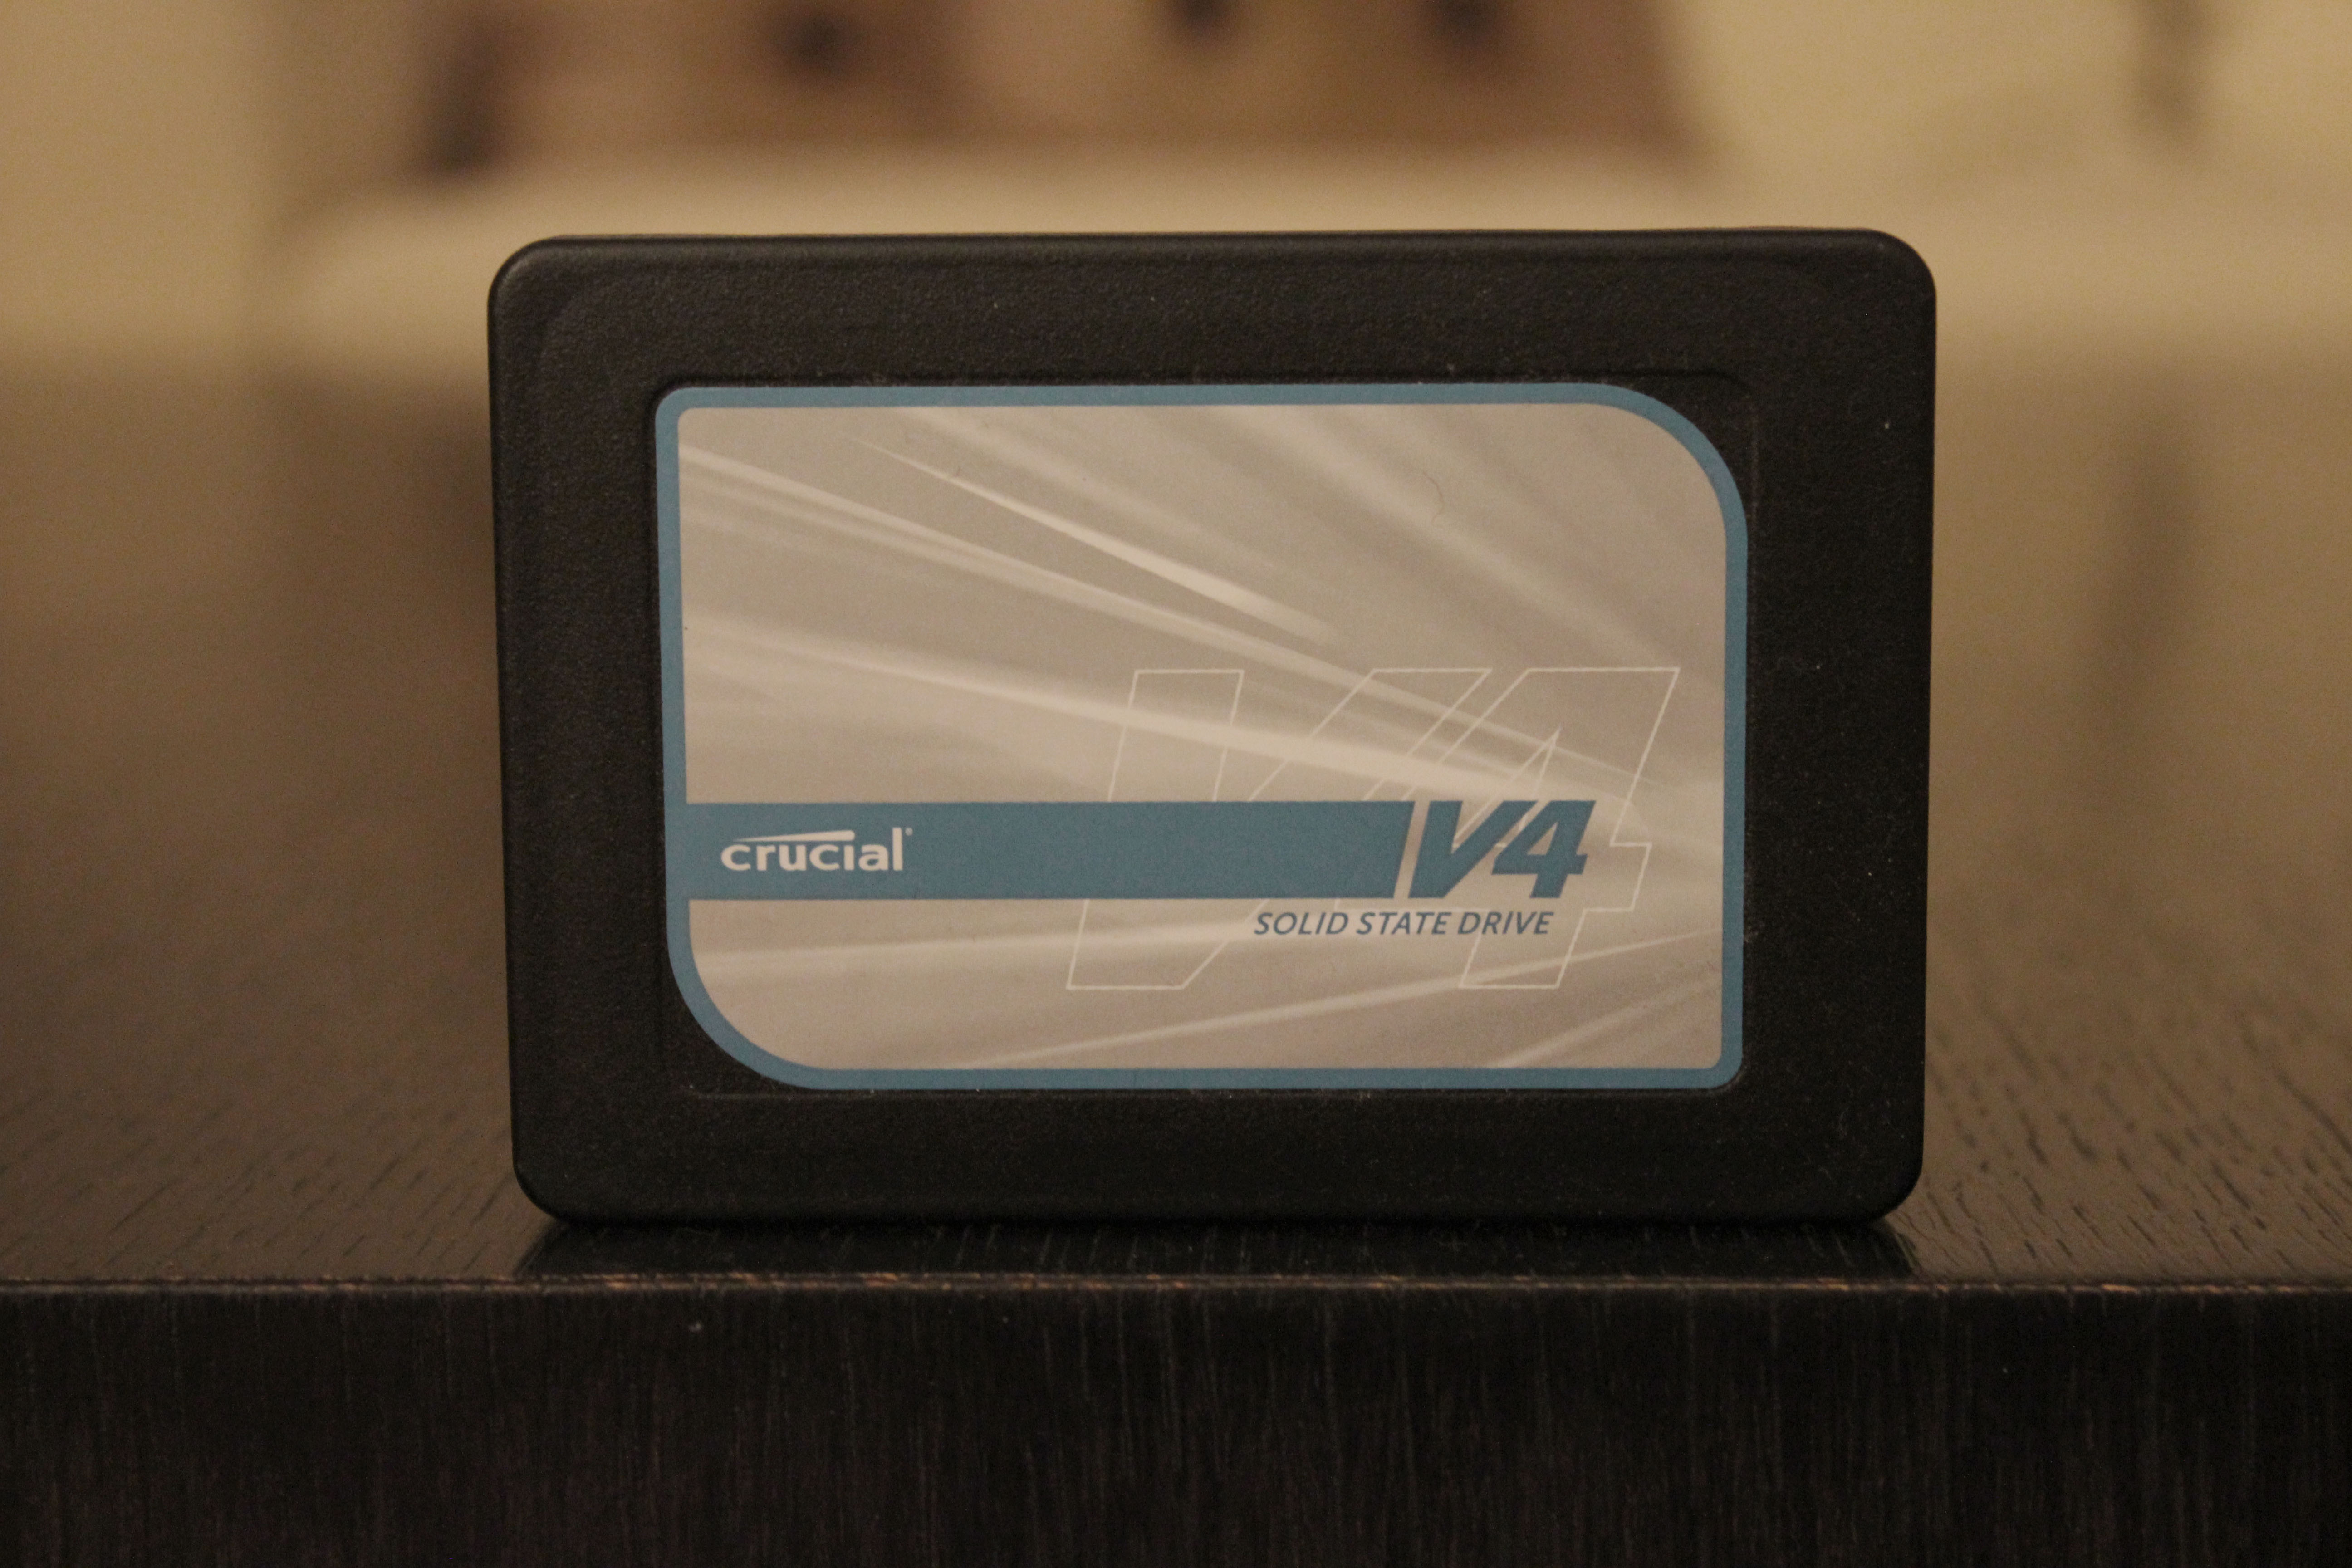
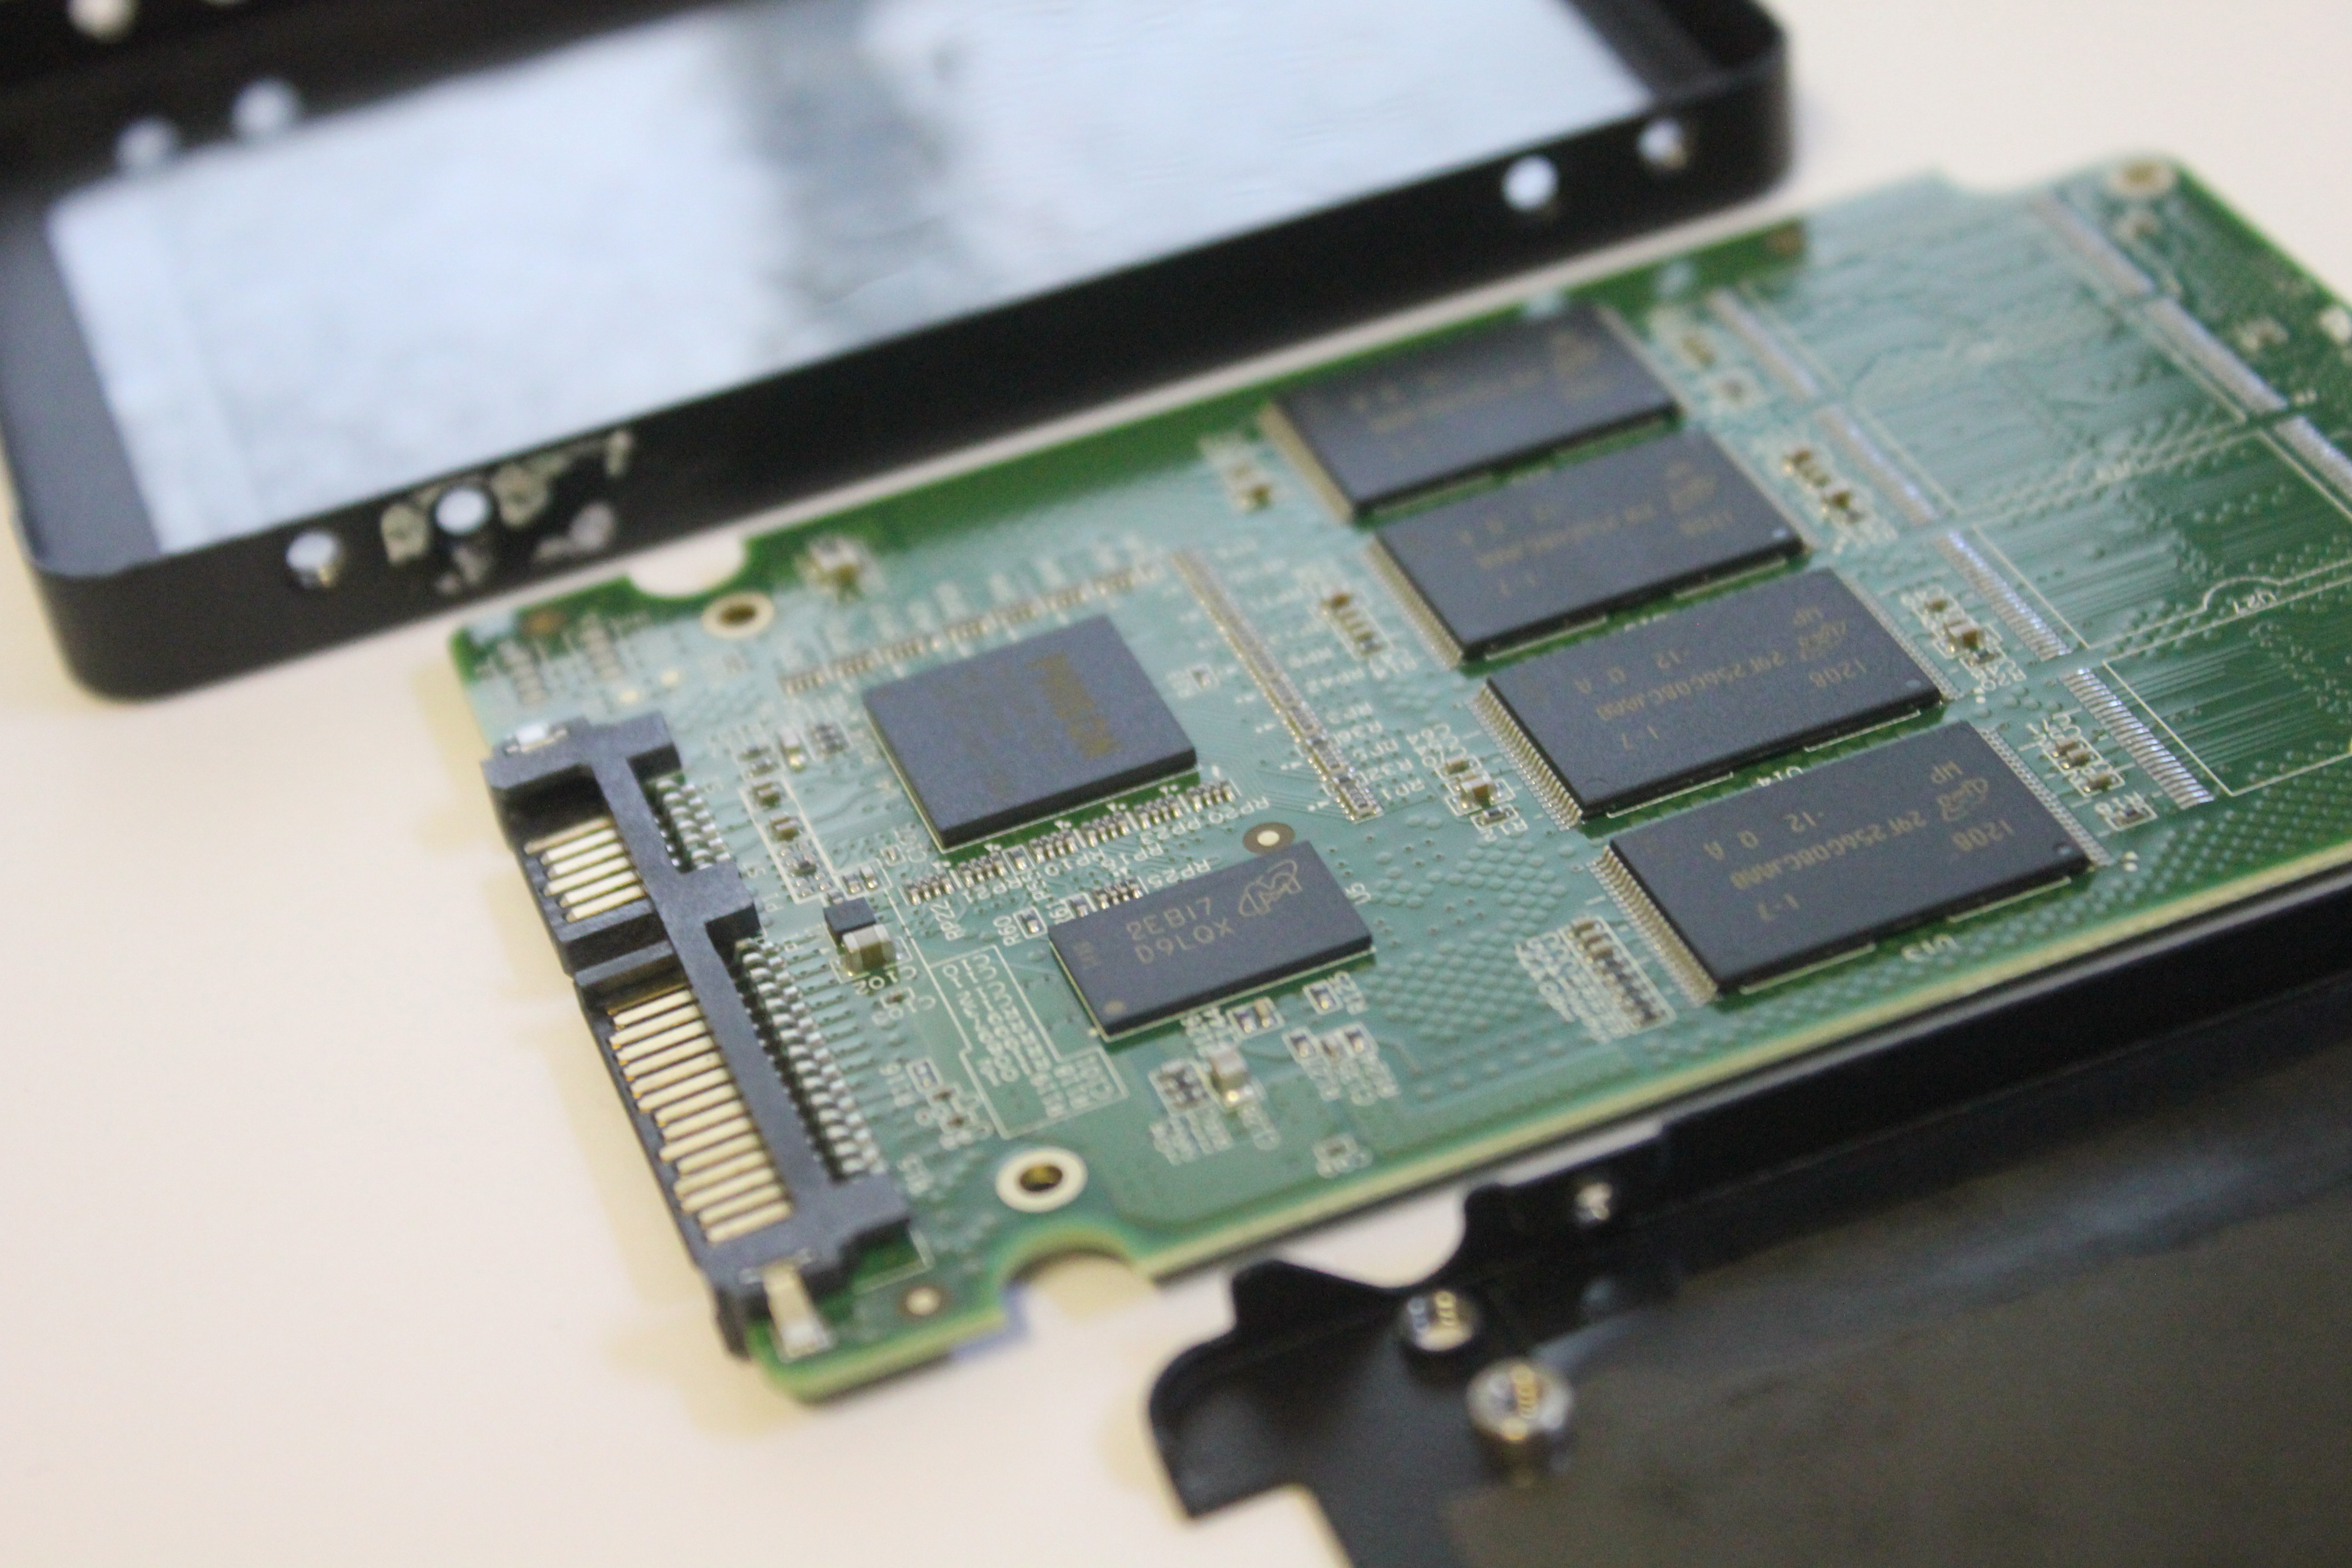
Overall the drive shares a design similar to the m4, though the two are not alike. Even though the v4 is a budget SSD, the case is made out of metal.
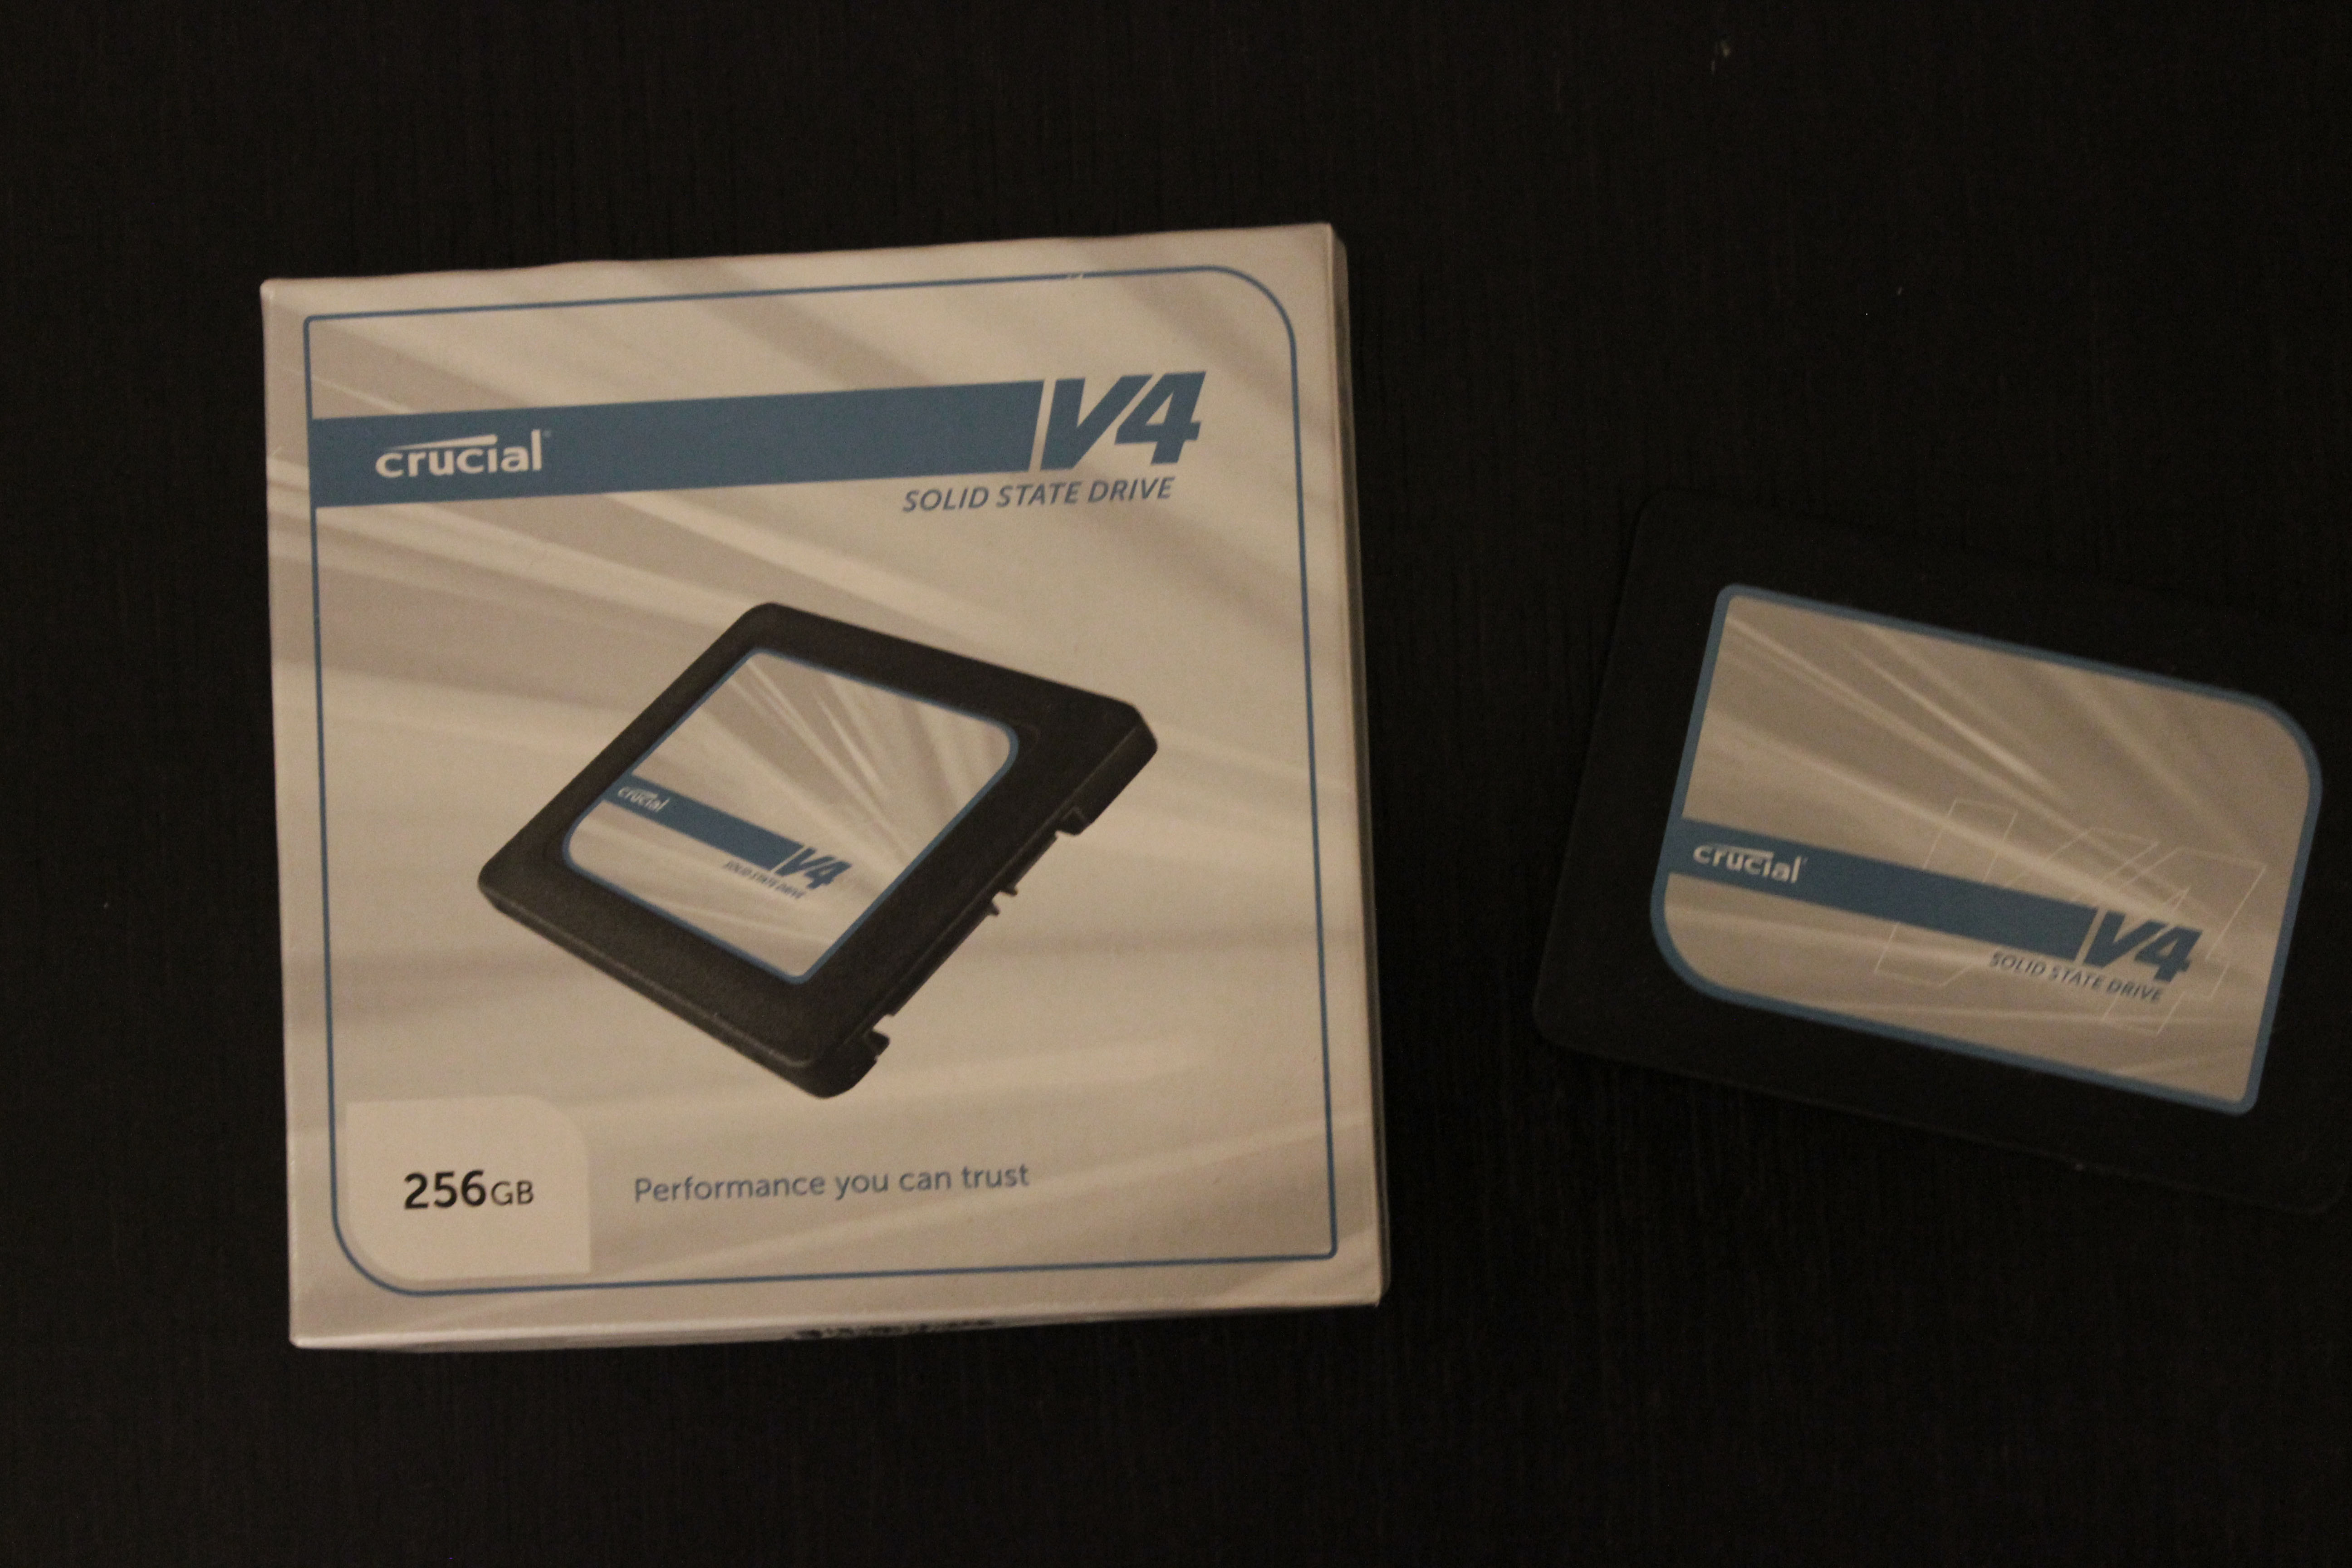
The v4 packaging doesn't include any fancy add-ons: There is the drive and mounting screws.
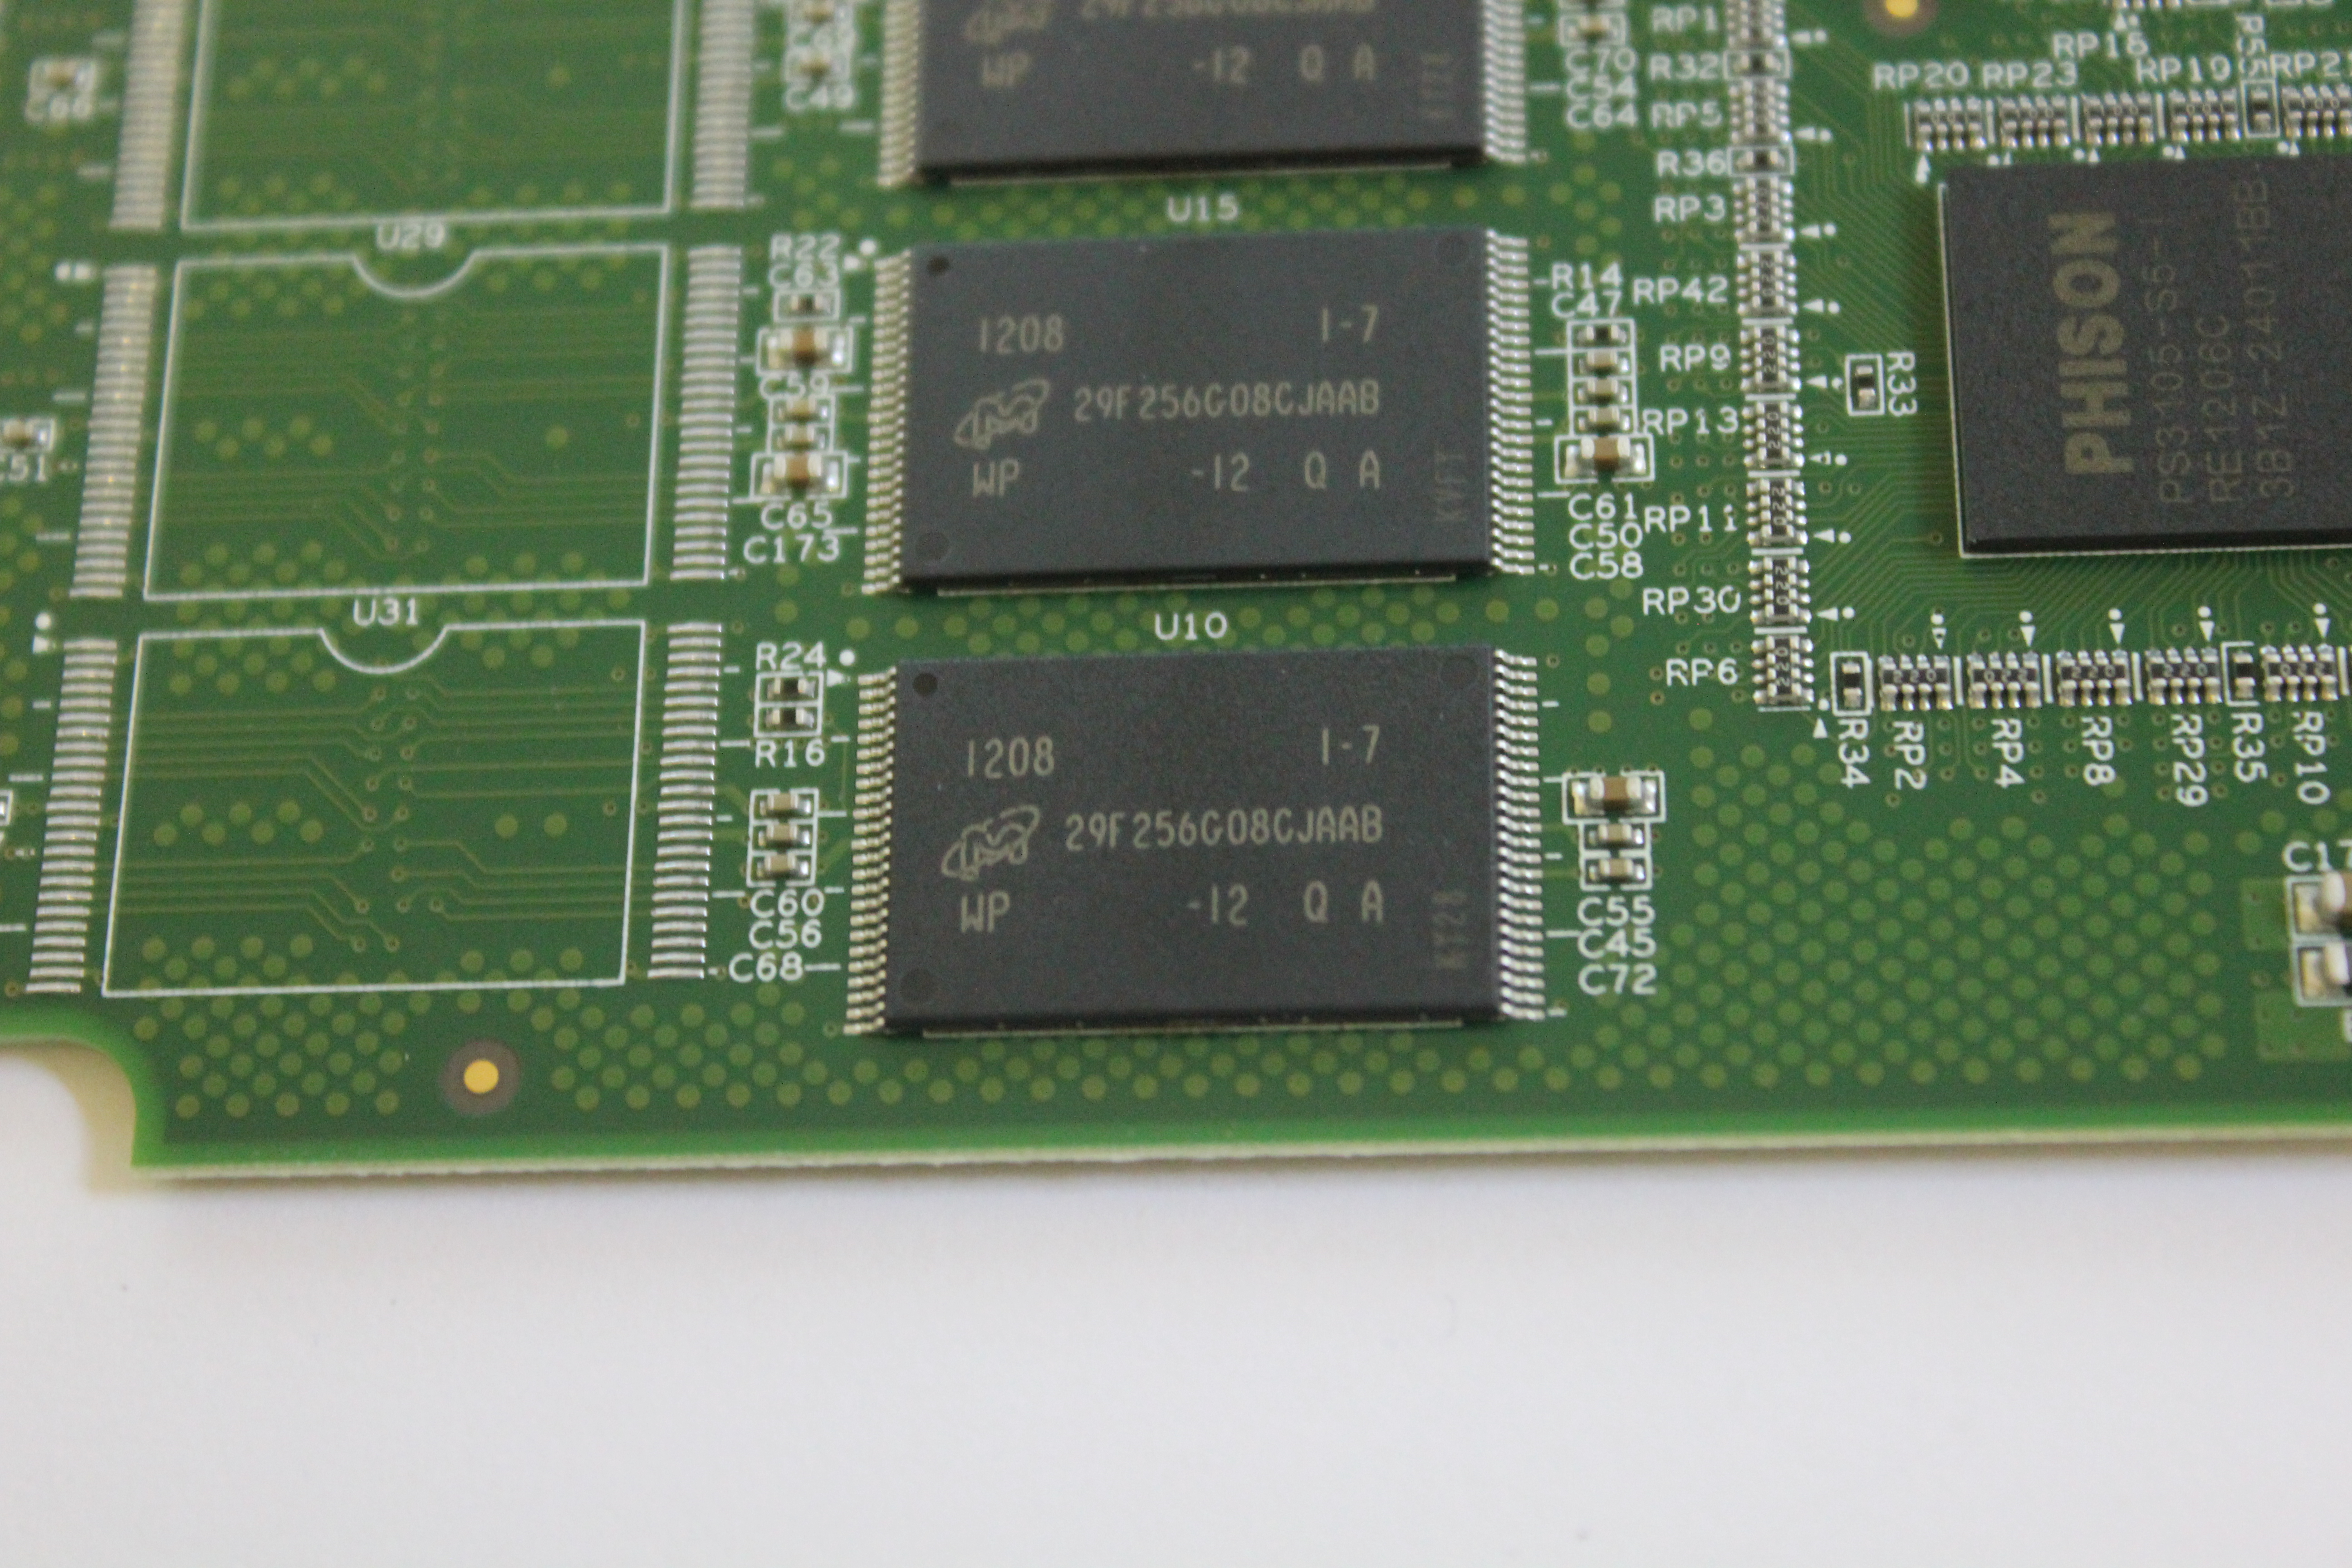
Since Crucial is a subsidiary of Micron, it’s not surprising to find Micron’s NAND inside the v4. What is a bit surprising is that Crucial has opted to use only eight NAND packages in the 256GB model, even though there are sixteen NAND sockets on the PCB. Each package works out to be 32GB (4x 8GB die) and are manufactured using IMFT’s 25nm process. As the v4 is a budget and “stock cleaning” model, I wouldn’t be surprised to see varying NAND configurations even among the same capacities. If there is more demand for 32GB packages, Micron may opt for sixteen 16GB packages instead to be able to clear 25nm NAND stocks as efficiently as possible.
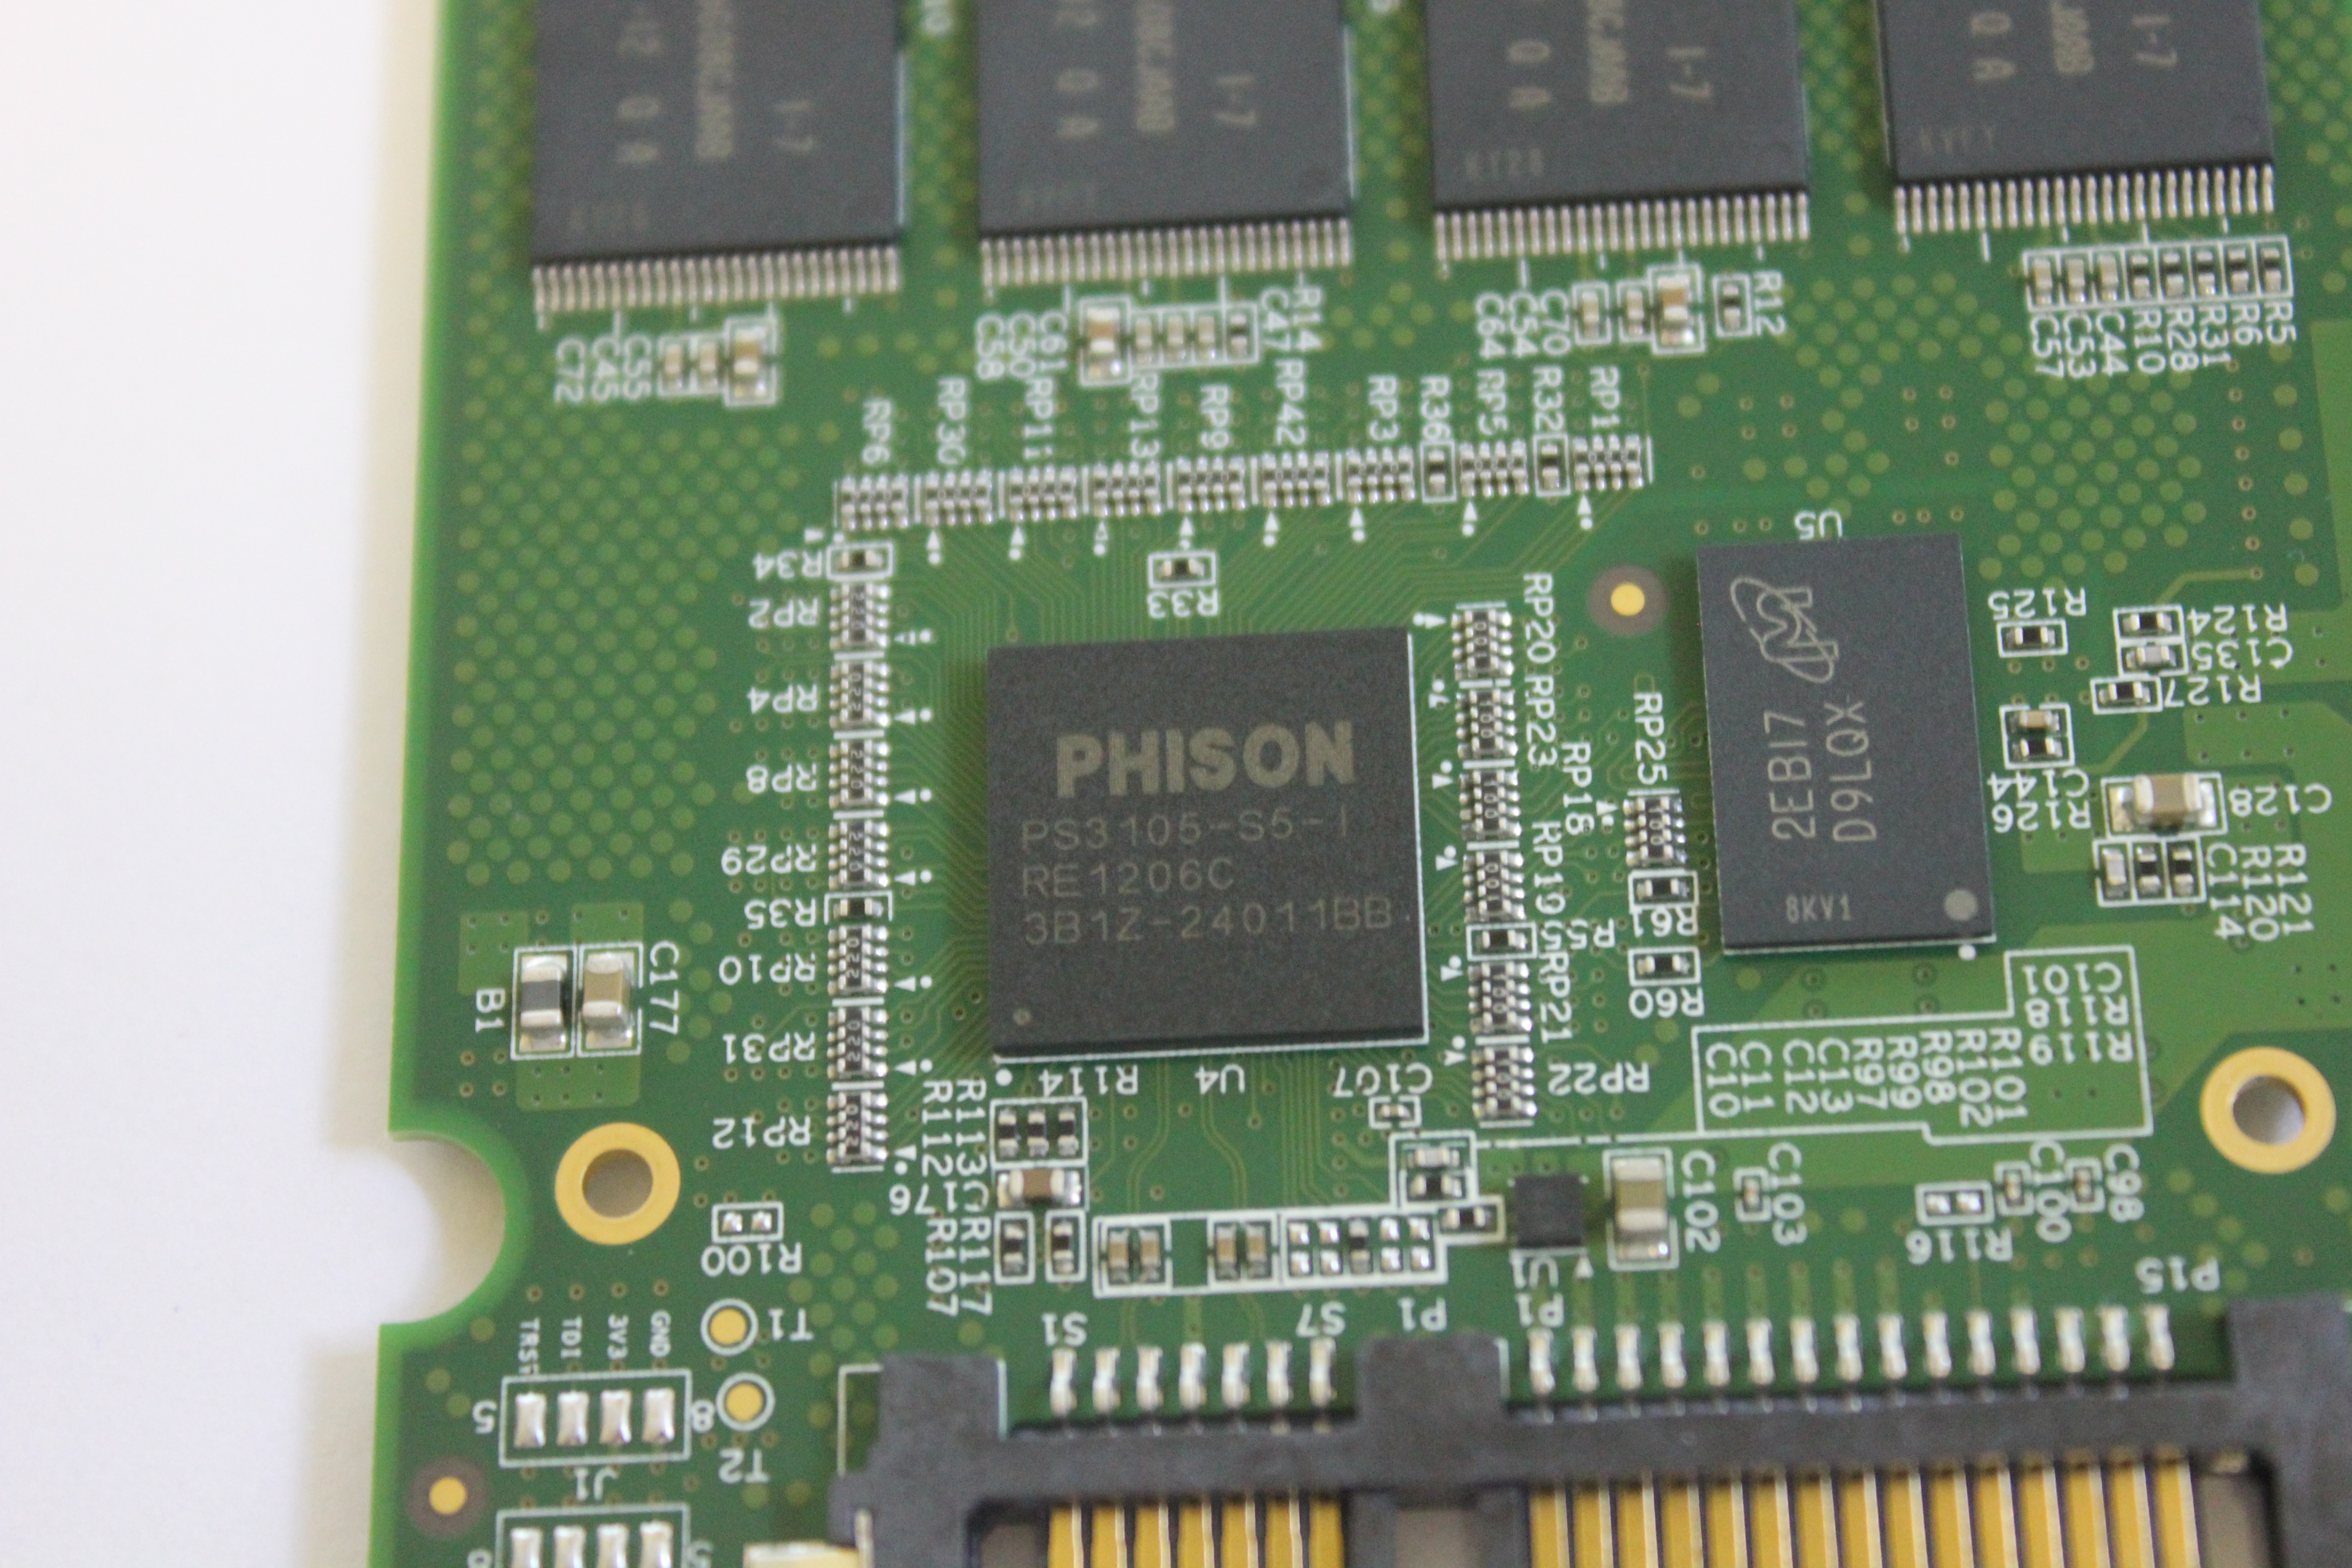
The Phison PS3105 is an 8-channel SATA 3Gbps controller, similar to most consumer grade controllers. It's fabricated using a 90nm process and comes in a 324-pin BGA package but further specifics about the controller are unkown. TRIM and Native Command Queuing (NCQ) are, however, supported. There is also 128MB of LPDDR-333 acting as a cache, which is the minimum for the PS3105. Those unfamiliar with the Phison name might find it interesting to hear that their controllers are often found in budget USB flash memory devices (where performance is often a minor concern).
Test System
| CPU |
Intel Core i5-2500K running at 3.3GHz (Turbo and EIST enabled) |
| Motherboard |
AsRock Z68 Pro3 |
| Chipset |
Intel Z68 |
| Chipset Drivers |
Intel 9.1.1.1015 + Intel RST 10.2 |
| Memory | G.Skill RipjawsX DDR3-1600 2 x 4GB (9-9-9-24) |
| Video Card |
XFX AMD Radeon HD 6850 XXX (800MHz core clock; 4.2GHz GDDR5 effective) |
| Video Drivers | AMD Catalyst 10.1 |
| Desktop Resolution | 1920 x 1080 |
| OS | Windows 7 x64 |
Random Read/Write Speed
The four corners of SSD performance are as follows: random read, random write, sequential read and sequential write speed. Random accesses are generally small in size, while sequential accesses tend to be larger and thus we have the four Iometer tests we use in all of our reviews.
Our first test writes 4KB in a completely random pattern over an 8GB space of the drive to simulate the sort of random access that you'd see on an OS drive (even this is more stressful than a normal desktop user would see). I perform three concurrent IOs and run the test for 3 minutes. The results reported are in average MB/s over the entire time. We use both standard pseudo randomly generated data for each write as well as fully random data to show you both the maximum and minimum performance offered by SandForce based drives in these tests. The average performance of SF drives will likely be somewhere in between the two values for each drive you see in the graphs. For an understanding of why this matters, read our original SandForce article.
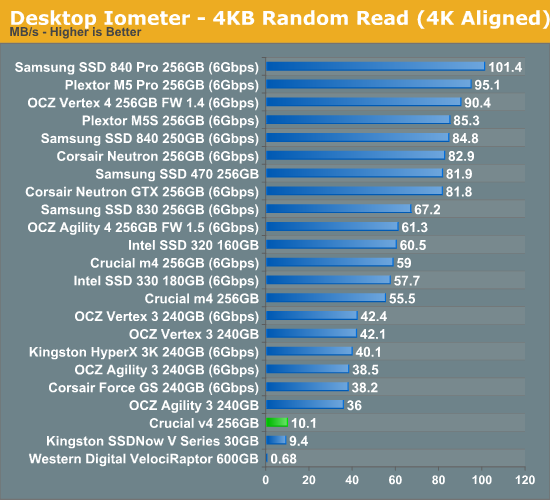
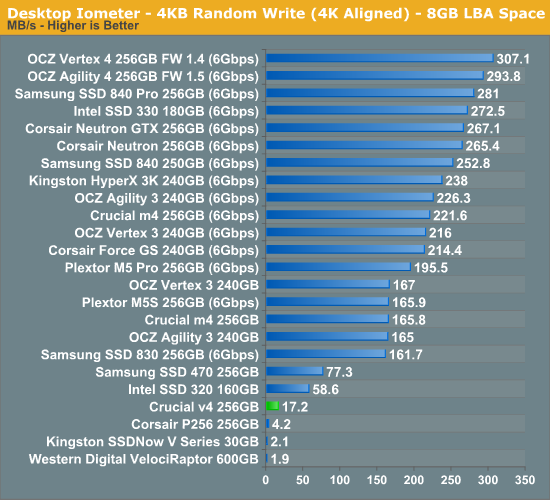
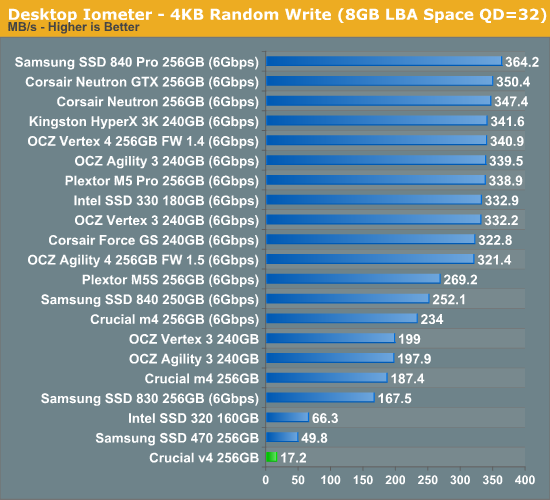
There isn't really a good way to put this: random performance is terrible. We have to go back at least two years to find SSDs this slow and even then we are talking about SSDs that were some of the worst ones that were available. I included a few older SSDs (e.g. Kingston SSDNow V Series and Corsair P256) to show that the v4 isn't the worst SSD on earth, but compared to other recent SSDs it's behind - by a lot. The only "good" news is just how poor even the 600GB VelociRaptor is by comparison; we're still an order of magnitude faster than one of the fastest hard drives for random IO.
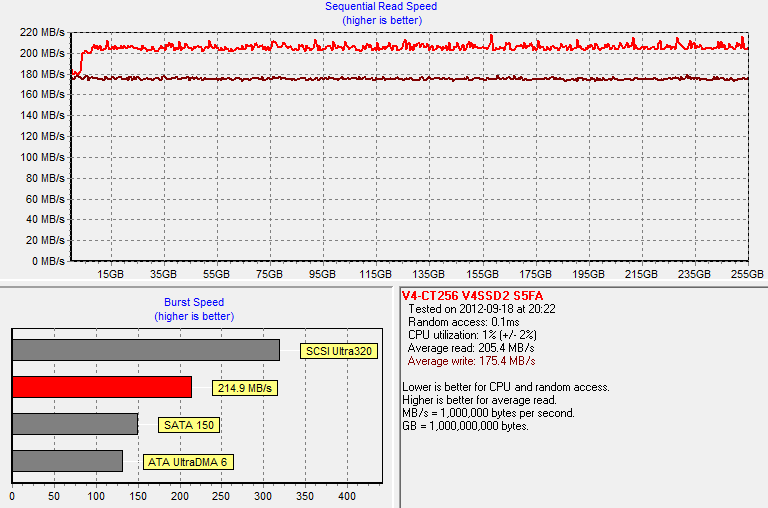
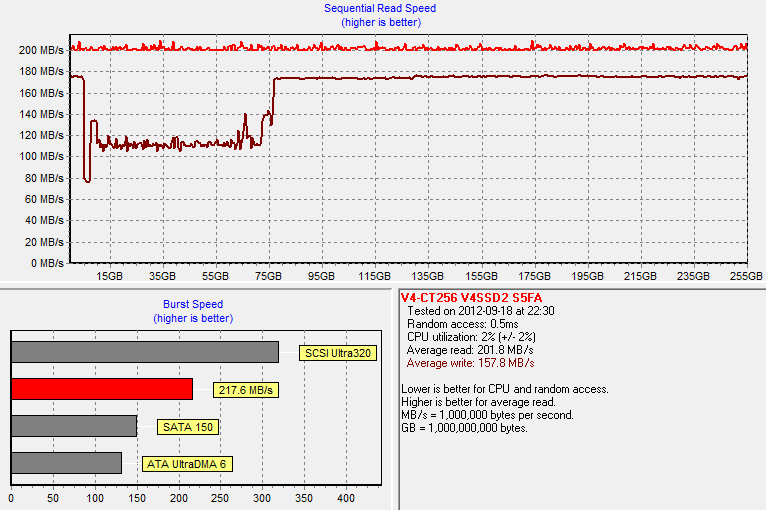
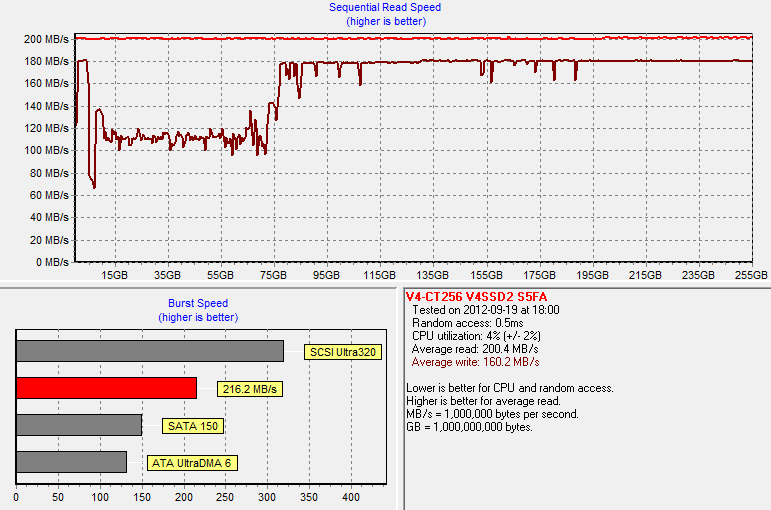
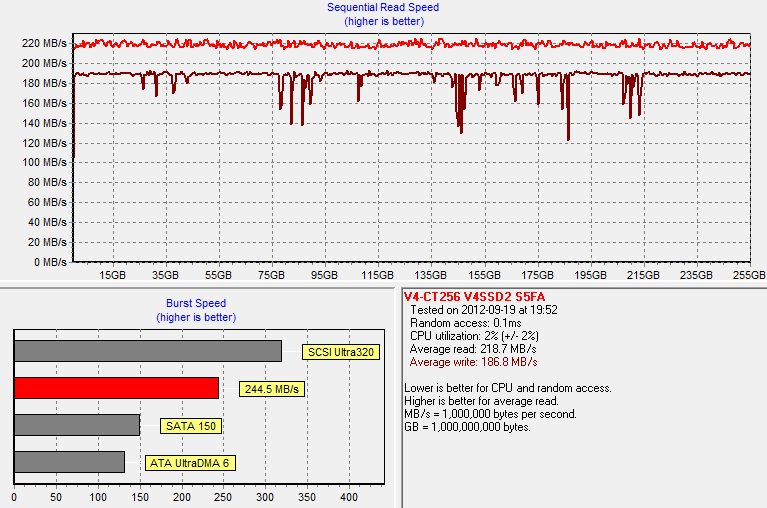
Sequential Read/Write Speed
To measure sequential performance I ran a 1 minute long 128KB sequential test over the entire span of the drive at a queue depth of 1. The results reported are in average MB/s over the entire test length.
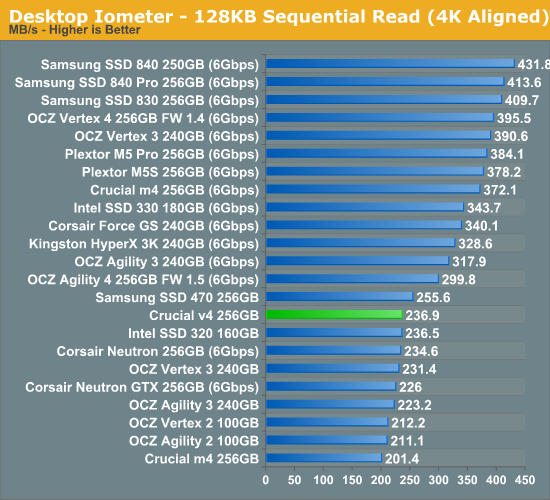
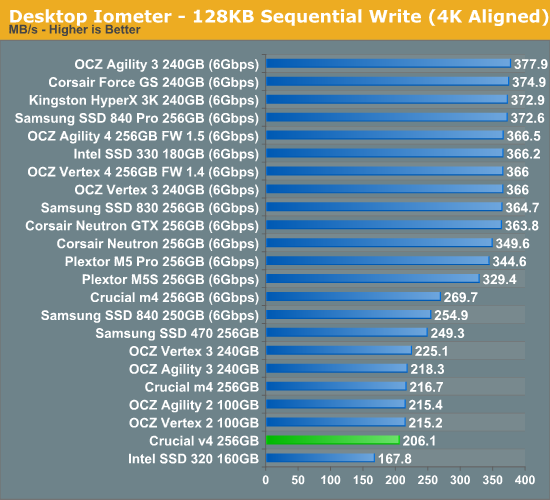
Sequential speeds are fortunately much better and we are talking about performance comparable to SATA 6Gbps operating at SATA 3Gbps speeds.
AS-SSD Incompressible Sequential Performance
The AS-SSD sequential benchmark uses incompressible data for all of its transfers. The result is a pretty big reduction in sequential write speed on SandForce based controllers, while other drives continue to work at roughly the same speed as with compressible data.
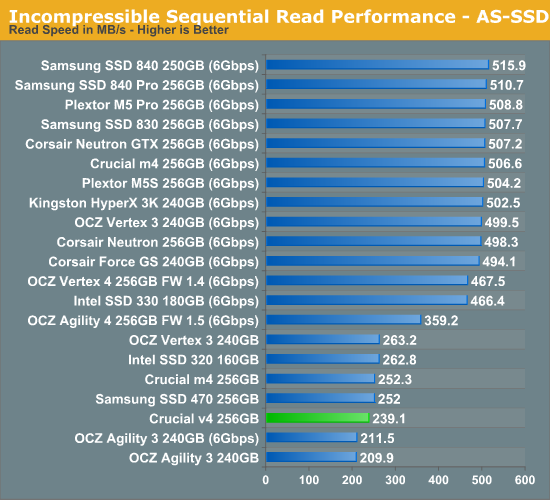
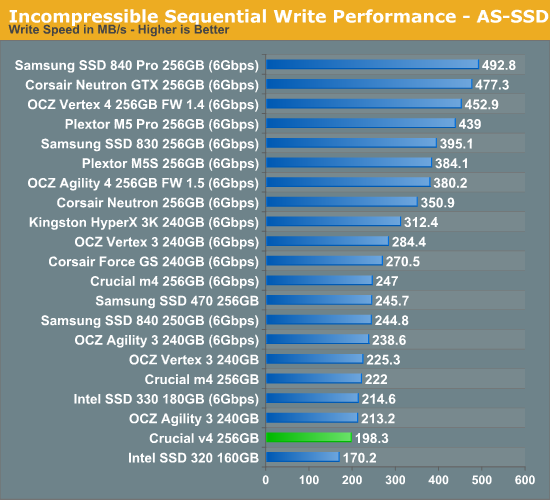
Switching to incompressible data yeilds results similar to our IOmeter sequential tests. Sequential speeds are definitely not an issue as performance is close to what you would get from any drive running at SATA 3Gbps speeds.
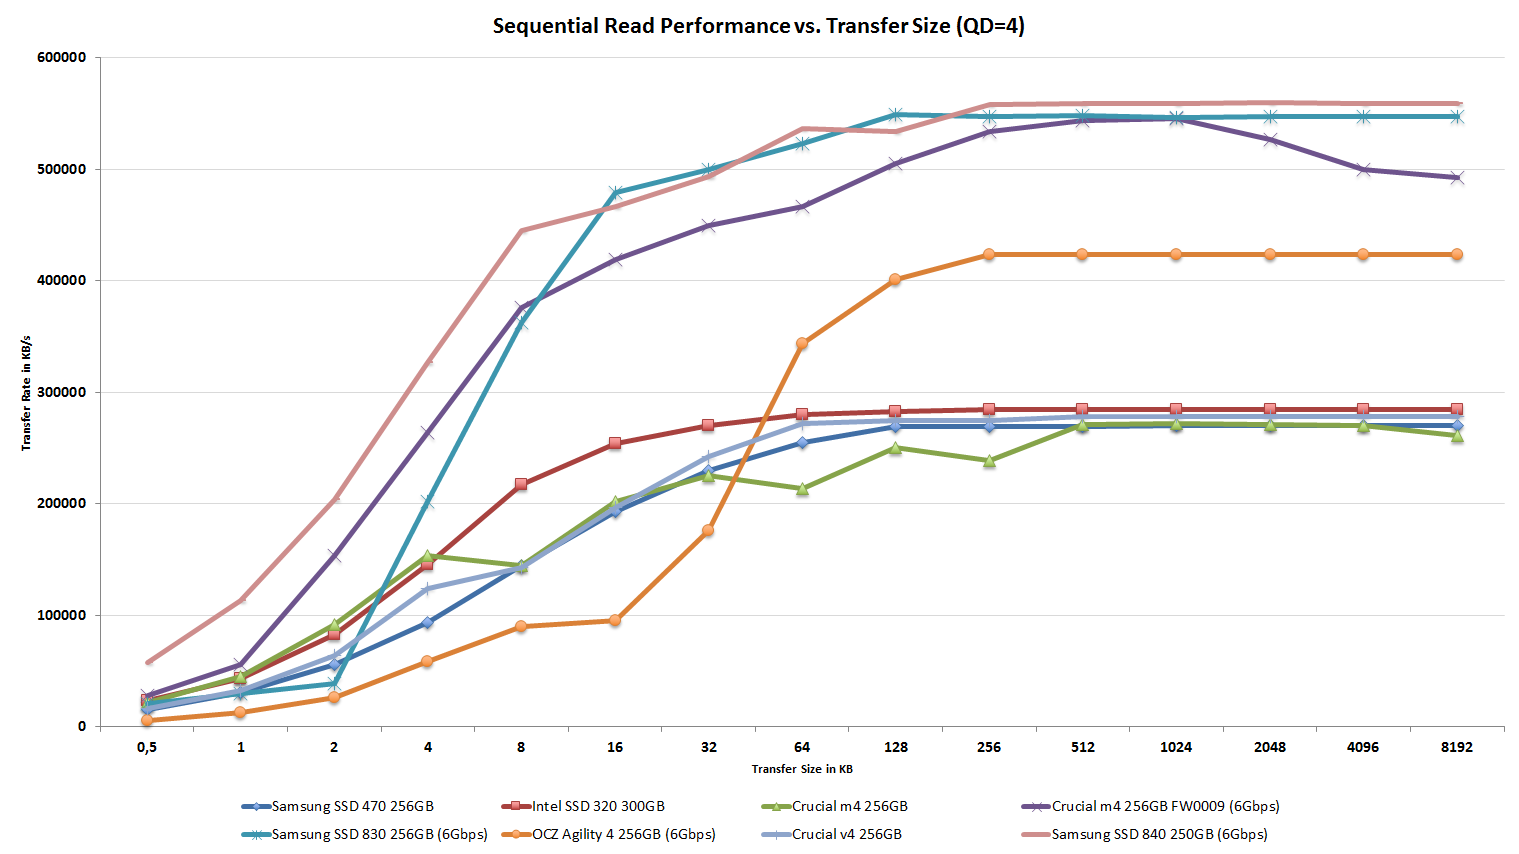
Performance vs. Transfer Size
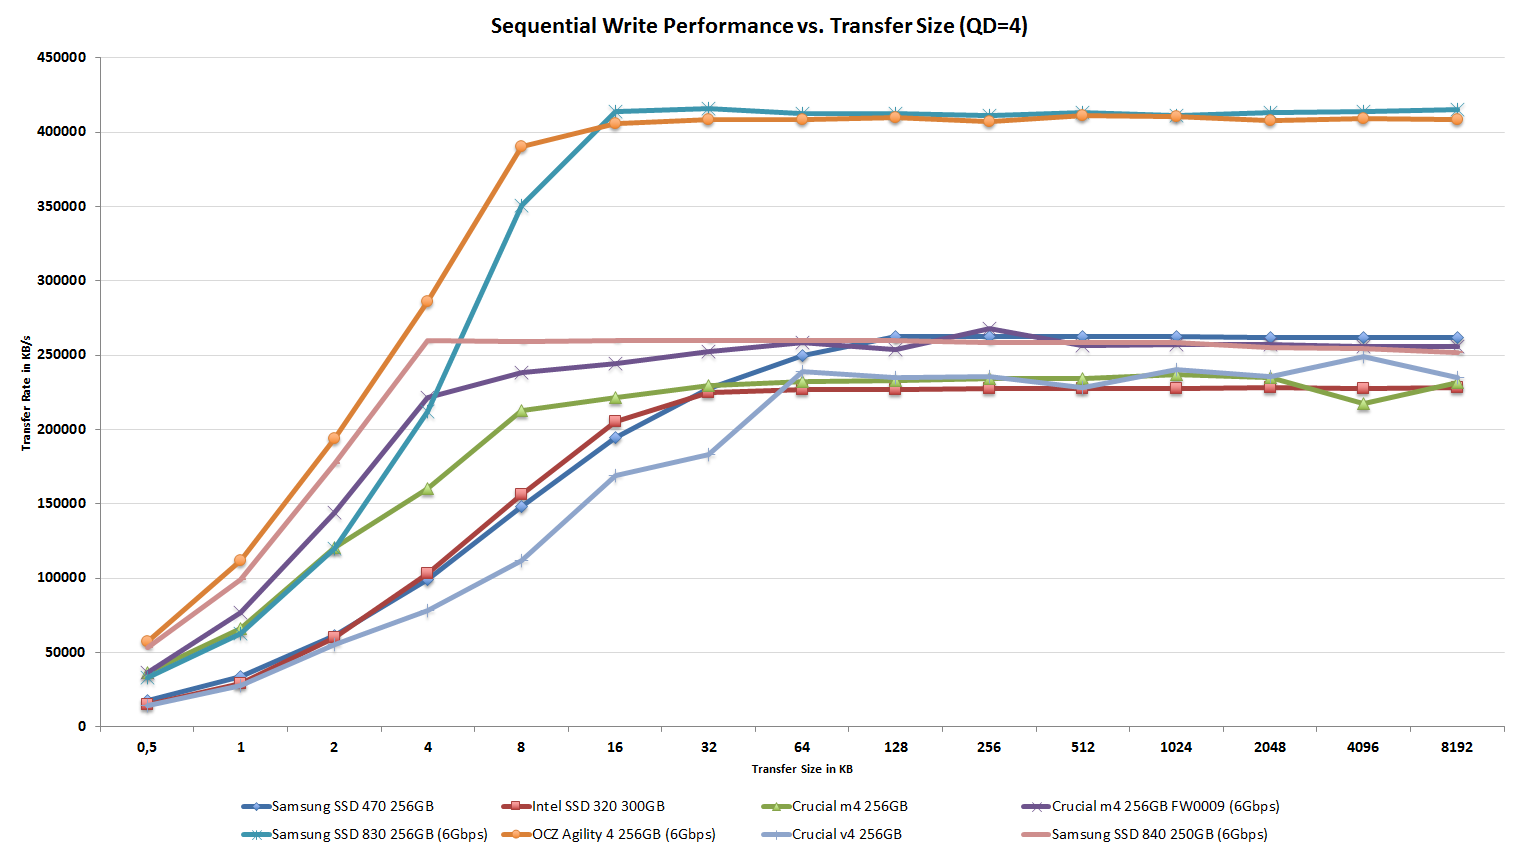
ATTO is a great tool for quickly measuring performance at different transfer sizes. The v4 performs similarly to the m4 connected to SATA 3Gbps port in the read test but its write performance is poor between transfer sizes of 2KB and 64KB.
AnandTech Storage Bench 2011
Last year we introduced our AnandTech Storage Bench, a suite of benchmarks that took traces of real OS/application usage and played them back in a repeatable manner. Anand assembled the traces out of frustration with the majority of what we have today in terms of SSD benchmarks.
Although the AnandTech Storage Bench tests did a good job of characterizing SSD performance, they weren't stressful enough. All of the tests performed less than 10GB of reads/writes and typically involved only 4GB of writes specifically. That's not even enough exceed the spare area on most SSDs. Most canned SSD benchmarks don't even come close to writing a single gigabyte of data, but that doesn't mean that simply writing 4GB is acceptable.
Originally we kept the benchmarks short enough that they wouldn't be a burden to run (~30 minutes) but long enough that they were representative of what a power user might do with their system. Later, however, we created what we refer to as the Mother of All SSD Benchmarks (MOASB). Rather than only writing 4GB of data to the drive, this benchmark writes 106.32GB. This represents the load you'd put on a drive after nearly two weeks of constant usage. And it takes a long time to run.
1) The MOASB, officially called AnandTech Storage Bench 2011—Heavy Workload, mainly focuses on the times when your I/O activity is the highest. There is a lot of downloading and application installing that happens during the course of this test. Our thinking was that it's during application installs, file copies, downloading, and multitasking with all of this that you can really notice performance differences between drives.
2) We tried to cover as many bases as possible with the software incorporated into this test. There's a lot of photo editing in Photoshop, HTML editing in Dreamweaver, web browsing, game playing/level loading (Starcraft II and WoW are both a part of the test), as well as general use stuff (application installing, virus scanning). We included a large amount of email downloading, document creation, and editing as well. To top it all off we even use Visual Studio 2008 to build Chromium during the test.
The test has 2,168,893 read operations and 1,783,447 write operations. The IO breakdown is as follows:
| AnandTech Storage Bench 2011—Heavy Workload IO Breakdown | ||||
| IO Size | % of Total | |||
| 4KB | 28% | |||
| 16KB | 10% | |||
| 32KB | 10% | |||
| 64KB | 4% | |||
Only 42% of all operations are sequential; the rest ranges from pseudo to fully random (with most falling in the pseudo-random category). Average queue depth is 4.625 IOs, with 59% of operations taking place in an IO queue of 1.
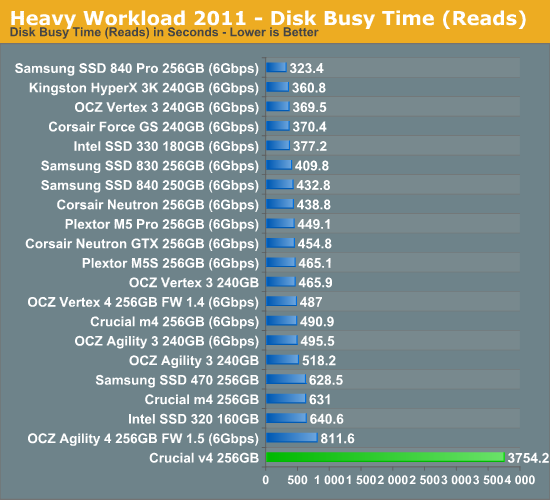
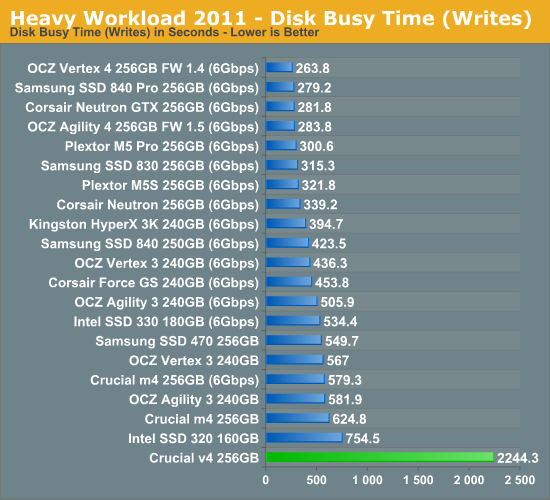
Many of you have asked for a better way to really characterize performance. Simply looking at IOPS doesn't really say much. As a result we're going to be presenting Storage Bench 2011 data in a slightly different way. We'll have performance represented as Average MB/s, with higher numbers being better. At the same time we'll be reporting how long the SSD was busy while running this test. These disk busy graphs will show you exactly how much time was shaved off by using a faster drive vs. a slower one during the course of this test. Finally, we will also break out performance into reads, writes, and combined. The reason we do this is to help balance out the fact that this test is unusually write intensive, which can often hide the benefits of a drive with good read performance.
There's also a new light workload for 2011. This is a far more reasonable, typical every day use case benchmark. It has lots of web browsing, photo editing (but with a greater focus on photo consumption), video playback, as well as some application installs and gaming. This test isn't nearly as write intensive as the MOASB but it's still multiple times more write intensive than what we were running last year.
We don't believe that these two benchmarks alone are enough to characterize the performance of a drive, but hopefully along with the rest of our tests they will help provide a better idea. The testbed for Storage Bench 2011 has changed as well. We're now using a Sandy Bridge platform with full 6Gbps support for these tests.
AnandTech Storage Bench 2011—Heavy Workload
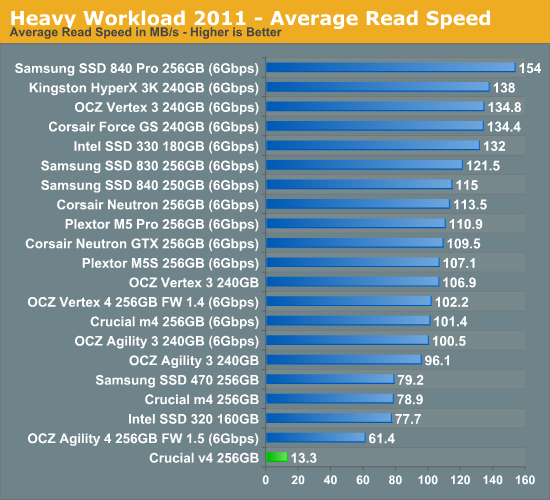
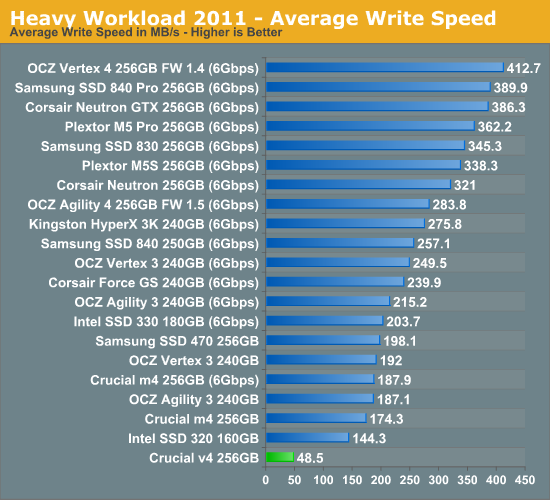
We'll start out by looking at average data rate throughout our new heavy workload test:
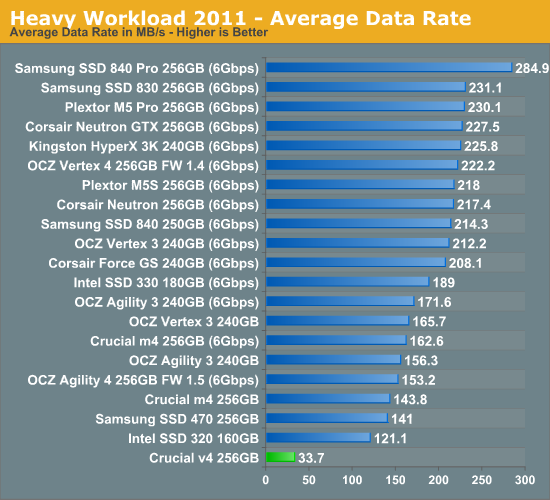
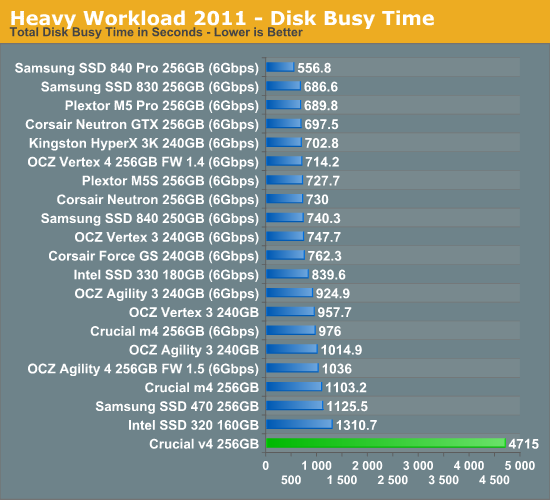
The poor random read/write speeds do have a significant impact on our Storage Suite scores as well. The v4 is the slowest SSD we have tested since the creation of the MOASB. To put this in perspective, it took over six hours for the Heavy suite to run, whereas it usually takes around an hour and a half. Any current SSD will be three to five times faster than the v4, even when operating at SATA 3Gbps speeds.
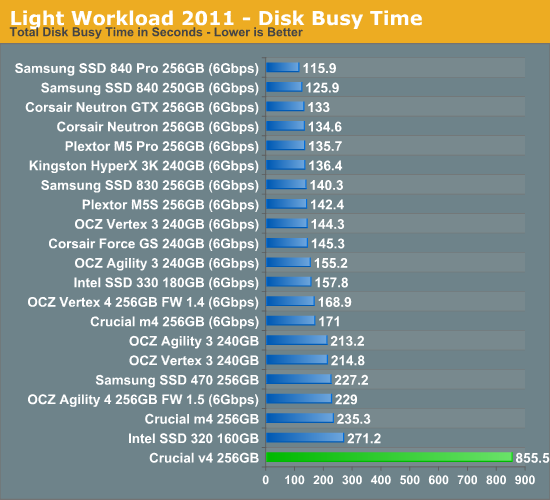
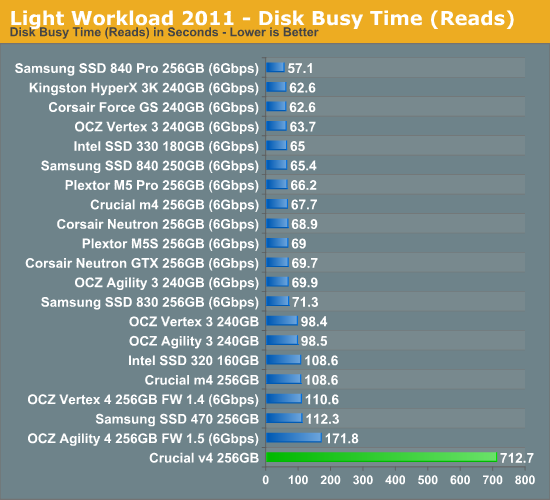
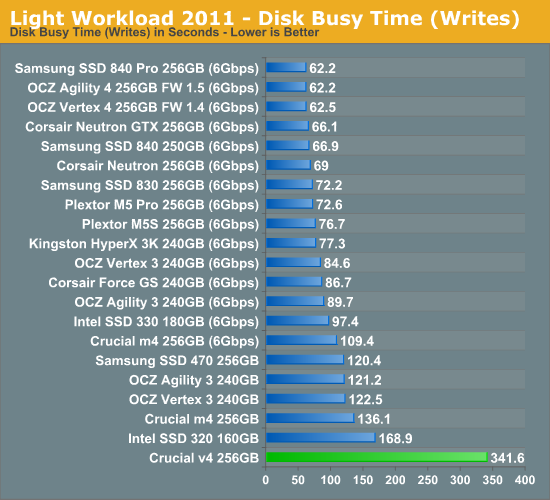
The next three charts just represent the same data, but in a different manner. Instead of looking at average data rate, we're looking at how long the disk was busy for during this entire test. Note that disk busy time excludes any and all idles; this is just how long the SSD was busy doing something:
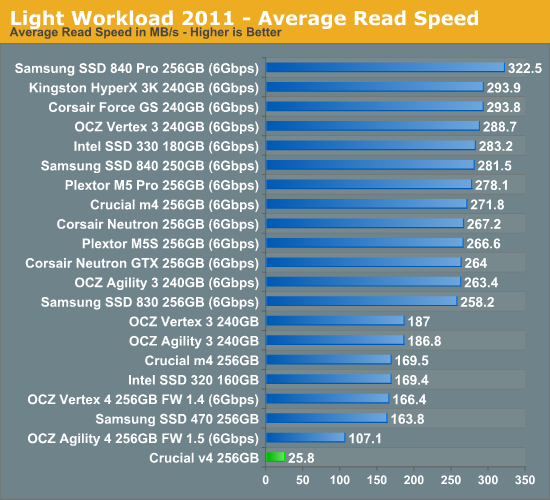
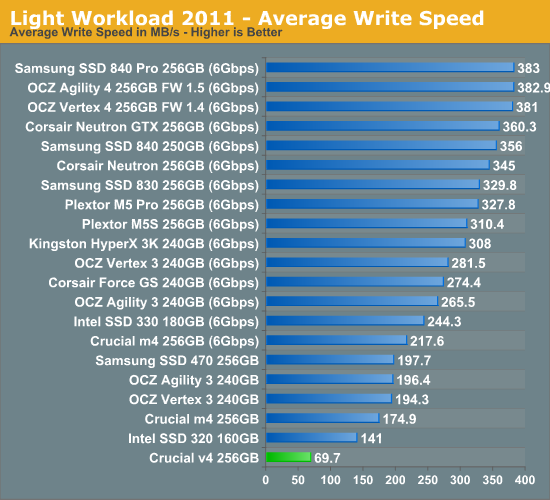
AnandTech Storage Bench 2011, Light Workload
Our new light workload actually has more write operations than read operations. The split is as follows: 372,630 reads and 459,709 writes. The relatively close read/write ratio does better mimic a typical light workload (although even lighter workloads would be far more read centric). The I/O breakdown is similar to the heavy workload at small IOs, however you'll notice that there are far fewer large IO transfers:
| AnandTech Storage Bench 2011—Light Workload IO Breakdown | ||||
| IO Size | % of Total | |||
| 4KB | 27% | |||
| 16KB | 8% | |||
| 32KB | 6% | |||
| 64KB | 5% | |||

Our Light suite doesn't bring any better news either as the v4 is still over three times slower than any other SSD.
Performance Over Time & TRIM
I first ran HD Tach on a secure erased drive to get the baseline:
Next I filled the drive with sequential data and tortured it with compressible 4KB random writes (LBA space 100%, QD=32) for 20 minutes:
The result is rather interesting. Performance does not degrade significantly and after around 30% of the LBAs have been written to, performance is back to where it was after secure erasing.
As 20 minutes wasn't enough, I extended the length of the torture to 60 minutes:
And the graph is almost the same as after 20 minutes of torturing. The v4 seems to be doing active garbage collection, which means it tries to clean some blocks every time a write request comes in. As you can see, performance is getting better and better as the drive receives write requests and it's again back to brand new state after ~75GB of writes.
FInally I TRIMed the drive:
There are a few odd drops but overall write speed is what it should be. The drops are most likely related to internal task scheduling. A sent TRIM command does not mean that the drive will automatically exceute it as the controller may prioritize some other task, which leads to a scenario where all blocks are not cleaned.
Power Consumption
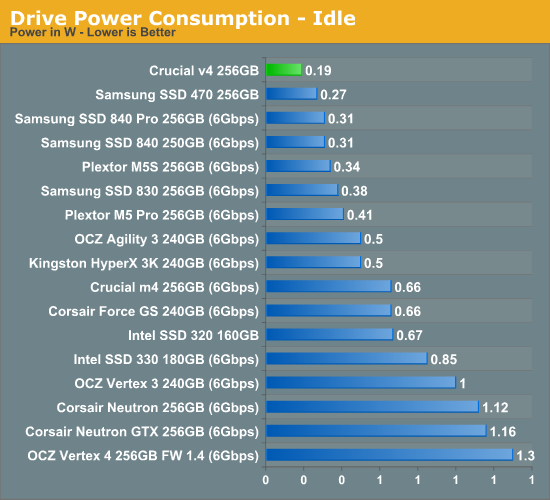
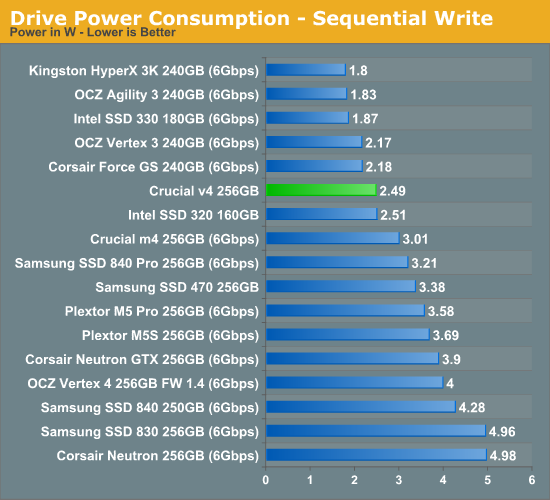
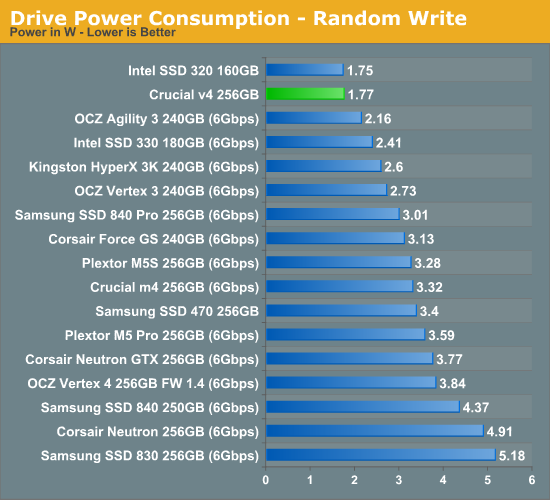
If I had to find one good thing about the v4, that would be power consumption. As you can see above, idle power consumption is the lowest we have tested and power consumption under load is also among the lowest. We're still faster than hard drives and power is lower, so if the price is significantly lower than other SSDs it could serve as a laptop drive. Even so, the difference is large enough so as to be immediately tangible in day-to-day use.
Final Words
Building a low-cost SSD is not easy; we have witnessed that many times now. There are essentially two ways to build one: either you go with a cheap controller or cheap NAND. What Crucial chose was a cheap controller and higher quality NAND. Since Crucial is a subsidiary of Micron, that choice makes sense because their expertise lies in the NAND fabrication, not in the controller technology. NAND actually still has fairly big profits despite the decline in prices, so Crucial/Micron can use good quality NAND in low-end SSDs and still turn a profit. A powerful third party controller would basically make the v4 an m4 and defeat the purpose of a budget SSD.
A good example of the other approach, a powerful controller and cheap NAND, is OCZ's Agility 4. It uses the same Indilinx Everest 2 controller as found in Vertex 4 but is coupled with asynchronous NAND instead of faster but more expensive synchronous NAND. OCZ is a controller company, so that concept was the most sensible for them. You will have to buy NAND from someone anyway and an easy way to cut the expenses is to simply buy cheaper, lower quality NAND.
Both of these ways have something in common: neither of them really works. The Agility 4 isn't really worth the small savings as we found in our review, and neither is Crucial's v4. To be straight, the v4 is slow. I'm okay with it being SATA 3Gbps but in that case, it should at least be one of the faster SATA 3Gbps drives. Intel SSD 320 and first generation SandForce drives are beating it by a factor of three to five in both Storage Suites, which is unacceptable for a new SSD in 2012.
The v4 would have to be significantly cheaper than any other SSD to be worth buying. At the current prices, you can get an SSD that is several times faster for $5-20 more depending on the model and capacity. If you're lucky, you may be able to catch a hot sale and get a good SSD (say Samsung SSD 830 for instance) for less than the v4. Hence I really can't recommend the v4 at all; you're better off waiting a short while for a sale on a better SSD, or just pay slightly more now if you're in a position where waiting is not possible (a drive failure for example).
The only value SSD that really makes sense is Samsung's SSD 840. You really need a good controller and firmware to build a good SSD; if you just use the cheapest possible controller on the market you will end up with a bad SSD. Fast NAND doesn't help if the controller is the bottleneck because it simply cannot feed the NAND with data fast enough, but it's possible to get away with slower NAND if you have a great controller as we saw with the SSD 840. Even the 840 faces stiff competition from existing drives (e.g. Samsung's own 830), though, so until prices drop for TLC drives we suggest looking at the existing SSDs.


