Original Link: https://www.anandtech.com/show/6200/owc-mercury-electra-3g-max-960gb-review-cramming-1tb-of-nand-inside-25-chassis
OWC Mercury Electra 3G MAX 960GB Review: 1TB of NAND in 2.5" Form Factor
by Kristian Vättö on October 18, 2012 1:00 AM ESTIntroduction
One of the main concerns about buying an SSD has always been the limited capacity compared to traditional hard drives. Nowadays we have hard drives as big as 4TB, whereas most SATA SSDs top out at 512GB. Of course, SATA SSDs are usually 2.5” and standard 2.5” hard drives don’t offer capacities like 4TB – the biggest we have at the moment is 1TB. The real issue, however, has been price. If we go a year back in time, you had to fork out around $1000 for a 512GB SSD. Given that a 500GB hard drive could be bought for a fraction of that, there weren’t many who were willing to pay such prices for a spacious SSD. In only a year NAND prices have dropped dramatically and it’s not unusual to see 512GB SSDs selling for less than $400. While $400 is still a lot money for one component, it’s somewhat justifiable if you need to have one big drive instead of a multi-drive setup (e.g. in a laptop).
The decrease in NAND prices has not only boosted SSD sales but also opened the market for bigger capacities. Given the current price per GB, a 1TB SSD should cost around $1000, the same price a 512GB SSD cost a year ago. But there is one problem: 128Gb 20nm IMFT die isn’t due until 2013. Most consumer-grade controllers don’t support more than a total of 64 NAND dies, or eight NAND dies per channel. With a 64Gb die, the maximum capacity for most controllers works out to be 512GB. There are exceptions such as Intel’s SSD 320 as it uses Intel’s in-house controller, a 10-channel design allowing greater capacities of up to 640GB (of which 600GB are user accessible). Samsung's SSD 830 also supports greater capacities (Apple is offering 768GB in the Retina MacBook Pro) but at least for now that model is OEM only.
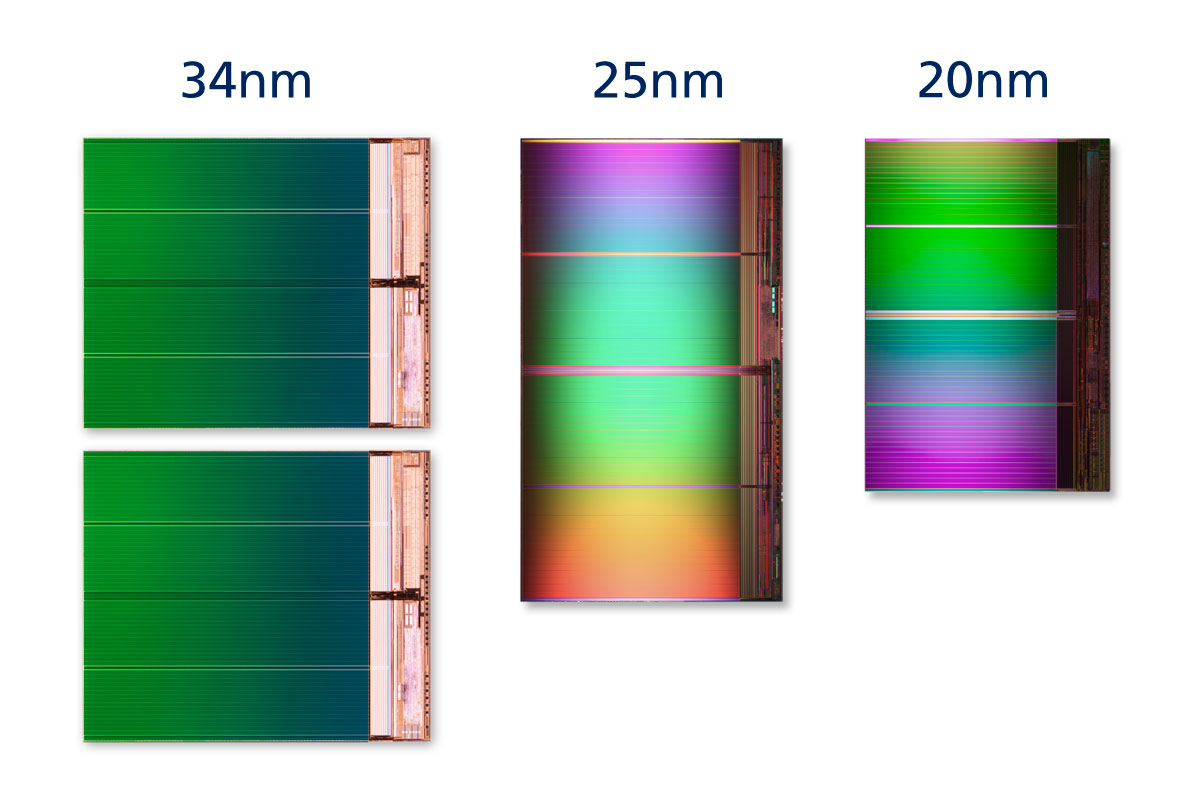
The reason behind this limitation is simple: with twice as much NAND, you have twice as many pages to track. A 512GB SSD with 25nm NAND already has 64 million pages. That is a lot data for the controller to sort through and you need a fast controller to address that many pages without a performance hit. 128Gb 20nm IMFT NAND will double the page size from 8KB to 16KB, which allows 1024GB of NAND to be installed while keeping the page count the same as before. The increase in page size is also why it takes a bit longer for SSD manufacturers to adopt 128Gb NAND dies. You need to tweak the firmware to comply with the new page and block sizes as well as change program and erase times. Remember that page size is the smallest amount of data you can write. When you increase page size, especially the way small IOs (smaller than the page size) are handled needs to be reworked. For example, if you’re writing a 4KB transfer, you don’t want to end up writing 16KB or write amplification will go through the roof. Block size will also double, which can have an impact on garbage collection and wear leveling (you now need to erase twice as much data as before).
Since 128Gb 20nm IMFT die and 1TB SSDs may be over a half a year away, something else has to be done. There are plenty of PCIe SSDs that offer more than 512GB, but outside of enterprise SSDs they are based on the same controllers as regular 2.5” SATA SSDs. What is the trick here, then? It’s nothing more complicated than RAID 0. You put two or more controllers on one PCB, give each controller their own NAND, and tie up the package with a hardware RAID controller. PCIe SSDs will also have SATA/SAS to PCIe bridges to allow PCIe connectivity. Basically, that’s two or more SSDs in one package but only one SATA port or PCIe slot will be taken and the drive will appear as a single volume.
PCIe SSDs with several SSD controllers in RAID 0 have existed for a few years now but we haven’t seen many similar SSDs in SATA form factors. PCIe SSDs are easier in the sense that there are less space limitations to worry about. You can have a big PCB, or even multiple PCBs, and there won’t be any issues because PCIe cards are fairly big to begin with. SATA drives, however, have strict dimensions limits. You can’t go any bigger than standard 2.5” or 3.5” because people won’t buy a drive that doesn’t fit in their computer. 3.5” SSD market is more or less non-existent so if you want to make a product that will actually sell, you have to go 2.5”. PCBs in 2.5” SSDs are not big; if you want to fit the components of two SSDs inside a 2.5” chassis you need to be very careful.
SATA is also handicapped in terms of bandwidth. Even with SATA 6Gbps, you are limited to around 560-570MB/s, which can be achieved with a single fast SSD controller. PCIe doesn’t have such limitations as you can go all the way to up to 16GB/s with a PCIe 3.0 x16 slot. Typically PCIe SSDs are either PCIe 2.0 x4 or x8, but we are still looking at 2-4GB/s of raw bandwidth—over three times more than what SATA can currently provide. Hence there’s barely any performance improvement from putting two SSDs inside a 2.5” chassis; you’ll still be bottlenecked by the SATA interface.
But what you do get from a RAID 0 2.5" SSD is the possibility for increased capacity. The enclosures are big enough to house two regular size PCBs, which in theory allows up to two 512GB SSD to be installed into the same enclosure. We haven't seen many solutions similar to this previously, but a few months ago OWC released a 960GB Mercury Electra MAX that has two SF-2181 controllers in RAID 0 and 512GiB of NAND per controller. Lets take a deeper look inside, shall we?
The 960GB OWC Mercury Electra MAX
| OWC Mercury Electra MAX 3G (960GB) Specifications | |
| Raw NAND Capacity | 1024GiB |
| Formatted Capacity | 894GiB |
| NAND | Micron 25nm Asynchronous MLC NAND |
| Controller | 2x SandForce SF-2181 |
| RAID Controller | Silicon Image SteelVine Sil5923CNU |
| Sequential Read | 254MB/s |
| Sequential Write | 250MB/s |
| Sequential Read (Incompressible Data) | 252MB/s |
| Sequential Write (Incompressible Data) | 223MB/s |
| Price | $1,118 |
I want to start off by saying that the 960GB Mercury Electra is not meant to be the highest performing SSD on the market. OWC apparently had to go with a SATA 3Gbps interface due to the limited size that a 2.5" form factor offers, which makes especially thermals a tough item to deal with. Price was also a concern as the 960GB Mercury Electra is not cheap to begin with, so sticking with SATA 3Gbps allowed OWC to keep the price a bit more affordable.
Oddly enough, OWC hasn't reported any random read or write numbers for the 960GB Mercury Electra. I asked OWC why and they told me it's because they see audio and video professionals as the biggest niche for the drive, whose usage will mainly consist of big sequential file transfers and hence OWC felt that the random read/write speeds are not important. We'll have our own real-world numbers in a moment either way, but capping all read/writes to ~3Gbps is going to severely limit performance in some scenarios.
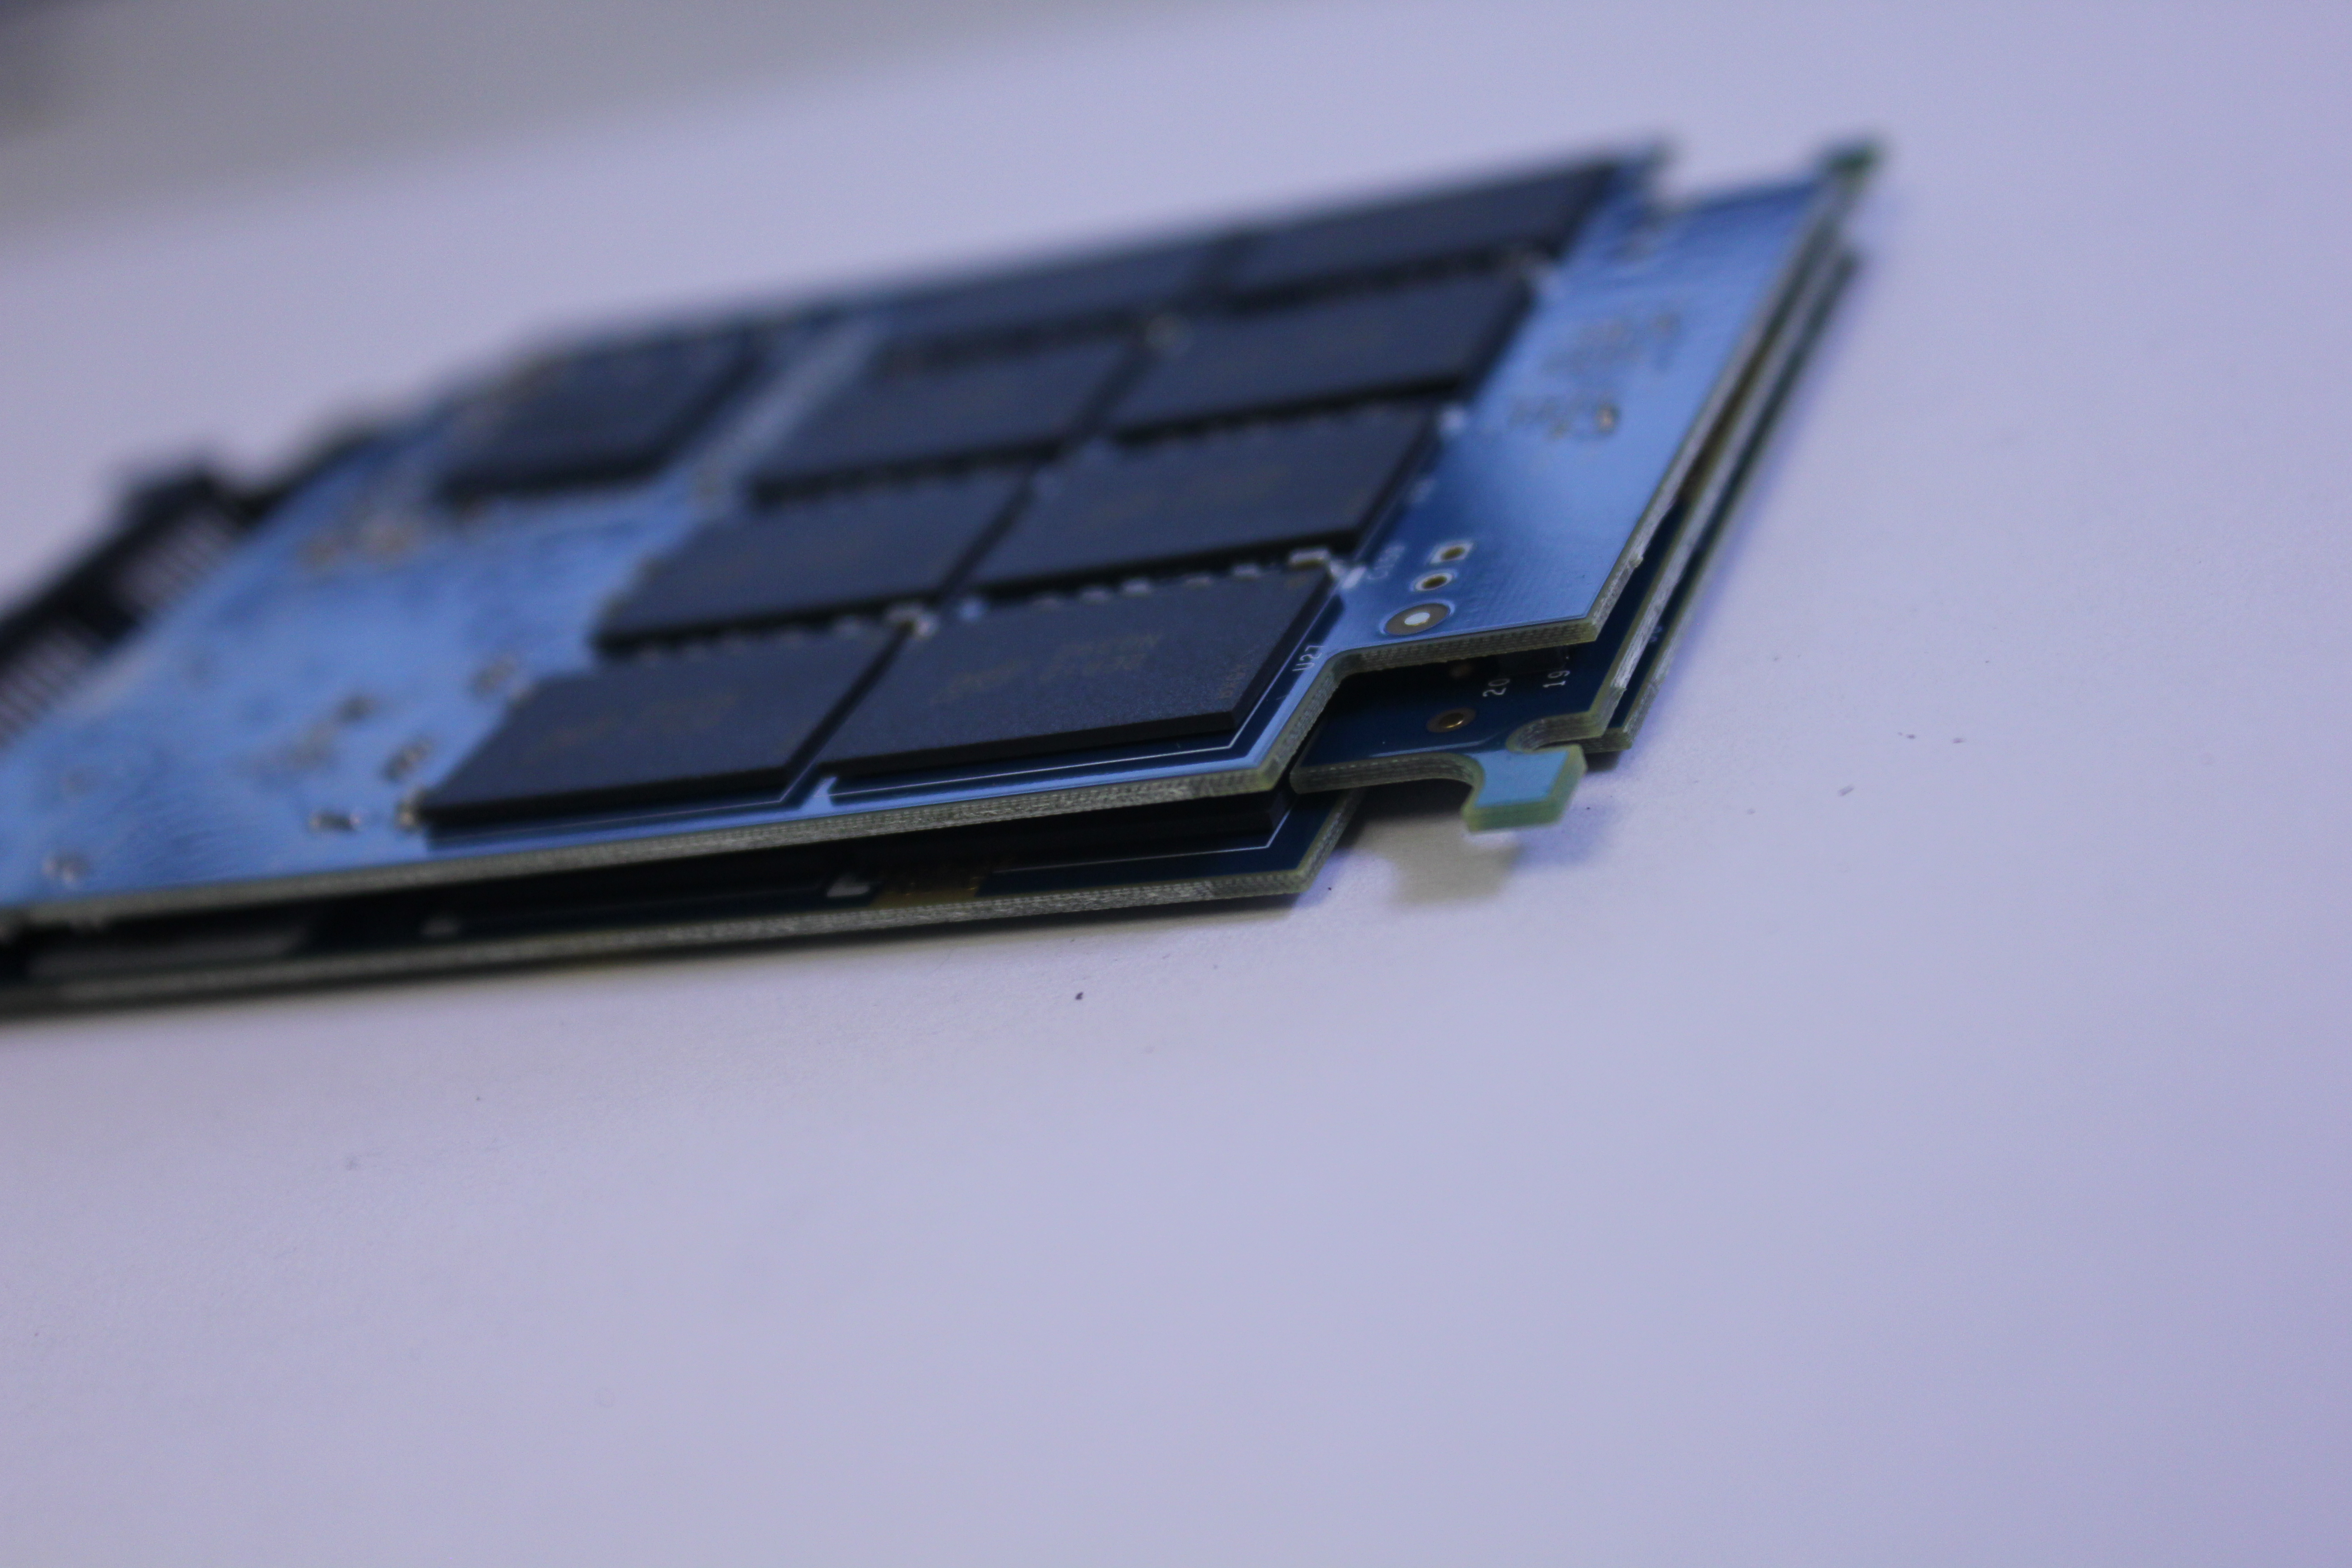
Inside the 960GB OWC Mercury Electra MAX
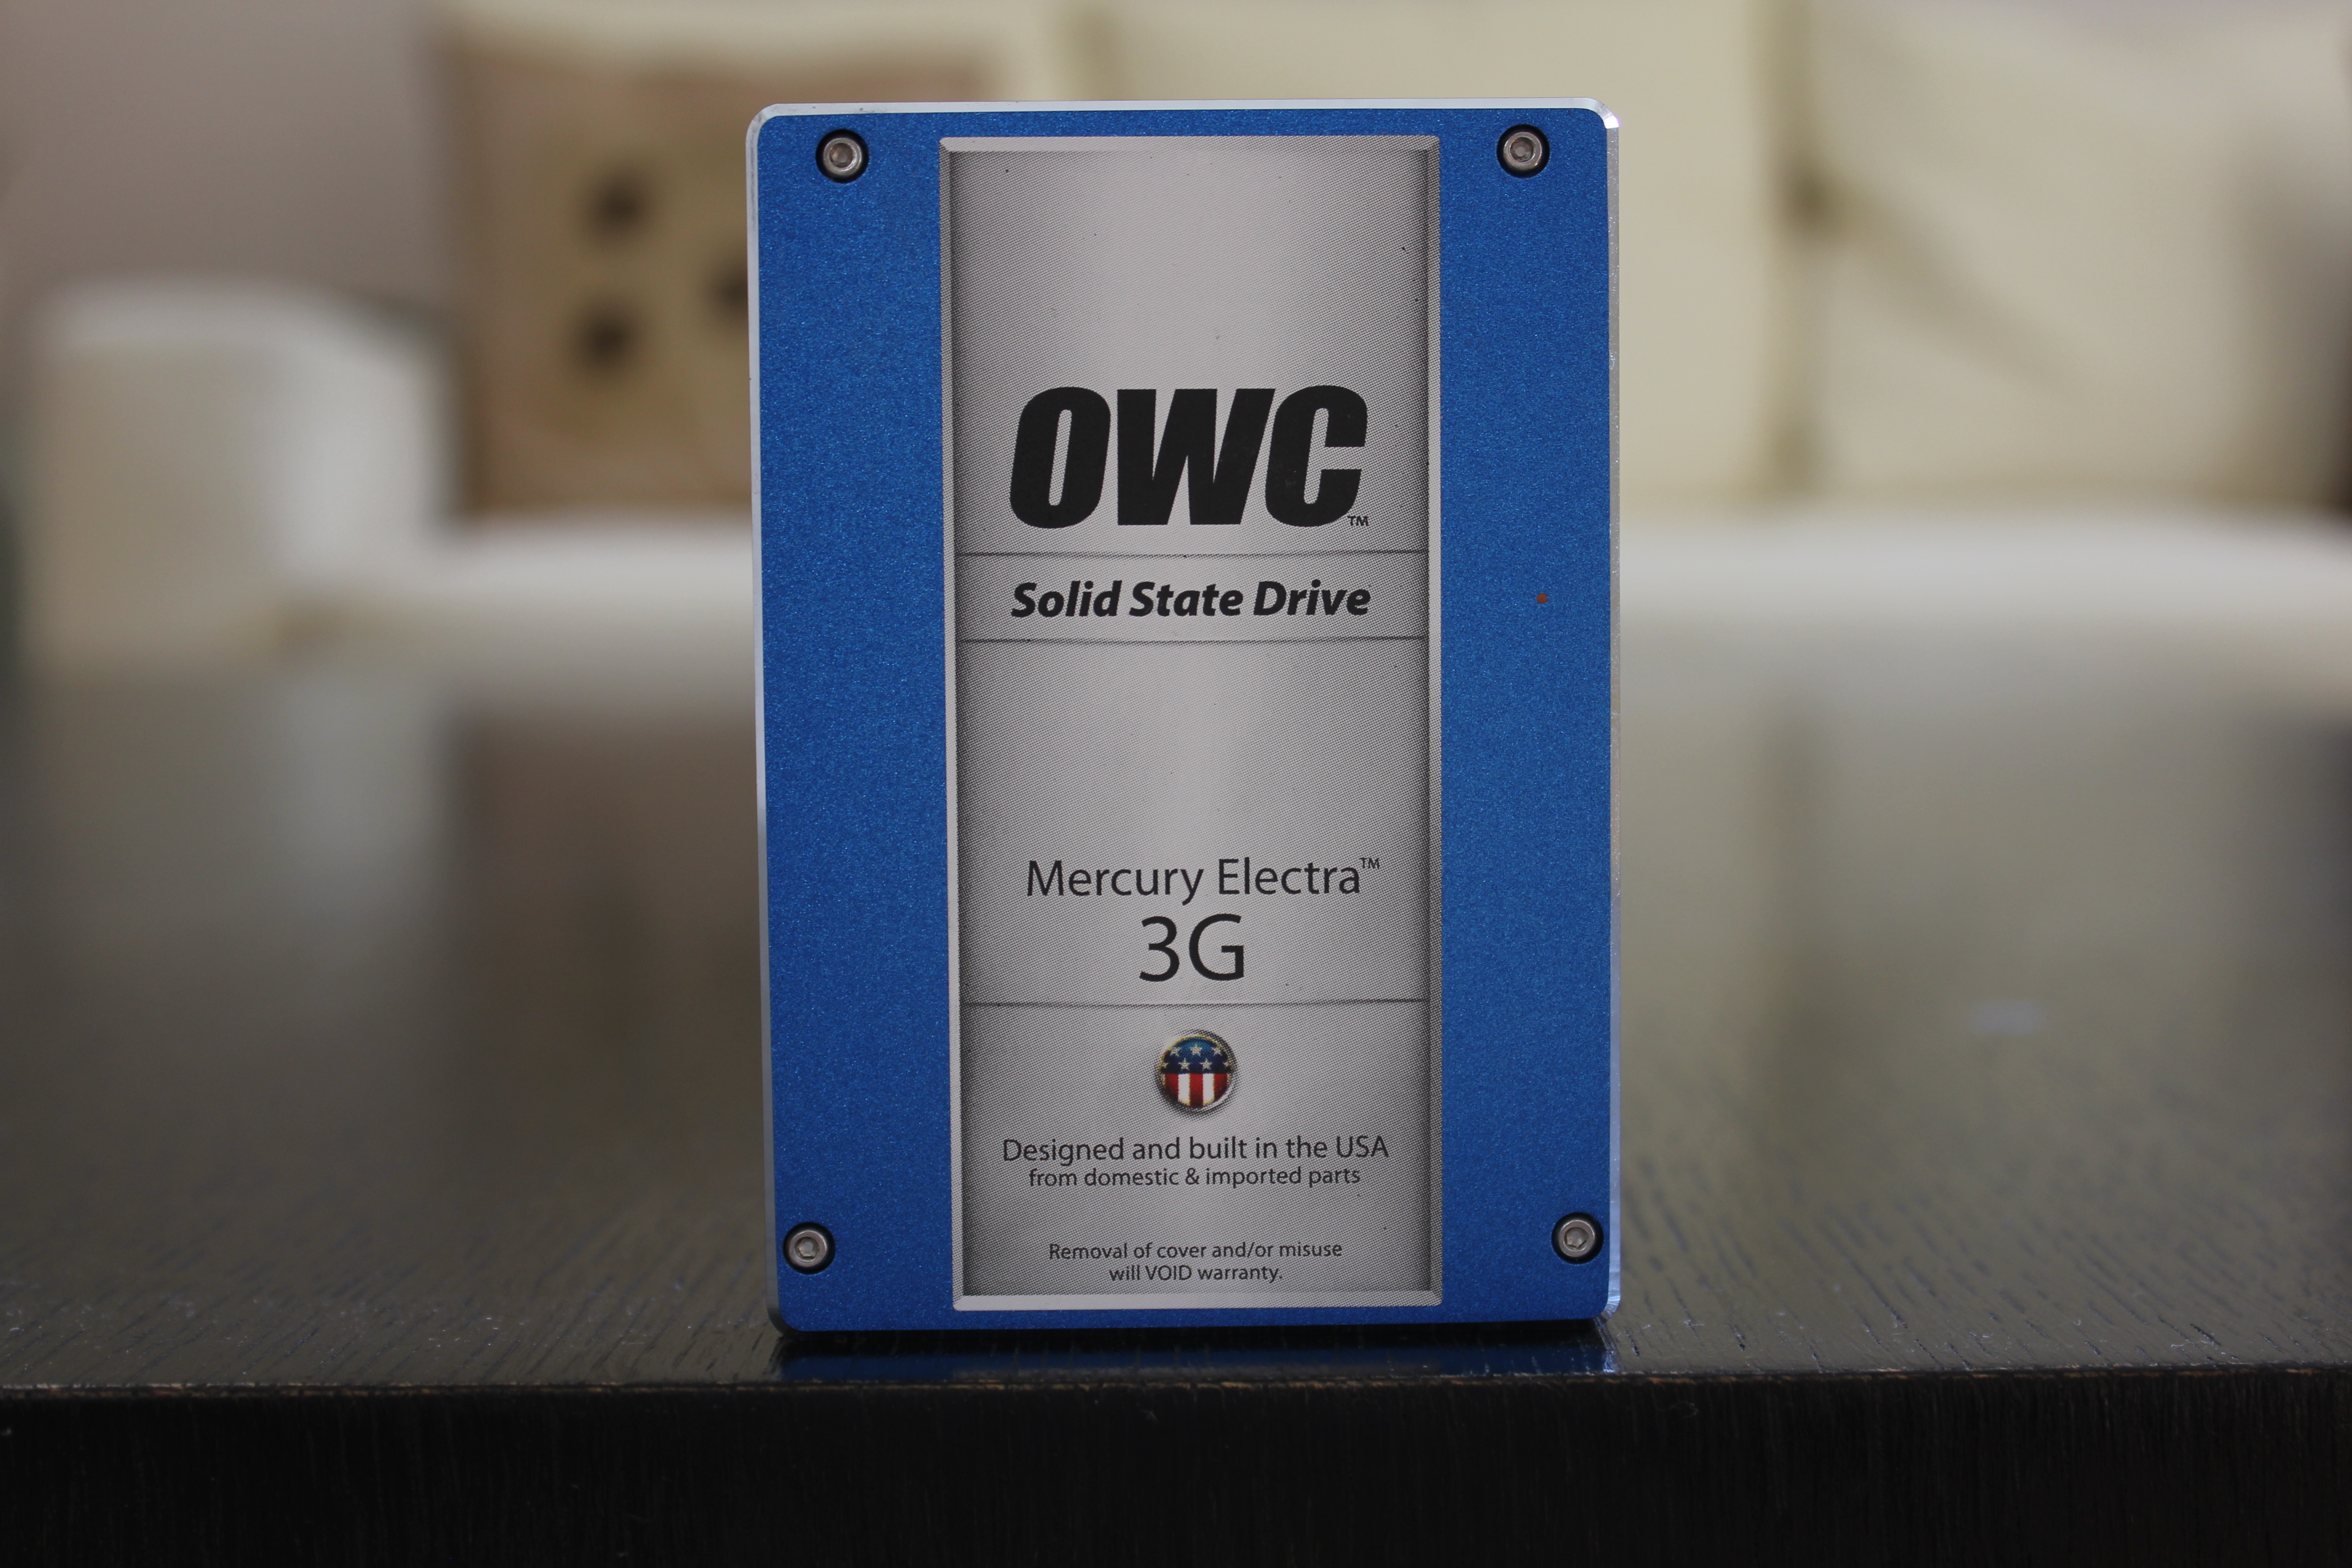
Externally the 960GB Mercury Electra doesn’t differ from its smaller siblings. The only external difference is that when you turn the SSD around, you see a 960GB sticker. I have to say the Mercury Electra feels very rugged and solid. The chassis is made out of fairly thick metal and that gives the impression of good quality.

The internal design of the 960GB Mercury Electra is not something we typically see. Because it’s basically two 480GB SSDs in RAID 0, there are two main PCBs to hold the controllers and NAND. Each PCB consists of a SandForce SF-2181 controller and 16 NAND packages. There are also two smaller PCBs to keep the main ones separate, although the other small PCB is also housing the SATA connector and RAID controller.
The SF-2181

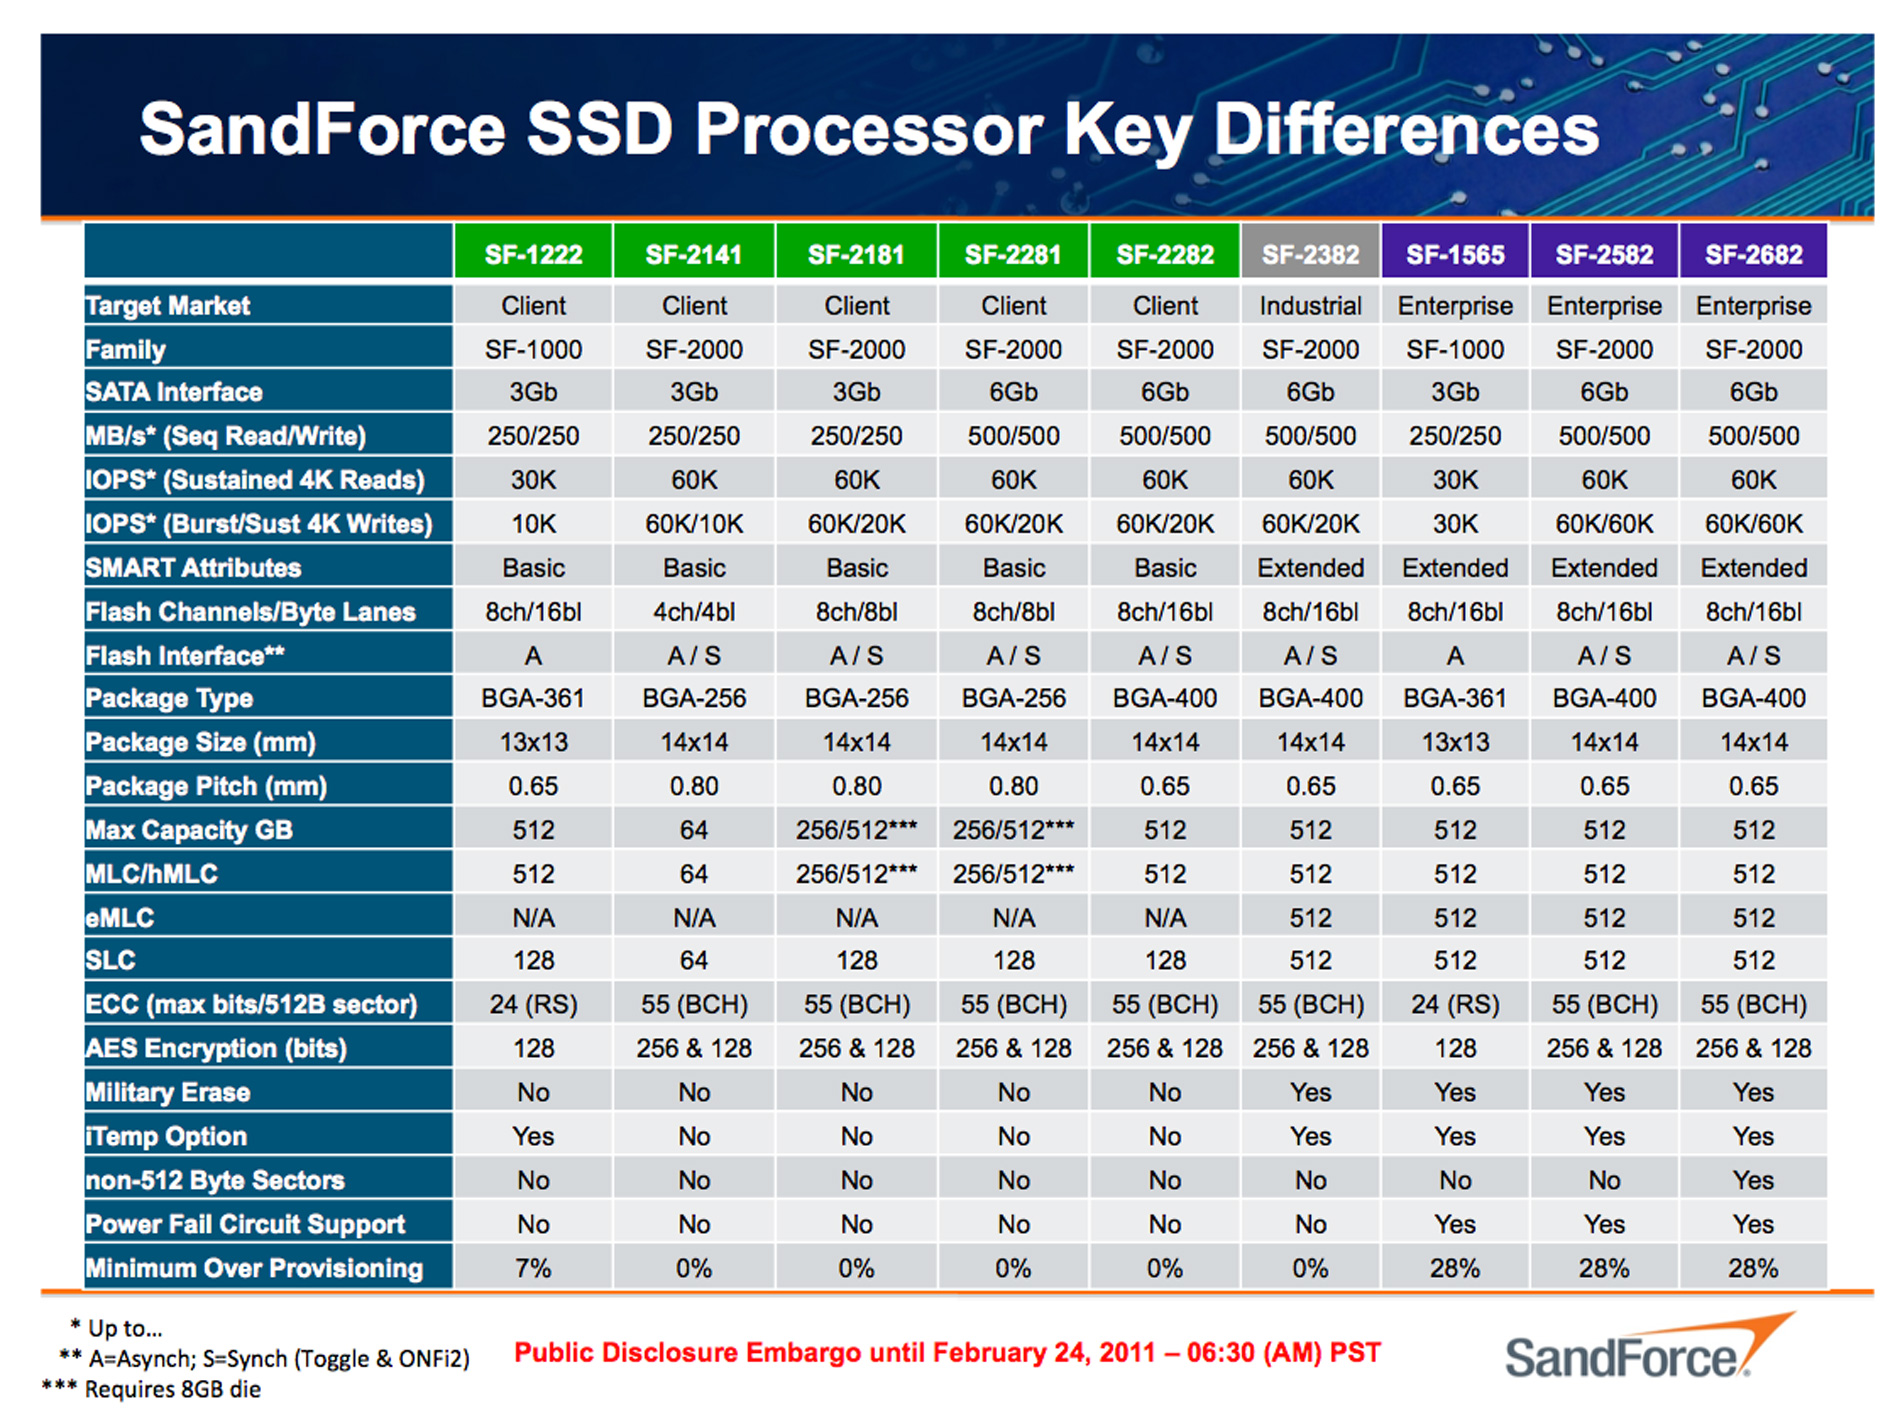
Typically all SandForce SSDs are based on the SF-2281 controller but since the Mercury Electra is a 3Gb/s drive, it makes sense for OWC to go with a cheaper SATA 3Gb/s controller. There are always SandForce's first generation controllers that are all SATA 3Gb/s, but SandForce also has two second generation SATA 3Gb/s controllers: the SF-2141 and SF-2181. The difference between the two is that SF-2141 is a 4-channel design and its maximum capacity is limited to 64GB. I've only seen it used in some very low-end SandForce SSDs (e.g. ADATA Premier SP800), which is its target market. The SF-2181 has 8 channels like most SSD controllers the only difference between it and SF-2281 is the interface, which limits the sequential read/write speeds of SF-2181 to 250MB/s. SandForce has not released any pricing information but it should be safe to say that the SF-2181 is cheaper than SF-2281. Like all semiconductors, not every die is equal, which means SandForce can brand the lower binned parts as SF-2181 and sell the higher binned parts as SF-2281.
The RAID Controller
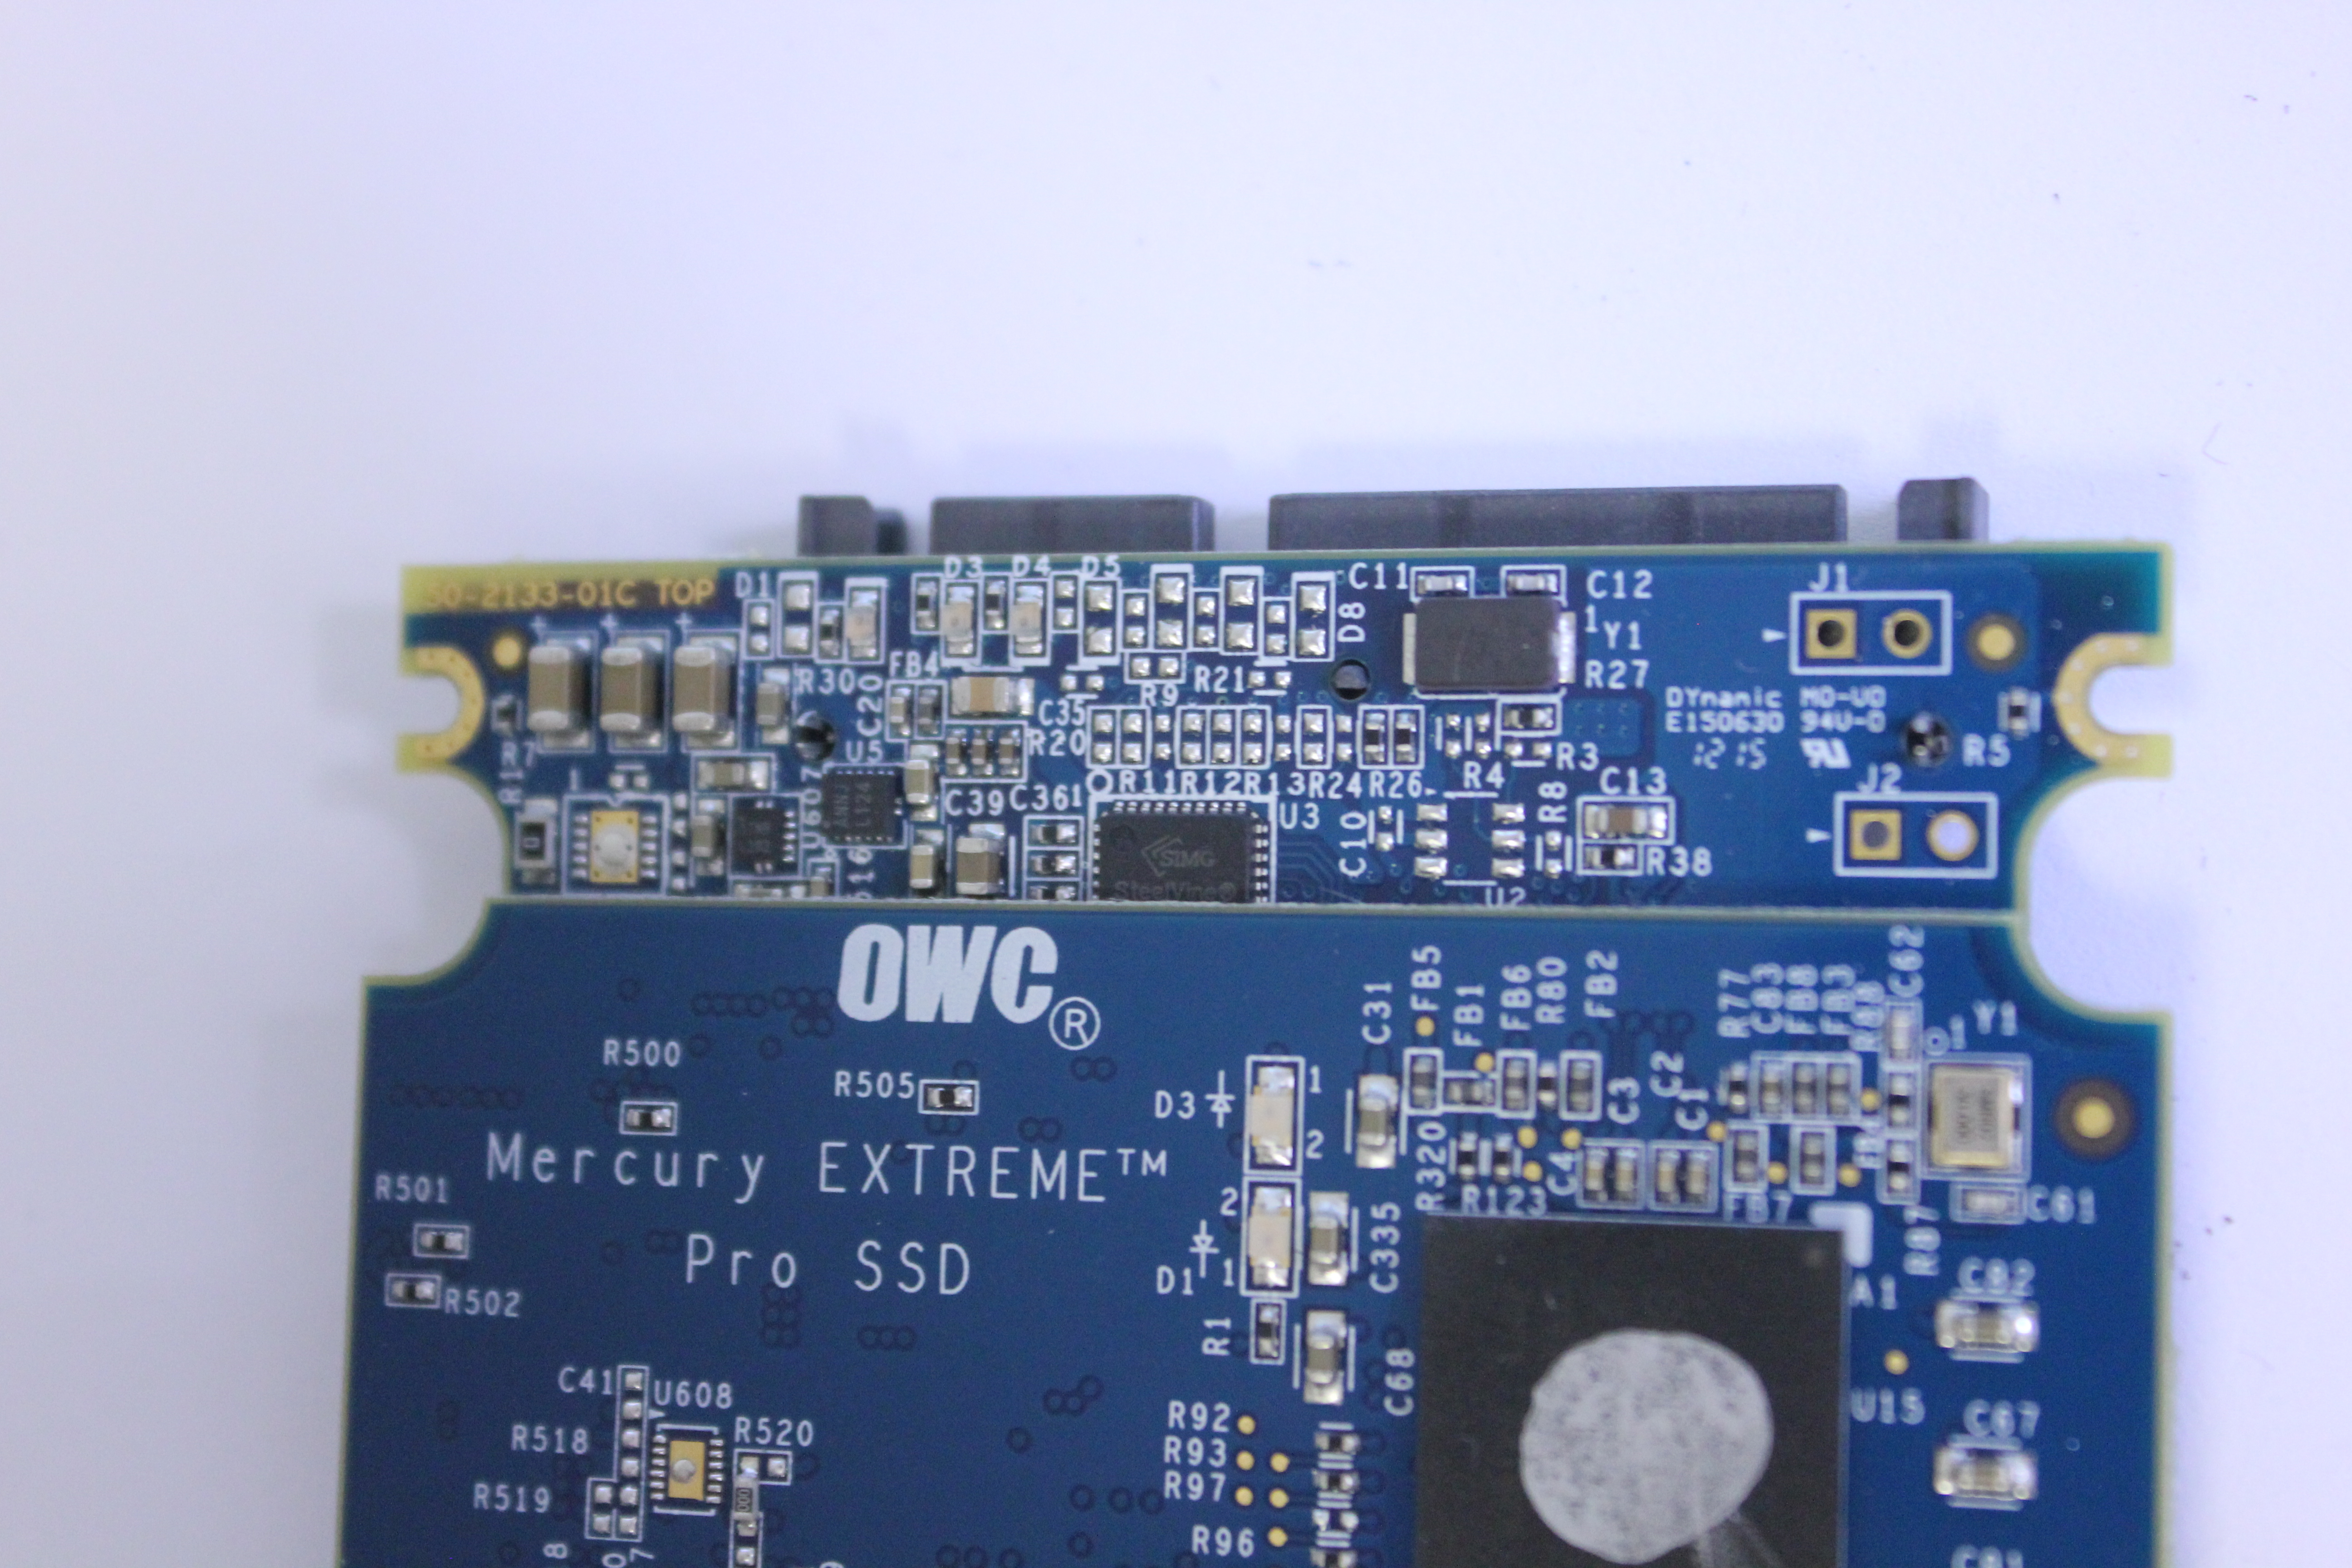
The RAID controller is partially hidden under one of the main PCBs but OWC told us that it's Silicon Image's SteelVine Sil592 (you can actually see the logo in the picture above). Physically it's very small and the whole package measures in at only 36mm^2.
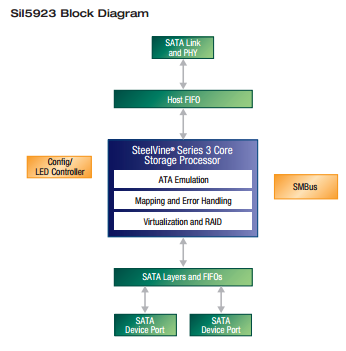
The Sil5923 isn't a very complex controller and only supports RAID 0, RAID 1 and JBOD. It's also limited to the SATA 2.6 spec (3Gbps) and at least Silicon Image does not have a controller with SATA 6Gbps support right now. The market for SATA to SATA RAID controllers is much smaller compared to PCIe to SATA controllers, which is why I'm not surprised that Silicon Image's solution is only SATA 3Gbps.
The NAND

Micron has been reforming their part numbering system. Instead of a long part number, there are now two five character codes. The lower code is what Micron calls FBGA code and it corresponds to the former part number. Obviously there is the downside of using such a system because the FBGA code doesn’t provide anywhere near as much information as the old part number did. Fortunately, Micron has a public FBGA code decoder which will decode the FBGA code and match it to a corresponding part number.
In this case, NQ392 is the same as MT29F256G08CMCABH2-10R:A. From that we get all the information we need: each package is 32GB in size (4x 8GB 25nm dies) and the NAND is running in asynchronous mode.
Test System
| CPU |
Intel Core i5-2500K running at 3.3GHz (Turbo and EIST enabled) |
| Motherboard |
AsRock Z68 Pro3 |
| Chipset |
Intel Z68 |
| Chipset Drivers |
Intel 9.1.1.1015 + Intel RST 10.2 |
| Memory | G.Skill RipjawsX DDR3-1600 2 x 4GB (9-9-9-24) |
| Video Card |
XFX AMD Radeon HD 6850 XXX (800MHz core clock; 4.2GHz GDDR5 effective) |
| Video Drivers | AMD Catalyst 10.1 |
| Desktop Resolution | 1920 x 1080 |
| OS | Windows 7 x64 |
Random Read/Write Speed
The four corners of SSD performance are as follows: random read, random write, sequential read and sequential write speed. Random accesses are generally small in size, while sequential accesses tend to be larger and thus we have the four Iometer tests we use in all of our reviews. Our first test writes 4KB in a completely random pattern over an 8GB space of the drive to simulate the sort of random access that you'd see on an OS drive (even this is more stressful than a normal desktop user would see).
We perform three concurrent IOs and run the test for 3 minutes. The results reported are in average MB/s over the entire time. We use both standard pseudo randomly generated data for each write as well as fully random data to show you both the maximum and minimum performance offered by SandForce based drives in these tests. The average performance of SF drives will likely be somewhere in between the two values for each drive you see in the graphs. For an understanding of why this matters, read our original SandForce article.
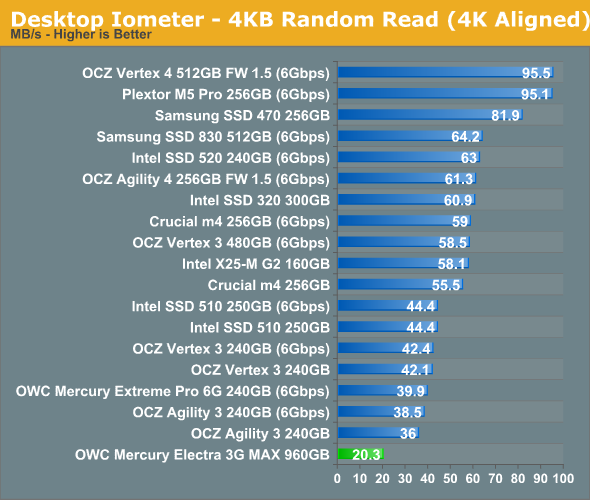
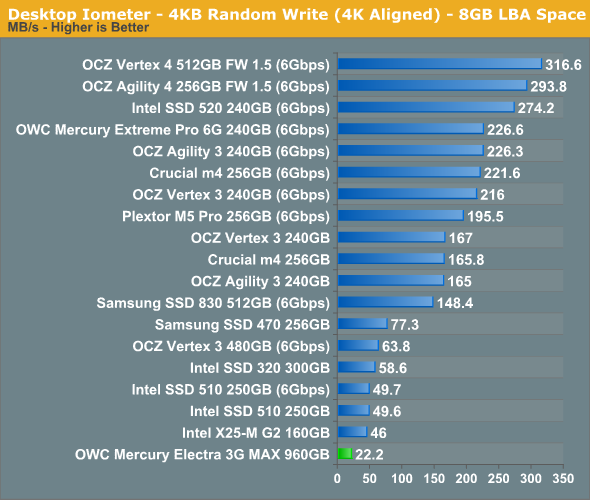
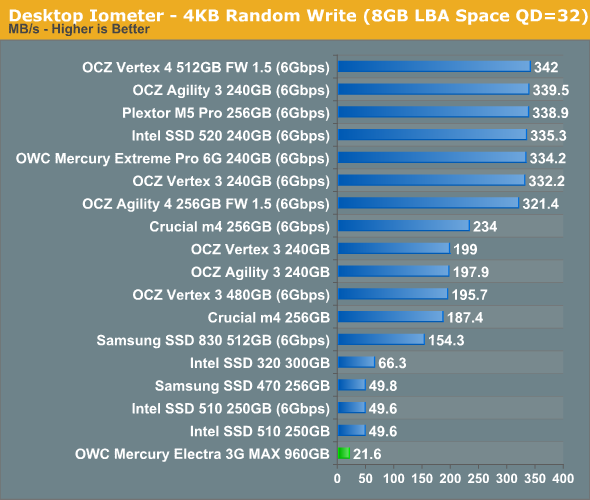
To be straight, random performance is horrible. Regardless of the queue depth and IO type (read/write), random performance tops out at around 22MB/s. I ran each test a few times to double-check but performance didn't get any better. I asked OWC if this is normal and they said it is, which also explains why OWC isn't reporting any random read/write speed figures. Ouch.
The SF-2181 controller is good for up to 60K 4KB random read/write IOPS, so that's definitely not the bottleneck. With two controllers in RAID 0, we should get random performance of over 100K IOPS at higher queue depths, although SATA 3Gbps would limit us to around 70K IOPS max. If the SSD controller is not the bottleneck, it leaves us with only one option: the RAID controller. Like I said, Siicon Image's RAID controller is not a very high-end one and the product page says it's actually a SATA to dual-eSATA controller, meaning that it's mainly aimed to be used with external hard drives, which don't offer great random IO performance to begin with. It definitely wasn't designed with SSDs in mind and I'm starting to think that OWC opted for it because there simply wasn't another viable option.
Sequential Read/Write Speed
To measure sequential performance we ran a one minute long 128KB sequential test over the entire span of the drive at a queue depth of 1. The results reported are in average MB/s over the entire test length.
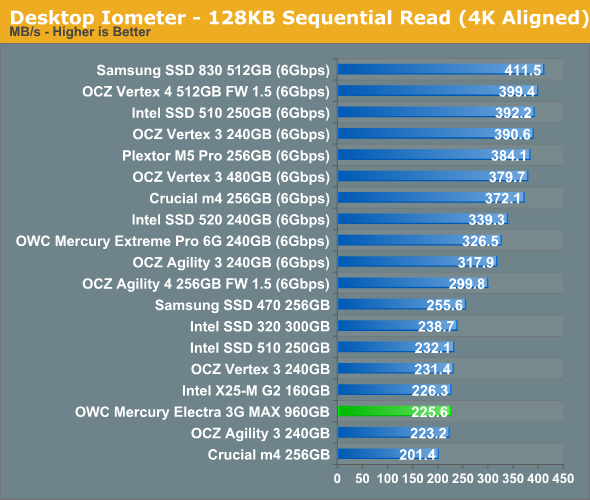
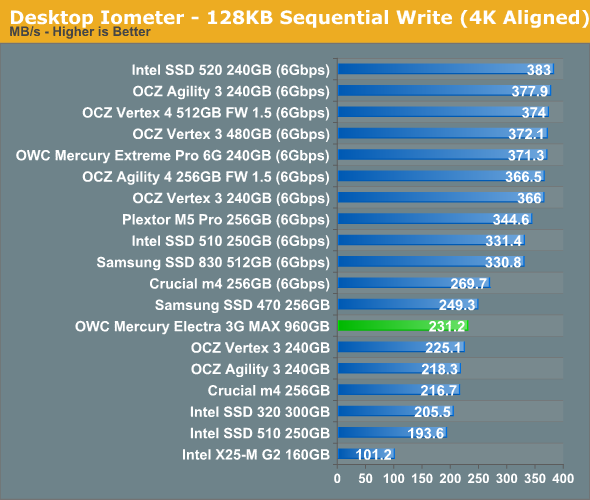
Sequential performance is much better than random speeds and now we're seeing figures typical for SATA 3Gbps SSDs. In terms of performance, there doesn't seem to be much gain from RAID 0 as for example OCZ Vertex 3 performs similarly when used in a SATA 3Gbps environment.
AS-SSD Incompressible Sequential Performance
The AS-SSD sequential benchmark uses incompressible data for all of its transfers. The result is a pretty big reduction in sequential write speed on SandForce based controllers, while other drives continue to work at roughly the same speed as with compressible data.
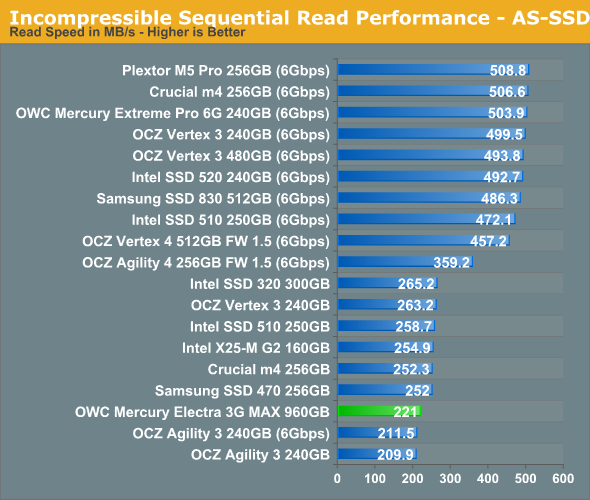
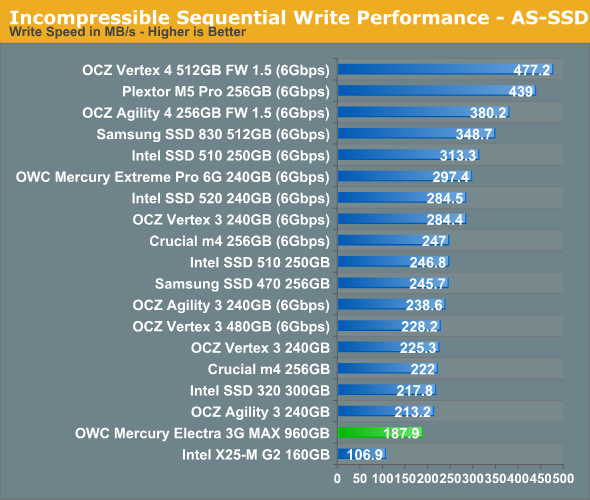
Incompressible sequential performance could be better but at least the drop isn't as bad as the random performance.
AnandTech Storage Bench 2011
Last year we introduced our AnandTech Storage Bench, a suite of benchmarks that took traces of real OS/application usage and played them back in a repeatable manner. Anand assembled the traces out of frustration with the majority of what we have today in terms of SSD benchmarks.
Although the AnandTech Storage Bench tests did a good job of characterizing SSD performance, they weren't stressful enough. All of the tests performed less than 10GB of reads/writes and typically involved only 4GB of writes specifically. That's not even enough exceed the spare area on most SSDs. Most canned SSD benchmarks don't even come close to writing a single gigabyte of data, but that doesn't mean that simply writing 4GB is acceptable.
Originally we kept the benchmarks short enough that they wouldn't be a burden to run (~30 minutes) but long enough that they were representative of what a power user might do with their system. Later, however, we created what we refer to as the Mother of All SSD Benchmarks (MOASB). Rather than only writing 4GB of data to the drive, this benchmark writes 106.32GB. This represents the load you'd put on a drive after nearly two weeks of constant usage. And it takes a long time to run.
1) The MOASB, officially called AnandTech Storage Bench 2011—Heavy Workload, mainly focuses on the times when your I/O activity is the highest. There is a lot of downloading and application installing that happens during the course of this test. Our thinking was that it's during application installs, file copies, downloading, and multitasking with all of this that you can really notice performance differences between drives.
2) We tried to cover as many bases as possible with the software incorporated into this test. There's a lot of photo editing in Photoshop, HTML editing in Dreamweaver, web browsing, game playing/level loading (Starcraft II and WoW are both a part of the test), as well as general use stuff (application installing, virus scanning). We included a large amount of email downloading, document creation, and editing as well. To top it all off we even use Visual Studio 2008 to build Chromium during the test.
The test has 2,168,893 read operations and 1,783,447 write operations. The IO breakdown is as follows:
| AnandTech Storage Bench 2011—Heavy Workload IO Breakdown | ||||
| IO Size | % of Total | |||
| 4KB | 28% | |||
| 16KB | 10% | |||
| 32KB | 10% | |||
| 64KB | 4% | |||
Only 42% of all operations are sequential; the rest ranges from pseudo to fully random (with most falling in the pseudo-random category). Average queue depth is 4.625 IOs, with 59% of operations taking place in an IO queue of 1.
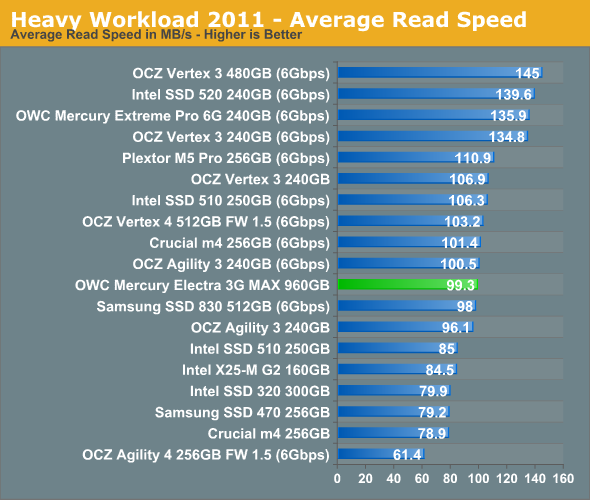
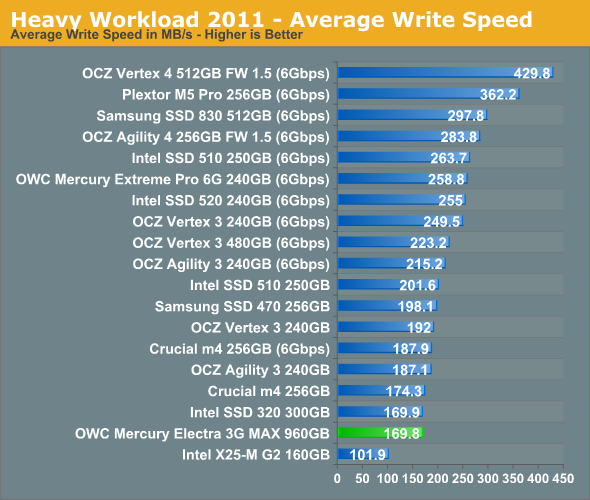
Many of you have asked for a better way to really characterize performance. Simply looking at IOPS doesn't really say much. As a result we're going to be presenting Storage Bench 2011 data in a slightly different way. We'll have performance represented as Average MB/s, with higher numbers being better. At the same time we'll be reporting how long the SSD was busy while running this test. These disk busy graphs will show you exactly how much time was shaved off by using a faster drive vs. a slower one during the course of this test. Finally, we will also break out performance into reads, writes, and combined. The reason we do this is to help balance out the fact that this test is unusually write intensive, which can often hide the benefits of a drive with good read performance.
There's also a new light workload for 2011. This is a far more reasonable, typical every day use case benchmark. It has lots of web browsing, photo editing (but with a greater focus on photo consumption), video playback, as well as some application installs and gaming. This test isn't nearly as write intensive as the MOASB but it's still multiple times more write intensive than what we were running last year.
We don't believe that these two benchmarks alone are enough to characterize the performance of a drive, but hopefully along with the rest of our tests they will help provide a better idea. The testbed for Storage Bench 2011 has changed as well. We're now using a Sandy Bridge platform with full 6Gbps support for these tests.
AnandTech Storage Bench 2011—Heavy Workload
We'll start out by looking at average data rate throughout our new heavy workload test:
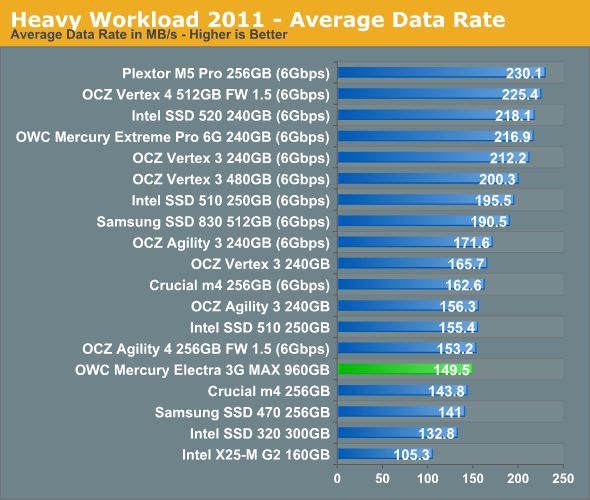
While the random performance of Mercury Electra wasn't great, it does surprisingly well in our Heavy suite. It's a bit slower than SF-2281 drives at SATA 3Gbps but it beats for example Intel's SSD 320.
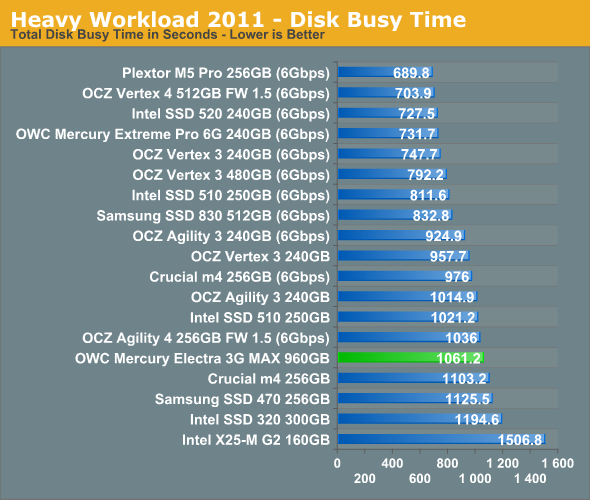
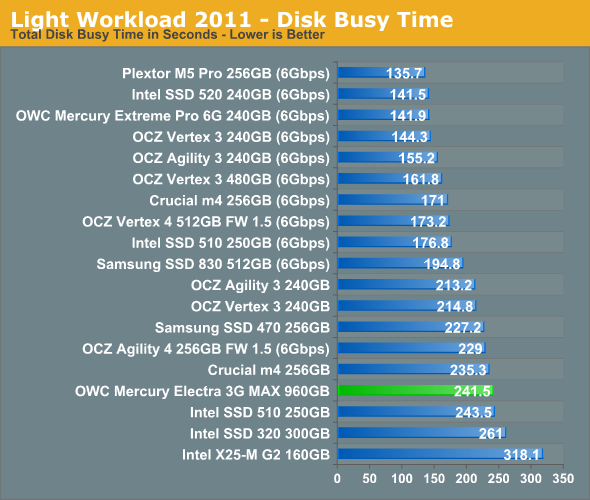
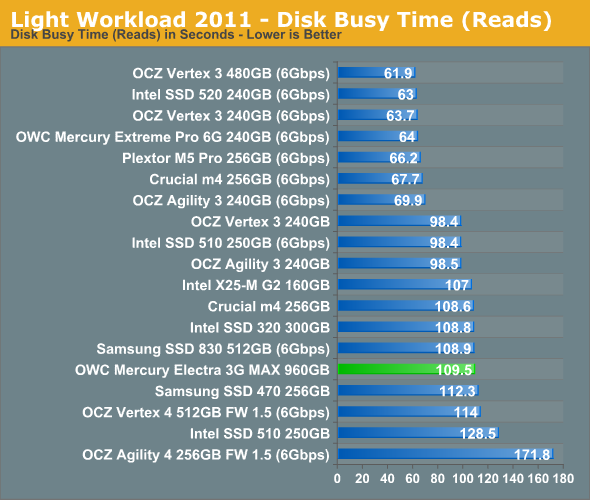
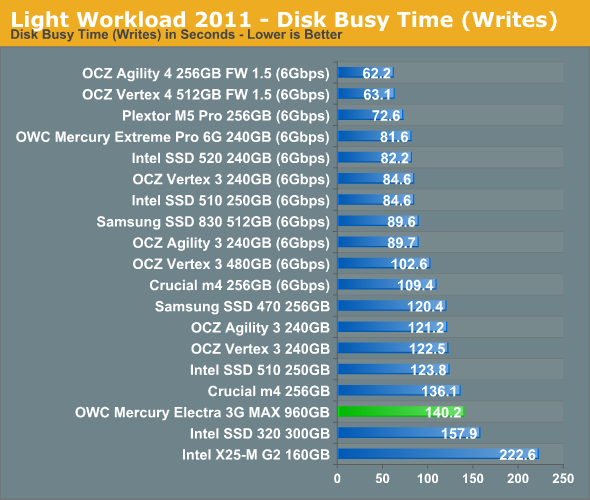
The next three charts just represent the same data, but in a different manner. Instead of looking at average data rate, we're looking at how long the disk was busy for during this entire test. Note that disk busy time excludes any and all idles; this is just how long the SSD was busy doing something:
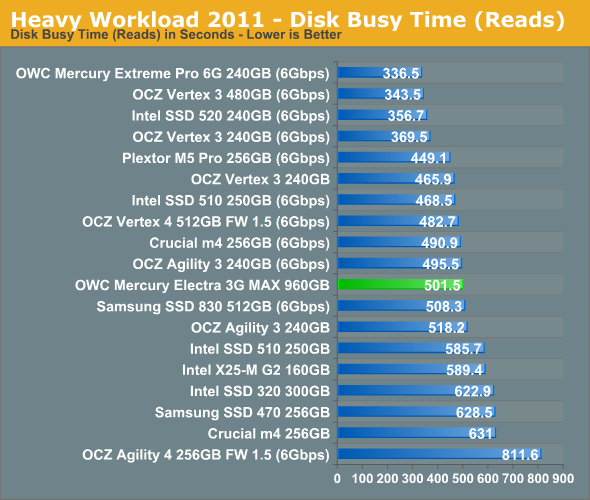
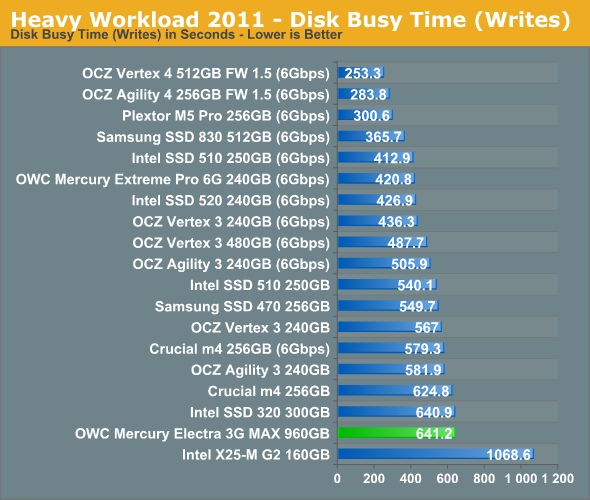
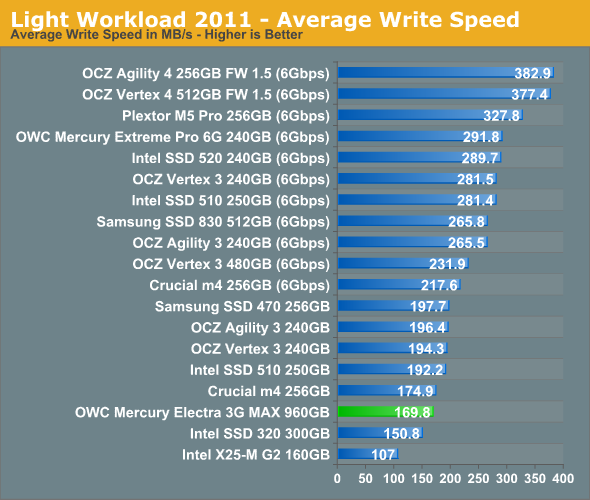
AnandTech Storage Bench 2011, Light Workload
Our new light workload actually has more write operations than read operations. The split is as follows: 372,630 reads and 459,709 writes. The relatively close read/write ratio does better mimic a typical light workload (although even lighter workloads would be far more read centric). The I/O breakdown is similar to the heavy workload at small IOs, however you'll notice that there are far fewer large IO transfers:
| AnandTech Storage Bench 2011—Light Workload IO Breakdown | ||||
| IO Size | % of Total | |||
| 4KB | 27% | |||
| 16KB | 8% | |||
| 32KB | 6% | |||
| 64KB | 5% | |||
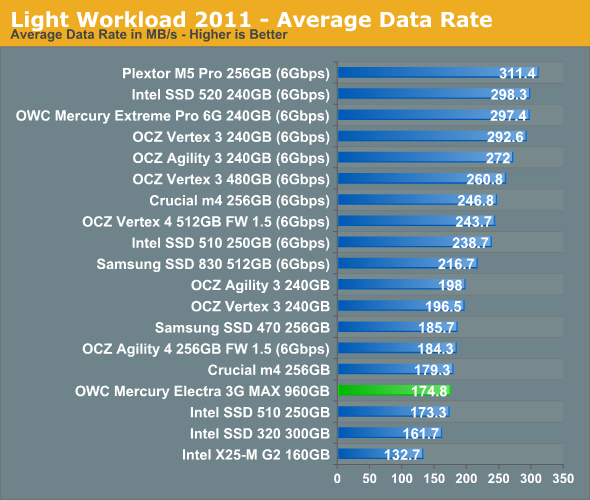
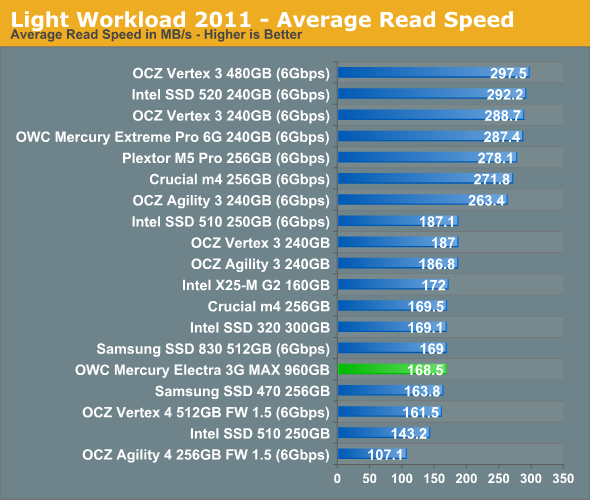
Performance in our Light suite is fairly similar to Heavy suite: The Mercury Electra isn't unbelievably fast but it does okay for a SATA 3Gbps drive.
Performance Over Time & TRIM
To see how the Mercury Electra behaves when pushed into a corner, I filled the drive with incompressible data and then tortured it with incompressible 4KB random writes (100% LBA space, QD=32) for 60 minutes:
| OWC Mercury Electra 3G MAX 960GB - Resiliency - AS SSD Sequential Write Speed - 6Gbps | |||
| Clean | After Torture | After TRIM | |
| OWC Mercury Electra 3G MAX | 187.5MB/s | 185.0MB/s | 206.7MB/s |
The results I got are rather unusual, although logical; performance does not degrade noticeably when the drive is tortured. The reason for this is the massive capacity and slow random write speed. It takes two hours to just fill the drive with sequential data, so 60 minutes of torturing doesn't even do one full drive write. IOmeter showed the random write speed to be around 20MB/s, which equals 72GB of host writes in 60 minutes. For comparison, most SandForce drives are writing at over 100MB/s at the end of the torture, so that works out to be ~360GB in one hour.
It seems that TRIM actually improved performance, but I don't believe that's true. The problem with the 960GB Mercury Electra is that it cannot be secure erased due to the internal RAID controller. Hence we had to do sequential write passes to restore performance after every test, which unfortunately doesn't lead to as ideal a scenario as secure erase. Moreover, I saw huge performance variation when running AS-SSD multiple times. I reran AS-SSD straight after the post-TRIM run and write speed was only 132.7MB/s. A third run was ~190MB/s again so it's hard to draw any clear conclusions.
Power Consumption
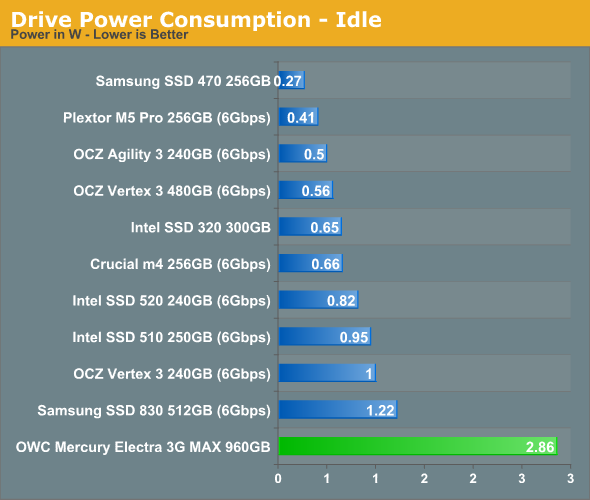
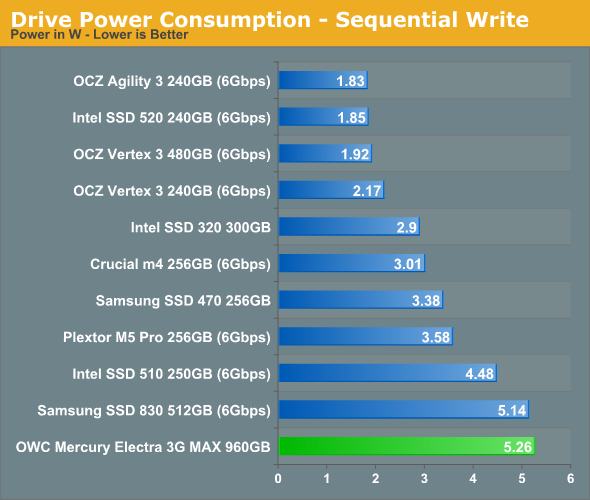
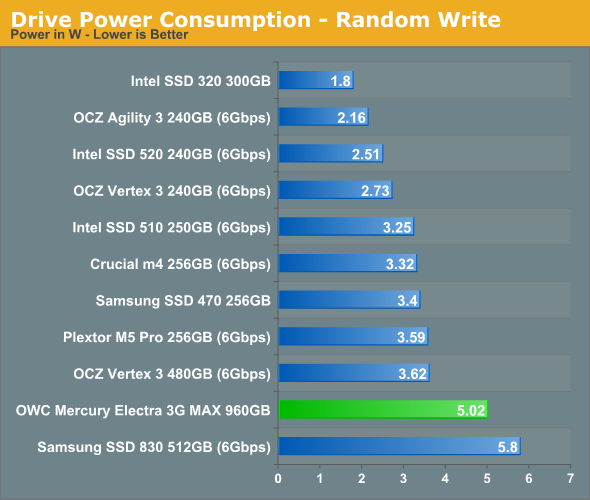
Since the Mercury Electra has more components than typical SSDs, it shouldn't come as a surprise that it also consumes more power than other SSDs. Especially idle power consumption is very high, higher than what many SSDs consume under full load. Silicon Image claims that the Sil5923 consumes 0.55W but don't specify if this is idle or load power consumption. I feel that the idle power consumption is noticeably higher because two SF-2281 SSDs would only consume a maximum of 2W, which leaves at least 0.86W of power used by something else.
Final Words
The 960GB Mercury Electra is definitely a niche product and I can only see one scenario where it can easily be justified: you have a laptop or other computer with very limited storage capabilities and you want an SSD with as much capacity as possible. In any other case, it will be cheaper and more sensible to use hard drives or multiple SSDs. Desktop users should have absolutely no need for 1TB SATA SSDs because all of Intel's and AMD's recent desktop chipsets (except Intel H61) come with six native SATA ports. Even if one of the ports is used up by the optical drive, there are five left, which gives you 2.5TB of SSD space if you put a 512GB SSD in every port. If that's not enough, $30 will buy you a PCIe SATA card with two ports and give you 1TB more SSD storage. Depending on your motherboard, you may be able to add several PCIe cards, so only the sky is the limit here.
Laptops usually have only one 2.5" hard drive bay (though it may be possible to add another one by removing the optical drive), which significantly limits the storage options. Externally you can add terabytes of storage but if your usage requires mobility, you will want to avoid carrying any extra devices as much as possible. When you're limited to having only one 2.5" drive, making the decision between an SSD and a hard drive can be difficult if you need a lot of storage. With SSDs, you get speed but pay a premium and are limited to 512GB with a few exceptions. Hard drives are slow but cheap and available in bigger capacities. Where the 960GB Electra makes sense is if you need more than 512GB of space and SSD-level IO performance.
However, the need for speed is a must. A 1TB 2.5" hard drive costs around $100, which is over $1000 less than what the 960GB Mercury Electra currently costs. You must really be able to benefit from the increased IO performance to justify spending that much on a drive. Normally I don't find comparing hard drives and SSDs to be very reasonable but the Mercury Electra is not the fastest SSD. Random IO performance is obviously better, but not as much as it could be since that is the biggest weakness of the Mercury Electra. Sequential throughput can be over twice as fast compared to a similar size 2.5" hard drive but that is only a twofold increase, whereas the increase in price is over tenfold.
Another important aspect to remember is power consumption and battery life: the 960GB Mercury likes electrons, a lot. At idle it draws around as much power as most SSDs draw under full load, and power consumption under load is among the highest as well. It's likely that the 960GB Mercury will shorten your battery life compared to a hard drive or other SSDs, which should be kept in mind if the drive is put into a laptop.
While the 960GB Mercury Electra is not a revolutionary product, it's great to see OWC putting out yet another unique product. Most SandForce SSD OEMs are way too similar: all have two or three SSDs with different NAND and form factor. There is no real differentiation. OWC is at least trying to be different and catering markets that others aren't (for example replacement SSDs for MacBook Airs), and the 960GB Mercury Electra is yet another fruit of that.
The only things I would want from the 960GB Mercury Electra are SATA 6Gbps support and higher random read/write performance. At over $1000, there is a significant premium in terms of price per GB compared to 512GB SSDs and you're only getting SATA 3Gbps—and not even good SATA 3Gbps performance, really. Then again, we are talking about a niche product with no real competitors, so the people who want such a product should be ready to pay the premium.


