Original Link: https://www.anandtech.com/show/4315/owc-mercury-extreme-pro-6g-ssd-review-120gb
OWC Mercury Extreme Pro 6G SSD Review (120GB)
by Anand Lal Shimpi on May 5, 2011 1:45 AM ESTI still don't get how OWC managed to beat OCZ to market last year with the Mercury Extreme SSD. The Vertex LE was supposed to be the first SF-1500 based SSD on the market, but as I mentioned in our review of OWC's offering - readers had drives in hand days before the Vertex LE even started shipping.
I don't believe the same was true this time around. The Vertex 3 was the first SF-2200 based SSD available for purchase online, but OWC was still a close second. Despite multiple SandForce partners announcing drives based on the controller, only OCZ and OWC are shipping SSDs with SandForce's SF-2200 inside.
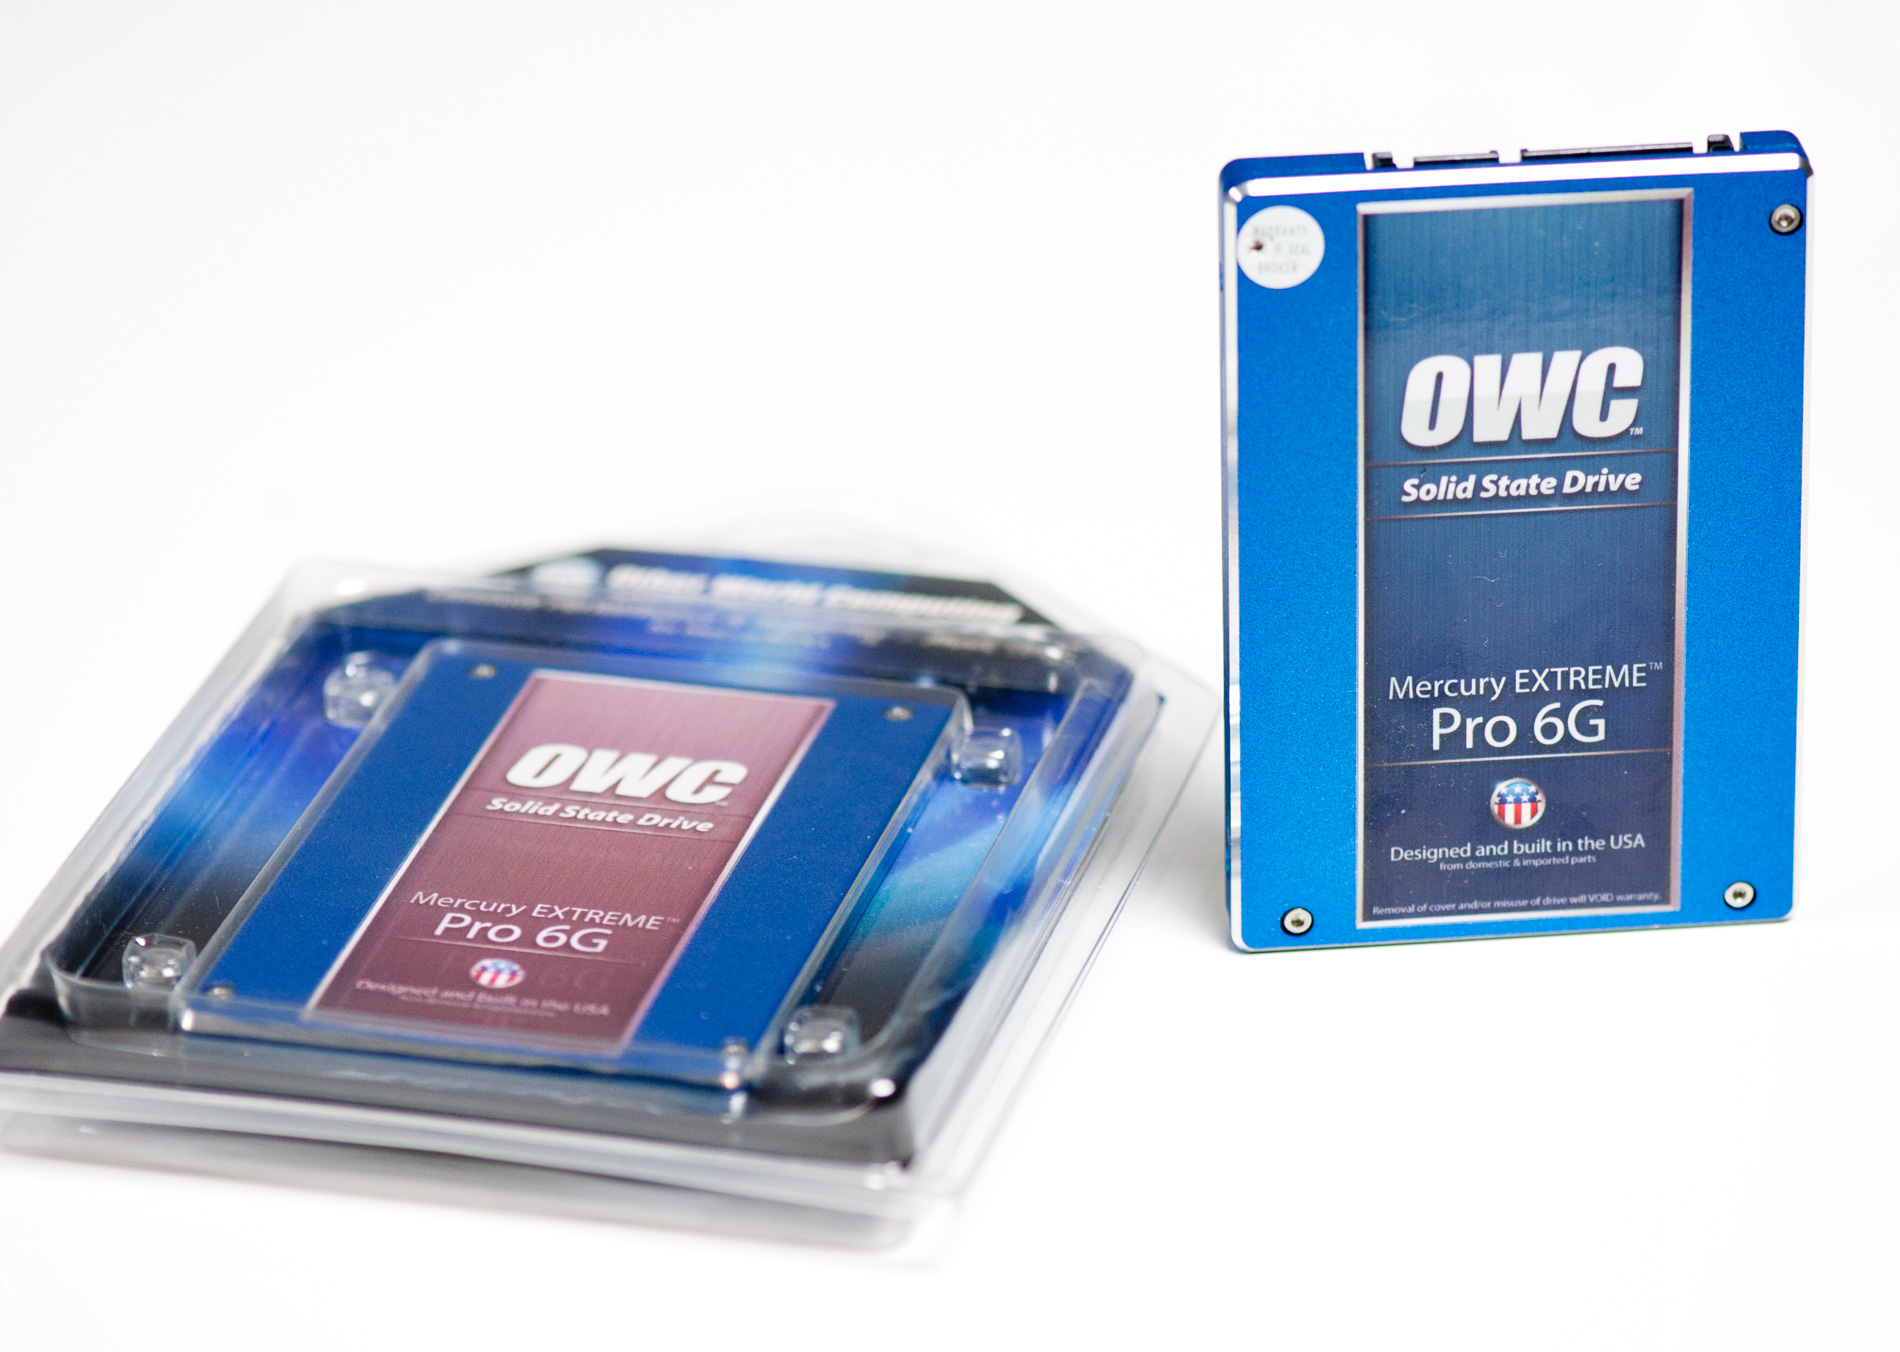
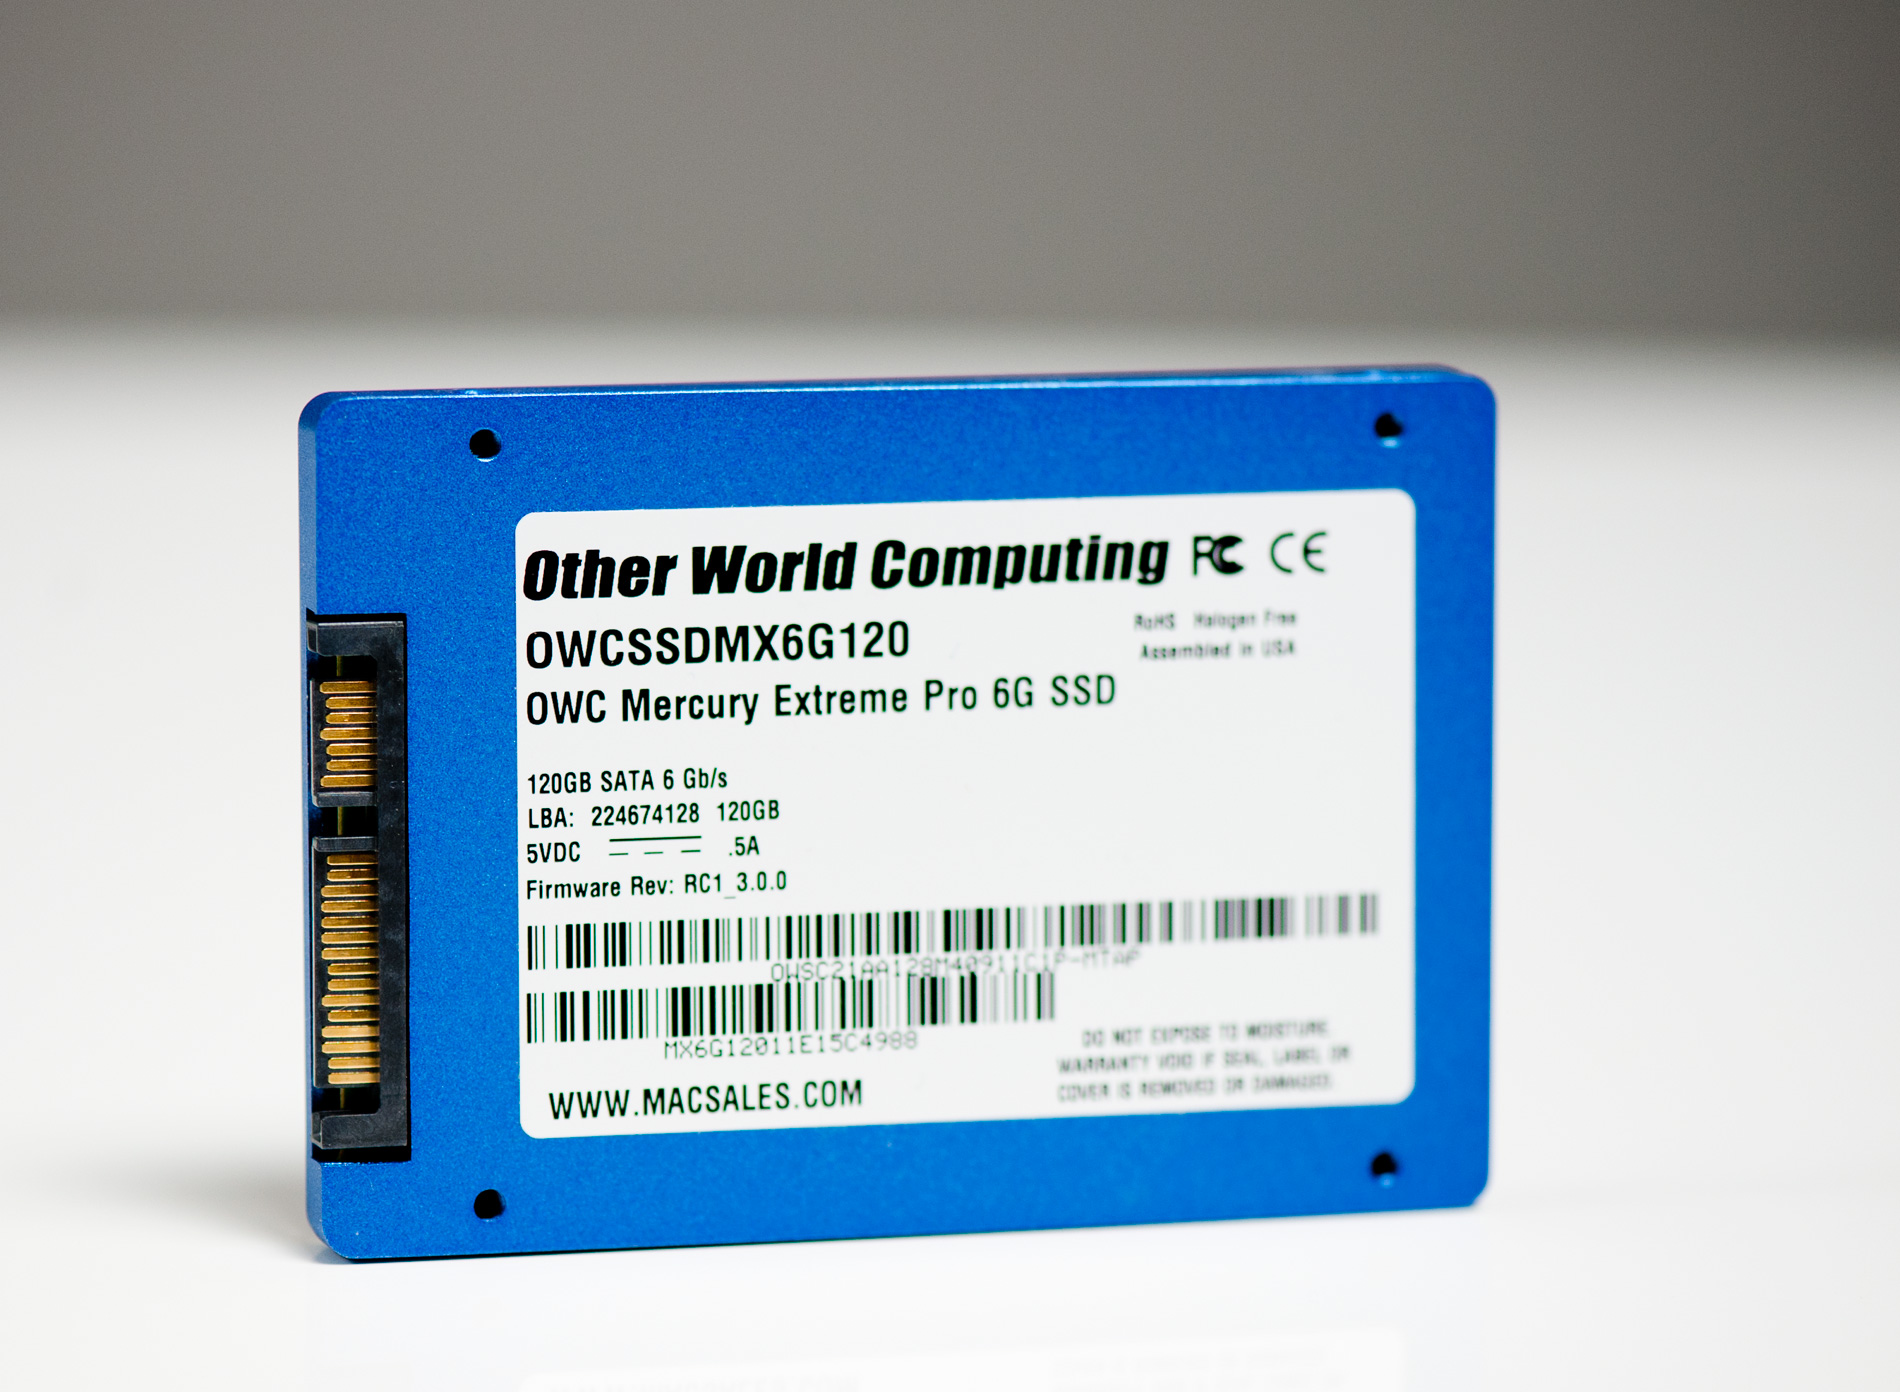
The new drive from OWC is its answer to the Vertex 3 and it's called the Mercury Extreme Pro 6G. Internally it's virtually identical to OCZ's Vertex 3, although the PCB design is a bit different and it's currently shipping with a slightly different firmware:
OWC's Mercury Extreme Pro 6G 120GB
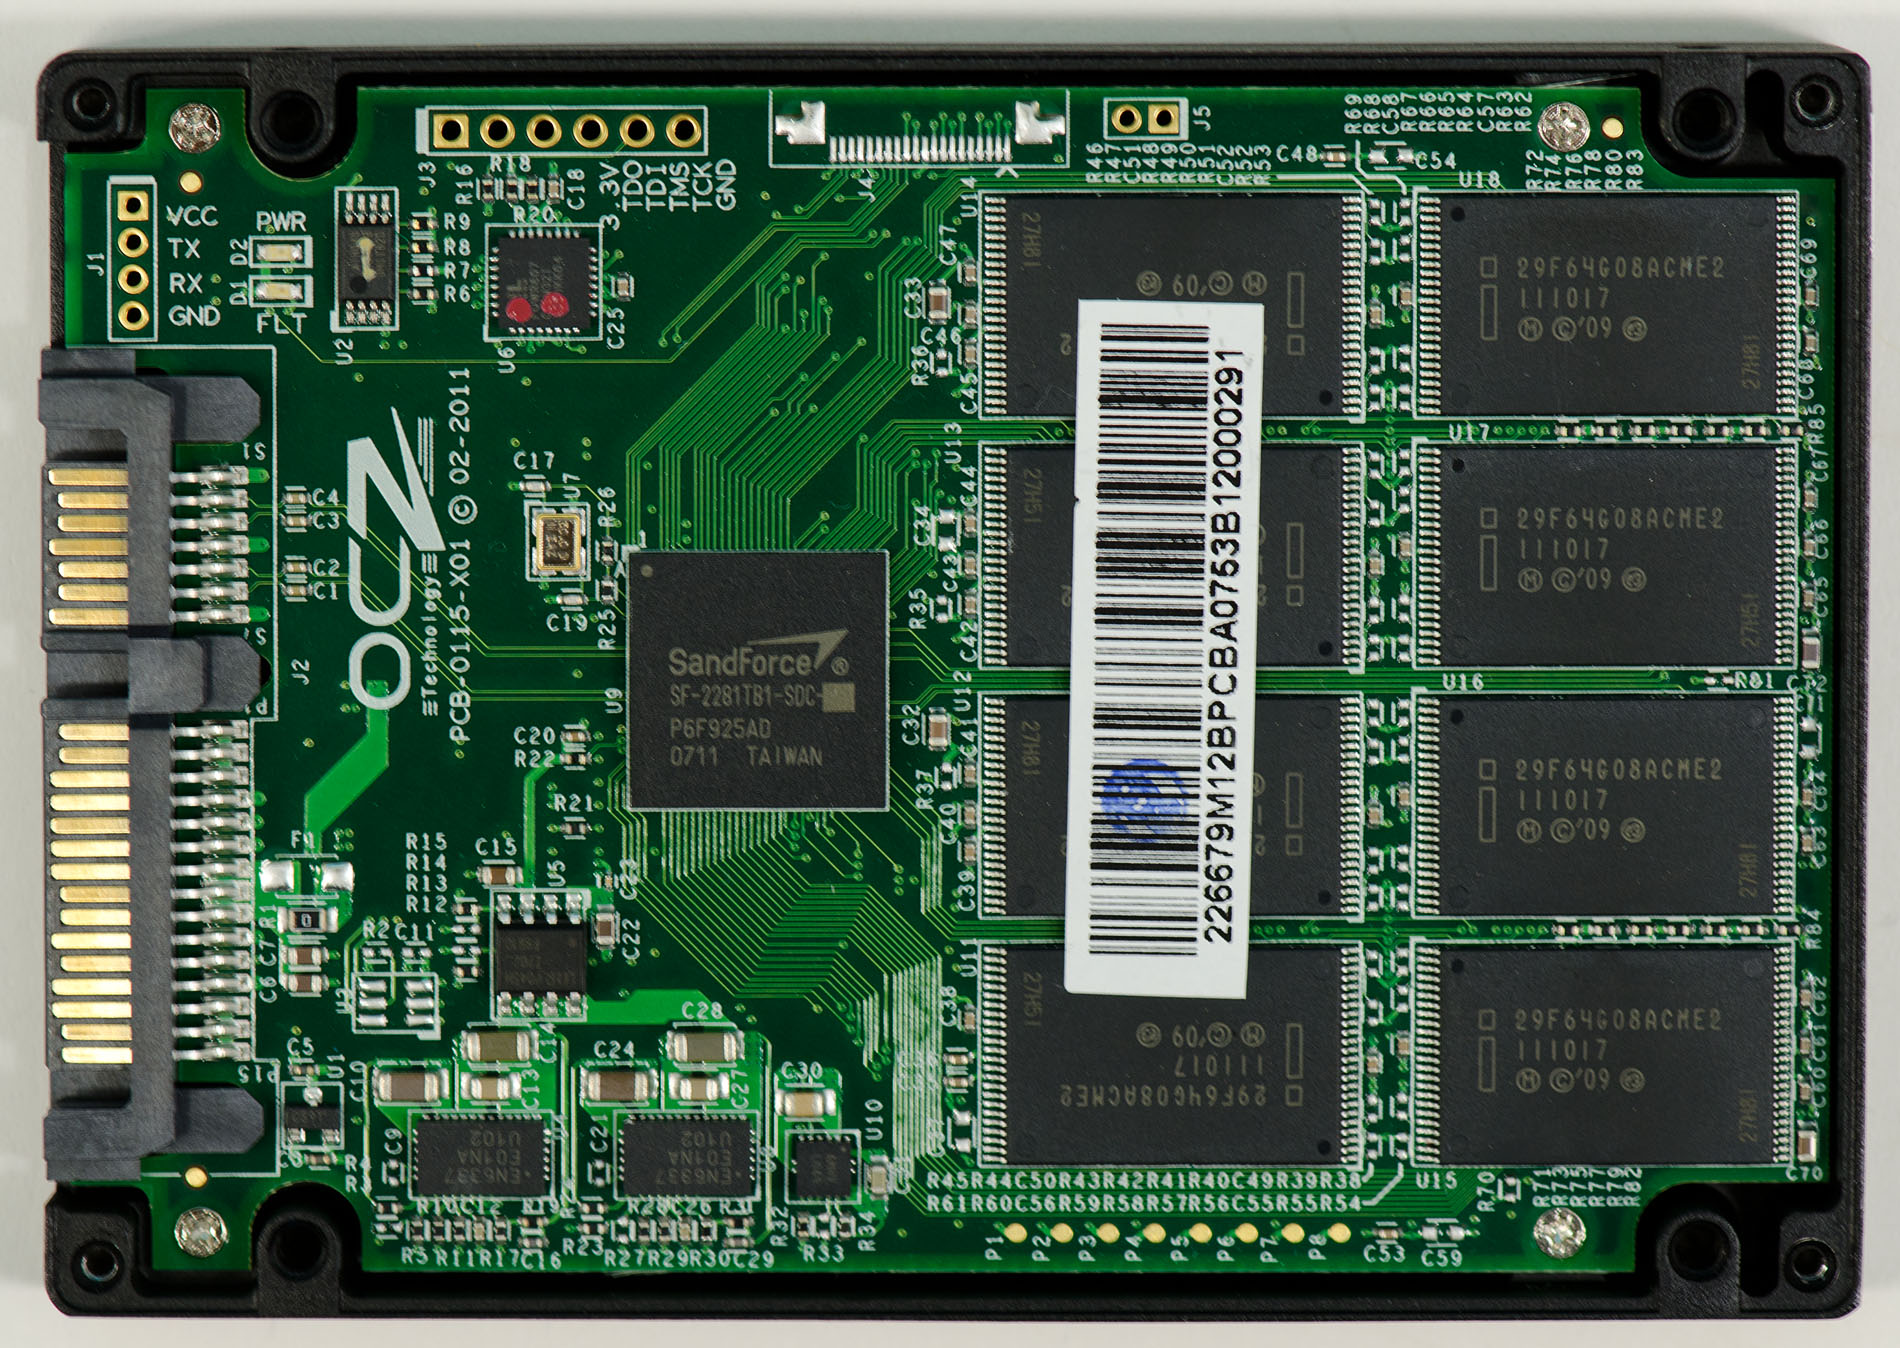
OCZ's Vertex 3 120GB
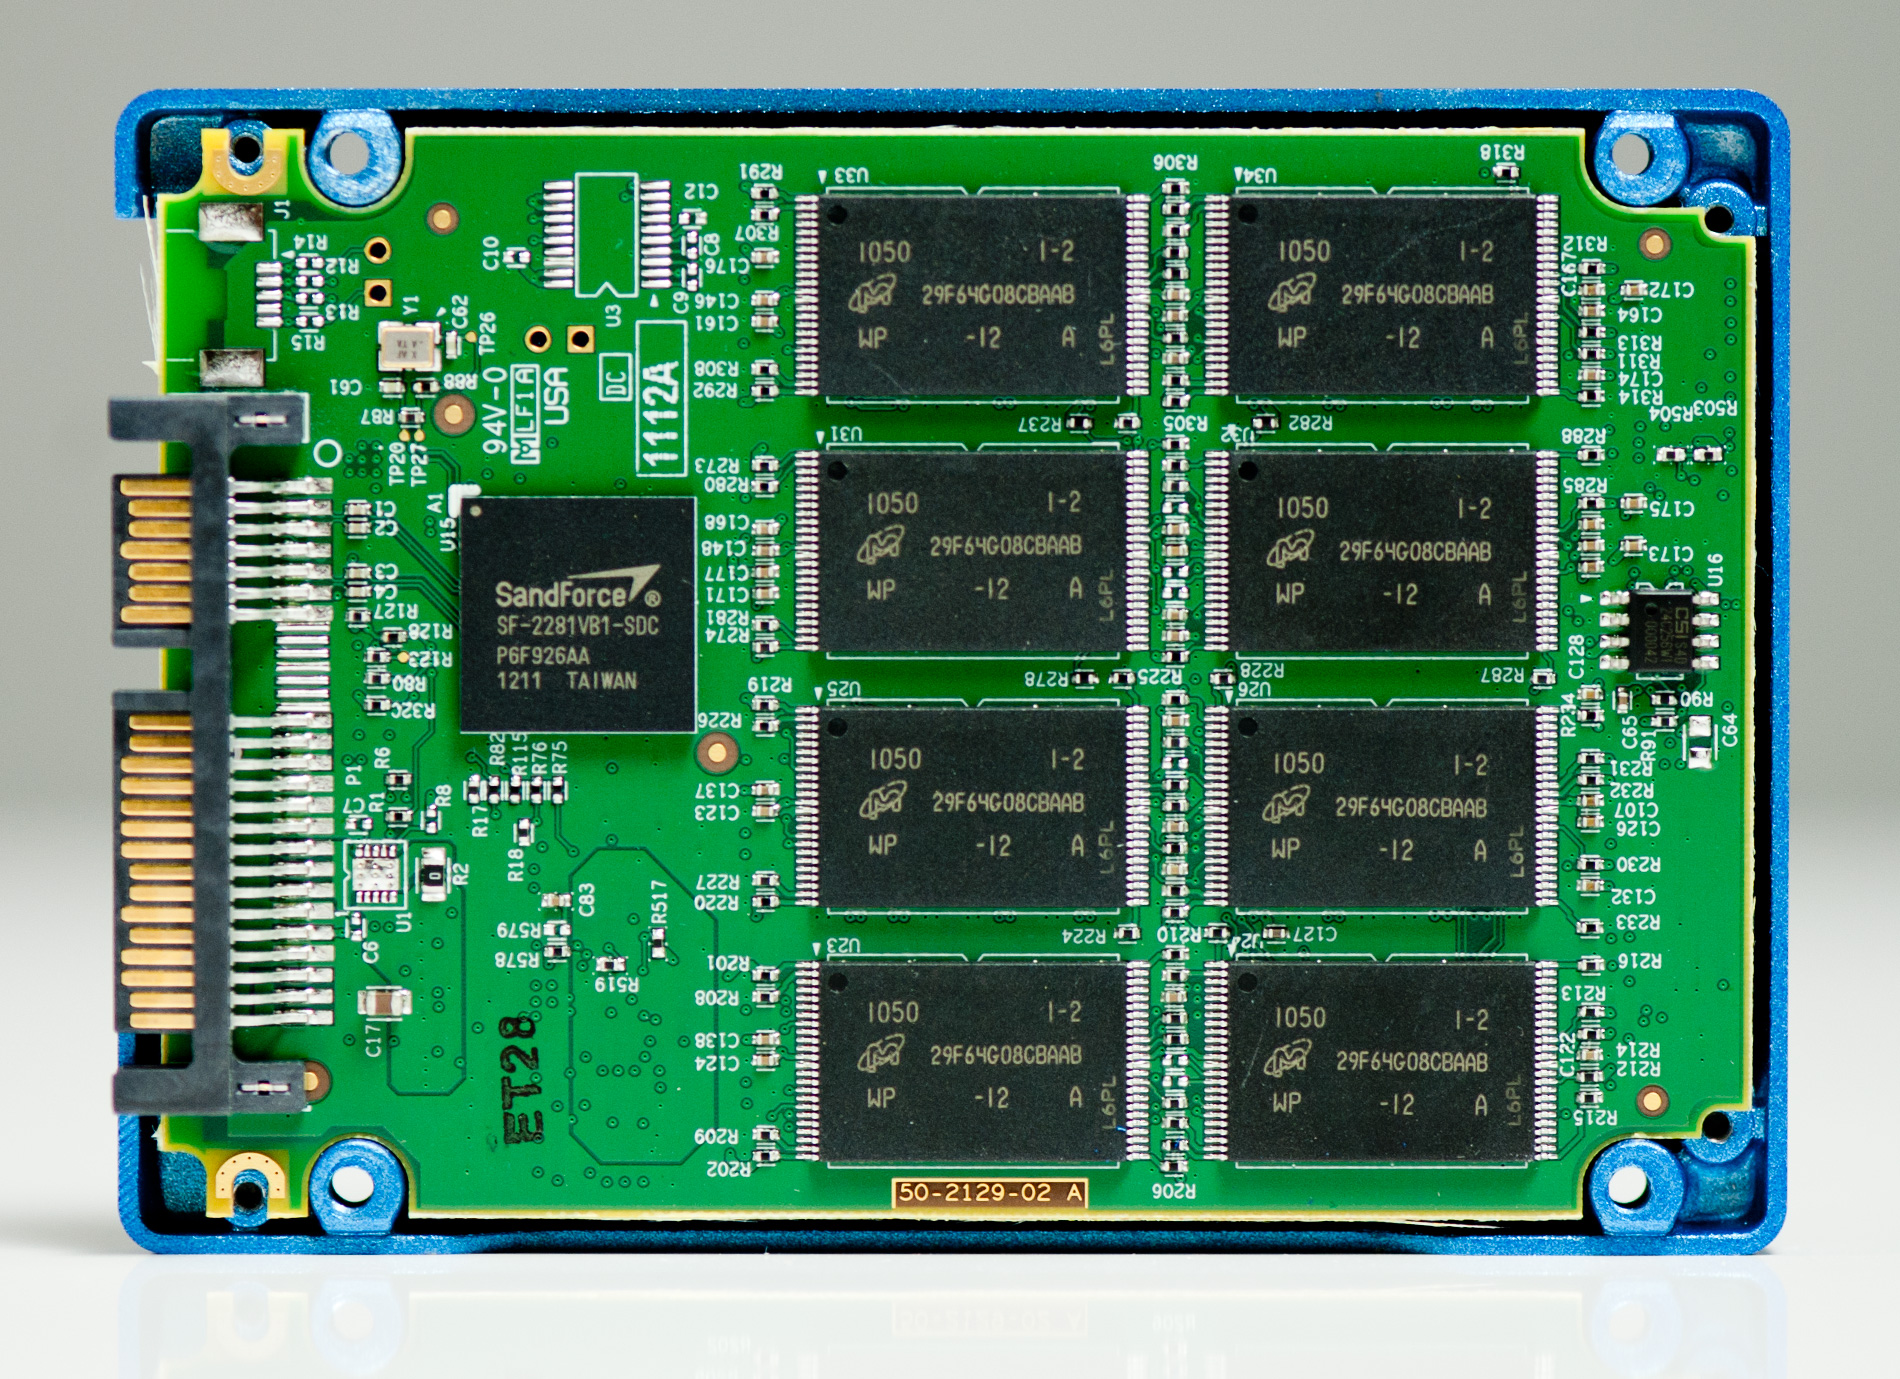
Both drives use the same SF-2281 controller, however OCZ handles its own PCB layout. It seems whoever designed OWC's PCB made an error in the design as the 120GB sample I received had a rework on the board:
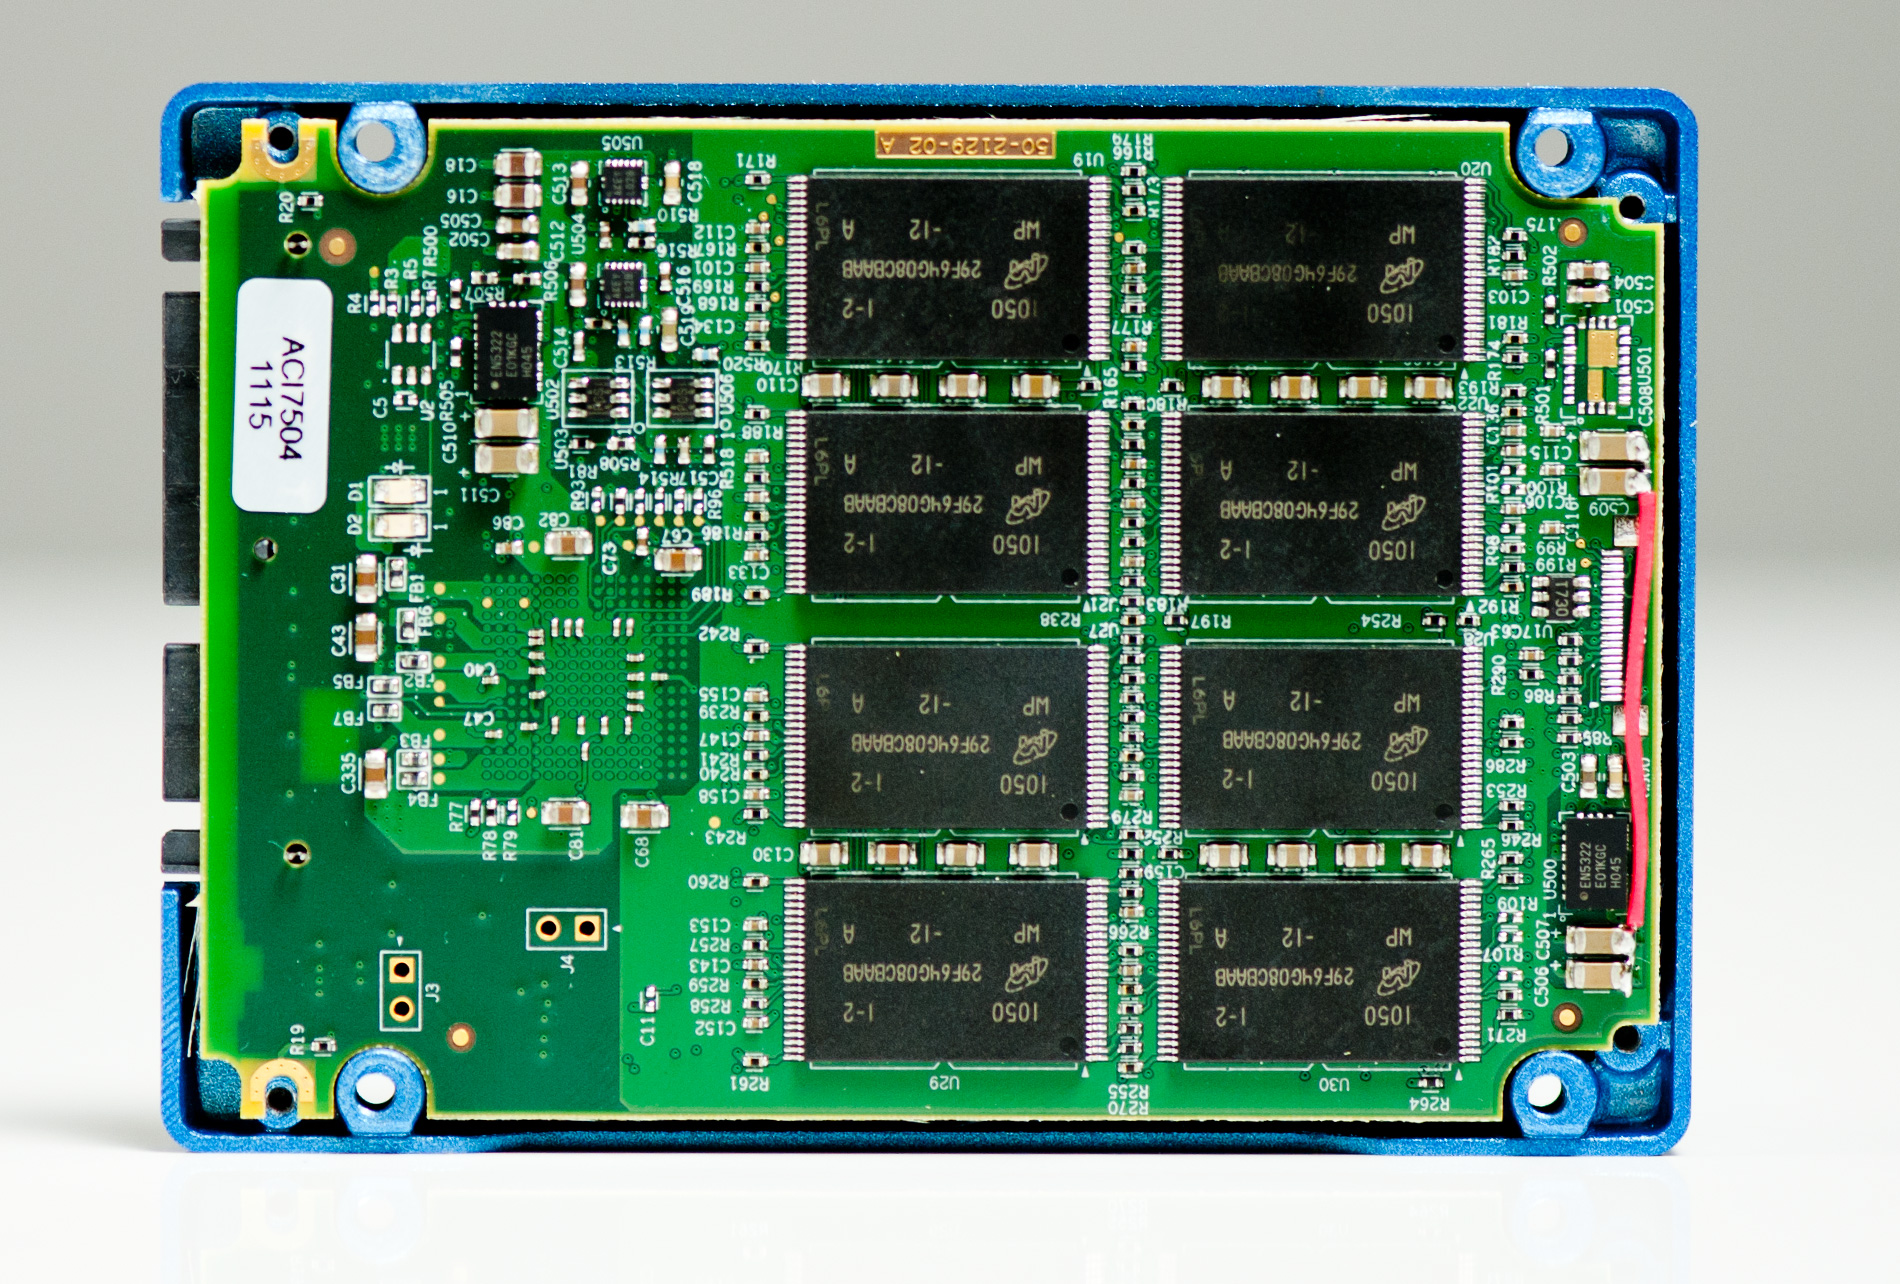
Reworks aren't uncommon for samples but I'm usually uneasy when I see them in retail products. Here's a closer shot of the rework on the PCB:
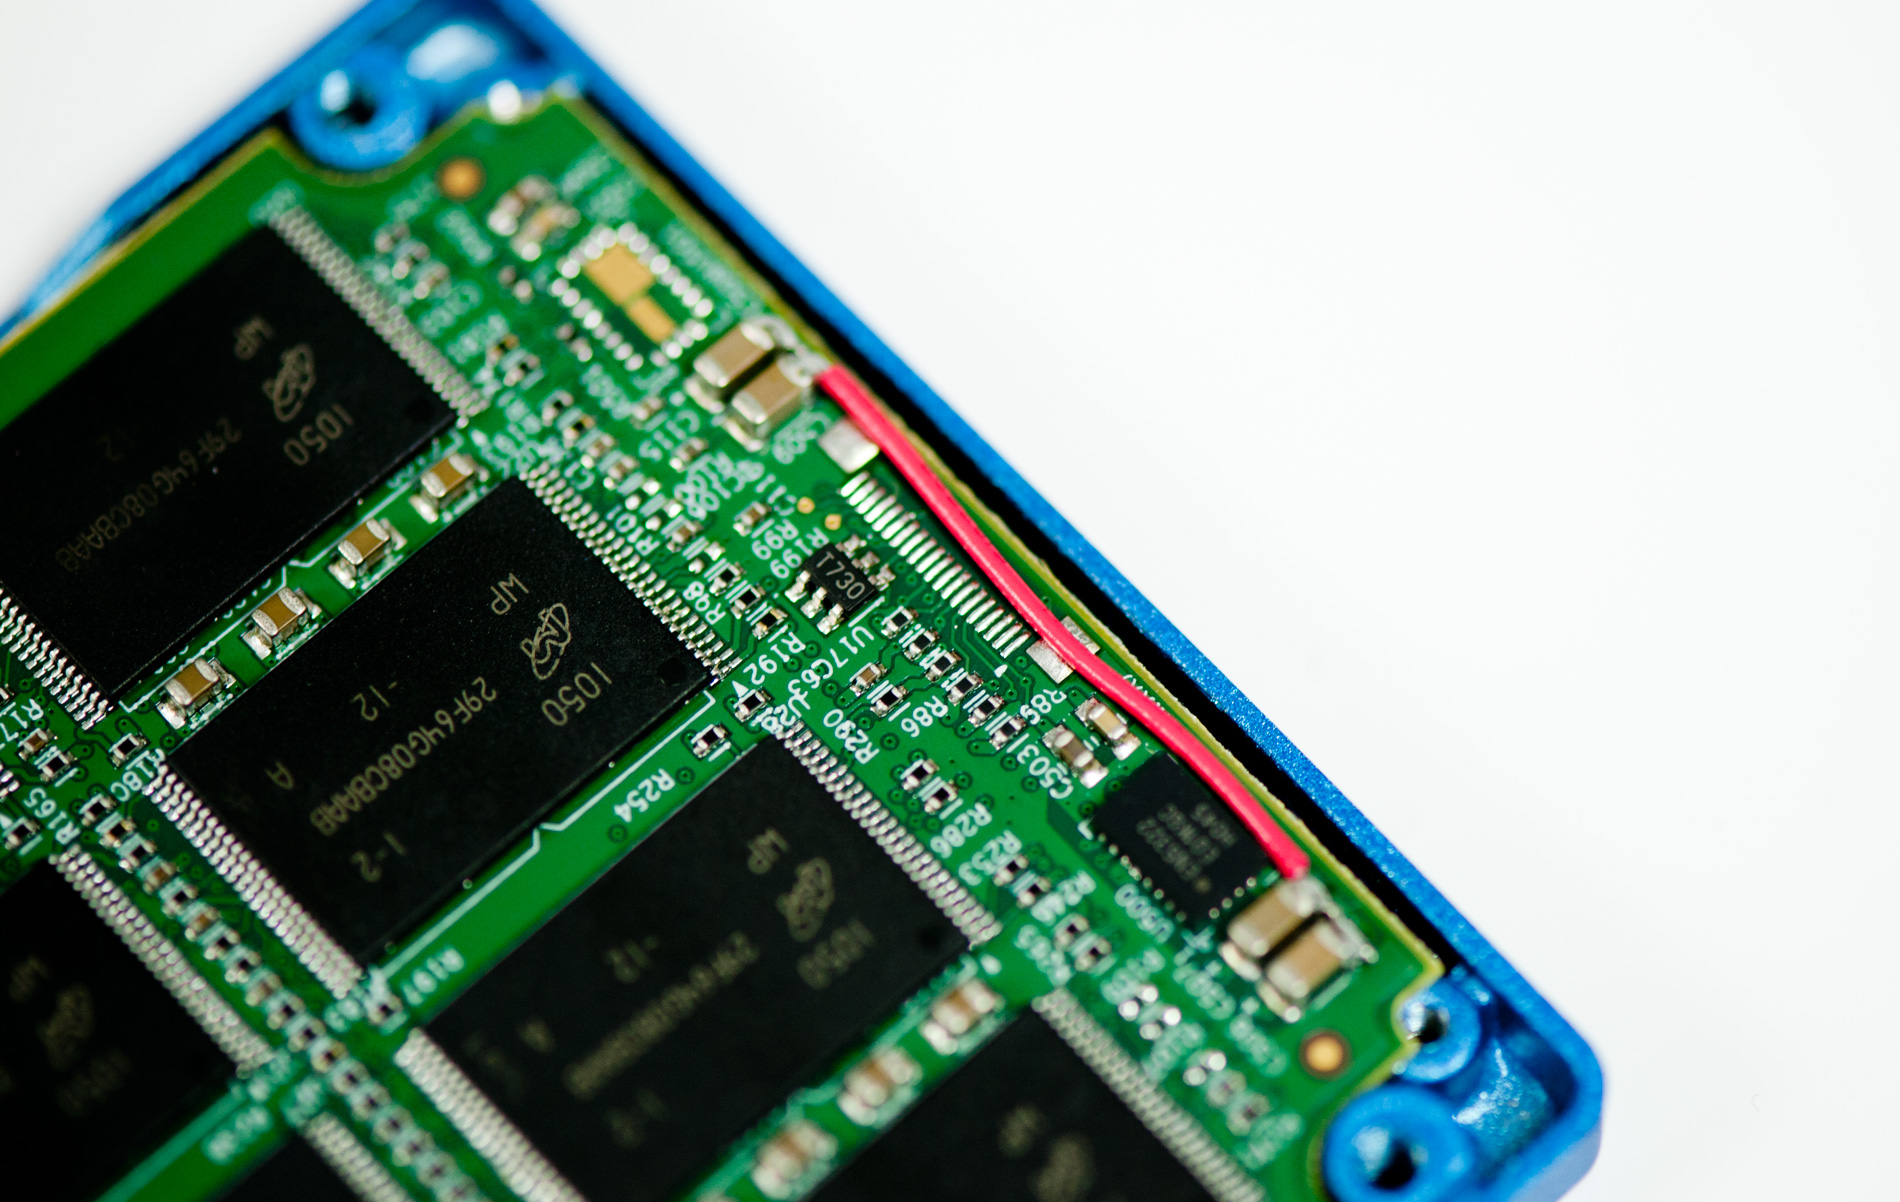
Eventually the rework will be committed to a PCB design change, but early adopters may be stuck with this. The drive's warranty should be unaffected and the impact on reliability really depends on the nature of the rework and quality of the soldering job.
Like OCZ, OWC is shipping SandForce's RC (Release Candidate) firmware on the Mercury Extreme Pro 6G. Unlike OCZ however, OWC's version of the RC firmware has a lower cap on 4KB random writes. In our 4KB random write tests OWC's drive manages 27K IOPS, while the Vertex 3 can push as high as 52K with a highly compressible dataset (39K with incompressible data). OCZ is still SandForce's favorite partner and thus it gets preferential treatment when it comes to firmware.
OWC has informed me that around Friday or Monday it will have mass production firmware from SandForce, which should boost 4KB random write performance on its drive to a level equal to that of the Vertex 3. If that ends up being the case I'll of course post an update to this review. Note that as a result of the cap that's currently in place, OWC's specs for the Mercury Extreme Pro 6G aren't accurate. I don't put much faith in manufacturer specs to begin with, but it's worth pointing out.
| OWC Mercury Extreme Pro 6G Lineup | |||||
| Specs (6Gbps) | 120GB | 240GB | 480GB | ||
| Sustained Reads | 559MB/s | 559MB/s | 559MB/s | ||
| Sustained Writes | 527MB/s | 527MB/s | 527MB/s | ||
| 4KB Random Read | Up to 60K IOPS | Up to 60K IOPS | Up to 60K IOPS | ||
| 4KB Random Write | Up to 60K IOPS | Up to 60K IOPS | Up to 60K IOPS | ||
| MSRP | $319.99 | $579.99 | $1759.99 | ||
OWC is currently only shipping the 120GB Mercury Extreme Pro 6G SSD. Given our recent experience with variable NAND configurations I asked OWC to disclose all shipping configurations of its SF-2200 drive. According to OWC the only version that will ship for the foreseeable future is what I have here today:
There are sixteen 64Gbit Micron 25nm NAND devices on the PCB. Each NAND device only has a single 64Gbit die inside, which results in lower performance for the 120GB drive than 240GB configurations. My review sample of OCZ's 120GB Vertex 3 had a similar configuration but used Intel 25nm NAND instead. In my testing I didn't notice a significant performance difference between the two configurations (4KB random write limits aside).
OWC prices its 120GB drive at $319.99, which today puts it at $20 more than a 120GB Vertex 3. The Mercury Extreme Pro 6G comes with a 3 year warranty from OWC, identical in length to what OCZ offers as well.
Other than the capped firmware, performance shouldn't be any different between OWC's Mercury Extreme Pro 6G and the Vertex 3. Interestingly enough the 4KB random write cap isn't enough to impact any of our real world tests.
The Test
| CPU | Intel Core i7 965 running at 3.2GHz (Turbo & EIST Disabled) Intel Core i7 2600K running at 3.4GHz (Turbo & EIST Disabled) - for AT SB 2011, AS SSD & ATTO |
| Motherboard: | Intel DX58SO (Intel X58) Intel H67 Motherboard |
| Chipset: | Intel X58 + Marvell SATA 6Gbps PCIe Intel H67 |
| Chipset Drivers: | Intel 9.1.1.1015 + Intel IMSM 8.9 Intel 9.1.1.1015 + Intel RST 10.2 |
| Memory: | Qimonda DDR3-1333 4 x 1GB (7-7-7-20) |
| Video Card: | eVGA GeForce GTX 285 |
| Video Drivers: | NVIDIA ForceWare 190.38 64-bit |
| Desktop Resolution: | 1920 x 1200 |
| OS: | Windows 7 x64 |
Random Read/Write Speed
The four corners of SSD performance are as follows: random read, random write, sequential read and sequential write speed. Random accesses are generally small in size, while sequential accesses tend to be larger and thus we have the four Iometer tests we use in all of our reviews.
Our first test writes 4KB in a completely random pattern over an 8GB space of the drive to simulate the sort of random access that you'd see on an OS drive (even this is more stressful than a normal desktop user would see). I perform three concurrent IOs and run the test for 3 minutes. The results reported are in average MB/s over the entire time. We use both standard pseudo randomly generated data for each write as well as fully random data to show you both the maximum and minimum performance offered by SandForce based drives in these tests. The average performance of SF drives will likely be somewhere in between the two values for each drive you see in the graphs. For an understanding of why this matters, read our original SandForce article.
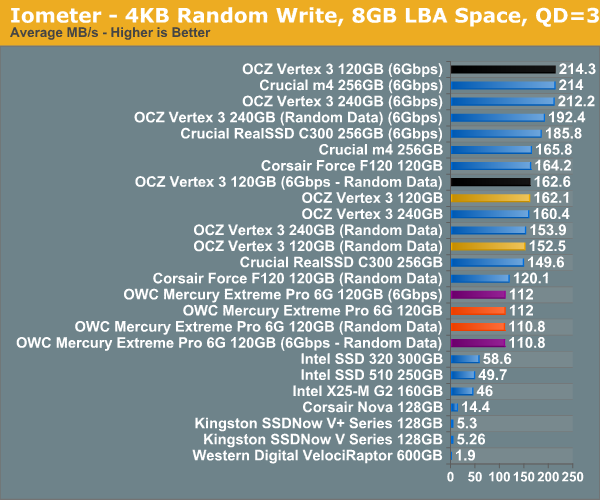
Here you can see the cap on 4KB random writes alive and well. As I've mentioned in previous articles, we're finally good enough when it comes to 4KB random write performance for current desktop workloads - so despite the cap you won't see any real world impact of it in our tests.
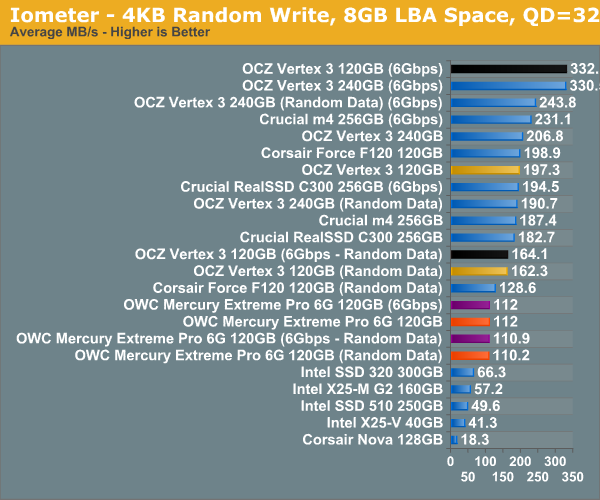
Many of you have asked for random write performance at higher queue depths. What I have below is our 4KB random write test performed at a queue depth of 32 instead of 3. While the vast majority of desktop usage models experience queue depths of 0 - 5, higher depths are possible in heavy I/O (and multi-user) workloads:
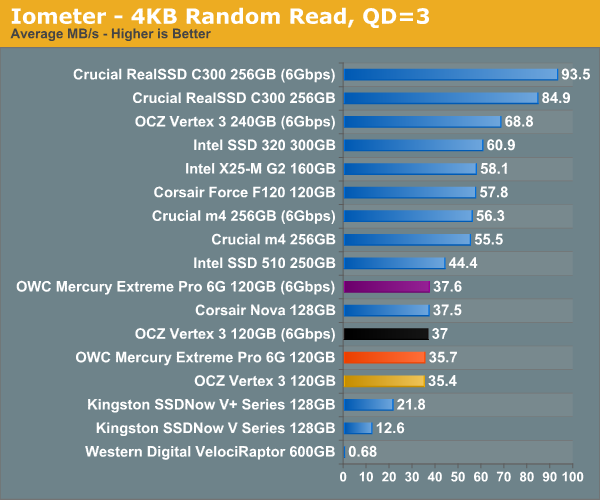
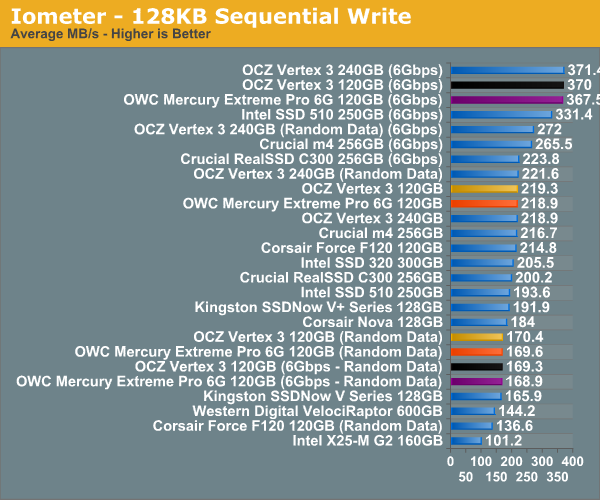
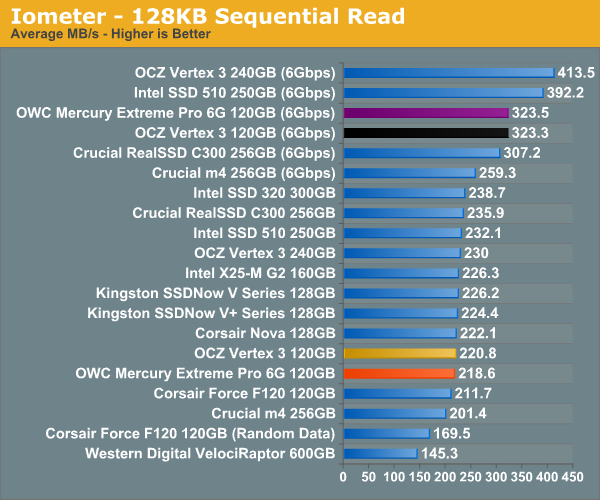
Sequential Read/Write Speed
To measure sequential performance I ran a 1 minute long 128KB sequential test over the entire span of the drive at a queue depth of 1. The results reported are in average MB/s over the entire test length.
AnandTech Storage Bench 2011
I didn't expect to have to debut this so soon, but I've been working on updated benchmarks for 2011. Last year we introduced our AnandTech Storage Bench, a suite of benchmarks that took traces of real OS/application usage and played them back in a repeatable manner. I assembled the traces myself out of frustration with the majority of what we have today in terms of SSD benchmarks.
Although the AnandTech Storage Bench tests did a good job of characterizing SSD performance, they weren't stressful enough. All of the tests performed less than 10GB of reads/writes and typically involved only 4GB of writes specifically. That's not even enough exceed the spare area on most SSDs. Most canned SSD benchmarks don't even come close to writing a single gigabyte of data, but that doesn't mean that simply writing 4GB is acceptable.
Originally I kept the benchmarks short enough that they wouldn't be a burden to run (~30 minutes) but long enough that they were representative of what a power user might do with their system.
Not too long ago I tweeted that I had created what I referred to as the Mother of All SSD Benchmarks (MOASB). Rather than only writing 4GB of data to the drive, this benchmark writes 106.32GB. It's the load you'd put on a drive after nearly two weeks of constant usage. And it takes a *long* time to run.
I'll be sharing the full details of the benchmark in some upcoming SSD articles but here are some details:
1) The MOASB, officially called AnandTech Storage Bench 2011 - Heavy Workload, mainly focuses on the times when your I/O activity is the highest. There is a lot of downloading and application installing that happens during the course of this test. My thinking was that it's during application installs, file copies, downloading and multitasking with all of this that you can really notice performance differences between drives.
2) I tried to cover as many bases as possible with the software I incorporated into this test. There's a lot of photo editing in Photoshop, HTML editing in Dreamweaver, web browsing, game playing/level loading (Starcraft II & WoW are both a part of the test) as well as general use stuff (application installing, virus scanning). I included a large amount of email downloading, document creation and editing as well. To top it all off I even use Visual Studio 2008 to build Chromium during the test.
Update: As promised, some more details about our Heavy Workload for 2011.
The test has 2,168,893 read operations and 1,783,447 write operations. The IO breakdown is as follows:
| AnandTech Storage Bench 2011 - Heavy Workload IO Breakdown | ||||
| IO Size | % of Total | |||
| 4KB | 28% | |||
| 16KB | 10% | |||
| 32KB | 10% | |||
| 64KB | 4% | |||
Only 42% of all operations are sequential, the rest range from pseudo to fully random (with most falling in the pseudo-random category). Average queue depth is 4.625 IOs, with 59% of operations taking place in an IO queue of 1.
Many of you have asked for a better way to really characterize performance. Simply looking at IOPS doesn't really say much. As a result I'm going to be presenting Storage Bench 2011 data in a slightly different way. We'll have performance represented as Average MB/s, with higher numbers being better. At the same time I'll be reporting how long the SSD was busy while running this test. These disk busy graphs will show you exactly how much time was shaved off by using a faster drive vs. a slower one during the course of this test. Finally, I will also break out performance into reads, writes and combined. The reason I do this is to help balance out the fact that this test is unusually write intensive, which can often hide the benefits of a drive with good read performance.
There's also a new light workload for 2011. This is a far more reasonable, typical every day use case benchmark. Lots of web browsing, photo editing (but with a greater focus on photo consumption), video playback as well as some application installs and gaming. This test isn't nearly as write intensive as the MOASB but it's still multiple times more write intensive than what we were running last year.
As always I don't believe that these two benchmarks alone are enough to characterize the performance of a drive, but hopefully along with the rest of our tests they will help provide a better idea.
The testbed for Storage Bench 2011 has changed as well. We're now using a Sandy Bridge platform with full 6Gbps support for these tests. All of the older tests are still run on our X58 platform.
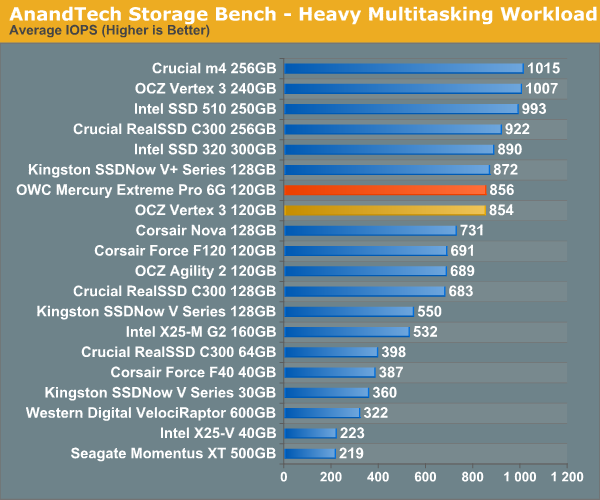
AnandTech Storage Bench 2011 - Heavy Workload
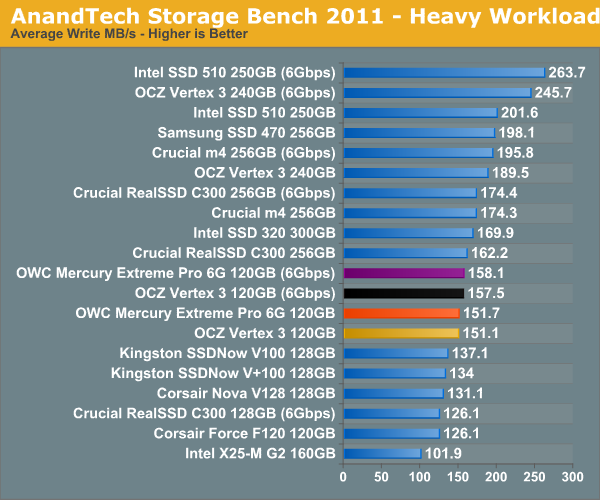
We'll start out by looking at average data rate throughout our new heavy workload test:
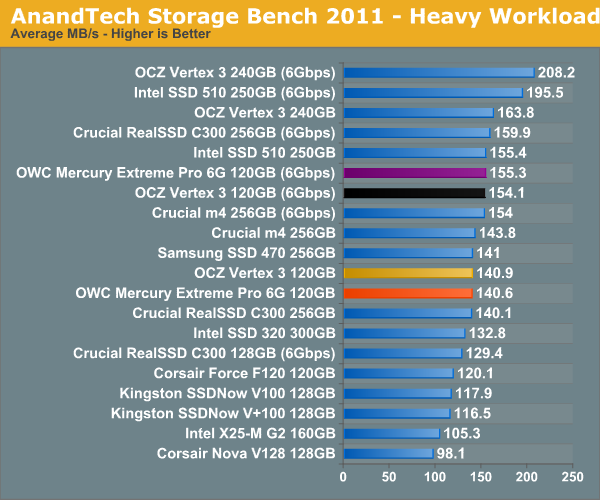
Overall performance is identical to the 120GB Vertex 3, but still behind the 240GB version due to the use of single-die NAND devices. At 240GB the choice is clear, but at 120GB I'm still waiting to get my hands on a few more drives before determining the best buy at that price point.
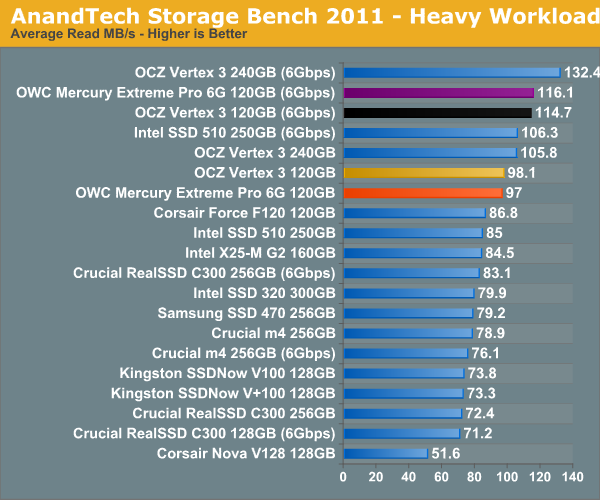
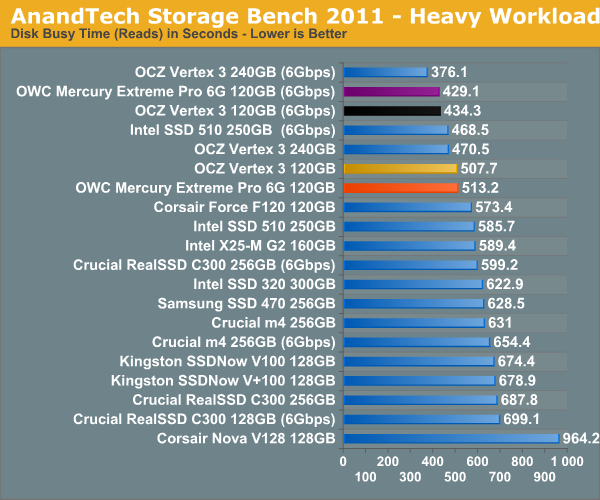
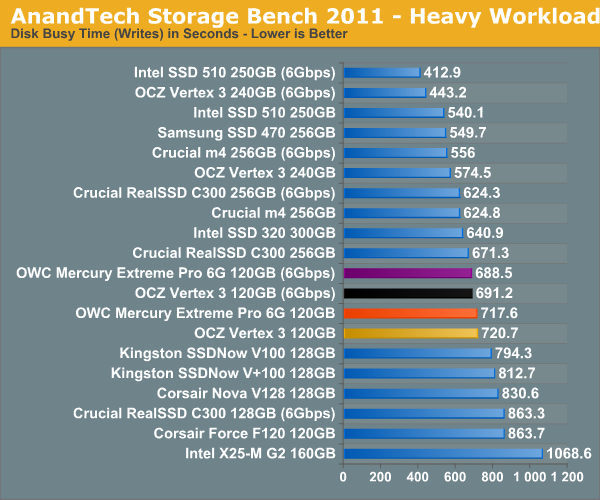
The breakdown of reads vs. writes tells us more of what's going on:
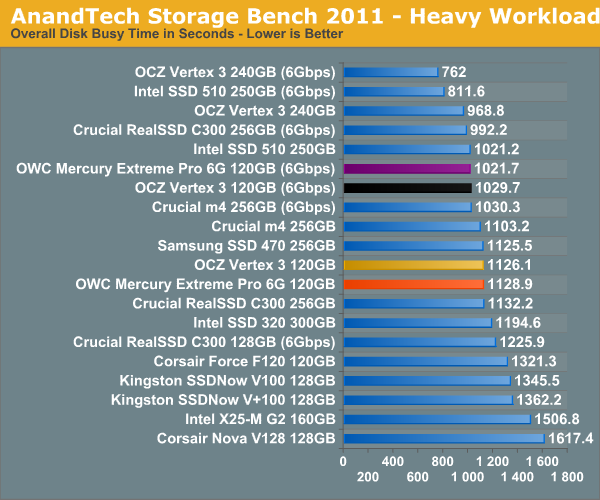
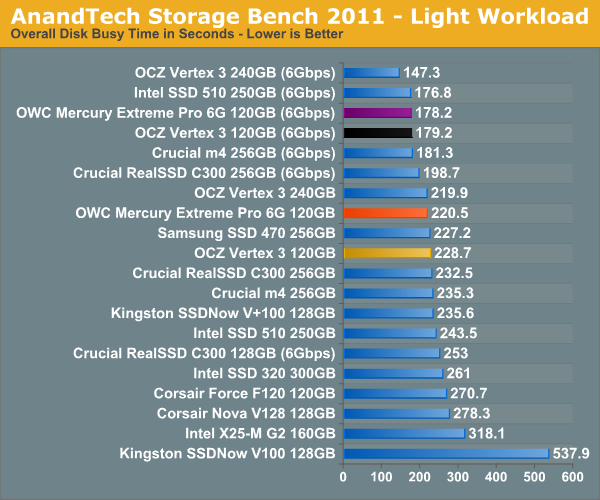
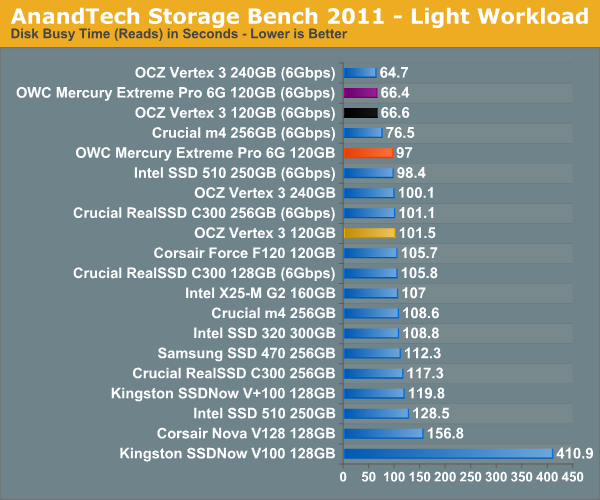
The next three charts just represent the same data, but in a different manner. Instead of looking at average data rate, we're looking at how long the disk was busy for during this entire test. Note that disk busy time excludes any and all idles, this is just how long the SSD was busy doing something:
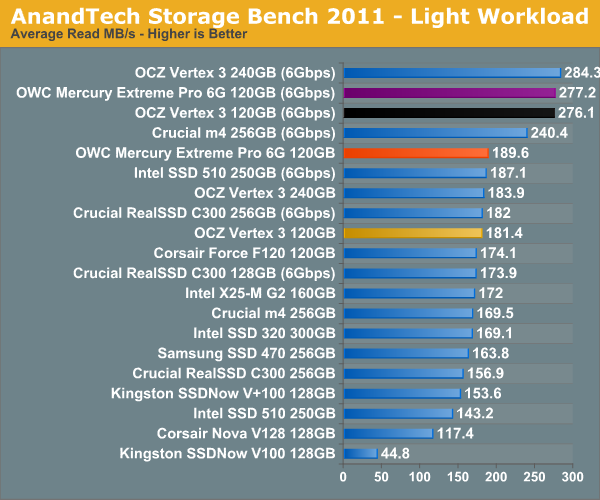
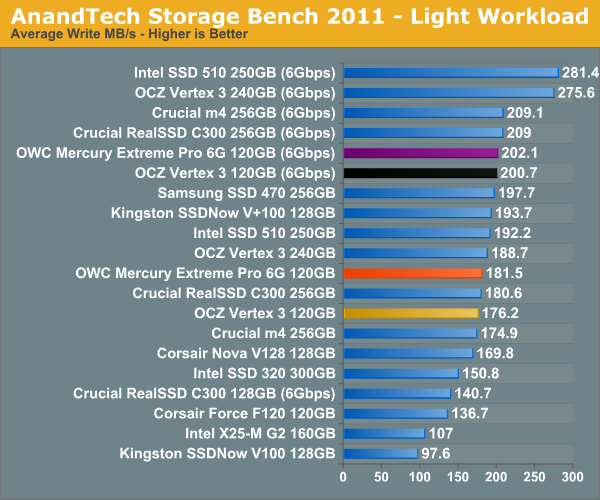
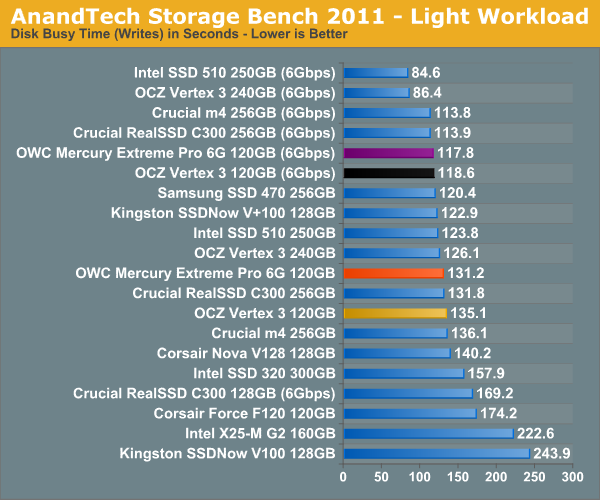
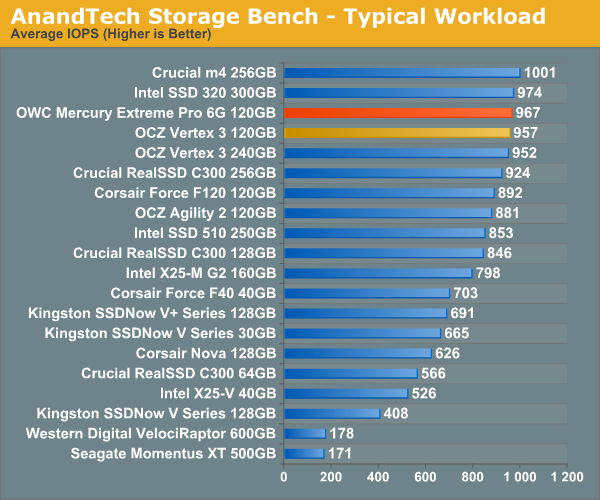
AnandTech Storage Bench 2011 - Light Workload
Our new light workload actually has more write operations than read operations. The split is as follows: 372,630 reads and 459,709 writes. The relatively close read/write ratio does better mimic a typical light workload (although even lighter workloads would be far more read centric).
The I/O breakdown is similar to the heavy workload at small IOs, however you'll notice that there are far fewer large IO transfers:
| AnandTech Storage Bench 2011 - Light Workload IO Breakdown | ||||
| IO Size | % of Total | |||
| 4KB | 27% | |||
| 16KB | 8% | |||
| 32KB | 6% | |||
| 64KB | 5% | |||
Despite the reduction in large IOs, over 60% of all operations are perfectly sequential. Average queue depth is a lighter 2.2029 IOs.
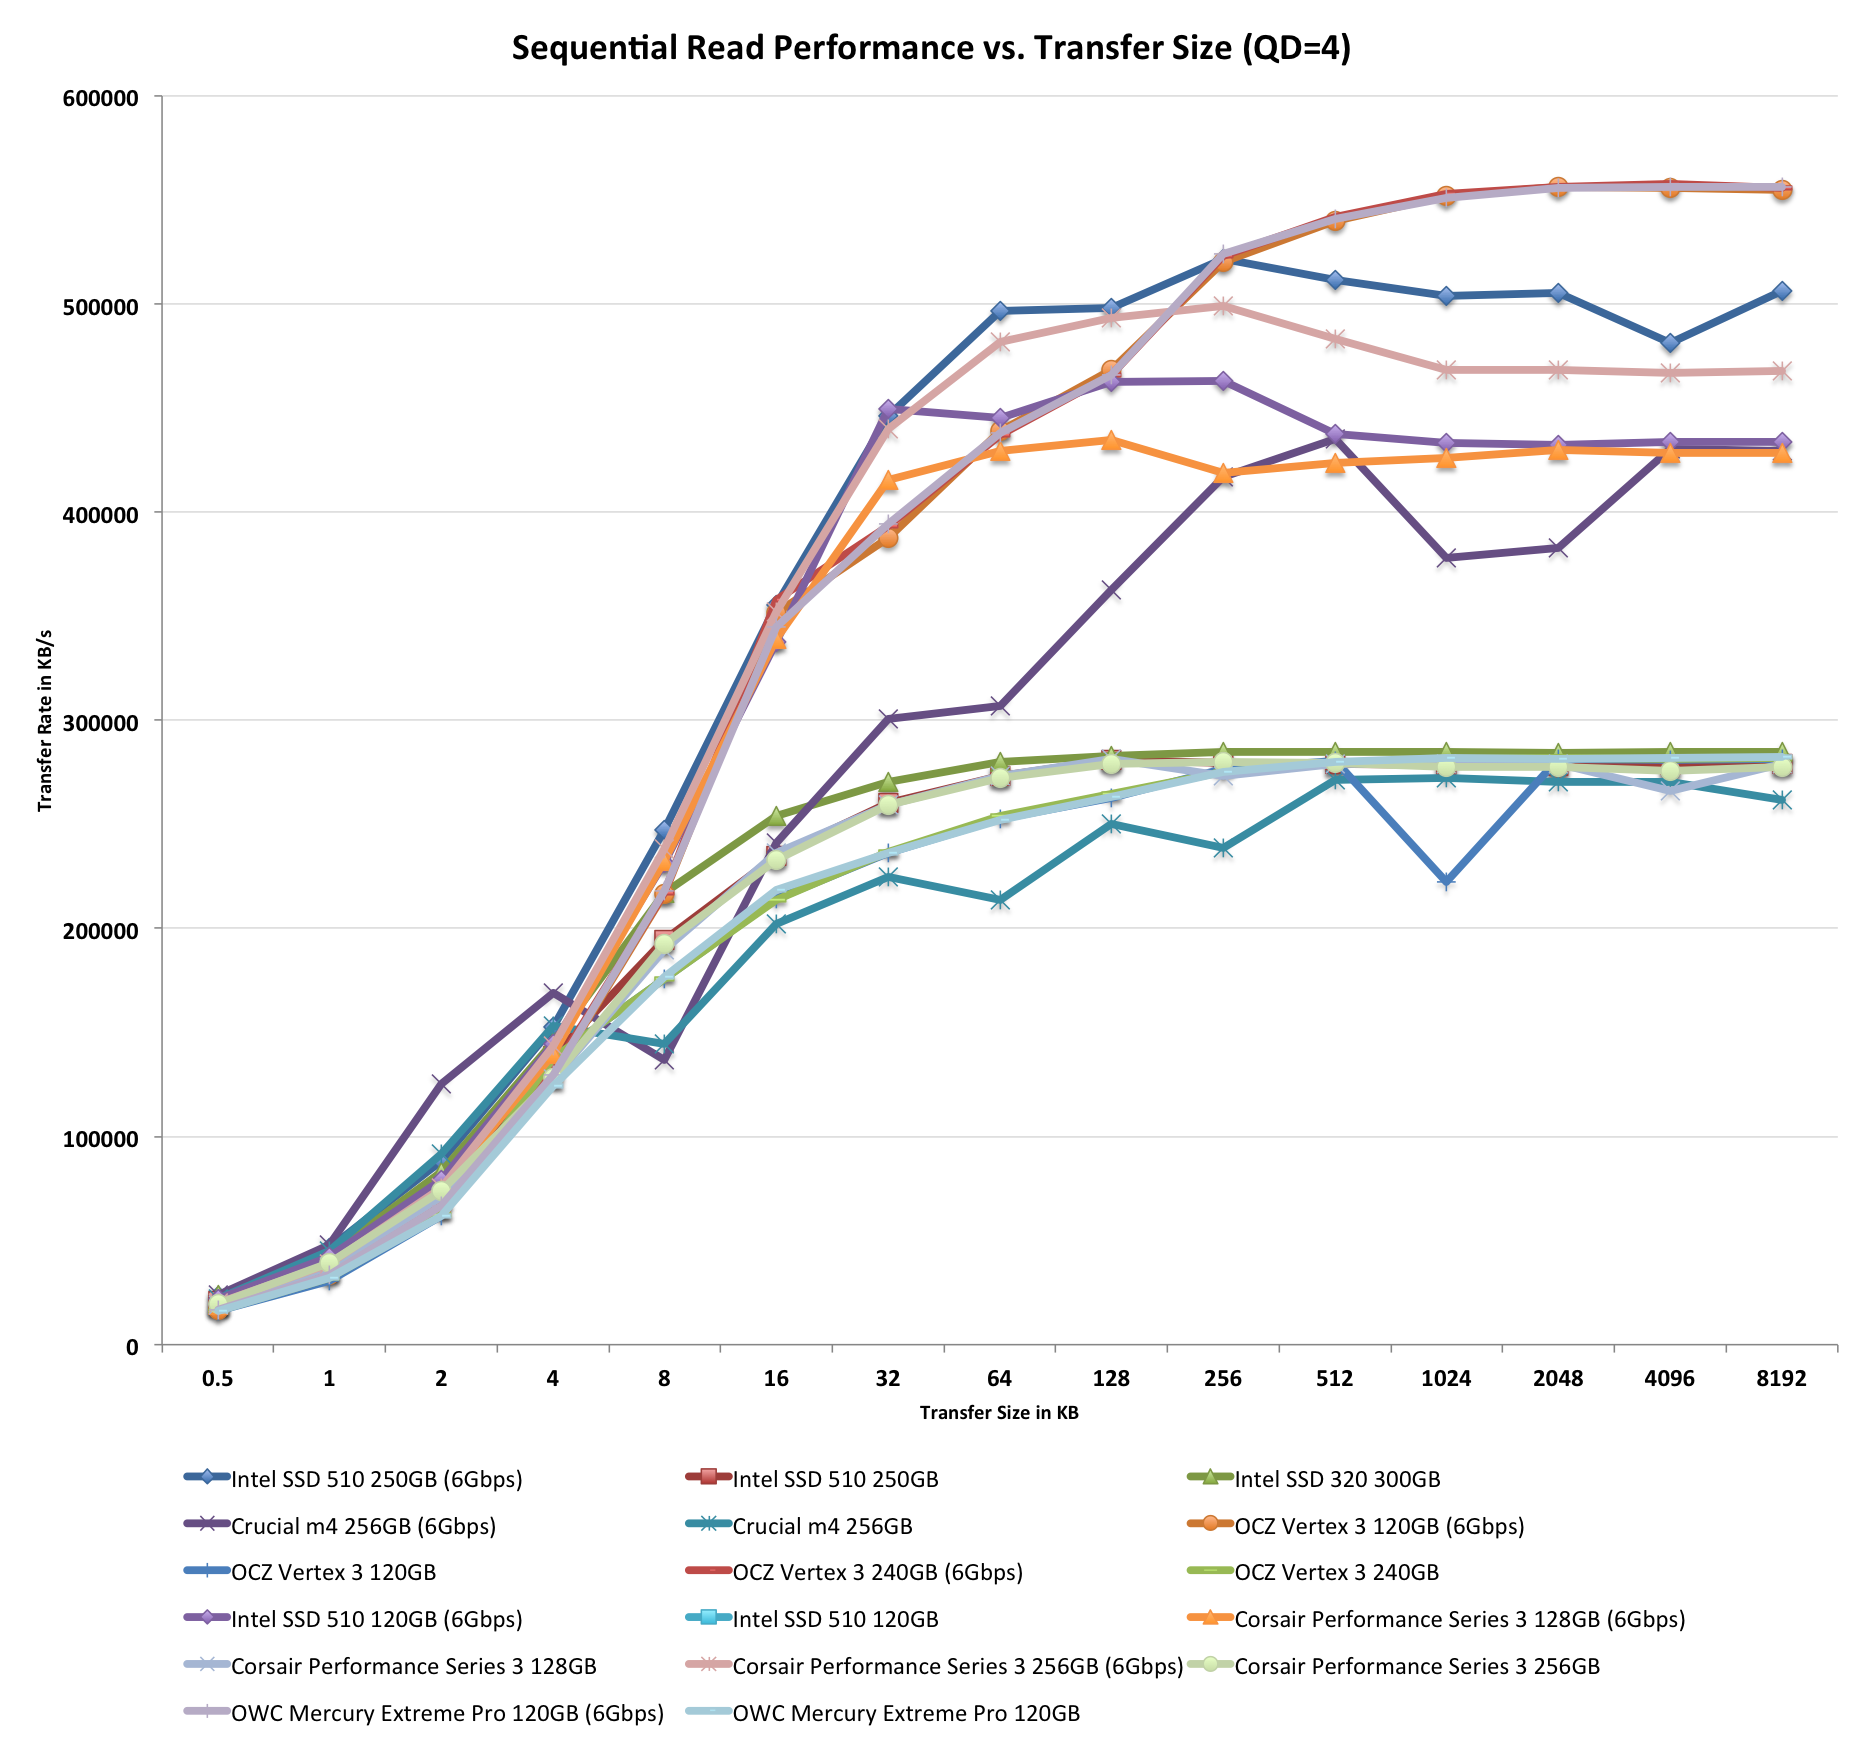
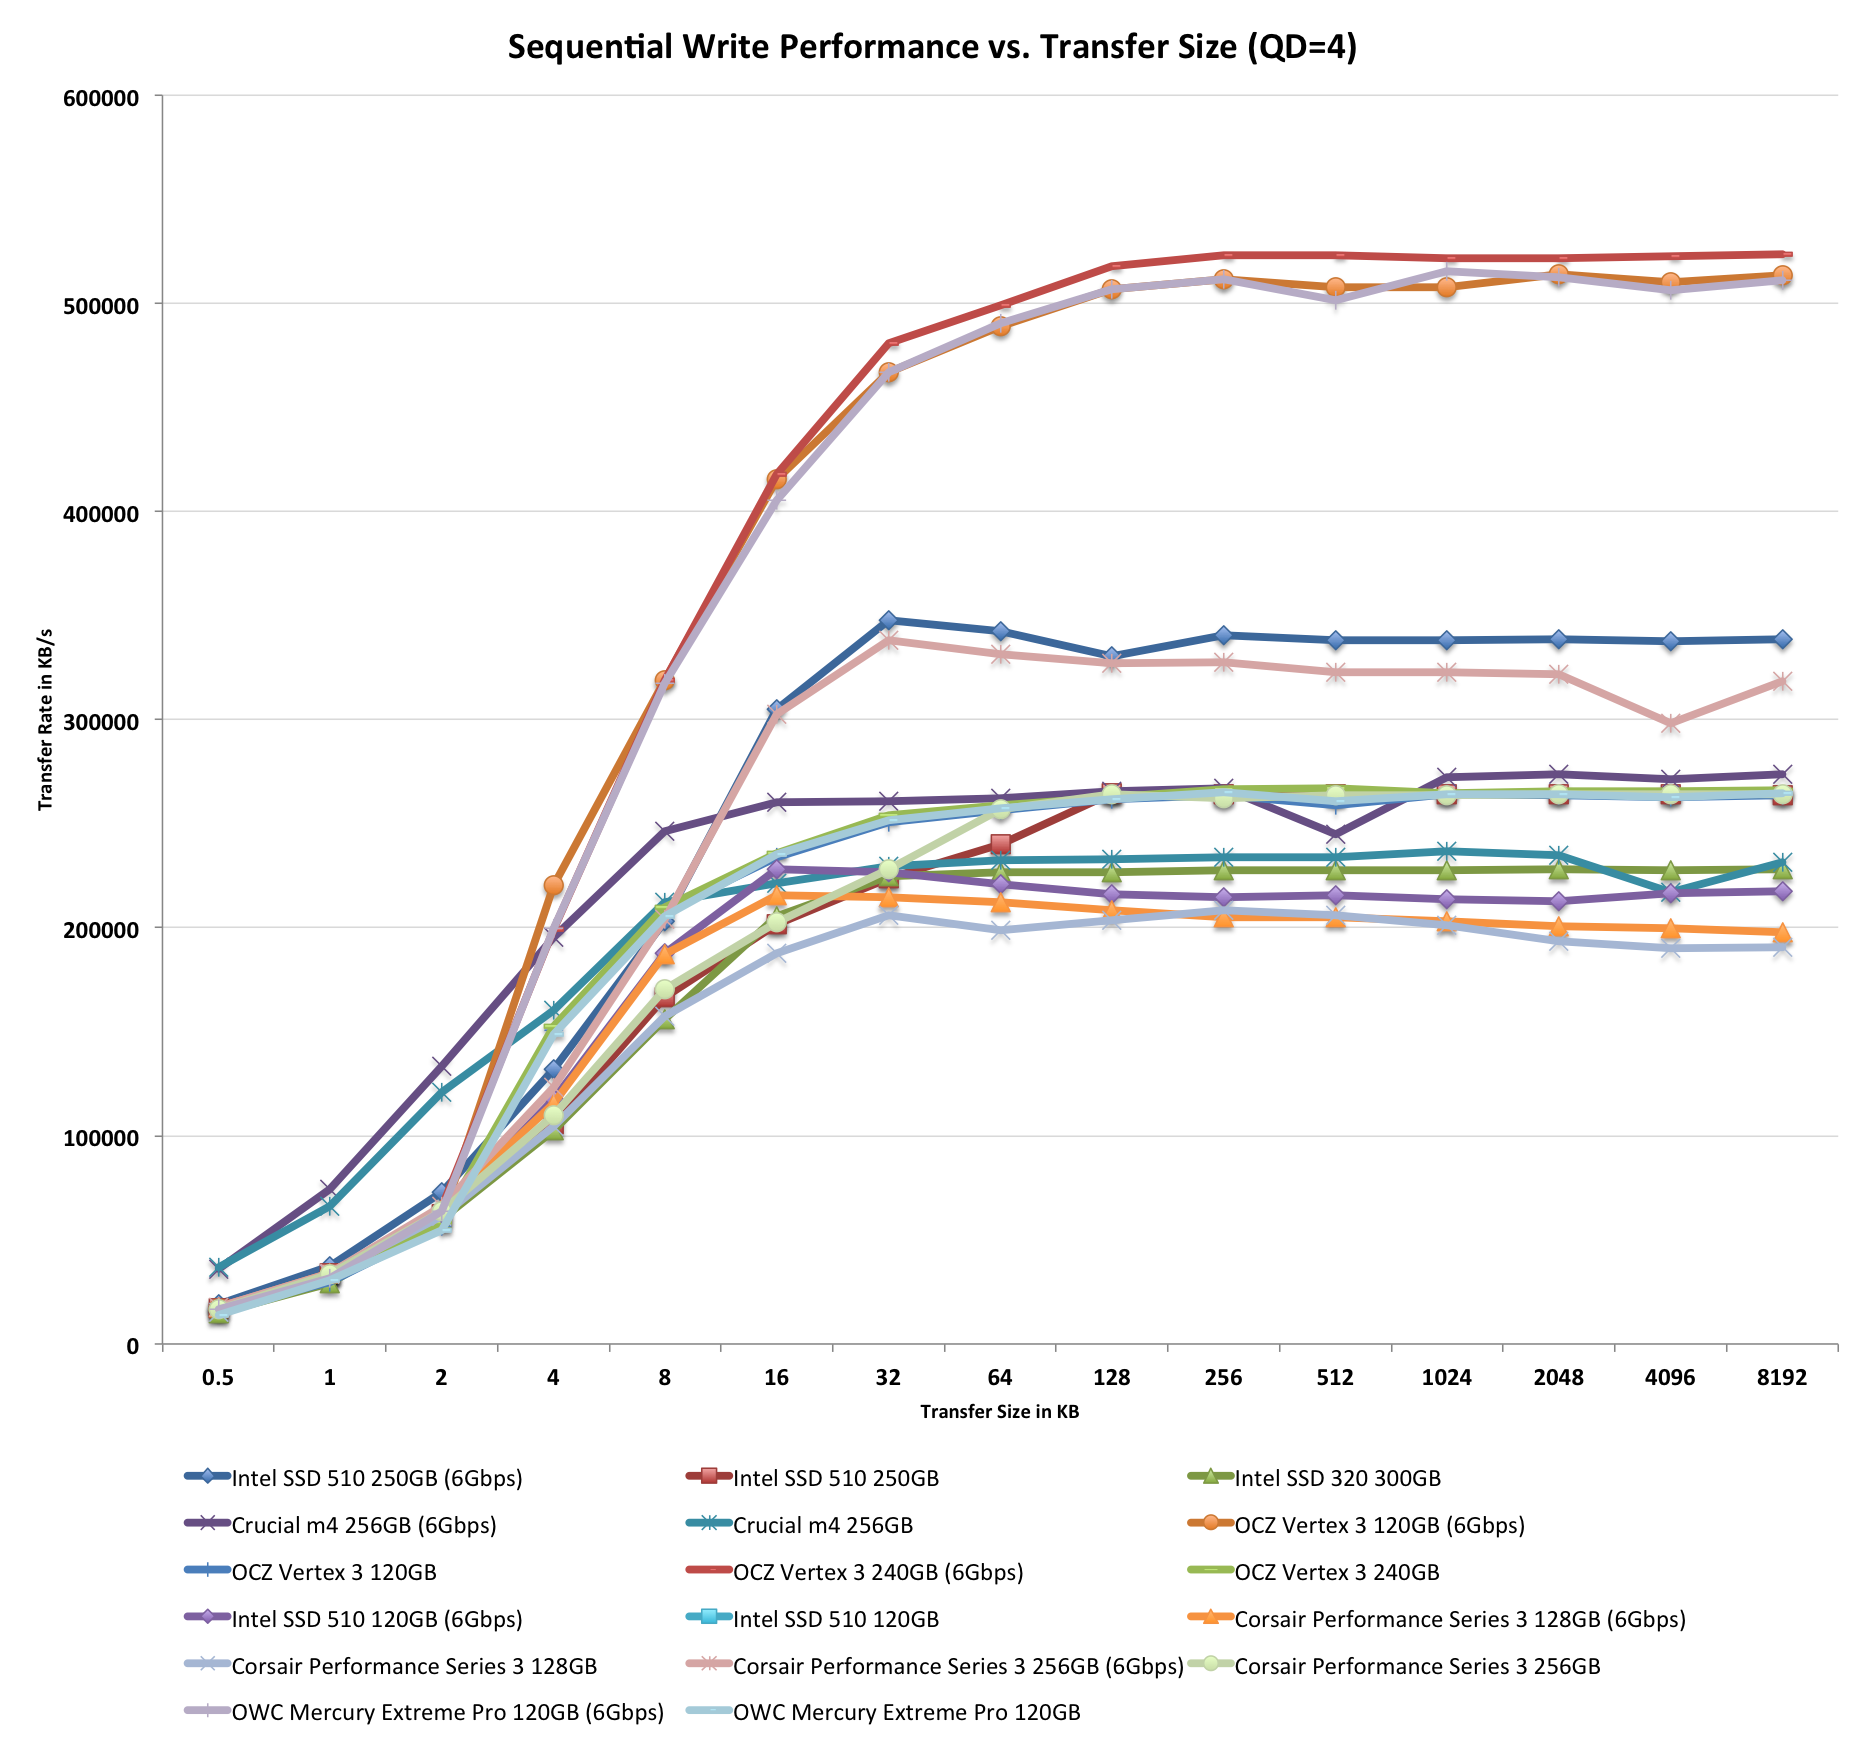
Performance vs. Transfer Size
All of our Iometer sequential tests happen at a queue depth of 1, which is indicative of a light desktop workload. It isn't too far fetched to see much higher queue depths on the desktop. The performance of these SSDs also greatly varies based on the size of the transfer. For this next test we turn to ATTO and run a sequential write over a 2GB span of LBAs at a queue depth of 4 and varying the size of the transfers.
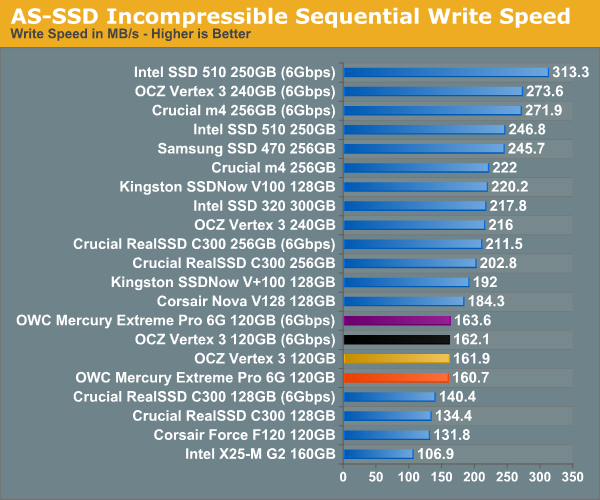
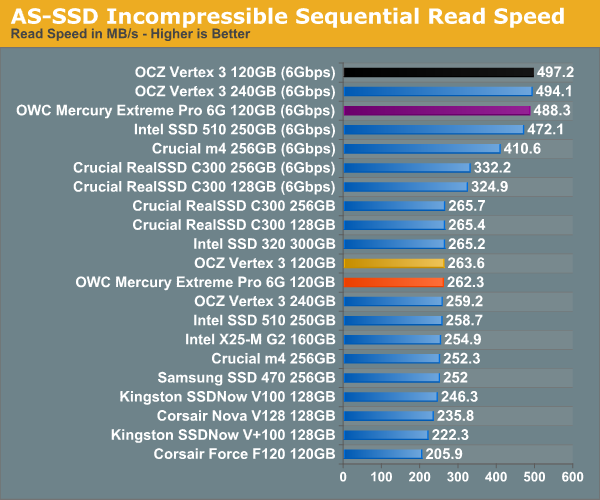
AS-SSD Incompressible Sequential Performance
The AS-SSD sequential benchmark uses incompressible data for all of its transfers. The result is a pretty big reduction in sequential write speed on SandForce based controllers.
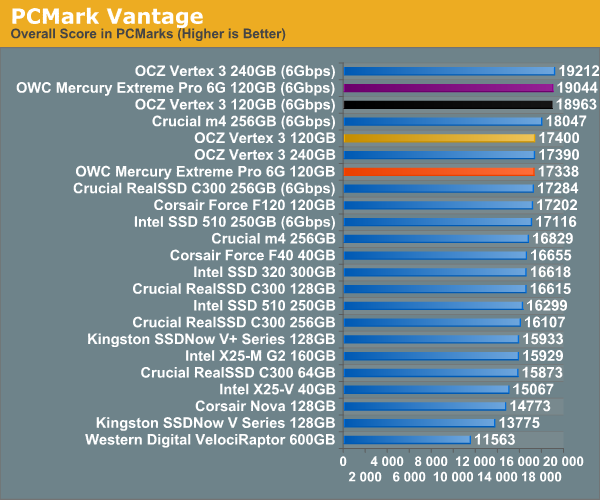
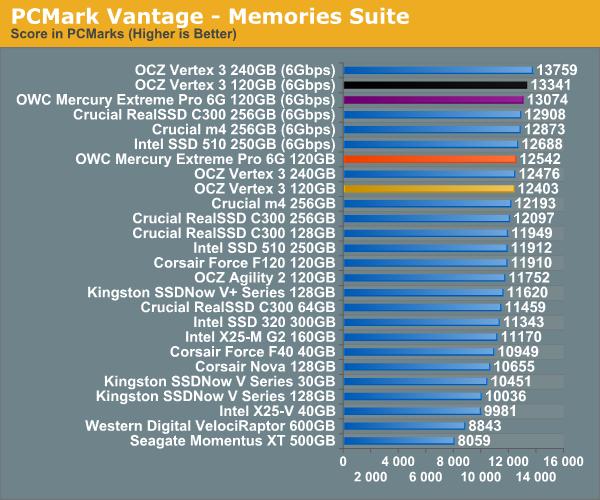
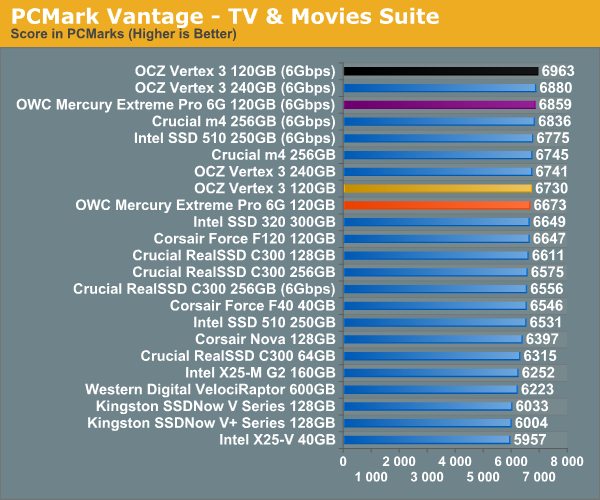
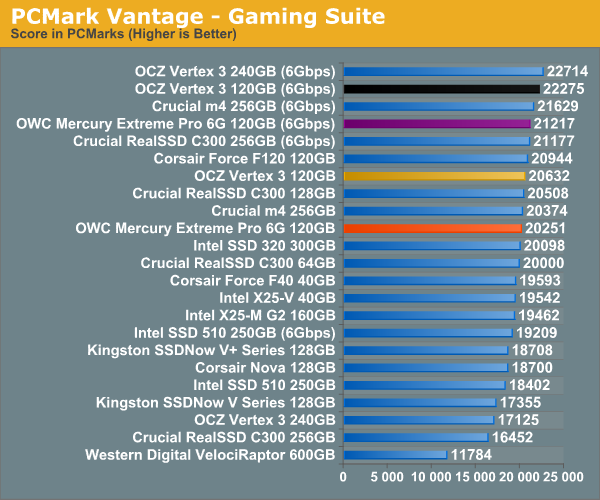
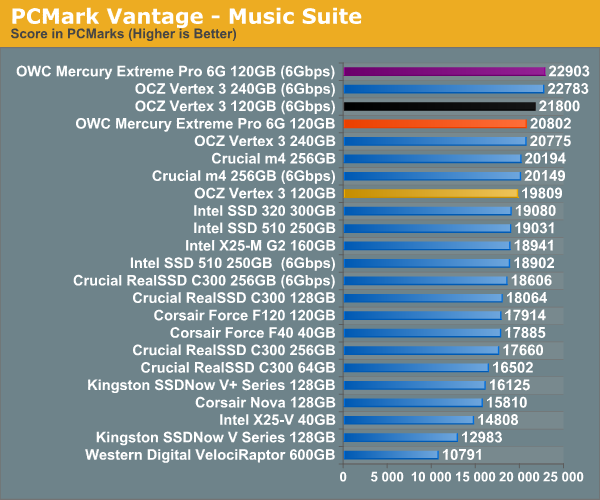
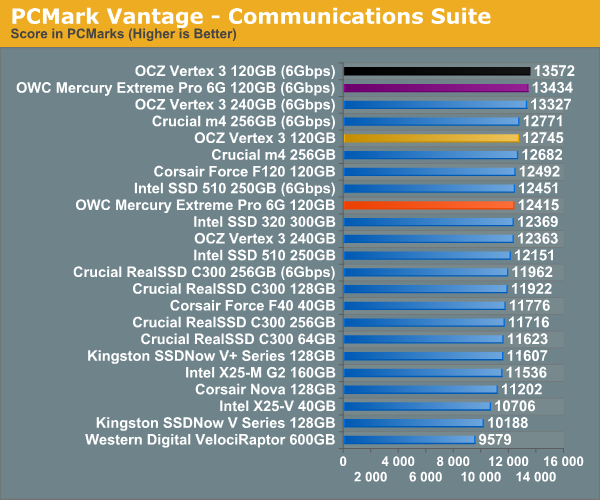
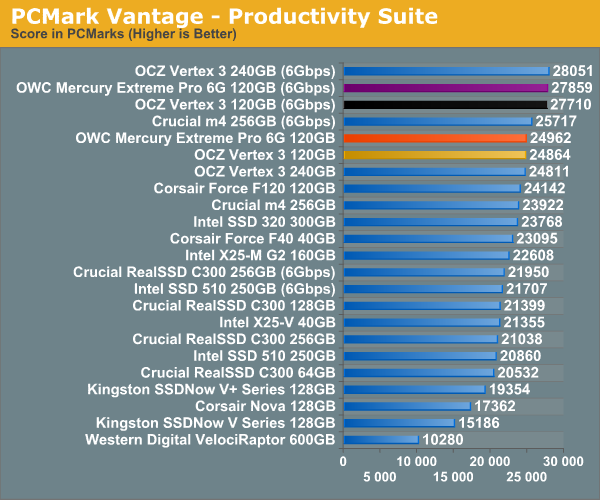
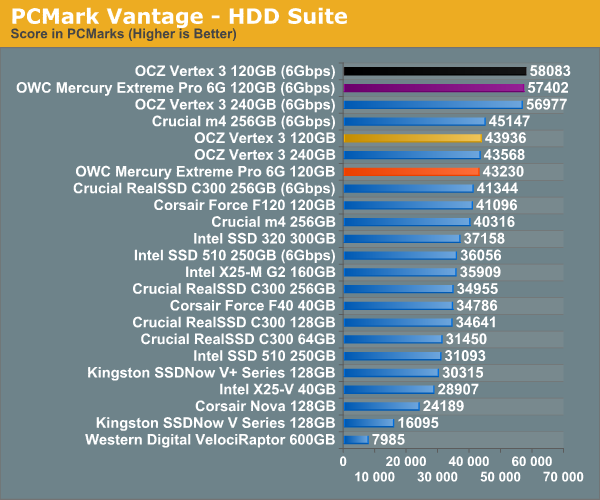
Overall System Performance using PCMark Vantage
Next up is PCMark Vantage, another system-wide performance suite. For those of you who aren’t familiar with PCMark Vantage, it ends up being the most real-world-like hard drive test I can come up with. It runs things like application launches, file searches, web browsing, contacts searching, video playback, photo editing and other completely mundane but real-world tasks. I’ve described the benchmark in great detail before but if you’d like to read up on what it does in particular, take a look at Futuremark’s whitepaper on the benchmark; it’s not perfect, but it’s good enough to be a member of a comprehensive storage benchmark suite. Any performance impacts here would most likely be reflected in the real world.
AnandTech Storage Bench 2010
To keep things consistent we've also included our older Storage Bench. Note that the old storage test system doesn't have a SATA 6Gbps controller, so we only have one result for the 6Gbps drives.
The first in our benchmark suite is a light/typical usage case. The Windows 7 system is loaded with Firefox, Office 2007 and Adobe Reader among other applications. With Firefox we browse web pages like Facebook, AnandTech, Digg and other sites. Outlook is also running and we use it to check emails, create and send a message with a PDF attachment. Adobe Reader is used to view some PDFs. Excel 2007 is used to create a spreadsheet, graphs and save the document. The same goes for Word 2007. We open and step through a presentation in PowerPoint 2007 received as an email attachment before saving it to the desktop. Finally we watch a bit of a Firefly episode in Windows Media Player 11.
There’s some level of multitasking going on here but it’s not unreasonable by any means. Generally the application tasks proceed linearly, with the exception of things like web browsing which may happen in between one of the other tasks.
The recording is played back on all of our drives here today. Remember that we’re isolating disk performance, all we’re doing is playing back every single disk access that happened in that ~5 minute period of usage. The light workload is composed of 37,501 reads and 20,268 writes. Over 30% of the IOs are 4KB, 11% are 16KB, 22% are 32KB and approximately 13% are 64KB in size. Less than 30% of the operations are absolutely sequential in nature. Average queue depth is 6.09 IOs.
The performance results are reported in average I/O Operations per Second (IOPS):
If there’s a light usage case there’s bound to be a heavy one. In this test we have Microsoft Security Essentials running in the background with real time virus scanning enabled. We also perform a quick scan in the middle of the test. Firefox, Outlook, Excel, Word and Powerpoint are all used the same as they were in the light test. We add Photoshop CS4 to the mix, opening a bunch of 12MP images, editing them, then saving them as highly compressed JPGs for web publishing. Windows 7’s picture viewer is used to view a bunch of pictures on the hard drive. We use 7-zip to create and extract .7z archives. Downloading is also prominently featured in our heavy test; we download large files from the Internet during portions of the benchmark, as well as use uTorrent to grab a couple of torrents. Some of the applications in use are installed during the benchmark, Windows updates are also installed. Towards the end of the test we launch World of Warcraft, play for a few minutes, then delete the folder. This test also takes into account all of the disk accesses that happen while the OS is booting.
The benchmark is 22 minutes long and it consists of 128,895 read operations and 72,411 write operations. Roughly 44% of all IOs were sequential. Approximately 30% of all accesses were 4KB in size, 12% were 16KB in size, 14% were 32KB and 20% were 64KB. Average queue depth was 3.59.
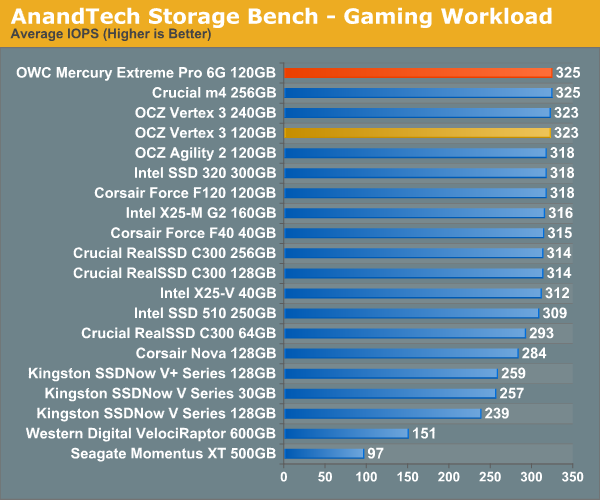
The gaming workload is made up of 75,206 read operations and only 4,592 write operations. Only 20% of the accesses are 4KB in size, nearly 40% are 64KB and 20% are 32KB. A whopping 69% of the IOs are sequential, meaning this is predominantly a sequential read benchmark. The average queue depth is 7.76 IOs.
TRIM Performance
In practice, SandForce based drives running a desktop workload do very well and typically boast an average write amplification below 1 (more writes to the device than actual writes to NAND). My personal SF-1200 drive had a write amplification of around 0.6 after several months of use. However if subjected to a workload composed entirely of incompressible writes (e.g. tons of compressed images, videos and music) you can back the controller into a corner.
To simulate this I filled the drive with incompressible data, ran a 4KB (100% LBA space, QD32) random write test with incompressible data for 20 minutes, and then ran AS-SSD (another incompressible data test) to see how low performance could get:
| OWC Mercury Extreme Pro 6G 120GB - Resiliency - AS SSD Sequential Write Speed - 6Gbps | |||||
| Clean | After Torture | After TRIM | |||
| OWC ME Pro 6G 120GB | 163.6 MB/s | 62.7 MB/s | 104.9 MB/s | ||
| OCZ Vertex 3 120GB | 162.1 MB/s | 38.3 MB/s | 101.5 MB/s | ||
You'll notice that the After Torture number is better than the 120GB Vertex 3. Remember that the OWC drive's 4KB random write performance is capped, so the drive simply doesn't get as fragmented in 20 minutes as the Vertex 3 - the behavior of the two drives would be the same if we wrote the same physical amount of data to each drive. Neither drive is quite as resilient as the 240GB version. If you are using your SSD primarily for incompressible data (images/videos/music) storage and manipulation then you're probably better off with an Intel SSD 510 or Crucial m4.
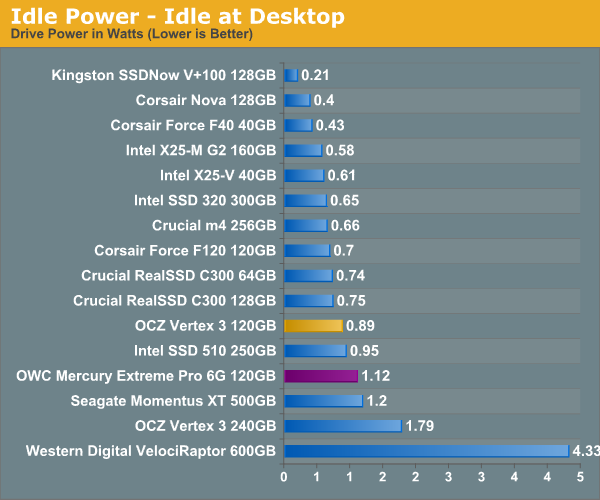
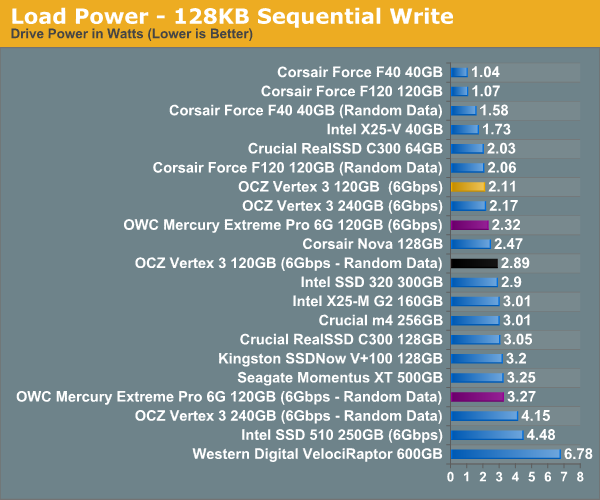
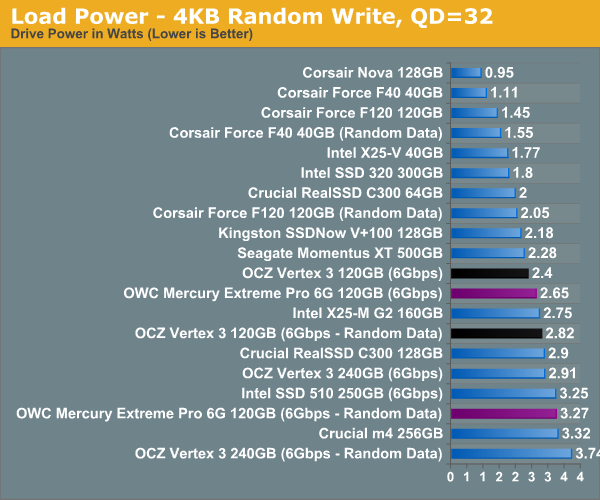
Power Consumption
Power consumption is a bit higher on the OWC drive than the Vertex 3, perhaps the firmware differences extend beyond just 4KB random write performance:
Final Words
With the exception of the (temporary?) 4KB random write cap and slightly higher power consumption, OWC's Mercury Extreme Pro 6G is a dead ringer for OCZ's Vertex 3 - at least at the 120GB capacity. The two come with comparable warranties which brings the decision down to pricing, where OCZ currently has a $20 advantage.
That's about as open and shut as you can get. My preference is still 240GB for anything SF-2200 based given the sizable increase in performance, but that added performance and capacity does come at a high price. Speaking of which, OCZ's retail 240GB Vertex 3 is next on my hit list...


