Original Link: https://www.anandtech.com/show/3690/the-impact-of-spare-area-on-sandforce-more-capacity-at-no-performance-loss
The Impact of Spare Area on SandForce, More Capacity At No Performance Loss?
by Anand Lal Shimpi on May 3, 2010 2:08 AM ESTNo, it’s not the new Indilinx JetStream controller - that’ll be in the second half of the year at the earliest. And it’s definitely not Intel’s 3rd generation X25-M, we won’t see that until Q4. The SSD I posted a teaser of last week is a modified version of OCZ’s Agility 2.
The modification? Instead of around 28% of the drive’s NAND set aside as spare area, this version of the Agility 2 has 13%. You get more capacity to store data, at the expense of potentially lower performance. How much lower? That’s exactly what I’ve spent the past several days trying to find out.
The drive looks just like a standard Agility 2. OCZ often makes special runs of drives for testing with no official labels or markings, in fact that's what my first SandForce drive came as late last year. Internally the drive looks identical to the Agility 2 we reviewed not too long ago.
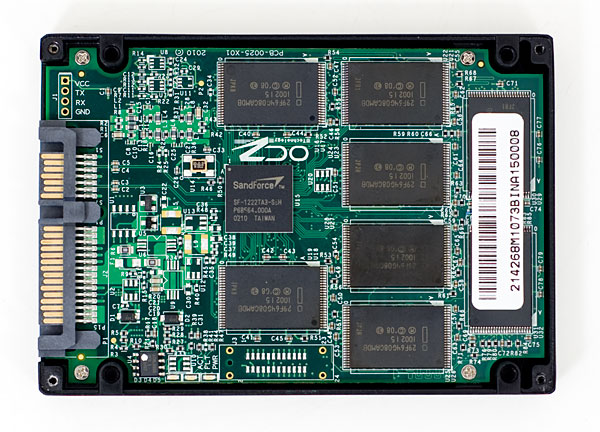
OCZ lists the firmware as 1.01 compared to the standard 1.0 firmware on the shipping Agility 2. The only difference I'm aware of is the amount of NAND set aside as spare area.
SandForce and Spare Area
When you write data to a SandForce drive the controller attempts to represent the data you’re writing with fewer bits. What’s stored isn’t your exact data, but a smaller representation of it plus a hash or index so that you can recover the original data. This results in potentially lower write amplification, but greater reliance on the controller and firmware.
SandForce stores some amount of redundant information in order to deal with decreasing reliability of smaller geometry NAND. The redundant data and index/hash of the actual data being written are stored in the drive’s spare area.
While most consumer SSDs dedicate around 7% of their total capacity to spare area, SandForce’s drives have required ~28% until now. As I mentioned at the end of last year however, SandForce would be bringing a more consumer focused firmware to market after the SF-1200 with only 13% over provisioning. That’s what’s loaded on the drive OCZ sent me late last week.
| SandForce Overprovisioning Comparison | |||||
| Advertised Capacity | Total Flash | Formatted Capacity (28% OP) | Formatted Capacity (13% OP) | ||
| 50GB | 64GB | 46.6GB | 55.9GB | ||
| 100GB | 128GB | 93.1GB | 111.8GB | ||
| 200GB | 256GB | 186.3GB | 223.5GB | ||
| 400GB | 512GB | 372.5GB | 447.0GB | ||
As always, if you want to know more about SandForce read this, and if you want to know more about how SSDs work read this.
When Does Spare Area Matter?
In addition to the SandForce-specific uses of spare area, all SSDs use it for three purposes: 1) read-modify-writes, 2) wear leveling and 3) bad block replacement.
If a SSD is running out of open pages and a block full of invalid data needs to be cleaned, its valid contents is copied to a new block allocated from the spare area and the two blocks swap positions. The old block is cleaned and tossed into the spare area pool and formerly spare block is now put into regular use.
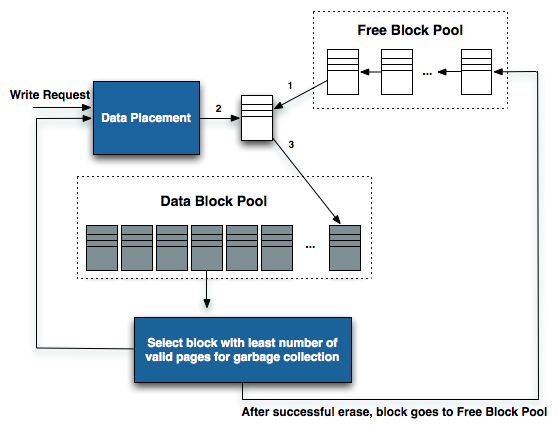
Recreated from diagram originally produced by IBM's Zurich Research Lab
The spare area is also used for wear leveling. NAND blocks in the spare area are constantly being moved in and out of user space to make sure that all parts of the drive wear evenly.
And finally, if a block does wear out (either expectedly or unexpectedly), its replacement comes from the spare area.
The Impact of Spare Area on Performance
More spare area can provide for a longer lasting drive, but the best way to measure its impact is to look at performance (lower write amplification leads to lower wear which ultimately leads to a longer lifespan).
SandForce's controllers are dynamic: they'll use all free (untouched or TRIMed) space on the drive as spare area. To measure the difference in performance between a drive with 28% spare area and one with 13% we must first fill the drives to their capacity. The point being to leave the controller with nothing but its spare area to use the moment we start writing to it. Unfortunately this is easier said than done with a SandForce drive.
If you just write sequential data to the drive first there's no guarantee that you'll actually fill up the NAND. The controller may just do away with a lot of the bits and write a fraction of it. To get around this problem we resorted to our custom build of iometer that let's us write completely random data to the drive. In theory this should get around SandForce's algorithms and give us virtually 1:1 mapping between what we write and what ends up on the NAND.
That’s not enough though. The minute we run one of our desktop workloads on the SandForce drive it’ll most likely toss out most of the bits and only lightly tap into the spare area. To be sure let’s look at the results of our AT Storage Bench suite if we first fill these drives with completely random, invalid data. Every time our benchmark scripts write to the drive it should force a read-modify-write and tap into some of that spare area.
This graph shows the percentage of new performance once the drive is completely full. Dynamic controllers like Intel’s and SandForce’s will show a drop here as they use any unused (or TRIMed) space as spare area. The Indilinx Barefoot controller doesn’t appear to and thus shows no performance hit from a full drive.
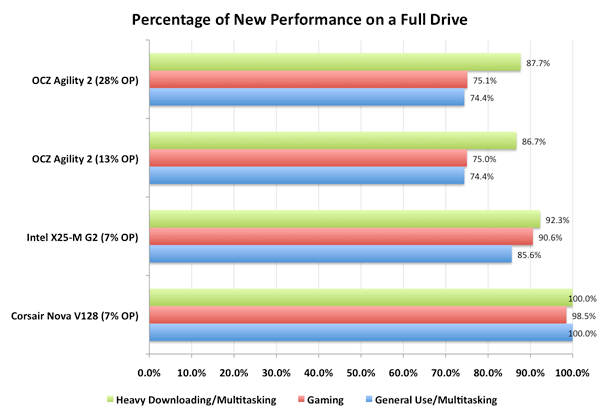
You’ll note that there’s virtually no difference between a SF-1200 drive with 13% spare area and one with 28% spare area. Chances are, most users would agree. However I’m not totally satisfied. What we want to see is the biggest performance difference a desktop/notebook user would see between a 13% and 28% overprovisioned drive. To do that we have to not only fill up the user area on the drive but also dirty the spare area as well. Another pass of our Iometer script with some random writes thrown in should do the trick. Now all LBAs on the drive should be touched as well as the spare area.
Once again, let’s look at the percentage of new performance from our very full, very dirty drive:
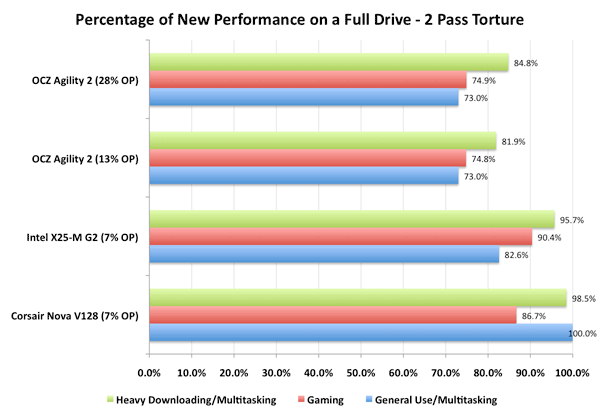
Now we’re getting somewhere. Intel’s controller actually improved in performance between the runs (at least in the heavy downloading/multitasking test), which is a testament to Intel’s architecture. The X25-M is an overachiever, it’s in a constant state of trying to improve itself.
The SandForce controller is being unfairly penalized here - most desktop workloads shouldn’t hit it with so much data that’s purely random in nature. But we’re trying to understand the worst case scenario. And there is a difference, just a very slight one. Only in the heavy downloading/multitasking workload did we see a difference between the two spare area capacities and it’s only about 3 percentage points.
Final Words
Unless I’m missing something here, it looks like SandForce can definitely improve its price/performance ratio by reducing the overprovisioning percentage on its consumer drives.
Based on current Agility 2 pricing, here’s how things could change with this new firmware:
| Pricing Comparison | |||||||
| Drive | NAND Capacity | User Capacity | Drive Cost | Cost per GB of NAND | Cost per Usable GB | ||
| OCZ Agility 2 (28% OP) | 128GB | 93.1GB | $399 | $3.117 | $4.286 | ||
| OCZ Agility 2 (13% OP) | 128GB | 111.8GB | $399 (est) | $3.117 | $3.569 | ||
| Corsair Nova V128 | 128GB | 119.2GB | $369 | $2.882 | $3.096 | ||
| Crucial RealSSD C300 | 128GB | 119.2GB | $419 | $3.273 | $3.515 | ||
| Intel X25-M G2 | 160GB | 149.0GB | $450 | $2.813 | $3.020 | ||
By moving to 13% over provisioning you drop the cost per usable GB to roughly 83% of what it is on current SF-1200 drives at virtually no impact to performance in typical workloads. It’s still not as cheap as an X25-M in terms of dollars per GB, but you are getting better performance. And the best part? It doesn’t even require a different chip - only different firmware.
If they choose to, existing SF-1200 drive manufacturers could load this firmware on their drives and give their customers more user capacity up front. It could even be a user configurable option if a manufacturer wanted to enable it. Unfortunately there's no guarantee that we'll see this made available at no extra charge. Vendors could be particularly evil and charge more for a simple change in the amount of spare area you get on a drive. I'd highly recommend against it though.
The Rest of the Tests
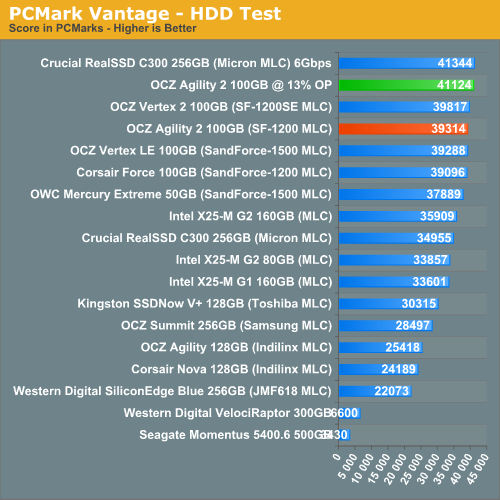
In our standard tests without unfairly penalizing the drive, the special Agility 2 performs similarly to the standard shipping drive. The only real exception is PCMark Vantage's HDD test which saw a ~4.6% increase in performance. Without knowing what other changes exist in the firmware it's difficult to pinpoint the cause. It's a little large to be normal benchmark variance so there could be other optimizations in this version of the firmware.
For those who want the standard comparison charts, I've included those results on the following pages.
I've trimmed down some of our charts, but as always if you want a full rundown of how these SSDs compare against one another be sure to use our performance comparison tool: Bench.
| CPU | Intel Core i7 965 running at 3.2GHz (Turbo & EIST Disabled) |
| Motherboard: | Intel DX58SO (Intel X58) |
| Chipset: | Intel X58 + Marvell SATA 6Gbps PCIe |
| Chipset Drivers: | Intel 9.1.1.1015 + Intel IMSM 8.9 |
| Memory: | Qimonda DDR3-1333 4 x 1GB (7-7-7-20) |
| Video Card: | eVGA GeForce GTX 285 |
| Video Drivers: | NVIDIA ForceWare 190.38 64-bit |
| Desktop Resolution: | 1920 x 1200 |
| OS: | Windows 7 x64 |
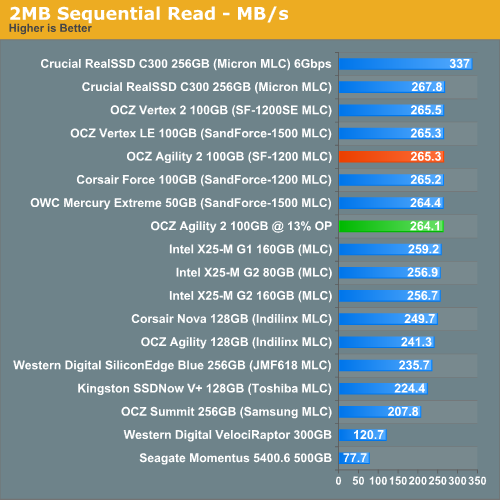
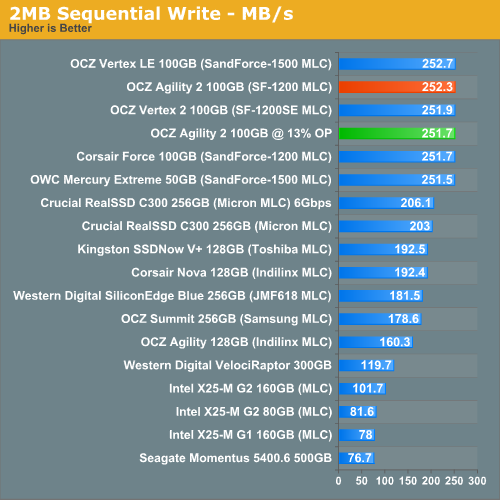
Sequential Read/Write Speed
Using the 6-22-2008 build of Iometer I ran a 3 minute long 2MB sequential test over the entire span of the drive. The results reported are in average MB/s over the entire test length:
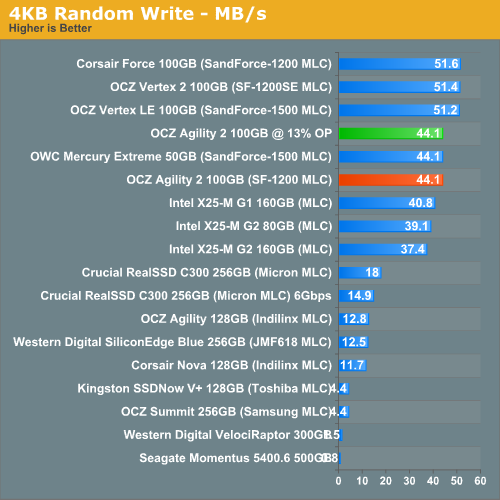
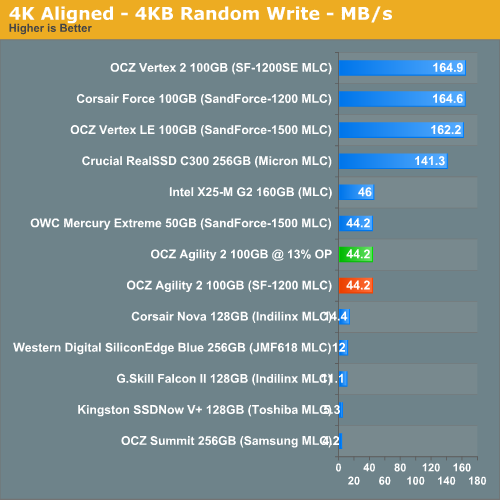
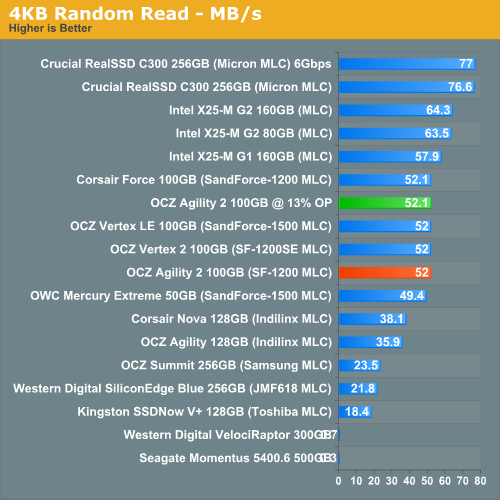
Random Read/Write Speed
This test reads/writes 4KB in a completely random pattern over an 8GB space of the drive to simulate the sort of random access that you'd see on an OS drive (even this is more stressful than a normal desktop user would see). I perform three concurrent IOs and run the test for 3 minutes. The results reported are in average MB/s over the entire time.
I've had to run this test two different ways thanks to the way the newer controllers handle write alignment. Without a manually aligned partition, Windows XP executes writes on sector aligned boundaries while most modern OSes write with 4K alignment. Some controllers take this into account when mapping LBAs to page addresses, which generates additional overhead but makes for relatively similar performance regardless of OS/partition alignment. Other controllers skip the management overhead and just perform worse under Windows XP without partition alignment as file system writes are not automatically aligned with the SSD's internal pages.
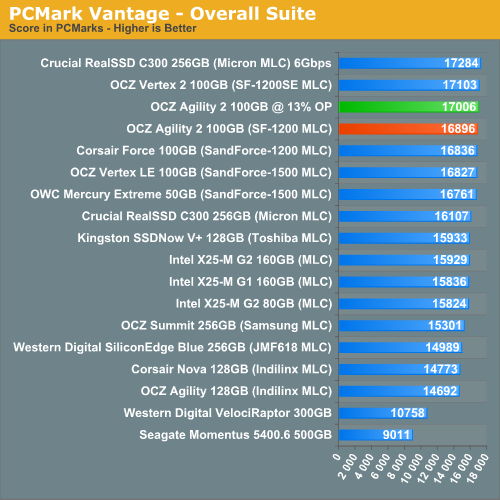
Overall System Performance using PCMark Vantage
Next up is PCMark Vantage, another system-wide performance suite. For those of you who aren’t familiar with PCMark Vantage, it ends up being the most real-world-like hard drive test I can come up with. It runs things like application launches, file searches, web browsing, contacts searching, video playback, photo editing and other completely mundane but real-world tasks. I’ve described the benchmark in great detail before but if you’d like to read up on what it does in particular, take a look at Futuremark’s whitepaper on the benchmark; it’s not perfect, but it’s good enough to be a member of a comprehensive storage benchmark suite. Any performance impacts here would most likely be reflected in the real world.
The HDD specific PCMark Vantage test is where you'll see the biggest differences between the drives:
AnandTech Storage Bench
Note that our 6Gbps controller driver isn't supported by our custom storage bench here, so the C300 results are only offered in 3Gbps mode.
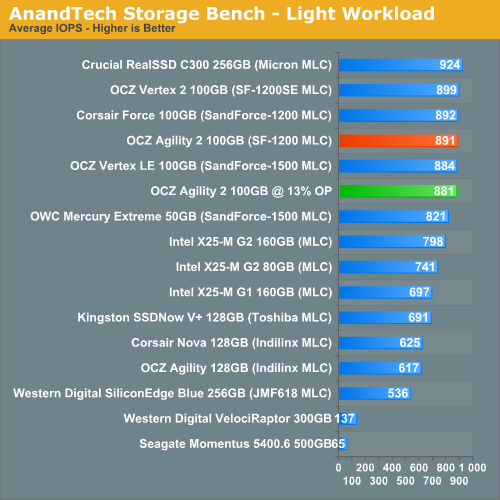
The first in our benchmark suite is a light usage case. The Windows 7 system is loaded with Firefox, Office 2007 and Adobe Reader among other applications. With Firefox we browse web pages like Facebook, AnandTech, Digg and other sites. Outlook is also running and we use it to check emails, create and send a message with a PDF attachment. Adobe Reader is used to view some PDFs. Excel 2007 is used to create a spreadsheet, graphs and save the document. The same goes for Word 2007. We open and step through a presentation in PowerPoint 2007 received as an email attachment before saving it to the desktop. Finally we watch a bit of a Firefly episode in Windows Media Player 11.
There’s some level of multitasking going on here but it’s not unreasonable by any means. Generally the application tasks proceed linearly, with the exception of things like web browsing which may happen in between one of the other tasks.
The recording is played back on all of our drives here today. Remember that we’re isolating disk performance, all we’re doing is playing back every single disk access that happened in that ~5 minute period of usage. The light workload is composed of 37,501 reads and 20,268 writes. Over 30% of the IOs are 4KB, 11% are 16KB, 22% are 32KB and approximately 13% are 64KB in size. Less than 30% of the operations are absolutely sequential in nature. Average queue depth is 6.09 IOs.
The performance results are reported in average I/O Operations per Second (IOPS):
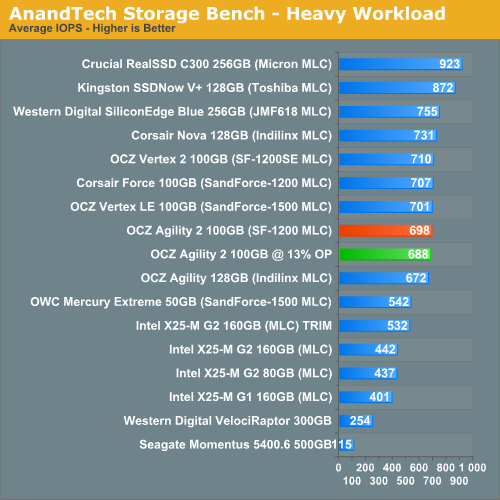
If there’s a light usage case there’s bound to be a heavy one. In this test we have Microsoft Security Essentials running in the background with real time virus scanning enabled. We also perform a quick scan in the middle of the test. Firefox, Outlook, Excel, Word and Powerpoint are all used the same as they were in the light test. We add Photoshop CS4 to the mix, opening a bunch of 12MP images, editing them, then saving them as highly compressed JPGs for web publishing. Windows 7’s picture viewer is used to view a bunch of pictures on the hard drive. We use 7-zip to create and extract .7z archives. Downloading is also prominently featured in our heavy test; we download large files from the Internet during portions of the benchmark, as well as use uTorrent to grab a couple of torrents. Some of the applications in use are installed during the benchmark, Windows updates are also installed. Towards the end of the test we launch World of Warcraft, play for a few minutes, then delete the folder. This test also takes into account all of the disk accesses that happen while the OS is booting.
The benchmark is 22 minutes long and it consists of 128,895 read operations and 72,411 write operations. Roughly 44% of all IOs were sequential. Approximately 30% of all accesses were 4KB in size, 12% were 16KB in size, 14% were 32KB and 20% were 64KB. Average queue depth was 3.59.
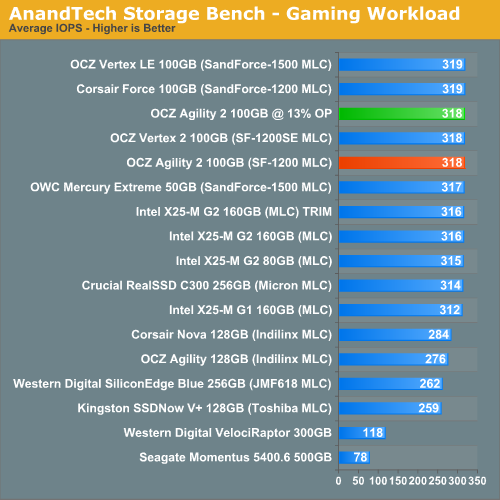
The gaming workload is made up of 75,206 read operations and only 4,592 write operations. Only 20% of the accesses are 4KB in size, nearly 40% are 64KB and 20% are 32KB. A whopping 69% of the IOs are sequential, meaning this is predominantly a sequential read benchmark. The average queue depth is 7.76 IOs.