Original Link: https://www.anandtech.com/show/2725
MultiGPU Update: Two-GPU Options in Depth
by Derek Wilson on February 23, 2009 7:30 AM EST- Posted in
- GPUs
Graphics is infinitely parallel. There is always more work that can be done, and the work can be broken up into millions of completely independent operations. This is very different than most tasks we see done on the CPU that don't scale quite as easily with the number of cores. While we might see small improvements by adding another CPU, we can see nearly double the performance by doubling the number of processors in a graphics card (as long as there are no other bottlenecks anyway). This fact is why AMD and NVIDIA have invested so much money into their respective multiGPU solutions (CrossFire and SLI respectively).
MultiGPU solutions have been around for a few years now, and while we frequently include single card multiGPU solutions in our reviews, we only occasionally take an in depth look at multiGPU technology. Some time has passed since the last time we studied the issue, and now that we've fully broken in our Core i7 system, 64-bit Vista, and recent graphics drivers, it's time to get to it.
Over the past few weeks we've been benchmarking and analyzing lots of numbers. We've looked at single, two, three and four GPU systems across multiple games and resolutions. The configurations we chose to look at are current generation high-ish end hardware capable of operation in 3-way and 4-way configurations. Because of the sheer volume of data we collected, we've decided to break up our analysis into multiple articles.
This first article (the one you're reading right now) will cover single and dual GPU configurations (including single card multiGPU hardware). The next article will add 3-way solutions along with comparisons back to single and dual GPU setups. The final article will add in 4-way performance analysis and compare it back to the single, dual and 3-way data. Splitting up the analysis this way will allow us to dive deep into each type of configuration individually without spreading the content too thin. We can keep focus on a specific aspect of multiGPU performance and scaling while still making all the relevant comparisons.
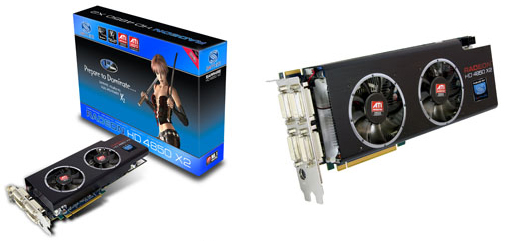
The initial installment also introduces the Sapphire Radeon HD 4850 X2 2GB. Though we expected AMD to push the 4850 X2 out in the same way they launched the 4870 X2, we've only seen one version of the 4850 X2 hit the scenes late last year from Sapphire. In light of what we've seen, we are rather surprised that we haven't seen more fanfare behind this part from either AMD or other board makers. The lighter weight X2 competes more directly in price and performance to the GeForce GTX 280/285, and really fills out the lineup for AMD. Overall, the increased RAM in the 4850 X2 2GB enables great performance scaling even at resolutions the 512MB 4850 can't come close to handling.
As for the topics we'll cover, our interest will focus on scalability of the multiGPU solutions and the relative value of the same. Before jumping into the numbers, we'll cover the metrics we use to analyze our data. First, we'll look at scaling and talk about the big picture. Then we'll talk about what we've done to calculate a value comparison.
Who Scales: How Often?
A major topic in the multiGPU arena is software support. And there are two large factors here: how many titles benefit and how much do those titles benefit. In the past we've seen SLI provide scaling more frequently and consistently than CrossFire (especially right when games come out). With CrossFire we'll often see support for older games get broken in newer drivers and then fixed when a review site happens to stumble upon the issue. But we've also noted that when CrossFire worked, it worked really well. It's honestly been a long time since we did a quantitative analysis of how SLI and CrossFire really stack up as technologies, and there's no time like the present.
First we will explore whether performance scaling happened in our suite of games. We've looked at two different metrics to judge our cards, both of which look at percent increase from 2 GPUs. If we consider the success of a multiGPU solution to be contingent on a performance improvement of at least 30% out of a possible 100%, we can count the number of times we see success in our benchmarks as a benchmark. We ran 21 different tests (7 games at 3 different resolutions), so keep that in mind when looking at this of list successes per configuration.
| NVIDIA GeForce GTX 285 | 17 |
| NVIDIA GeForce GTX 280 | 18 |
| NVIDIA GeForce GTX 260 | 20 |
| NVIDIA GeForce 9800 GTX+ | 19 |
| ATI Radeon HD 4870 512MB | 17 |
| ATI Radeon HD 4850 | 19 |
| ATI Radeon HD 4870 1GB | 16 |
Since this takes into account CPU limited cases, our higher performance SLI and CrossFire solutions will see cases where 1680x1050 or even 1920x1200 isn't a high enough resolution to allow for any real improvement. Cards that look good by this metric are ones that both scale well and start off at a low enough performance point so as to allow good scaling to happen even at lower resolutions (well, lower for multiGPU application anyway). This shows the GTX 260 and the 4850 hit a sweet spot in terms of scaling and baseline performance in modern games to provide benefit for a larger number of users (many more people have 1680x1050 and 1920x1200 than 2560x1600 monitors). Because this 9800 GTX+ is older, we see headroom here too.
If we exclude the simply CPU limited cases and look at cases where the multiGPU solution got near zero or negative performance improvement we see a slightly different picture. Our data is on a per game basis, so all of these numbers are out of 7.
| NVIDIA GeForce GTX 285 | 7 |
| NVIDIA GeForce GTX 280 | 7 |
| NVIDIA GeForce GTX 260 | 7 |
| NVIDIA GeForce 9800 GTX+ | 6 |
| ATI Radeon HD 4870 512MB | 6 |
| ATI Radeon HD 4850 | 5 |
| ATI Radeon HD 4870 1GB | 7 |
This shows cases where certain multiGPU configurations have zero value to help improve performance because of some failing of the graphics solution. All these cases happen to be issues at 2560x1600 where the resolution proved too much to handle because of the limited amount of onboard RAM.
It's also important to point out that the Sapphire 4850 X2 doesn't suffer from the problems of the 4850 CrossFire we show here. The Sapphire card scales and performs well in every test we ran.
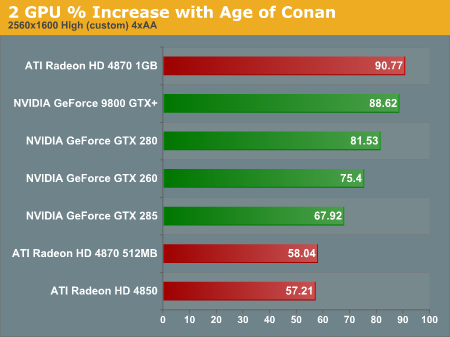
Who Scales: How Much?
To calculate this scaling data, we simply looked at percent performance improvement of two cards over one. With perfect scaling we would see 100%, while no improvement is 0% and a negative performance improvement means that the multiGPU solution actually produced worse numbers than the single card. There's a lot of data here, so we'll break it down a bit before we present it all.
It is possible to see more than 100% scaling in some tests for different reasons. Fluctuations in benchmark performance can contribute to just over 100% situations, and some times optimizations to enable better multiGPU performance can cut some work out enabling higher performance than would otherwise have been possible. In one of the cases we test today we have a situation where single GPU performance is limited at some framerate while multiple GPUs aren't hindered by the same limit. This artificially inflates the scaling percent.
When looking at games that scale overall, we end up seeing both Radeon HD 4870 configurations (512MB and 1GB) performing worse than we expected. Granted, the 4870 1GB looks better if we only take 2560x1600 into account, but even then the Radeon HD 4850, GeForce GTX 260 and GTX 280 beat out the 4870 1GB in terms of average performance improvement (when performance improves). When we add in CPU limited cases, the 4870 cards look even worse. Consistently, most of the ways we attempted to analyze the magnitude of performance improvement (averages, geometric means, per game, across games where call cards scaled, etc.), the Radeon HD 4850 and GeForce GTX 260 (and sometimes the GTX 280) did pretty well, while the Radeon HD 4870 cards came in pretty low on the list with the 1GB often looking worse because it hit harder CPU limits at lower resolutions.
Hitting CPU or system limits does speak more to value than desirability from a performance standpoint, but it's still important to look at all the cases. Configurations with lower baseline single GPU performance will have more headroom to scale, but these might not always scale enough to be playable even if they scale well. So it's important to take both value and absolute performance data into account when looking at scaling.
We've put all this data on our benchmark pages with the performance data to make it easier to see in context. There just isn't one good way to aggregate the data or we would talk about it here. Depending on the type of analysis we try to do, we could present it in ways that favor AMD and NVIDIA and since there really isn't a "correct" way to do it we've decided to just present the data per game and leave it at that.
Calculating Value: Performance per Dollar
Have you ever wondered what you get for your money? Well, I suppose that's a silly question, as anyone reading this page could guess. There are a couple of ways to present this data, and we wanted something simple to understand. It is important to remember that the way we've presented this information, absolute performance is not accounted for at all: the only metric we are looking at on this page is how much you get for the money you spend. Keep in mind that a good deal on 25 frames per second might not be what you are after: absolute performance is important too and we'll be looking at that in the next section. In general, more expensive solutions perform higher, so even if there is lower "value" the performance increase could be worth it to some buyers.
We will be using these prices for this calculation.
| NVIDIA GeForce GTX 285 SLI | 700 |
| NVIDIA GeForce GTX 280 SLI | 630 |
| NVIDIA GeForce GTX 260 SLI | 400 |
| NVIDIA GeForce 9800 GTX+ SLI | 290 |
| NVIDIA GeForce GTX 295 | 500 |
| NVIDIA GeForce GTX 285 | 350 |
| NVIDIA GeForce GTX 280 | 315 |
| NVIDIA GeForce GTX 260 core 216 | 225 |
| NVIDIA GeForce GTX 260 | 200 |
| NVIDIA GeForce 9800 GX2 | 300 |
| NVIDIA GeForce 9800 GTX+ | 145 |
| ATI Radeon HD 4850 X2 | 290 |
| ATI Radeon HD 4870 512MB CrossFire | 350 |
| ATI Radeon HD 4850 CrossFire | 290 |
| ATI Radeon HD 4870 X2 | 440 |
| ATI Radeon HD 4870 1GB | 220 |
| ATI Radeon HD 4870 512MB | 175 |
| ATI Radeon HD 4850 | 145 |
These prices were gathered from newegg.com and google and do NOT include mail-in rebates.
Our method here is to look at the performance you get for every hundred dollars spent. Specifically this answers the question: how many fps do you get in a specific game for every hundred bucks you spend on a particular graphics card. To calculate this data, we divided our performance data in average framerate by the cost of the card and then multiplied the result by 100. This isn't really a number that means something tangible: it's more just a metric that helps us relate the value of cards within a specific test. You can't compare any of these numbers between games, or even between resolutions, except in terms of relative order -- you need to look at one test and one resolution at a time.
To help out, if all the cards in a test had a score of "10", that would mean for every hundred dollars you spend you get 10 frames per second of performance in our test. Of course, though our value chart shows all the cards on equal footing, more expensive cards will have proportionally higher performance: if you wanted 30 frames per second in that specific benchmark you would need to spend at least $300.
So this isn't the bottom line in what to buy. These benchmarks are an indication of relative value outside absolute performance. Absolute performance is also a value metric: higher performance is more valuable and may be disproportionally more valuable if it crosses a playability threshold. These graphs will help show how much of a premium or a deal you are paying or getting on your absolute performance relative to other parts.
In general, multiGPU solutions will show less "value" than single GPU counterparts because we see less than linear scaling. If a two card solution costs twice as much while performance scales at less than 2x, we'll see a lower "value" result. The single card multiGPU options have a better chance at improving value than two card solutions, as they can sometimes be found for less than twice the cost of their nearest single card single GPU derivative.
The Test
The test system is our high end Core i7 system using the 3-way capable ASUS Rampage II Extreme. This same platform is used in our 3 and 4 GPU tests as well.
| Test Setup | |
| CPU | Intel Core i7-965 3.2GHz |
| Motherboard | ASUS Rampage II Extreme X58 |
| Video Cards | ATI Radeon HD 4870 X2 Sapphire ATI Radeon HD 4850 X2 2GB ATI Radeon HD 4870 512MB CrossFire ATI Radeon HD 4850 CrossFire ATI Radeon HD 4870 1GB ATI Radeon HD 4870 512MB ATI Radeon HD 4850 NVIDIA GeForce GTX 295 NVIDIA GeForce GTX 285 SLI NVIDIA GeForce GTX 280 SLI NVIDIA GeForce GTX 260 SLI NVIDIA GeForce 9800 GTX+ SLI NVIDIA GeForce 9800 GX2 NVIDIA GeForce GTX 285 NVIDIA GeForce GTX 280 NVIDIA GeForce GTX 260 core 216 NVIDIA GeForce GTX 260 NVIDIA GeForce 9800 GTX+ |
| Video Drivers | Catalyst 8.12 hotfix ForceWare 181.22 |
| Hard Drive | Intel X25-M 80GB SSD |
| RAM | 6 x 1GB DDR3-1066 7-7-7-20 |
| Operating System | Windows Vista Ultimate 64-bit SP1 |
| PSU | PC Power & Cooling Turbo Cool 1200W |
Age of Conan Analysis
While we continue to wait on the DirectX 10 version of Age of Conan, our DX9 tests go on. As we've seen in the past, this game tends to favor AMD hardware.
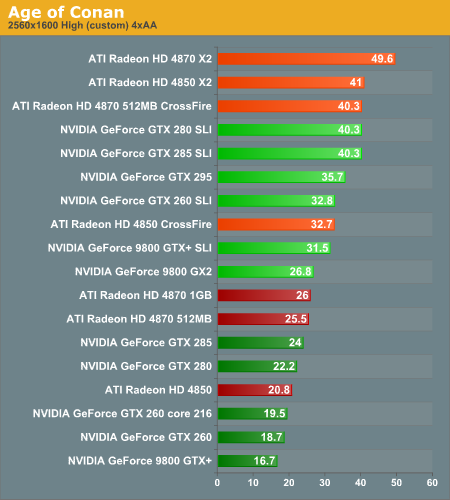
1680x1050 1920x1200 2560x1600
Single cards stack up with AMD on top and the Radeon HD 4850 in competition with the GTX 260 cards. With the exception of 2560x1600, the two card 4850 CrossFire setup competes with GTX 280 SLI. The single card Sapphire 4850 X2 2B (with 1GB of RAM per GPU) fairs better at 2560x1600 than its two card counterpart.
1680x1050 1920x1200 2560x1600
Our performance per dollar metrics show AMD single cards up near the top, but the 4850 X2 2GB shows lots of value and very high performance all the way up to the highest resolutions. The combination of pure performance and value of the Sapphire card is very impressive in this benchmark.
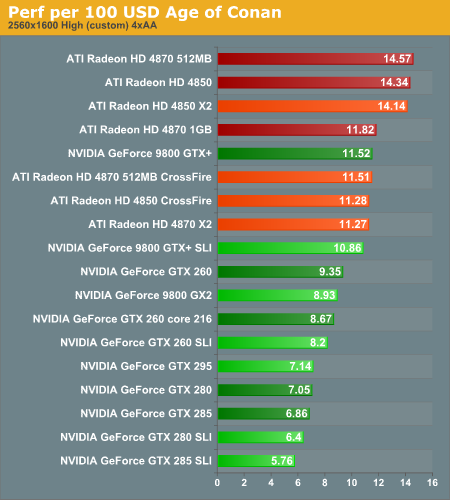
1680x1050 1920x1200 2560x1600
At 1680x1050, any of our graphics cards will do just fine with the settings we used. At 1920x1200, gamers will want at least a GeForce GTX 280 or one of the Radeon HD 4870 variants. Running smoothly at 2560x1600 with the highest settings requires a multiGPU configuration, and even the 9800 GX2 just doesn't have enough power to make the grade. At the highest resolution, our price/performance metrics show every CrossFire solution to have higher value than every SLI solution.
Call of Duty World at War Analysis
This game, as with previous CoD installments, tends to favor NVIDIA hardware. The updated graphics engine of World at War, while looking pretty good, still offers good performance and good scalability.
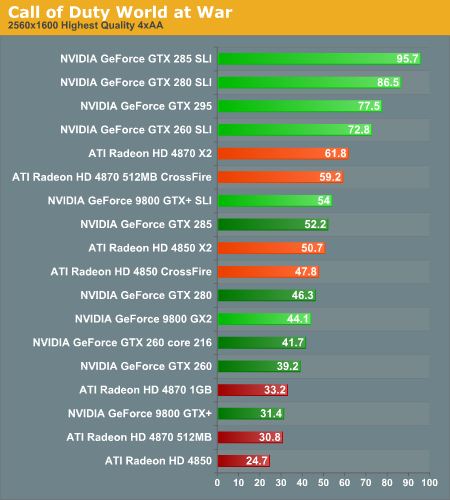
1680x1050 1920x1200 2560x1600
In this test, even though we disabled the frame rate limit and vsync, single GPU solutions seem limited to around 60 frames per second. This is part of why we see beyond linear scaling with more than one GPU in some cases: it's not magic, it's that single card performance isn't as high as it should be. We don't stop seeing artificial limits on single GPU performance until 2560x1600.
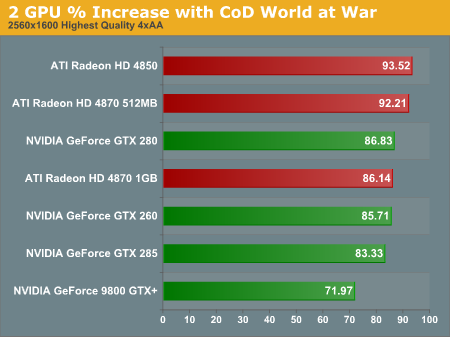
1680x1050 1920x1200 2560x1600
SLI rules this benchmark with GT 200 based parts coming out on top across the board. This game does scale very well with multiple GPUs, most of the time coming in over 80% (the exception is the 9800 GTX+ at 2560x1600). At higher resolutions, the AMD multiGPU options do scale better than their SLI counter parts, but the baseline NVIDIA performance is so much higher that it really doesn't make a big practical difference.
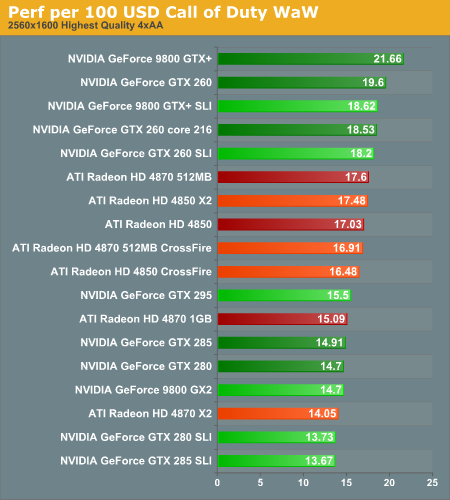
1680x1050 1920x1200 2560x1600
In terms of value, the 9800 GTX+ (at today's prices), leads the way in CoD. Of course, though it offers the most frames per second per dollar, it is a good example of the need to account for both absolute performance and value: it only barely squeaks by as playable at 2560x1600.
Because we see very good performance across the board, multiple GPUs are not required even for the highest settings at the highest resolution. The only card that isn't quite up to the task at 2560x1600 is the Radeon HD 4850 (though the 4870 512MB and 9800 GTX+ are both borderline).
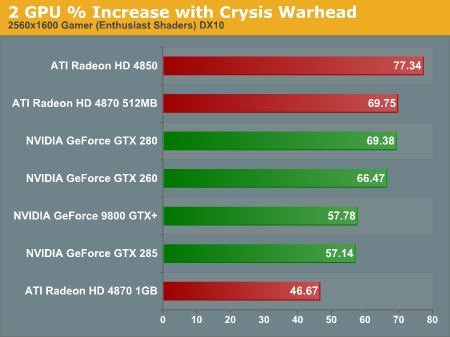
Crysis Warhead Analysis
Crysis Warhead, the sequel to the original that follows the same story from a different perspective, does a great job of improving on the Crysis engine in terms of balancing performance and improving playability with a still-forward-looking engine (though we lack the native 64-bit runtime of the original game). We push the settings pretty high in spite of the fact that we don't turn them all the way up. Everything is set to "Gamer" quality with the exception of Shaders which are set to "Enthusiast" level.
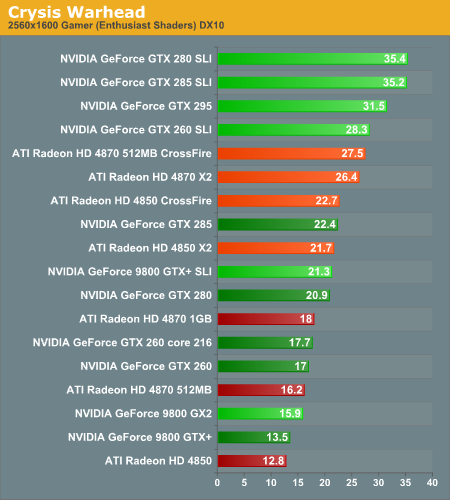
1680x1050 1920x1200 2560x1600
Like CoD, Crysis favors NVIDIA hardware. The settings we're rocking require more than a single Radeon HD 4850 or GeForce 9800 GTX+ even at 1680x1050, so it's likely that many gamers will be running at lower settings than these. As with CoD, SLI sweeps this benchmark in terms of performance. The Radeon HD 4870 CrossFire pushes up against the GeForce GTX 260 SLI setup, but the core 216 or an overclocked GTX 260 setup would easily put some distance between them.
1680x1050 1920x1200 2560x1600
In terms of scaling, SLI looks better at lower resolutions while CrossFire puts the heat on as resolution increases. Despite the fact that the 4850 scales at over 77% (which is very good), the higher baseline of the NVIDIA cards keeps this from making the impact that it could. At the same time, configurations with two 4850 cards perform on par with the GTX 285 and offer much better value.
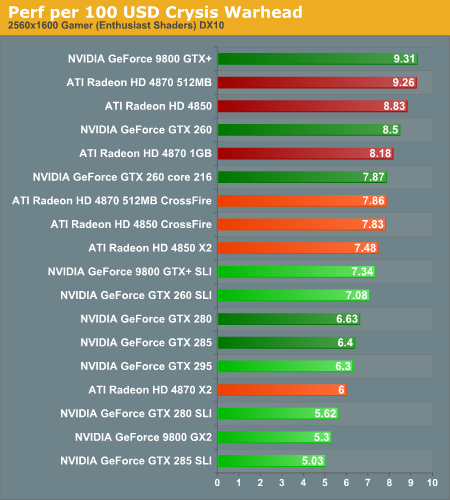
1680x1050 1920x1200 2560x1600
Our performance data and our value data show that in this case, AMD's approach to single card multiGPU on the high end is effective. The 4850 X2 2GB can be had from newegg for less than $300 which is more than $50 cheaper than a single GPU NVIDIA solution that gets you the same performance where it counts.
It's interesting to note that AMD two card solutions tended to scale better than the single card multi-GPU options here. Where memory is a limiter, we see our higher memory single card options scaling better. In this case, it looks like memory isn't as large a bottleneck as something else. We can't say for certain, but our guess is that it's the PCIe bus: with both cards getting a full x16 slot, each GPU is able to communicate more efficiently with the host and it seems that this is beneficial to Crysis performance.
At 1920x1200, the only single card solutions that remain playable are the GTX 280 and GTX 285. Getting good performance on a 30" monitor requires either a GTX 295 or 2x GTX 280/285s. Nothing else passes the test at the highest resolution we tested.
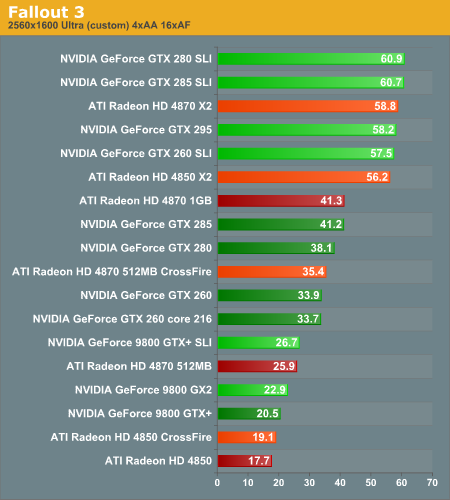
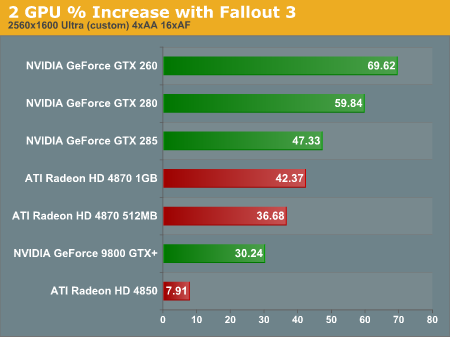
Fallout 3 Analysis
Try as we might, Fallout 3 performance is very limited by LOD optimizations. We tweaked the .ini files as much as we could to make performance GPU limited, but we just shifted maximum performance down across the board. This is similar to how Oblivion behaved with single card solutions, but this time even multiGPU solutions are affected. It's not a failing of the game, as we do recommend turning on vsync and (if possible) triple buffering when gaming; it just makes testing "goodness" of a graphics card more difficult.
1680x1050 1920x1200 2560x1600
None of our single GPU options hits the frame limit, which does help. Everything runs fine at 1680x1050 and all the multiGPU options are essentially equivalent in performance at this resolution. Moving up to 1920x1200, we see a similar situation, but the 9800 GX2 starts to fall off a bit. Luckily 2560x1600 offers us a better look at what cards stand up when really pushed by Bethesda's modified Gamebryo engine.
Graphics memory becomes a factor at high resolution, and the multiGPU options with only 512MB per card tank in performance. Both 9800 series options and the 4870 512MB / 4850 CrossFire options drop off sharply in performance. This leaves the 4870 X2 and 4850 X2 solutions in competition with the latest and greatest from NVIDIA at the top of the heap. It's clear that the highest end NVIDIA parts have more headroom still, but unfortunately this test won't reveal everything they can do. The 4850 X2 2GB and GTX 260 SLI do drop a little off the frame limit, but the drop isn't hugely consequential.
1680x1050 1920x1200 2560x1600
Scaling data is horrible here because of the limited framerate. Basically, rather than looking at how much better two cards perform, the metric is how slow the single card is. Thus the best scaling we see in this game comes from the 9800 GTX+ and the 4850 until we hit 2560x1600. When we start to finally get a glimpse of real scaling in Fallout 3, the GT200 based NVIDIA cards definitely take the cake.
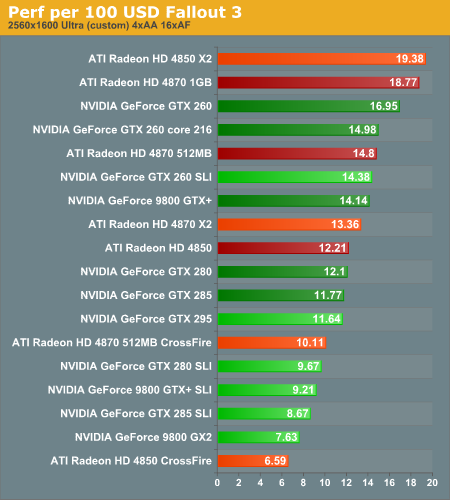
1680x1050 1920x1200 2560x1600
In terms of value, the frame limit also hurts multiGPU solutions because despite the increased cost, you can only squeeze so much performance out of the hardware. Once again, we note though that the 4850 X2 has very good value and good performance especially compared to the single GTX 280 and 285.
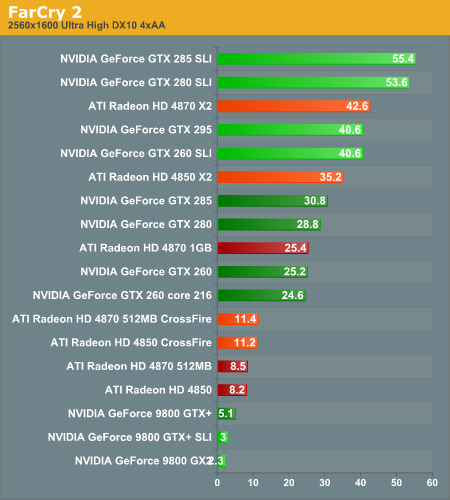
FarCry 2 Analysis
FarCry 2 is a good looking game with a well rounded graphics engine. We use the benchmark tool and a custom demo to test with ultra high graphics options while we try to minimize CPU impact.
1680x1050 1920x1200 2560x1600
Relative performance stays very consistent from 1680x1050 to 1920x1200 but looking at 2560x1600 tells a different story. Anything with 512MB of RAM just tanks in performance at the highest resolution. CrossFire and SLI can't help these lower memory parts keep up either. Even at lower resolutions it seems like the G9x based NVIDIA hardware just can't handle FarCry 2 very well at all. This make the 4850 a much better option than the 9800 GTX+.
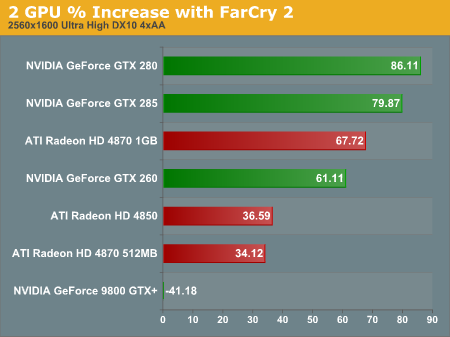
1680x1050 1920x1200 2560x1600
As for scaling, SLI does really well with GT200 based cards and not so well with the 9800 GTX+. CrossFire scaling is very consistent between 1680x1050 and 1920x1200. Everything drops in scaling at 2560x1600 though. We expect that this is because of the increased memory and bandwidth requirements from the higher res.
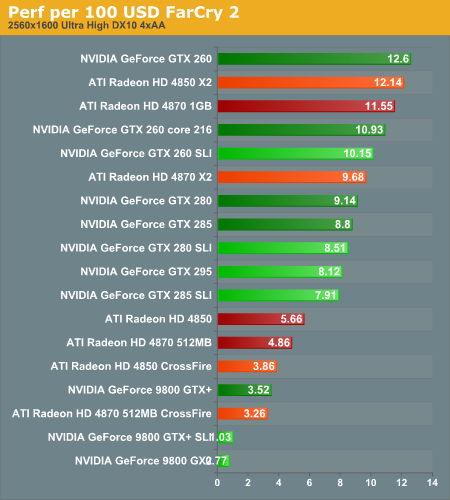
1680x1050 1920x1200 2560x1600
Performance per dollar reveals the GTX 260 and GTX 260 SLI as the only NVIDIA options with value that competes with AMD solutions below 2560x1600. At the highest resolution, because of the memory limited performance issues, the value of our 512MB ATI cards drop to near the bottom of the heap. The Radeon HD 4850 X2 2GB is consistently high in value here and remains playable across all resolutions.
The settings we chose leave the G9x based parts (even in SLI) and the Radeon HD 4850 unplayable even at 1680x1050. Radeon HD 4870 level hardware and above can achieve the highest visual quality at the lowest res we tested. Pushing up, the 512MB 4870 drops a bit too much in performance to recommend at 1920x1200. The 1GB version of the 4870 holds on to playability and leads the GTX 260 core 216. At 2560x1600, the only single GPU option that barely gets by is the GTX 285. CrossFire and SLI (as long as the cards have more than 512MB of RAM) seem to have enough under the hood to run at the highest settings and resolution.
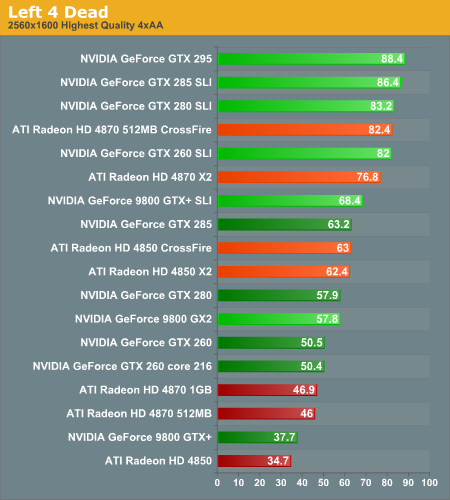
Left 4 Dead Analysis
Based on Valve's Source engine, Left 4 Dead can run fairly smoothly with any card we tested at any resolution with the maximum settings. The game is definitely not bad looking either, so getting playable framerates on the Radeon HD 4850 at 2560x1600 is no small feat. We do test with a custom demo that makes use of a heavy swarm of zombies in an outdoor area, and though the performance impact is as heavy as we could make it in our benchmark, it may still be possible to hit situations where the lowest end cards stutter with lots of enemies around at very high resolution.
1680x1050 1920x1200 2560x1600
At 1680x1050 and 1920x1200, CrossFire and single ATI cards tend to do better than their NVIDIA counterparts. The GTX 295 does hang out near the top, though. Oddly, the 9800 GTX+ SLI does better than GT200 2 card solutions. If it were just the single card GTX 295 that performed better than the two card options, we would speculate that there was some bus bandwidth or latency issue that caused problems, but it seems that there's something else limiting the performance of the NVIDIA GT200 SLI options. Of course, with the high framerates we see, we aren't exactly complaining. We recommend turning on triple buffering for this game to both eliminate tearing and minimize the input latency possible when just enabling vsync.
1680x1050 1920x1200 2560x1600
Performance at 2560x1600 shirts the playing field putting SLI and CrossFire on more equal footing. While NVIDIA's GTX 260 options lead the competing 4870 class options, the 4850 does very well against its competition. There are no real disappointments with this game and any multiGPU solution though.
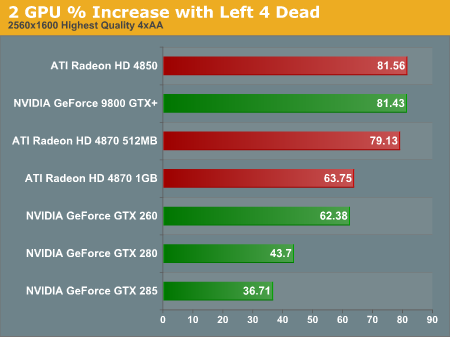
When it comes to scaling, at lower resolutions we see CPU/system limited performance affecting the improvement possible with multiple GPUs. The 9800 GTX and 4850 are the only cards that see any real improvement at 1680x1050, and it's not even that much better at 1920x1200. Moving up to 2560x1600 we finally see most of the players above 50% scaling. The exceptions are the fastest single GPU configurations in this test: the GTX 280 and GTX 285.
1680x1050 1920x1200 2560x1600
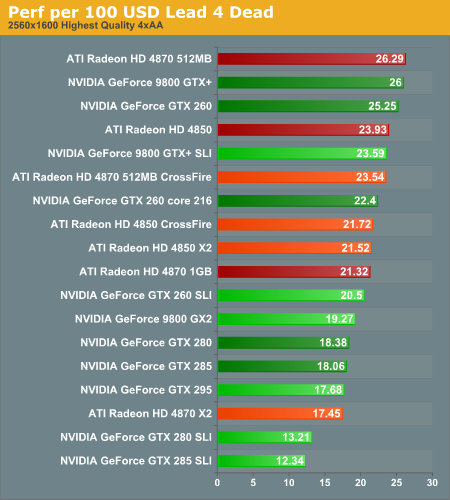
Between the two "low" resolutions we test, there's no change in the value lineup even though there are shifts in the performance lineup. At these resolutions, multiGPU options tend not to be a good investment because of the CPU/system limit issue. The exception are the 4850 CrossFire and 9800 GTX+ SLI because of the fact that the single card options are GPU limited and we see better scaling for the money with two GPUs. At higher resolution, value compresses more and the 4870 1GB drops in value while NVIDIA hardware pushes up a bit.
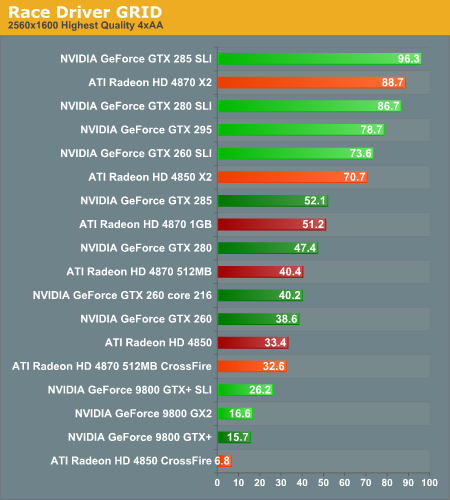
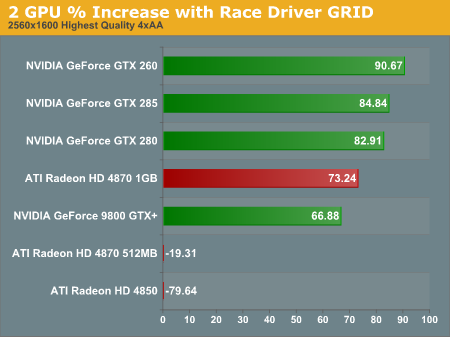
Race Driver GRID Analysis
This game can really hammer graphics memory at high resolution, but in general performance is very good with GRID across the board. This is a short FRAPS test on a straight section of track at the beginning of a race from the back of the pack.
1680x1050 1920x1200 2560x1600
All cards are playable below 2560x1600 with ultra quality settings in GRID. Moving up in resolution really benefits from more than 512MB of RAM, especially with multiGPU options. 9800 GTX+ SLI, the 9800 GX2, 4870 512MB CrossFire and 4850 CrossFire really tank in performance with the two ATI solutions even providing a negative "improvement." We'd love to see ATI and NVIDIA detect negative performance impact from multiGPU systems and automatically revert to a single GPU, but it's clear from today's tests that neither NVIDIA nor ATI have anything like that going on.
At 2560x1600, any single GPU except for the 9800 GTX+ can handle 2560x1600. We strongly recommend cards with more than 512MB of memory for running at this resolution though, as navigating the menu suffers quite dramatically inspite of playable performance on the track.
1680x1050 1920x1200 2560x1600
We see really good performance scaling in this game, especially from NVIDIA hardware. From 77% to 100% scaling at 1680x1050 and mid to high 80% scaling for 1920x1200 is very imprssive. The best AMD can muster under 2560x1600 is 69% scaling with the 4850. Of course, AMD single GPU options do provide higher performance than their competition from NVIDIA, but the scaling advantage does help the case for SLI here. Looking at 2560x1600, the two 512MB CrossFire options tank completely and 4870 1GB scaling increases to over 73%. SLI still looks better here with 82% to 90% scaling on GT200 based parts. The 9800 GTX+ still scales, but it's low memory and already low single card performance at 2560x1600 make it not a viable solution.
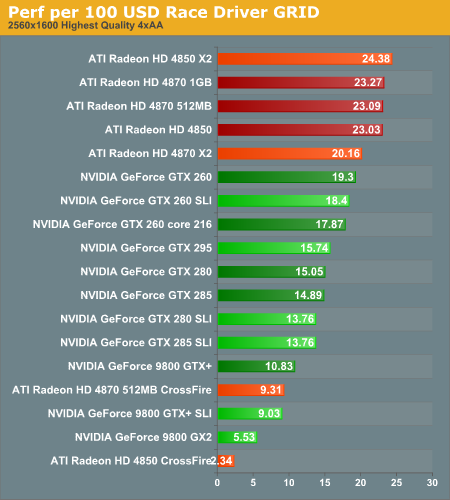
1680x1050 1920x1200 2560x1600
All this translates to our value data as well. Single GPU AMD solutions live up near the top of the chart at all resolutions, while SLI doesn't drop off in value as much as CrossFire (though CrossFire, because of the higher baseline performance and lower cost, tends to accumulate more value than SLI). The 9800 GTX+, because of it's low cost and high scaling, is the exception posting good value numbers for NVIDIA until we hit 2560x1600 (at which point it drops way off).
Power Consumption
All these results are taken at the wall (total system power) running the 3dmark Vantage POM (parallax occlusion mapping) shader test. This test uses very little other system resources and focuses on the GPU. This means that the numbers you see here are LOWER than total system power while playing a game -- often by more than 50W and sometimes 100W, depending on the game, benchmark and system. These numbers show clearer differences between GPU power draw, which is why we stick with them. These numbers should NOT be used to determine a proper PSU for a certain graphics card solution unless you consider a couple hundred watts of headroom in your calculation.
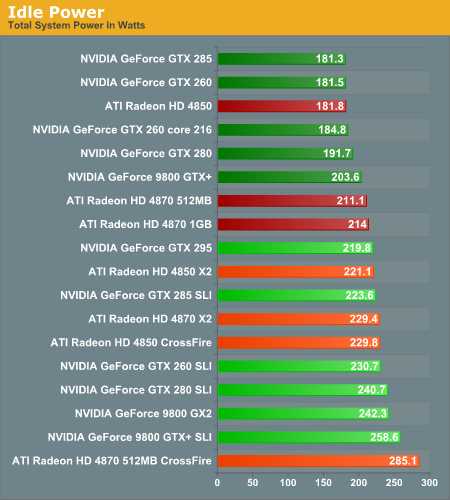
For idle power, NVIDIA's 55nm GT200 parts take the cake. We don't have a 55nm GTX 260 in house, but we would expect it's idle power to come in on par or lower than our GTX 285. AMD's 4850 hangs with the lower power NVIDIA options, but both the 512MB and 1GB 4870 variants pull more power than any of our other single GPU solutions.
For multiGPU options, SLI definitely draws the most power. The X2 single card multiGPU options are better than the two card solutions, and this carries over to NVIDIA as well with the GTX 295 coming in at lower power than 2x GTX 260s. If we had tested two 1GB 4870 cards, we would expect to see more than 285W power draw at idle, which is quite high indeed.
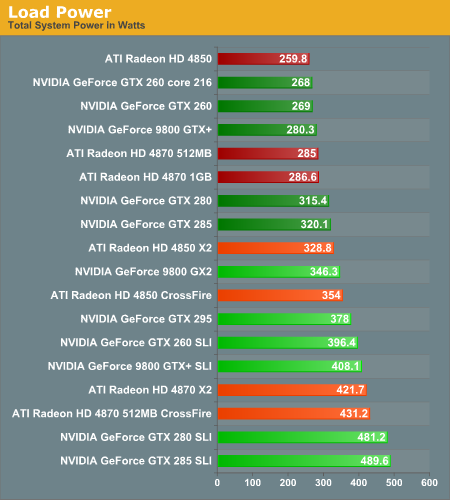
Things change up a bit when we explore load power draw. The lowest idle power parts end up drawing the most power under load. The additional draw of the GTX 280 and GTX 285 are not unexpected as they offer a typically higher level of performance for their power. All our multiGPU options do draw more power than all of our single GPU configurations, so, though we didn't calculate them, you can expect performance per watt advantages where ever a single GPU leads any multiGPU option in performance.
Final Words
There is quite a bit of data here today, and it can be a little bit daunting to sort through. In every test but one, GeForce GTX 285 SLI leads the way in performance. Often the GTX 280 SLI pops up next. That's surprising considering the fact that AMD doesn't have as heavy hitting a single GPU part. And it also doesn't take into account the fact that these two solutions often come in very low in the "value" lineup and not that much higher in performance than something like the Radeon HD 4870 multiGPU options or even the GeForce GTX 295.
The cheaper Radeon HD 4870 X2 often does better than the GTX 295, and often multiGPU AMD options have better value than the highest end single GPU options from NVIDIA. But the real stand out has to be the Sapphire Radeon HD 4850 X2 2GB. This unique card really shined and held it's own all the way up to 2560x1600. While a 1GB 4850 might not make much sense (the extra RAM only really helps at resolutions where the 4850 can't keep up in terms of processing power), the 1GB of RAM per GPU on the 4850 X2 2GB really helps make this single card multiGPU option high end.
The Sapphire 4850 X2 costs less than a single NVIDIA GTX 280 or 285, and performs better than these as well. While the Radeon HD 4870 X2 is viable as high end single card multiGPU option, it competes at a price point beyond NVIDIA's high end. the 4850 X2 really puts pressure on anything that costs between $300 and $400 from the competition. It's very surprising to us that AMD hasn't pushed this configuration and that Sapphire are the only manufacturer to have put one of these out there.
In general, more than one GPU isn't that necessary for 1920x1200 with the highest quality settings, and the Radeon 4870 1GB or an overclocked GeForce GTX 260 core 216 are good options there. Slower single cards are fine for the high quality at 1680x1050 and multiGPU options are basically wasted at this resolution and lower except in Crysis. As we've seen in past tests, only those with 30" monitors will really benefit from multiple GPUs in their system for now. Of course, there are value-add technologies like PhysX and hopefully sooner rather than later OpenCL will attract more developers to GPU computing. But when were talking multiple graphics cards for rendering it's really not worth it without the highest resolution around.
If you want to break it down, the only NVIDIA single GPU solutions we really recommend as an option are the GeForce GTX 260 variants and/or SLI which are on par with the Radeon 4870 512MB and 1GB depending on the games we chose to test. Really the decision comes down to which games you prefer to play and what features you want. Buying a single GPU solution for more than $300 doesn't make sense with the efficiency of the 4850 X2, and the prices on higher performance multiGPU solutions make them a tough sell really. The GTX 285 SLI is the performance leader, but the cost is just huge.
As we mentioned, this is the first of a series of articles that will explore multiGPU performance. The next article will tackle 3-way SLI and 3-way CrossFireX options. The goal is to extend this look into the 3-way realm, looking at scaling from 1 to 3 and from 2 to 3 cards in a system along side pure performance and value. While this will use much of the same data we've looked at today, the focus will be on 3-way and whether or not it has any real practical use.
While we've already seen 2 GPU performance data, we hope that this more in-depth look than usual helps to illustrate the playing field a bit better. AMD (with the help of Sapphire) really has succeeded at their goal of making single card high end options that compete well with NVIDIA's high end single cards. While the Radeon HD 4870 X2 does compete well with the GeForce GTX 295, the 4850 X2 2GB does a great job of offering higher performance than NVIDIA single GPU options and much more bang for your buck at a price point right below the GTX 280.
Our one caveat with AMD remains driver issues. We are happy with Catalyst 9.2 as it competes with the 8.12 hotfix in terms of stability and performance (and it offers more multiGPU support for recently released games). NVIDIA's GeForce GTX 260 core 216 offers good competition for AMD, and driver support issues don't do AMD any favors. Drivers are even more important when it comes to SLI and CrossFire. SLI enjoys much better support from NVIDIA than CrossFire does from AMD. Because of AMD's driver issues, we often have to wait when new games come out to enjoy proper CrossFire scaling with them. And when hotfixes come out it takes more than a month (usually more like two) to fully integrate changes into a WHQL driver. This is quite disappointing and is really the only strike against the Radeon HD 4850 X2 2GB which is in every other way terrific competition for NVIDIA's lineup.
Sometimes you don't get what you pay for, and with less than linear scaling we do see a reduced value from multiple card solutions. Sometimes getting playability at a higher resolution makes this reduced "value" worth it. Sometimes, CPU and system limits can also reduce value for more than one GPU. And sometimes, like in the case of the Sapphire 4850 X2 2GB, we see a single card that costs the same as two separate lower spec'd (in this case lower memory) parts and can therefore offer great scaling and incredible value.
Stay tuned to see how three cards changes the landscape.


