Original Link: https://www.anandtech.com/show/2337
Foxconn MARS: God of War Performance?
by Gary Key on September 21, 2007 12:00 PM EST- Posted in
- Motherboards
Foxconn has been around for several decades and is one of the largest manufacturers of electronics components in the world. They have provided motherboards for a multitude of OEMs in the past, but it has only been more recently that they started to offer their boards in the retail market. Given their OEM provider roots, it's not too surprising that the initial Foxconn motherboards failed to cater to the enthusiast community.
Over time, Foxconn worked to correct this perception, and they released several motherboards using their "WinFast" branding that attempted to cater to this market. Unfortunately, as we stated in previous reviews, merely saying a product has "extreme performance" does not make it so. However, their first real amends to the performance oriented crowd occurred with their excellent C51XEM2AA motherboard based on the NVIDIA nForce 590 SLI chipset in the spring of 2006. That is an eternity in the PC business and after several attempts at wooing buyers with the "CORE" series of motherboards last year they are back again with a new series; more importantly, though, they now seem to have a general understanding of the target market this time around.
Foxconn is in the process of launching their new Quantum Force product line that will focus on the enthusiast users looking for product that excels in price/performance ratios while offering the latest technology. This all sounds very familiar to most of our readers, as this is an area where competitors like abit, ASUS, DFI, Gigabyte, and MSI have been offering distinctive products for several years.
However, for Foxconn, this is truly a new experience for the company and marks (hopefully) the end of an era where words on a box were thought to make a product perform better. Also, Foxconn will be launching a specific website for the Quantum Product series shortly that will feature online product registration, access to beta BIOS downloads, forums, tutorials, and competitions designed for computer enthusiasts. Foxconn is also very interested in user feedback for these new products, and the engineers working on the products will be involved in the forums.
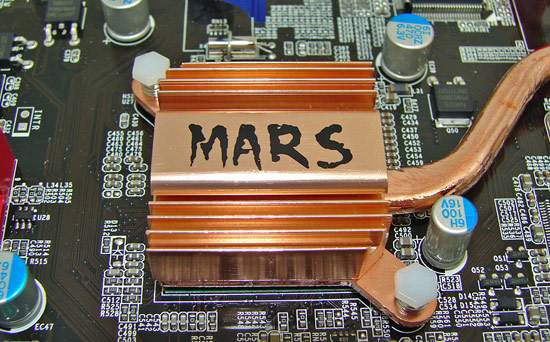
The first product in the Quantum Series is the Intel P35-based Foxconn MARS motherboard that will soon be followed with an X38-based product. The history buffs will already know this, but for the rest of us, MARS was best known as the Roman God of War. In early Roman history, Mars was the Roman god of spring, fertility, and vegetation while being the protector of cattle, fields, and boundaries. Mars is also considered a chthonic god (earth-god) and this helps to explain why he became a god of death and eventually the god of war. The month we know as March (Martius) is named after him and his Greek equivalent is the god Ares.
While the box art is interesting, it reminds us of two Andy Warhol inspired Spartans jousting and not the Crested Helmet MARS usually depicted in battle. But enough Roman Mythology - and yes, we left out a few details - we are here today to find out if the Foxconn MARS board represents the spirit and performance of the God of War, or if it's a better representation of the earlier God that spent his days protecting cattle. With that in mind, let's take a first look at what Foxconn has designed and will soon deliver to the performance sector.
Foxconn MARS: Board Layout and Features
 |
| Click to enlarge |
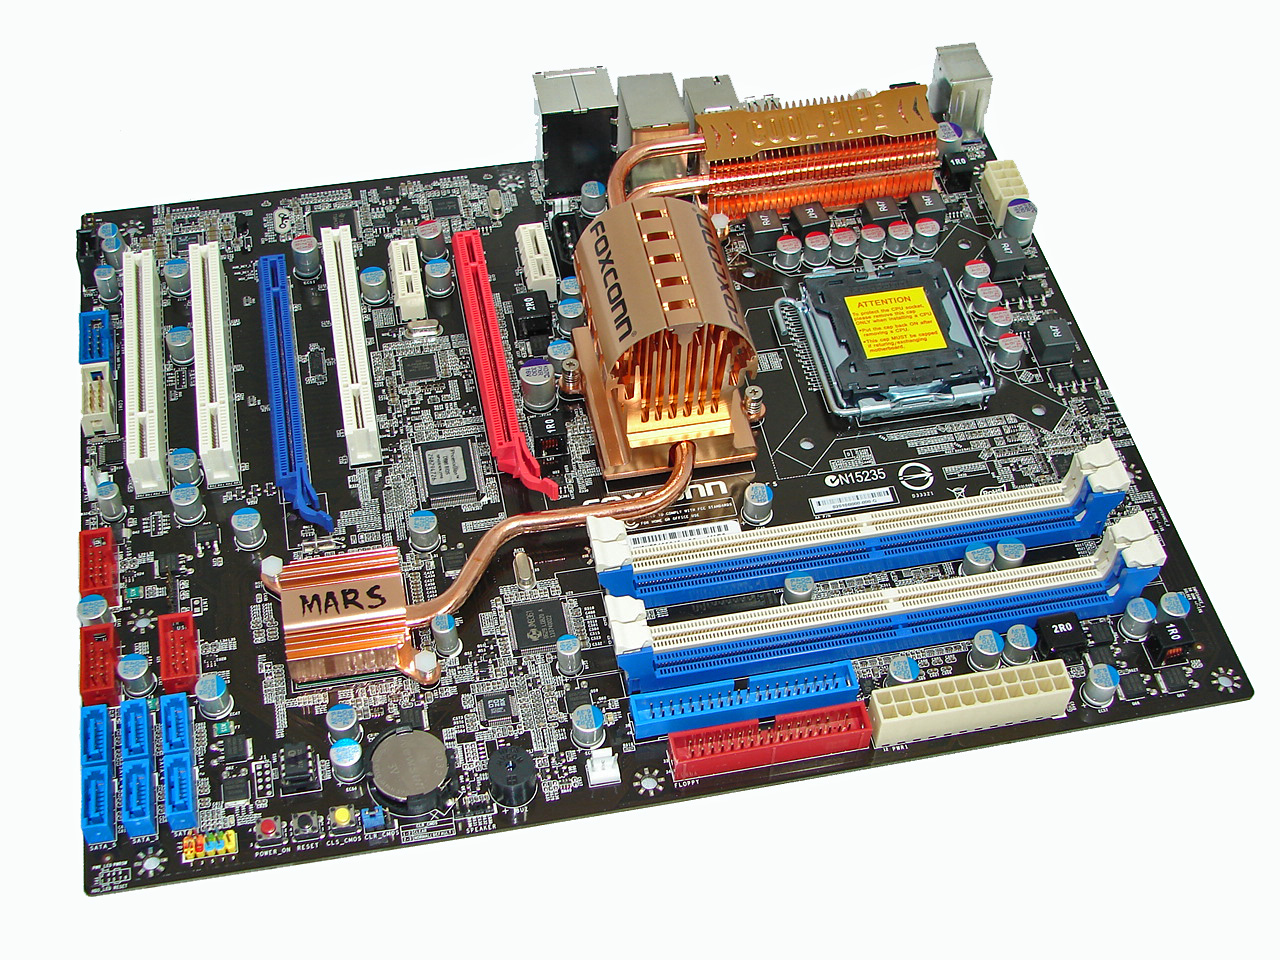
We have to admit that Foxconn spent some time on the layout of this board, although the color scheme is more reminiscent of an American July Fourth celebration than the dark black and blood red colors on the box and documentation materials. In fact, other than the Foxconn name, the black board and cooling arrangement almost seems more like an ASUS product, which certainly isn't a bad thing if they can provide that level of performance. The board was a snap to install in our Antec P180 and Cooler Master 830 cases with most connections easily reached. The board features a six-phase voltage regulator system and six-layer PCB and provided excellent stability throughout testing. The Foxconn MARS features 100% use of Conductive Polymer Aluminum Solid Capacitors.
The board comes with a total of five fan headers (1 x 4-pin, 4 x 3-pin) that provided a nice balance of cooling options. The CPU, Northbridge, and System fans can be individually controlled via the BIOS and the Foxconn Aegis program within Windows. Each header type has the option of Full Speed, Duty-Cycle, and Smart Fan settings within the BIOS. The System Header setting controls the three system fans as a group and not individually. Foxconn also provides a snap-on fan for the Northbridge heatsink that provides additional cooling, and the fan is almost whisper quiet. However, this fan cannot control temperatures properly when the Northbridge voltage was set over 1.7V, so additional cooling will be required if you are heavily overclocking the system.
 |
| Click to enlarge |
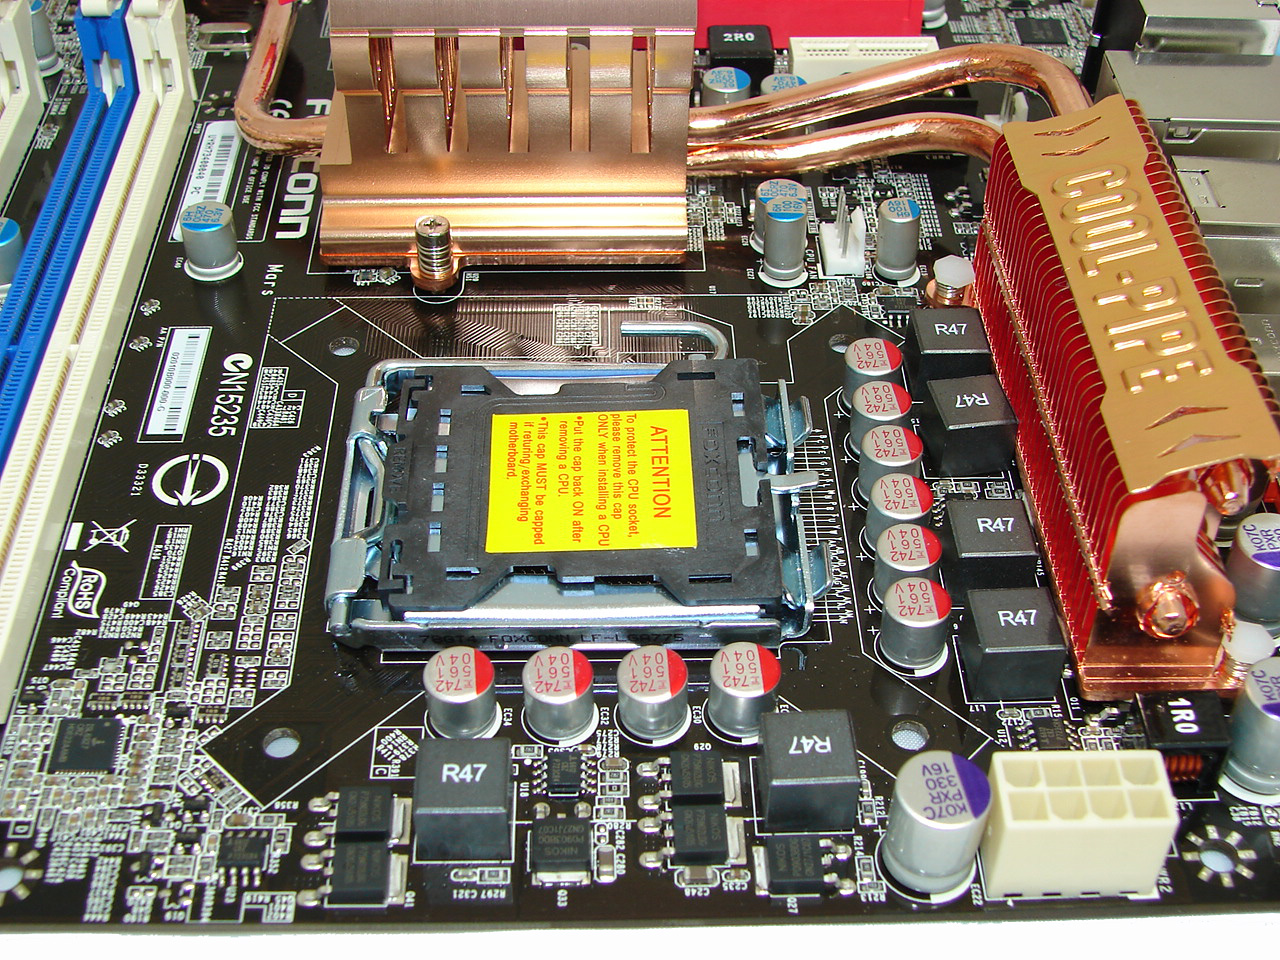
Around the CPU socket area, we find an ample amount of room for the majority of cooling solutions. We utilize the stock heatsink/fan in our base testing but also install several aftermarket Socket-775 cooling solutions such as the Tuniq 120 and Thermalright Ultra 120 eXtreme during our overclocking tests. However, based upon our initial overclocking tests, if a vertical mounted fan in an air cooling unit such as the Tuniq 120 or water-cooling is utilized then additional air cooling will be required on the MCH and PWM areas. In other words, the cooling seems to be designed with the use of a downward blowing CPU HSF fan in mind.
The 8-pin ATX power connector is located on the edge of the board behind the PS/2 keyboard port and did not interfere with our various cooling units. The Cool-Pipe heat system can easily be removed if you wish to water cool the MCH/ICH chipsets. The only problem during testing is that the Cool-Pipe logo plate adhesive failed and allowed the right section of the plate to slowly bend upwards. Foxconn confirmed they will be using a different adhesive for the production boards.
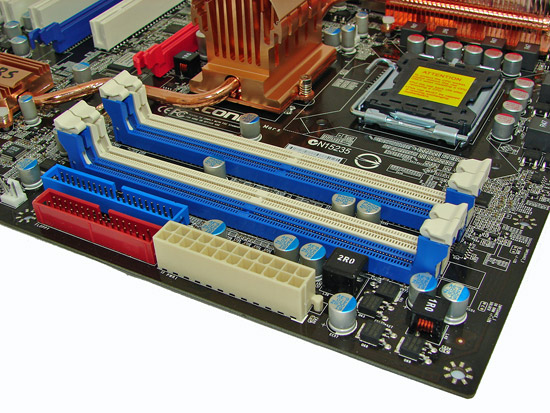
The DIMM module slots' color coordination is correct for dual channel setup based upon the premise of installing DIMMs in the same colored slots for dual-channel operation. Installing memory modules will be not be a problem with a full size video card placed in the first PCI Express x16 slot.
The 24-pin ATX power connector is located on the edge of the board along with the floppy drive and IDE connectors. The first system fan header is located to the left of the floppy connector. We suggest installing the IDE cable before the memory and floppy drive cable if you plan on a four DIMM memory configuration.
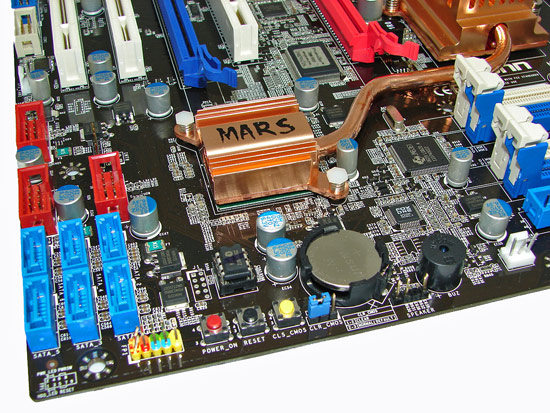
We found the positioning of the six blue ICH9R SATA ports to be excellent when utilizing the expansion slots, as they are out of the way of most longer cards (i.e. graphics cards). The ICH9R chipset is passively cooled and remained fairly cool to the touch throughout testing, although temperatures did increase with a CrossFire setup. Right above the SATA ports are three red connectors for the additional USB ports and the second system fan header.
In a nod to those users who run their systems on an open platform or get tired of hooking up the chassis panel connections, Foxconn has added power on, reset, and clear CMOS buttons on the board. These buttons have always been useful for us and should be standard on any board in this market segment. Of course a POST Code Debug LED would have been nice but we won't complain... well, not too loudly anyway.
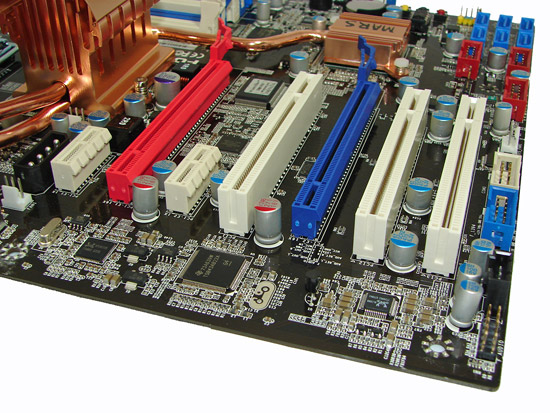
The board comes with two physical PCI Express x16 connectors (1 x16, 1 x4 electrical), two PCI Express x1 connectors, and three PCI 2.2 connectors. The second PCI Express x1 and PCI slots will be blocked by a dual slot graphics card. Several cards we tried in the first PCI Express x1 slot also had a tight fit with a dual slot graphics card installed. When utilizing CrossFire on this board, the two PCI Express x1 slots will be disabled by the BIOS. However, we highly recommend using a 975X or the upcoming X38 chipset for CrossFire as our upcoming comparison article will show. A 4-pin 12V Molex connector is to the left of the first PCI Express x1 slot and should be used for CrossFire operation.
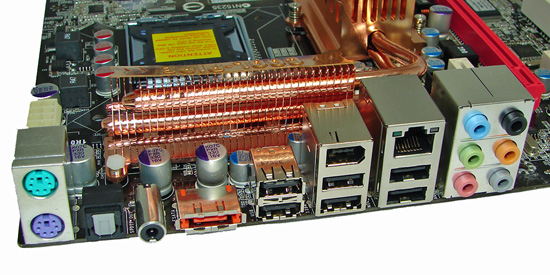
The rear panel contains the standard PS/2 mouse and keyboard ports. The panel also includes an RJ-45 LAN port with activity indicator lights, six USB ports, and optical/coaxial out S/PDIF ports. The audio panel consists of six ports that can be configured for 2, 4, 6, and 8-channel audio connections for the Realtek ALC888 HD codec. Finally, there is an eSATA port along with an IEEE 1394 port, providing a wide array of connection options on the rear panel.
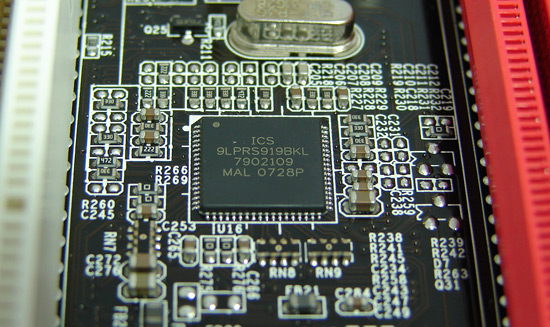
Foxconn utilizes the ICS 9LPRS919BKL clock control chipset on this board and the latest version of SetFSB works with it.
Foxconn MARS Specifications
| Foxconn MARS P35 | |
| Market Segment | Mid-Range Enthusiast - $199.99 (estimated MSRP) |
| CPU Interface | Socket T (Socket 775) |
| CPU Support | LGA775-based Core 2 Duo, Core 2 Extreme, or Core 2 Quad recommended |
| Chipset | Intel P35 (MCH) Northbridge and ICH9R Southbridge |
| Front Side Bus Speeds | Auto, 100 ~ 999 in 1MHz increments |
| Memory Speed DDR2 | Auto, Six Ratios |
| PCIe Speeds | 100MHz - 255MHz |
| PCI Speeds | Synch, 33.33MHz, 37.3MHz, 42.0MHz |
| Core Voltage | Auto, 0.8250V to 1.6000V in .0125V increments |
| Core Voltage Multiplier | 1.00 ~ 1.296, results in 2.0736V CPU Core Max |
| CPU Clock Multiplier | 6x ~ 11x, downward adjustable for Core 2, upward to 50 for Extreme |
| DRAM Voltage DDR2 | Auto, 1.665V ~ 3.365V in various increments |
| DRAM Timing Control | SPD, Manual - 14 DRAM Timing Options |
| DRAM Command Rate | Auto, 1N, 2N |
| NB Voltage | Auto, 1.156V ~ 2.395V in various increments |
| SB Voltage | Auto, 1.388V ~ 1.950V in various increments |
| Memory Slots | Four 240-pin DDR2 DIMM Slots Dual-Channel Configuration Regular Unbuffered DDR3 Memory to 8GB Total |
| Expansion Slots | 2 - PCIe x16 (1 - x16, 1 - x4 electrical) 2 - PCIe x1 3 - PCI Slot 2.2 |
| Onboard SATA/RAID | 6 SATA 3Gbps Ports - ICH9R (RAID 0,1, 10, 5) 1 eSATA 3Gbps Port - JMicron JMB361 |
| Onboard IDE | 1 ATA133/100/66 Port (2 drives) - JMicron JMB361 |
| Onboard USB 2.0/IEEE-1394 | 12 USB 2.0 Ports - 6 I/O Panel - 6 via Headers 2 Firewire 400 Ports by TI TSB43AB22A - 1 I/O Panel, 1 via Header |
| Onboard LAN | Realtek RTL8111B - PCIe Gigabit Ethernet contoller |
| Onboard Audio | Realtek ALC888 - 8-channel HD audio codec |
| Power Connectors | ATX 24-pin, 8-pin ATX 12V, 4-pin 12V |
| I/O Panel | 1 x PS/2 Keyboard 1 x PS/2 Mouse 1 x eSATA 2 x SPDIF - Optical Out, Coaxial Out 1 x IEEE 1394 1 x Audio Panel 1 x RJ45 6 x USB 2.0/1.1 |
| Fan Headers | 5 - (1) CPU, (4) Chassis |
| Fan Control | CPU and Chassis Fan Control via BIOS, monitoring/control via Aegis |
| Auto Overclocking | 5% ~ 75%, in 5% increments |
| BIOS Revision | P03 |
| Board Revision | v1.00 |
The Foxconn MARS is designed with an enthusiast user in mind with an emphasis on BIOS features for those interested in overclocking the system. Foxconn provides the standard laundry list of board options such as the JMicron JMB361 chipset for eSATA and IDE support, IEEE 1394 support from TI, decent onboard audio support from the Realtek ALC888, 12 USB ports, Intel Matrix RAID, and Gigabit LAN support from the ubiquitous Realtek RTL8111B.
The board offers a very good mix of expansion slots although utilizing a CrossFire setup will create the physical loss of a PCI Express x1 and PCI 2.2 slot. The third PCI Express x16 slot operates at x4 electrically and can be utilized for various other PCI Express cards including RAID controllers or a second video card. However, note that the use of CrossFire in this system will negate the use of the two PCI Express x1 slots, both physically and electrically.
Foxconn MARS BIOS Overview and Software Features
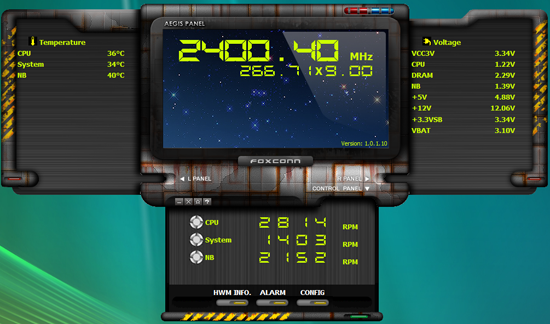
Foxconn provides their new Aegis software with the MARS board, which allows the monitoring of several system functions and the ability to control the Northbridge, CPU, and System fan headers. The application worked well during testing and provided accurate feedback on temperatures and voltages. Foxconn plans on a major update to the program in late October that will add on-the-fly overclocking features.
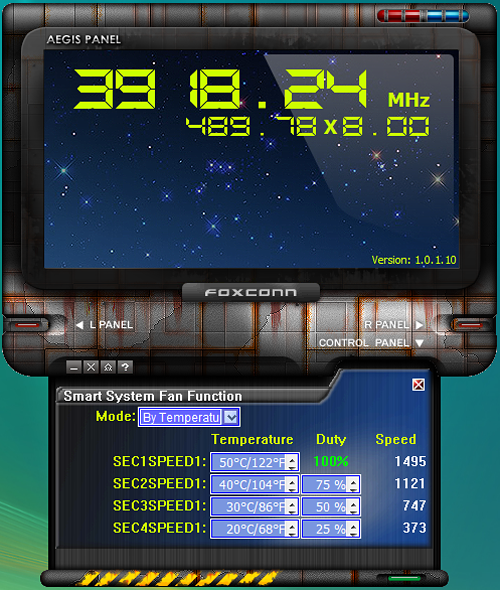
Fan control is very good, although it falls just short of abit's excellent uGuru setup. The Aegis application allows you to set four different modes: Full Speed, Duty Cycle, Temperature, and Smart Fan for each header type. Depending on the mode you set, several options are available for tuning the fan speed. The three System Fan headers all operate off the same set of options and are not individually controlled.
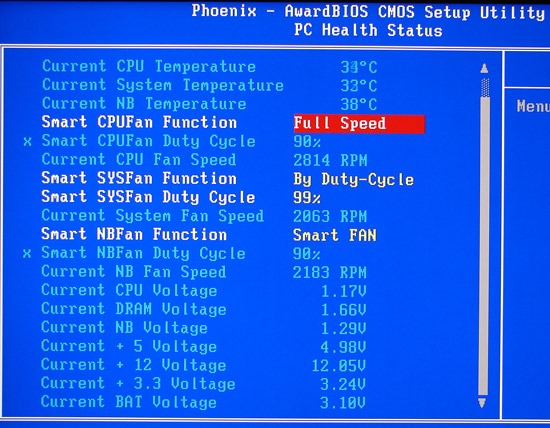
Foxconn monitors the CPU, System Fan, and Northbridge fan speeds and voltage readings within the BIOS. Fan control is fairly extensive with three different modes available within the BIOS settings. The Aegis software does provide the additional temperature controlled setting, however.
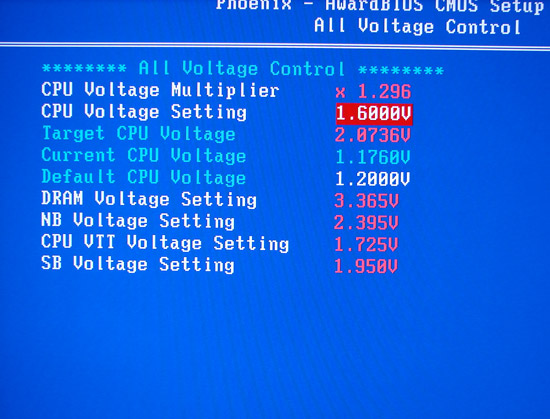
The available voltage control options are fairly standard with the only interesting selection being the CPU voltage multiplier option that allows additional voltage tuning with a maximum setting of 2.0736V. In fact, for a board that prides itself on overclocking options, we expected additional voltage options.
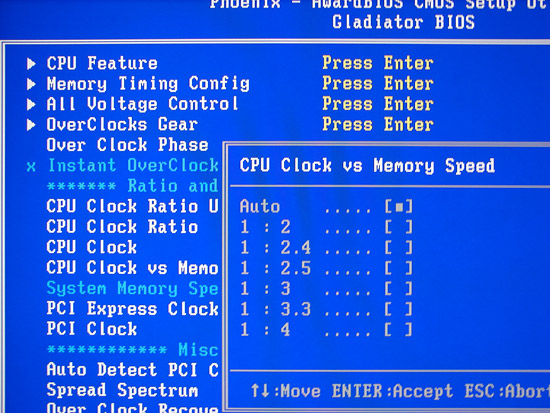
Foxconn dubs their BIOS Gladiator, and it contains the standard overclocking options that one might see on the typical enthusiast board from ASUS, Gigabyte, and MSI. Although not as extensive as the typical DFI enthusiast board, the options are fairly extensive with the notable exception being the inability to control the FSB Strap settings.
Although not shown, the Overclocks Gear section contain the Profile settings and Foxconn allows up to four different profiles to be saved. Also, the BIOS offers an automatic overclock option that features percentage-based overclocking from 5% to 75%. The system worked well with most of our processors up to 30%; after that, the automatic voltages and memory settings would usually result in a non-POST situation. Fortunately, the recovery system never failed or required a clear CMOS action, but as usual higher overclocks are possible for those willing to manually tweak settings. Still, a 30% overclock without any particular effort is quite good.
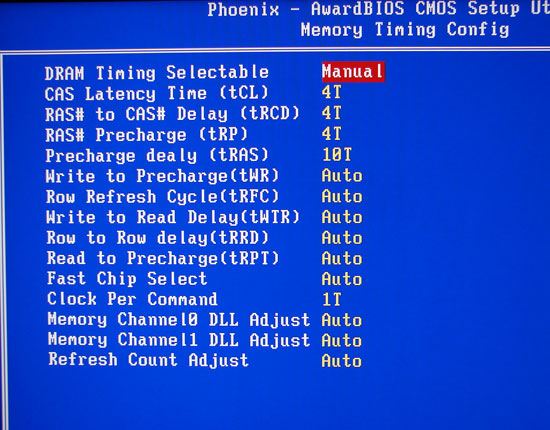
The BIOS offers 14 different memory configuration options and generally always utilized the memory SPD settings at a given clock speed if the DRAM timing was set to SPD or auto when in manual mode. Although the Clock per Command is listed at 1T or 2T, it is actually called 1N or 2N on the Intel chipset and works differently than the 1T/2T command rates on the AMD chipsets. 1N is generally equivalent to a 1.5T type performance level at this time. We will go into this further in an upcoming overclocking-centric article.
Test Setup
| Foxconn MARS P35 Testbed | |
| Processor | Intel Core 2 Quad Q6600 Quad 2.4GHz, 2x4MB Unified Cache, 9x Multiplier, 1066FSB |
| CPU Voltage | 1.200V Stock |
| Cooling | Thermalright 120 Extreme |
| Power Supply | OCZ 1000W |
| Memory | Corsair Twin2x2048-10000C5DF |
| Memory Settings | 4-4-4-12 (DDR2-1066) |
| Video Cards | MSI HD X2900 XT 512MB |
| Video Drivers | ATI Catalyst 7.9 |
| Hard Drive | Western Digital 7200RPM 750GB SATA 3/Gbps 16MB Buffer |
| Optical Drives | Plextor PX-B900A, Toshiba SD-H802A |
| Case | Cooler Master Stacker 830 Evo |
| BIOS | P.03 |
| Operating System | Windows Vista Home Premium 32-bit |
| . | |
Test conditions are maintained the same, as much as possible, over the platforms tested. Our game tests are run at settings of 1280x1024 HQ to ensure our MSI HD 2900XT is not the bottleneck during testing. All results are reported in our charts and color-coded for easier identification of results.
We selected the Intel Core 2 Quad Q6600 as our processor of choice since it represents one of the better price to performance values in the midrange processor market and is the CPU we will concentrate on in future reviews. We are utilizing Microsoft Vista Home Premium 32-bit as our operating system along with a 4GB memory configuration. Even though Vista 32-bit cannot take advantage of the entire 4GB of memory address space (3.326GB), we found the additional 1.278GB of memory available provides improved performance during multitasking events and gaming. We would not recommend anything less than 2GB with Vista Home Premium. Additional testing was completed with 2x2GB and 4x2GB modules and we will show results once the board is released.
We utilize new drive images on each board in order to minimize any potential driver conflicts. Our 3DMark results are generated utilizing the standard benchmark resolution for each program. We run each benchmark five times, throw out the two low and high scores, and report the remaining score. All results at stock speeds for this article are with memory timings at 4-4-4-12 (DDR2-1066). Where possible, memory sub-timings are set exactly the same to ensure consistency between the boards.
Our choice of software applications to test is based on programs that enjoy widespread usage and produce repeatable and consistent results during testing. Microsoft Vista has thrown a monkey wrench into testing as the aggressive nature of the operating system to constantly optimize application loading and execution presents some interesting obstacles. This along with what we still see as a lack of driver maturity continue to present problems with benchmarking. Our normal process is to change our power settings to performance, delete the contents of the Prefetch folder, and then reboot after each benchmark run. This results in better consistency over the course of benchmark testing. All applications are run with administer privileges.
Memory Testing and Overclocking
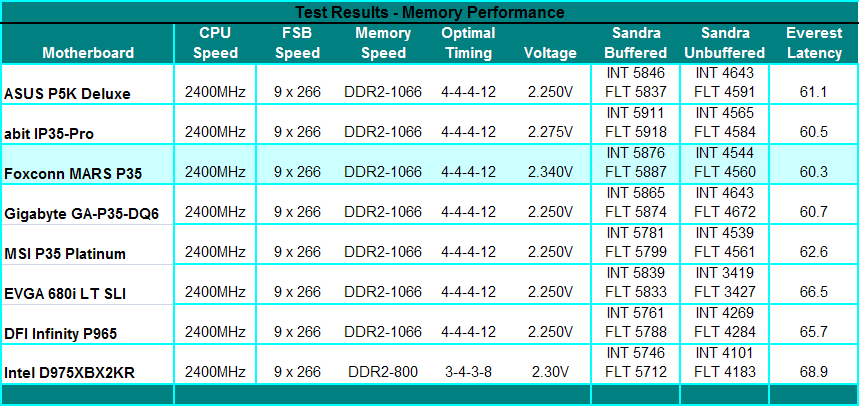 |
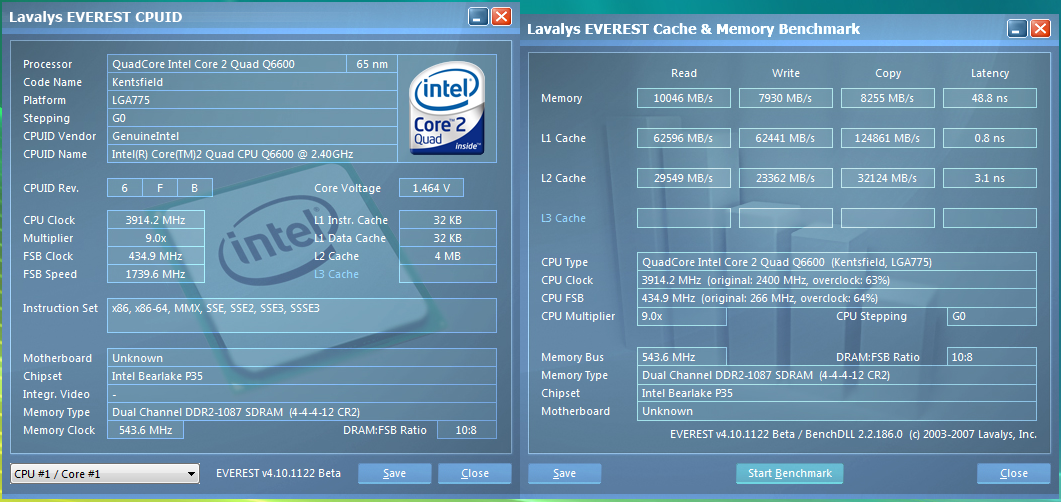
The Foxconn MARS has the best latency scores of our test units, but the Sandra unbuffered scores are around 2% lower than the ASUS and Gigabyte boards. Foxconn sets very aggressive performance level settings in their current BIOS along with slightly looser sub-timings than the other boards.
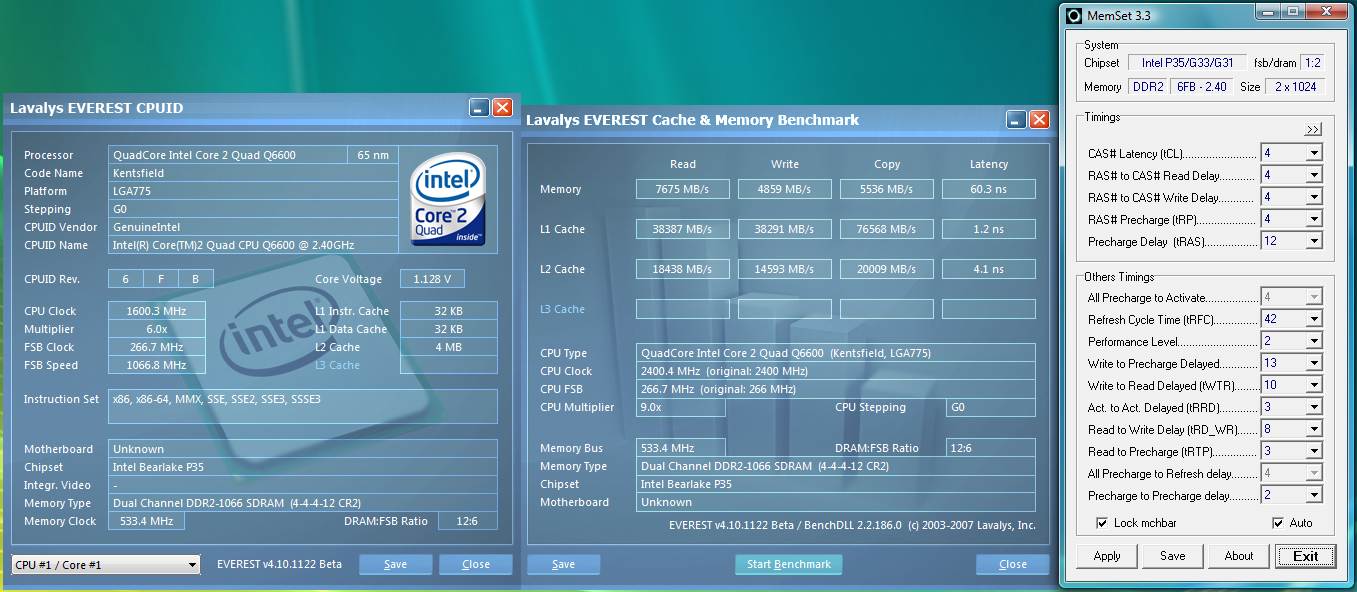
Q6600 9x266:
 |
Q6600 9x435:
 |
 |
Q6600 8x490:
 |
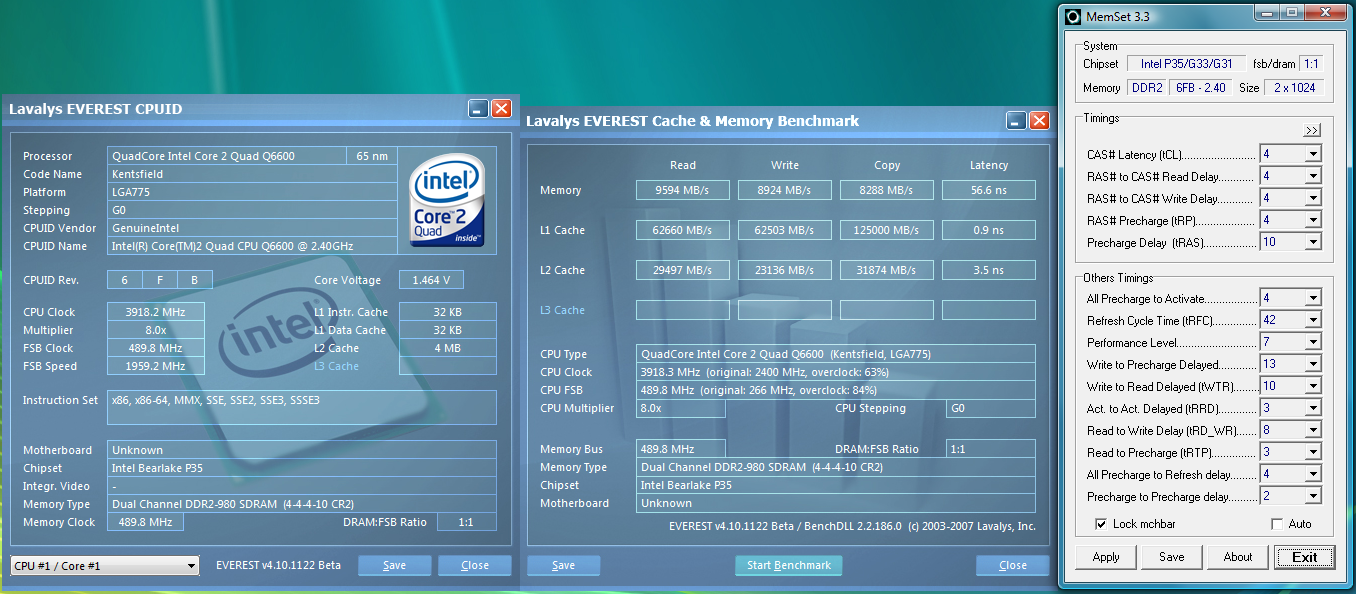 |
In the Q6600 overclocking results, the top screenshot is the system running on the 266 strap with a final 9x435 setting with the CPU at 3.914GHz and memory at DDR2-1086. The bottom screenshot is on the 333 strap resulting in a final 9x480 setting with the CPU at 3.918GHz and memory at DDR2-979. We will go over the performance results in a separate overclocking article once the BIOS is final. Our opinion continues to be that tight chipset and memory latencies are better than FSB wars at the expense of performance. Having both would be ideal but it is very difficult to attain at this point, particularly with quad-core CPUs.
Running the CPU on the lower strap with increased memory throughput results in improvements of latency at 14% and reads at 4%; however, write performance favors the 8x490 setup by 12%. Application results favor the 9x435 setting due to better latencies and throughput. Both settings require the same voltages with the CPU at 1.4875V, Northbridge at 1.898V, CPU VTT at 1.575V, and memory at 2.340V. Vdroop was excellent with an average drop around .02V~.04V with this particular CPU. We have seen Vdrop/Vdroops as high as .06V with our QX6850.
E6550 7x495:
 |
 |
We were able to reach a final FSB setting of 495 with our E6550. The MARS board seems to be limited to around 450FSB when running the 266 (QDR-1066) strap at this time unless you really loosen up the memory timings. However, setting 5-5-5-15 on the memory at 1:1 ratio will result in the board setting performance level (Read Delay) to 9, just the opposite of what we usually see. On this board, the lower the CAS setting, the lower the BIOS will automatically set the performance level while at the same time increasing memory sub-timings. Of course, this is a balancing act that Foxconn engineering is still working on, but the P.03 BIOS we are using is representative of what should be the shipping BIOS. Our E6400 reached a final FSB setting of 520. We were unable to reach the advertised 575FSB that Foxconn has shown. Any attempt to boot the board past 530FSB resulted in three beeps and a return to stock settings.
Synthetic Graphics Performance
The 3DMark series of benchmarks developed and provided by Futuremark are among the most widely used tools for benchmark reporting and comparisons. Although the benchmarks are very useful for providing apple to apple comparisons across a broad array of GPU and CPU configurations they are not a substitute for actual application and gaming benchmarks. In this sense we consider the 3DMark benchmarks to be purely synthetic in nature but still valuable for providing consistent measurements of performance.
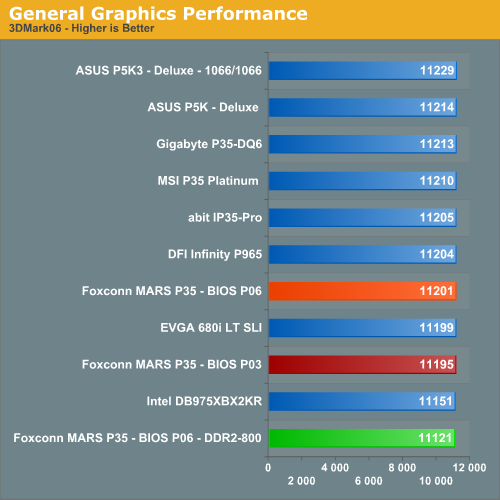
In our 3DMark06 test, all of the boards are within 1% of each other. When looking at the individual tests, the Foxconn board scores slightly better in the CPU tests but is second to last in the the SM2.0 and SM3.0 tests.
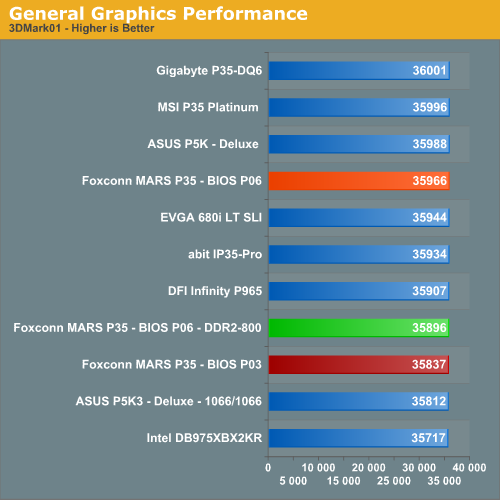
In the more memory and CPU throughput sensitive 3DMark01 benchmark we see the spread between boards is way under 1%. The Foxconn board scores near the top in each category except the Nature Test where it's just barely ahead of the 975X board.
General System Performance
The PCMark05 benchmark developed and provided by Futuremark is designed to measure overall system performance for the typical home computing user. This tool provides both system and component level benchmarking results utilizing subsets of real world applications or programs. This benchmark is useful for providing comparative results across a broad array of Graphics, CPU, Hard Disk, and Memory configurations along with multithreading results. In this sense we consider the PCMark benchmark to be both synthetic and real world in nature and it again provides consistency in our benchmark results.
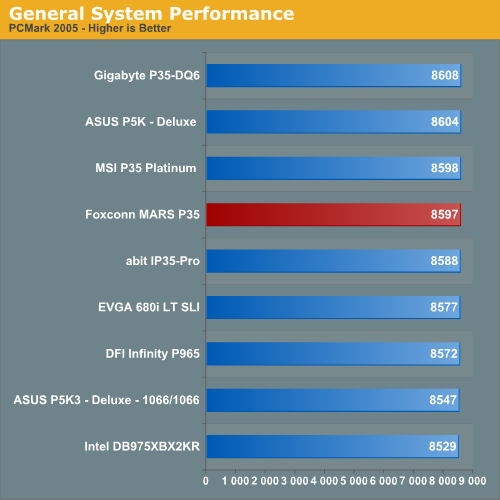
Once again, all of the boards are basically within shouting range of each other with the Foxconn board finishing near the top of the pack. The MARS board does very well in the Hard Disk and CPU sections while falling towards the rear of the pack in the graphics test.
Media Performance
We will take a brief look at general media performance with our test suite that includes Adobe Photoshop CS2 and Adobe Photoshop Elements 5.0.
We utilize the PC WorldBench 6.0 Test for measuring platform performance in Adobe's Photoshop CS2. The benchmark applies an extensive number of filters to the test image and heavily stresses the CPU and storage systems. The scores reported include the full conversion process and are represented in seconds, with lower numbers indicating better performance.
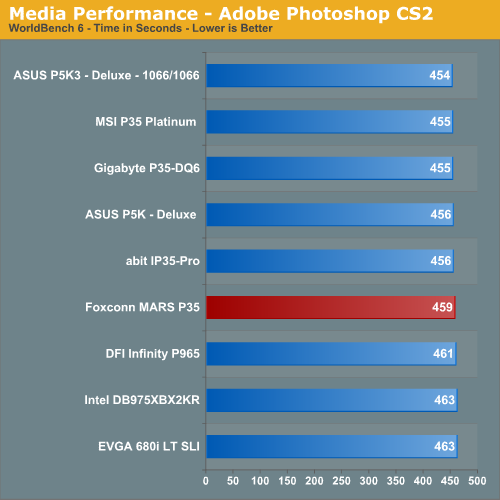
The results are interesting as this test requires a balance between CPU speed and a fast storage subsystem. The MARS board has both attributes but we did notice at the end of the test a slight pause during the final filter series. This occurred on each test run and we are still investigating the problem. However, the difference in scores is minimal between the P35 boards.
Our next test is one recommended by Intel, but the test itself appears to be fair and results are very repeatable. This test simply measures the amount of time required to fix and optimize 103 different photos weighing in at 63MB. Time is measured in seconds, with lower times resulting in better performance
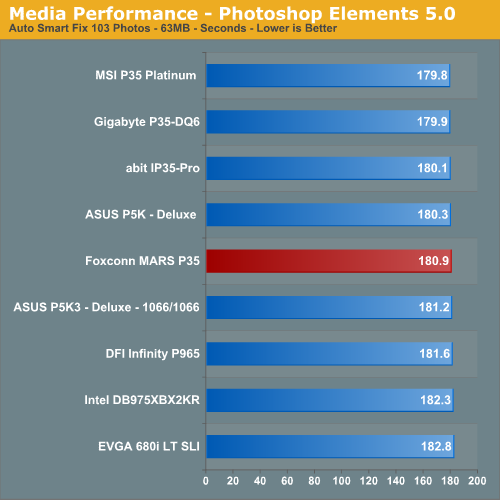
This test heavily stresses the CPU but also requires a decent storage system. Once again the MARS board finishes behind most of the other P35 boards, but a difference of one second is hardly worth penalizing a board for "poor" performance.
Media Encoding Performance
We are utilizing Nero Recode 2 and Sony Vegas 7.0e for our video encoding tests. The scores reported include the full encoding process and are represented in seconds, with lower numbers indicating better performance.
Our first series of tests is quite easy - we take our original Office Space DVD and use AnyDVD to rip the full DVD to the hard drive without compression, thus providing an almost exact duplicate of the DVD. We then fire up Nero Recode 2, select our Office Space copy on the hard drive, and perform a shrink operation to allow the entire movie along with extras to fit on a single 4.5GB DVD disc. We leave all options on their defaults except we uncheck the advanced analysis option.
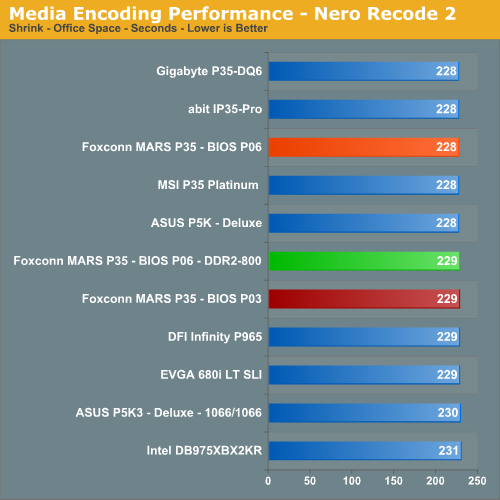
We find in this CPU and disk intensive test that all of the boards are within 2% of each other with the Foxconn board finishing in the middle of the pack, a pack that is separated by just three seconds.
Our Sony Vegas 7.0e test converts several of our summer vacation files into a plasma-screen-pleasing 1080/24P format with a 5.1 audio stream. We ensure our quality settings are set to their highest levels and then let the horses loose.
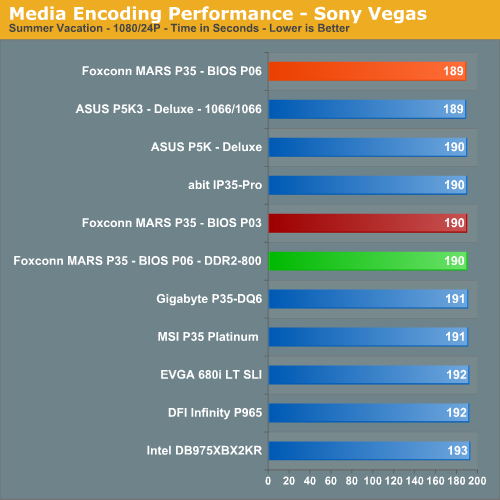
In a test that really stresses the CPU and memory subsystem, we see the Foxconn board finishing at the top of the DDR2 equipped P35 boards.
Audio Encoding Performance
We will utilize iTunes 7.4 for our audio encoding tests as it is one of the most utilized audio applications available due to the immense popularity of the iPod.
Our first task was to figure out what test CD to utilize. We needed one that contained a significant number of tracks and had over 600MB of data in order to properly stress our platforms. As in previous articles, we are using an INXS Greatest Hits CD for testing, which contains 16 tracks totaling 606MB of songs. Our next two tests have us utilizing iTunes to convert our WAV files into ACC or MP3 compatible formats. We utilize 320kbps or 256kbps and variable bit rate options for both tests.
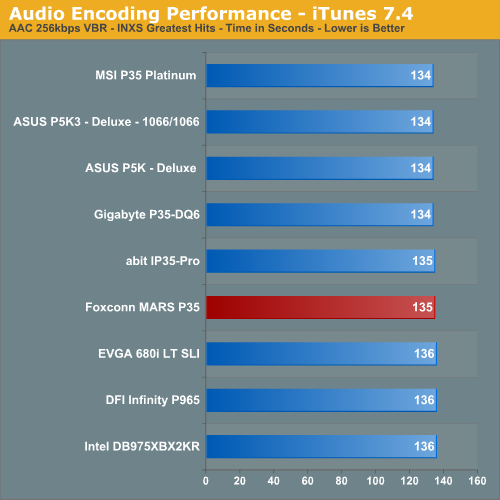
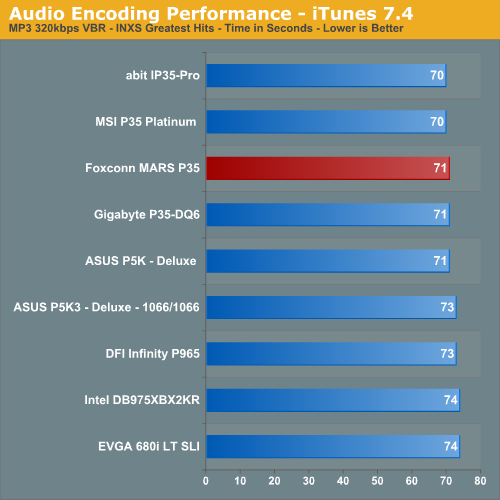
We usually see iTunes favoring a system with excellent CPU throughput and these tests indicate the Foxconn board is up to speed in this area.
File Compression Performance
In order to save space on our hard drives and provide another CPU crunching utility, we utilize WinRAR 3.70 to perform some compression tests. WinRAR now fully supports multithreaded operations and should be of particular interest for those users with dual core or multi-processor systems. Our test folder contains 444 files, ten subfolders, and 602MB worth of data. All default settings are utilized in WinRAR and our hard drive is defragmented before each test.
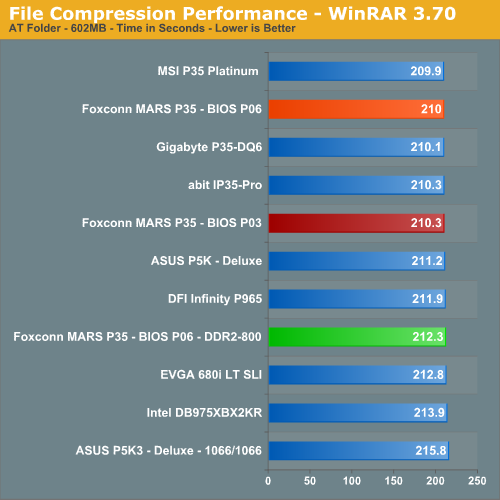
Once again we see the Foxconn board performing well in a test that stresses overall memory latencies and CPU/Memory throughput. The nature of file compression is such that memory is accessed almost constantly in a very random fashion, so page misses requiring additional time as memory banks are swapped is common.
Rendering Performance
We are using the Cinebench 10 benchmark as it tends to heavily stress the CPU subsystem while performing graphics modeling and rendering. Cinebench 10 features two different benchmarks with one test utilizing a single core and the second test showcasing the power of multiple cores in rendering the benchmark image. We utilize the standard multi-core benchmark and default settings.
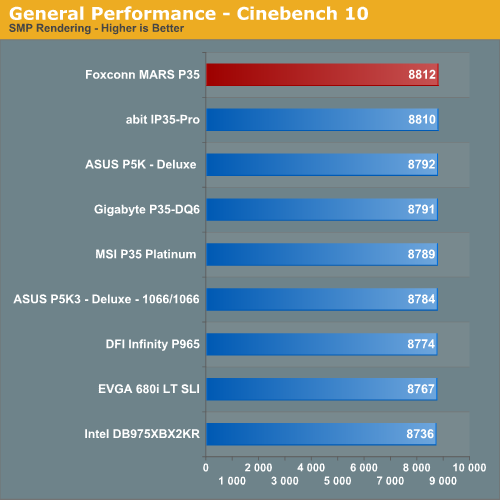
The Foxconn board performs extremely well in this CPU intensive test and leads our test group.
Gaming Performance
As usual, gaming performance was tested with a variety of current games. We ran our benchmarks at a 1280x1024 resolution with high quality settings
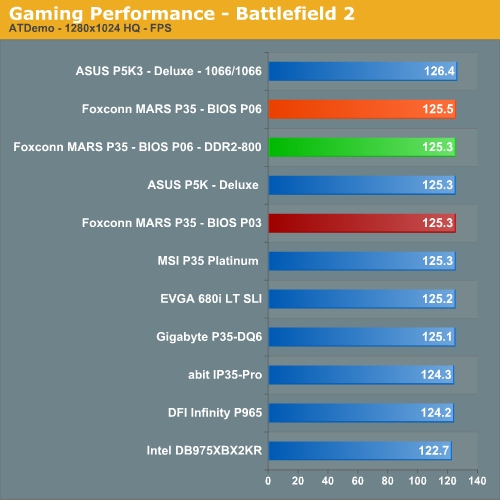
Battlefield 2
This benchmark is performed using DICE's built-in demo playback functionality with additional capture capabilities designed in house. During the benchmark, the camera switches between players and vehicles in order to capture the most action possible. There is a significant amount of smoke, explosions, and vehicle usage as this a very GPU intensive Battlefield 2 benchmark. We run Battlefield 2 using medium quality graphics settings available in the video settings. The game itself is best experienced with average in-game frame rates of 35 and up.
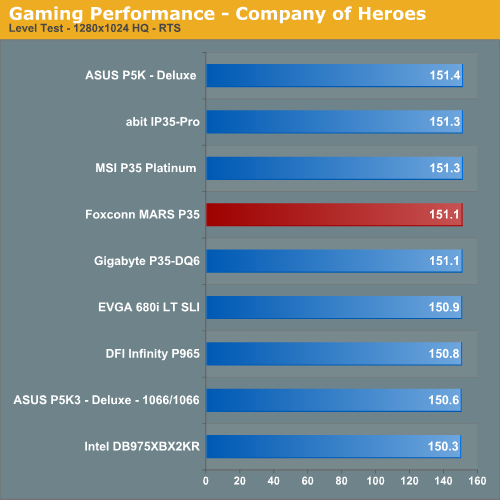
Company of Heroes
Company of Heroes was released last year and is still proving to be a very addictive RTS game around the office. The game is extremely GPU intensive and also requires a hefty CPU at times. The game contains a built-in performance test that utilizes the game engine to generate several different action scenes. We find the performance test gives a good indication of how well your system will perform throughout the game on average. Some of the in-game action sequences can be more demanding than the performance test, however, and we are working on a repeatable game play benchmark. For now, we find the game to be enjoyable with an average frame rate score in the performance test above 35fps.
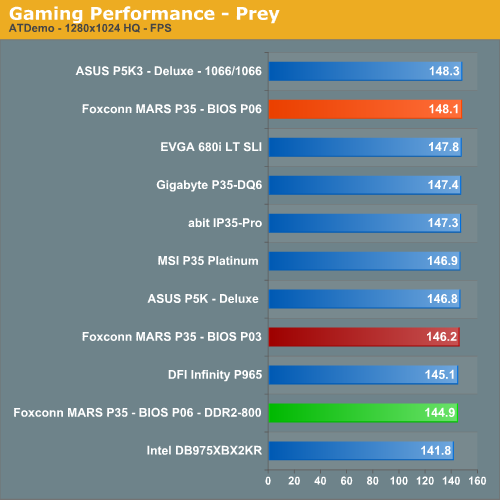
Prey
Prey offers some superb action sequences, unique weapons and characters, and is a visually stunning game at times. It still requires a very good GPU to run it with all of the eye candy turned on. We set all graphic settings to their maximum except for AA/AF and utilize a custom timedemo that takes place during one of the more action oriented sequences. We generally find the game to be enjoyable with an average frame rate above 35fps.
Supreme Commander
Supreme Commander is one of the favorite real time strategy games around the office as it continues to provide a great deal of replay value and the graphics are very good once the eye candy is turned on. What we especially like about the game is the fact that it can bring the best system to its knees and that fact makes it a great system benchmark. This particular game requires both a very good CPU and GPU when playing the game at anything above 1024x768 with decent settings. We utilize the game's built-in benchmark and generally find the game to be enjoyable with an average frame rate above 25fps.
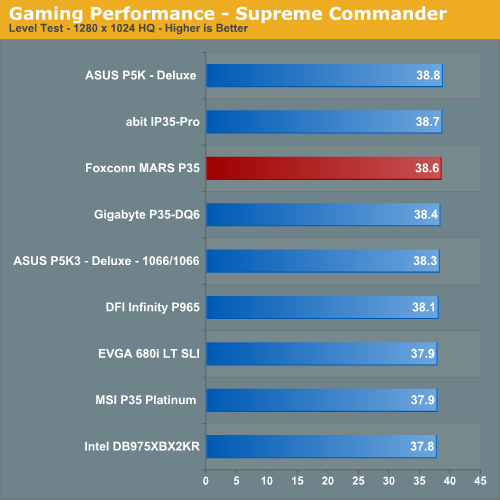
Gaming Summary
The Foxconn MARS board performed admirably in the game tests although in the bandwidth sensitive Prey test it placed near the bottom of the group. Overall, the board continues its pattern of finishing in the middle of the pack. Considering the group of boards in the test group, this is actually an accomplishment for Foxconn.
Disk Controller Performance
We have utilized the Intel iPeak test for the past few years to measure "pure" hard disk or controller performance on Windows XP. Unfortunately, iPeak is not compatible with Vista so we will utilize two sections of the HDD test suite within PCMark05 for comparative hard disk or controller scores. This particular test suite provides a mixture of actual application results and specific read/write percentages within these programs. It is also a readily available benchmark that others can use for comparative purposes. The program utilizes the RankDisk application within the Intel iPeak SPT suite of tools to record a trace of disk activity during usage of real world applications. These traces are then replayed within PCMark05 to generate performance measurements based upon the actual disk operations within each application. The HDD test suite contains 53% read and 47% write operations with each trace section utilizing varied amounts of read or write operations. Additional information about the test suite can be downloaded in PDF format from this location.
The PCMark05 test results we are utilizing are based upon the following trace runs:
Application Loading: This test consists of 83% reading and 17% writes that tracks the opening and closing of the following programs.
- Microsoft Word
- Adobe Acrobat Reader
- Windows Media Player
- 3Dmark 2001SE
- Leadtek WinFast DVD
- Mozilla Internet Browser
- Opening a Microsoft Word document, performing grammar check, saving and closing
- Compression and decompression using WinZip
- Encrypting and decrypting a file using PowerCrypt
- Scanning files for viruses using F-Secure Antivirus
- Playing an MP3 file with Winamp
- Playing a WAV file with Winamp
- Playing a DivX video using the DivX codec and Windows Media Player
- Playing a WMV video file using Windows Media Player
- Viewing pictures using Windows Picture Viewer
- Browsing the Internet using Microsoft Internet Explorer
- Loading, playing and exiting a game with Tom Clancy's Ghost Recon
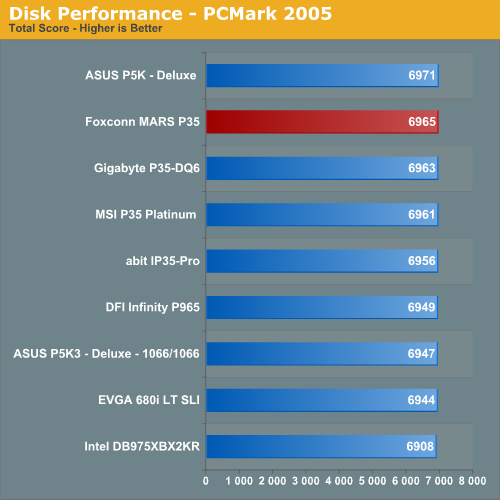
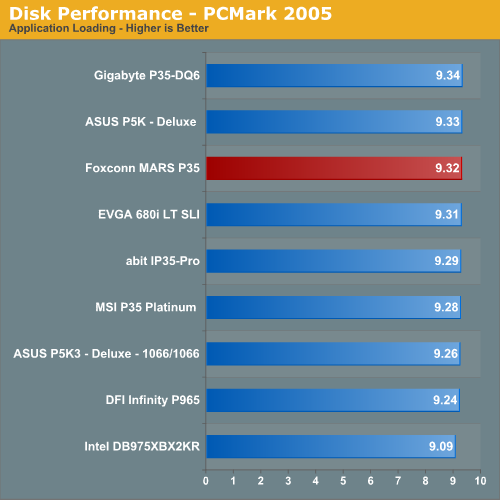
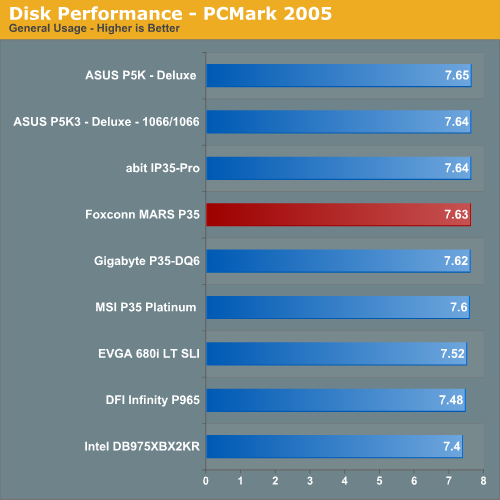
The performance pattern in these tests indicates what we witnessed in actual application testing. In tests that are heavily dependent on the storage system, the Foxconn MARS board does very well with consistent results near the top of the test group.
Ethernet Performance
LAN performance is also an area worth looking at, as these boards might be serving up media to the rest of the house. All of these boards utilize PCI or PCI Express based controllers with the only difference being the supplier of the core logic.
The Windows 2000 Driver Development Kit (DDK) includes a useful LAN testing utility called NTttcp. We used the NTttcp tool to test Ethernet throughput and the CPU utilization of the various Ethernet Controllers used on the Intel motherboards. We set up one machine as the server; in this test, an Intel system with an Intel CSA Gigabit LAN connection. Intel CSA has a reputation for providing fast throughput and is a logical choice for our Gigabit LAN server.
On the server side, we used the following Command Line as suggested by the VIA whitepaper on LAN testing:
Ntttcpr -m 4,0,‹server IP› -a 4 -l 256000 -n 30000Ntttcps -m 4,0,‹client IP› -a 4 -l 256000 -n 30000
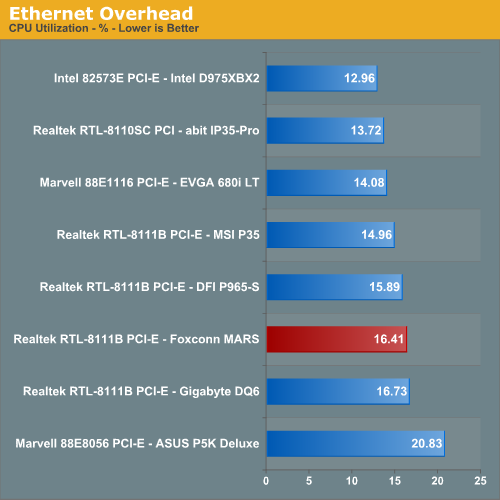
The throughput performance favors the Realtek Gigabit controllers with the Foxconn implementation offering the best performance. The CPU utilization numbers favor the Intel controller the Realtek 8111B still offering good performance. However, the differences are slight and will not be noticed under normal operating circumstances.
Quick Thoughts
We are quite surprised with the performance of the Foxconn MARS board. That comment cuts both ways as the press hype, marketing materials, and packaging led us to believe the board would be a consistent front runner in the sub-$200 enthusiast market. In some ways it is; in some ways it is not. Maybe our expectations were set too high from the beginning after seeing the 575FSB pictures along with whispers of top tier performance for a budget price.
What we have at this point is a board that is competitive with the likes of the abit IP35-Pro, ASUS P5K Deluxe, Gigabyte GA-P35-DQ6, and the MSI P35 Platinum. The MARS board offers basically the same feature set and support of of these other boards and in that context, it will find the current landscape to be very competitive. The natural competitor for the MARS board is the excellent abit IP35-Pro and looking at the two boards, we feel like Foxconn is going to need to drop their price (estimated MSRP is $199.99) below that of the abit board to garner buyer interest.
What we do not know is if Foxconn is willing to do this in order to gain entrance into a market where they are essentially a newcomer. Without a history in the Intel performance sector and a reputation of mass producing budget offerings with limited feature sets, it will be difficult at first to sway buyers accustomed to other brands. What we do know is that Foxconn is serious about the performance user and has put forth an excellent first effort with their MARS board. When looking at the board from this perspective, we are impressed with what Foxconn has put together and they are on the right track.
With that said, the board offers average overall performance in the P35 group but has a very strong showing in CPU intensive benchmarks and offers excellent memory latencies, provided you have memory capable of running CAS4 timings around DDR2-1066. Quad-core overclocking is excellent and is only surpassed by the latest X38 DDR3 boards at this time, although we still have a couple of enthusiast level P35 boards left to test that promise the same capability. After spending the last couple of weeks with the board we found it generally behaved better with the quad cores than the dual cores, especially when overclocking. Not that we had any issues with the dual cores; it's just the first board we have tested that generated that "feeling" of being designed with quad-core performance as the primary concern.
After some experimentation, we found the board was very easy to overclock, though it requires higher memory voltages than our other P35 boards. Without the ability to set the strap speeds, the result is a hunt and peck affair with the memory ratios/FSB speeds to find the right strap setting and then adjust the memory timings appropriately for stability or performance. While the brute force approach works at times with raising the voltages and lowering room temperatures, we were hoping for a little less effort being required to set up the board. It's not that we're unable to put in the effort, but this is not a DFI level BIOS yet, but it seems to require almost that level of tweaking in order to reach more moderate results.
The BIOS still needs a little polishing when it comes to auto settings; it generally chooses the right settings, but at times the memory timings are a little too aggressive or even too loose when manually setting the basic four timings. We are confident Foxconn will find the right balance before the board ships early next month, and stability is excellent once the board is dialed in. Hopefully, they will add the ability to manually change strap settings along with reducing the memory voltages required for high memory clocks when compared to competing boards in this category. Also, the Aegis panel needs to be updated quickly to include the promised overclocking features, something abit already provides with the IP35-Pro.
We are waiting on the final BIOS release before making a recommendation and providing additional overclocking and memory performance results with a wide range of components. Until then, we honestly have to say that Foxconn surprised us; the performance potential is definitely there, the layout is right on, and the feature set is competitive in this class. It appears that the board really is capable of living up to its namesake. It just needs that final coat of polish and a price adjustment to truly go to war; ,otherwise it could be left protecting the cattle.


