Original Link: https://www.anandtech.com/show/2144
Intel P965: Foxconn P9657AA- 8KS2H
by Gary Key on December 28, 2006 7:00 AM EST- Posted in
- Motherboards
Foxconn has been around for several decades and is one of the largest manufacturers of electronics components in the world. They have provided motherboards for many OEMs in the past, but it has only been more recently that they began to offer their boards on the retail market. Given their OEM provider roots, it's not too surprising that the initial Foxconn motherboards failed to cater to the enthusiast community. Over time, Foxconn worked to correct this perception, and they have released several motherboards using their "WinFast" branding that attempted to cater to this market. Unfortunately, as we stated in a previous review, merely saying a product has "extreme performance" does not make it so. However, they made amends to the performance oriented crowd with their excellent C51XEM2AA motherboard based on the NVIDIA nForce 590 SLI chipset during the AMD AM2 launch last May.
Foxconn has introduced their CORE series of motherboards that will appeal to the budget minded user who still expects a very good feature set, excellent quality, and solid performance for their money. We are taking a look at one of the first motherboards in this new series that is based on the Intel P965 chipset. The board goes by the nomenclature Foxconn P9657AA-8KS2H. We continually see Foxconn having some of the longest product names around and would just assume they shorten the names and liven up the descriptions. Of course you can call a board just about anything but what matters in the end is its performance, stability, feature set, warranty, quality, and how well it is supported by the manufacturer. Let's take a look at the board's feature set and see just how well this budget oriented motherboard lives up to our other expectations.
Feature Set
| FOXCONN P9657AA-8KS2H | |
| Market Segment: | Budget Performance - $99.99~$109.99 |
| CPU Interface: | Socket T (Socket 775) |
| CPU Support: | LGA775-based Pentium 4, Celeron D, Pentium D, Pentium EE, Core 2 Duo, Core 2 Extreme |
| Chipset: | Intel P965 + ICH8 |
| Bus Speeds: | 266 to 600 in 1MHz Increments |
| Memory Speeds: | Auto, 533, 667, 800 |
| PCIe Speeds: | Fixed |
| PCI: | Fixed |
| Core Voltage: | Default, +0.0125V to +0.3000V in .0125V increments |
| CPU Clock Multiplier: | Auto, 6x-11x in 1X increments if CPU is unlocked, Core 2 Duo |
| DRAM Voltage: | Default, -.150, -.100, -.050V and +.050V to +.600V in .050V increments |
| DRAM Timing Control: | SPD, 4 DRAM Timing Options |
| NB Voltage: | Default, -.120V, -.080V, -.040V and +.040V to +.240V in +.040V increments |
| Memory Slots: | Four 240-pin DDR2 DIMM Slots Dual-Channel Configuration Regular Unbuffered Memory to 8GB Total |
| Expansion Slots: | 1 - PCIe x16 1 - PCIe x4 1 - PCIe x1 3 - PCI Slot 2.3 |
| Onboard SATA/RAID: | 4 SATA 3Gbps Ports - Intel ICH8 1 e-SATA 3Gbps Port - JMicron JMB361 |
| Onboard IDE: | 1 ATA133/100/66 Port (2 drives) - JMicron JMB361 |
| Onboard USB 2.0/IEEE-1394: | 10 USB 2.0 Ports - 4 I/O Panel - 6 via Headers No Firewire Support |
| Onboard LAN: | Marvell 88E8056 - PCI Express Gigabit Controller |
| Onboard Audio: | Realtek ALC883 8-Channel HD Audio Codec |
| Power Connectors: | ATX 24-pin, 8-pin EATX 12V, 4-pin Molex |
| I/O Panel: | 1 x PS/2 Keyboard 1 x PS/2 Mouse 1 x Serial Port 1 x S/PDIF Optical 1 x Parallel Port 1 x e-SATA Port 1 x Audio Panel 1 x RJ45 4 x USB 2.0/1.1 |
| BIOS Revision: | Award P32 |
Foxconn has equipped this motherboard with several nice features and it is currently selling in the $100 range. The board features the Realtek ALC883 HD audio codec, Marvell 88E8056 Gigabit Ethernet controller, an e-SATA port via the JMicron JMB361 chipset, but it unfortunately does not include Firewire support. The BIOS gives you the indication that the board should be overclocking friendly with several nice option ranges on the voltage and clock settings. However, as we will see in our overclocking test, the results do not match the BIOS capability. This is not necessarily a problem as we are talking about a $100 board with a very good feature set and solid performance results.
Board Layout and Features
 |
| Click to enlarge |
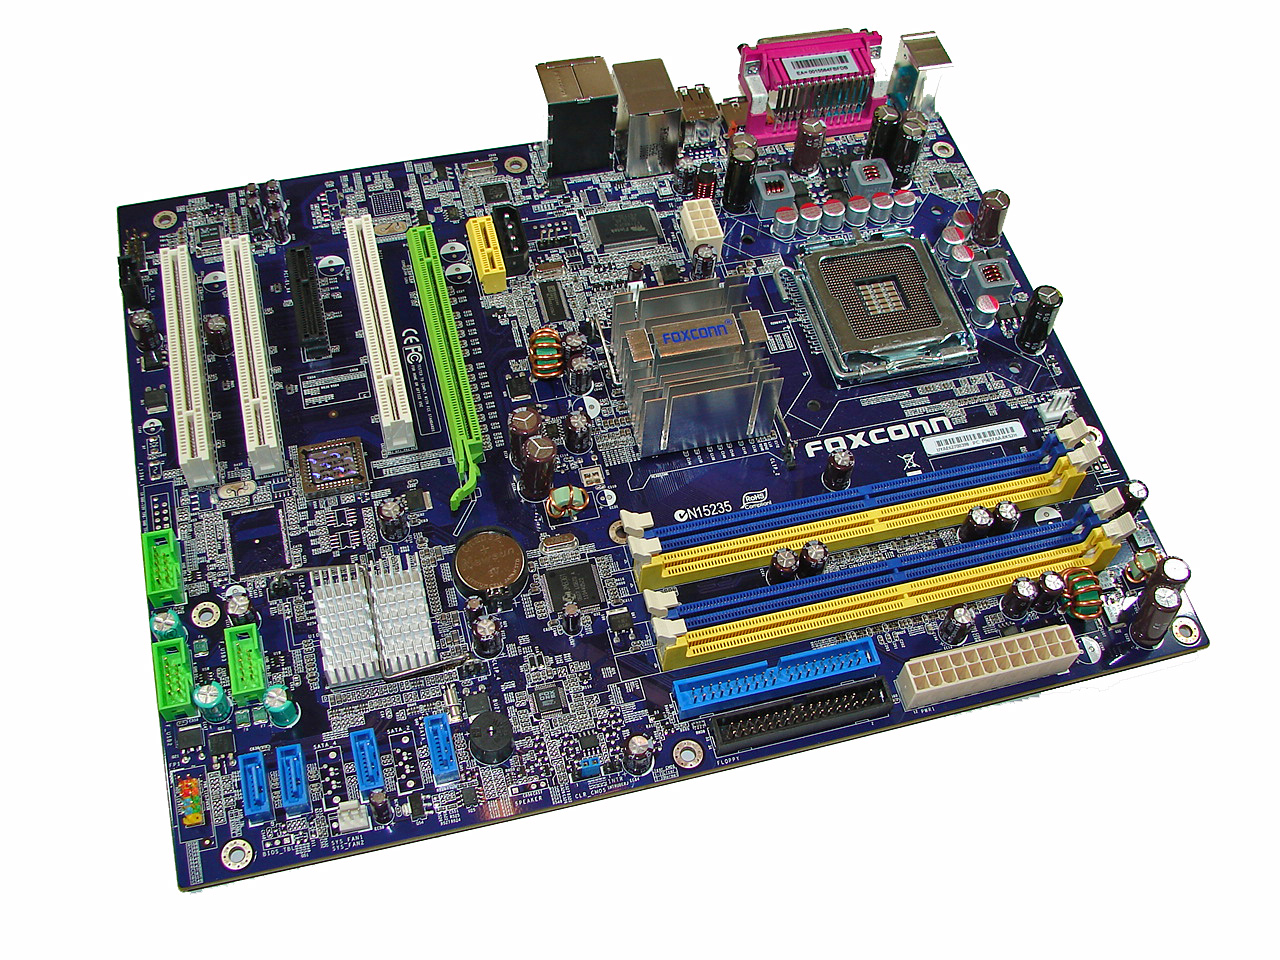
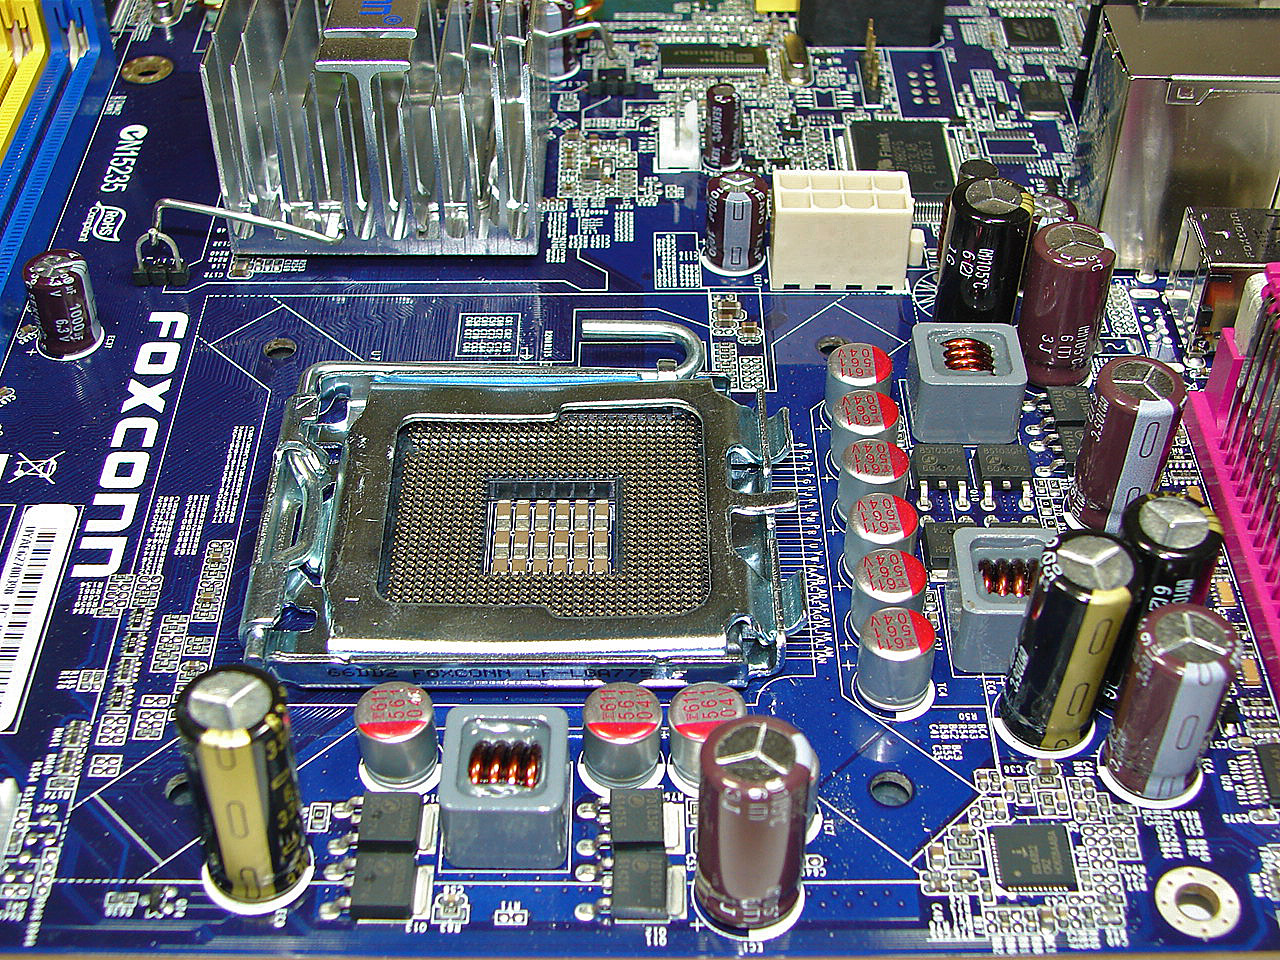
Foxconn did a really nice job with the layout of this board and the color combination is subdued and almost elegant when compared to some of the more garish color schemes we have seen recently on other boards. The board was a breeze to install in our Cooler Master CM Stacker 830. However, we have concerns about the location of the 8-pin ATX connector near the CPU area causing cable management issues with larger air coolers like the Scythe Infinity. We recommend installing the 8-pin ATX connector first as it is difficult to attach it once your air cooler is installed. The board features a total of three fan headers that are controlled via the BIOS. A fourth one would have been preferred near the I/O panel. The board features a three-phase voltage regulator system that provided superb stability throughout testing.
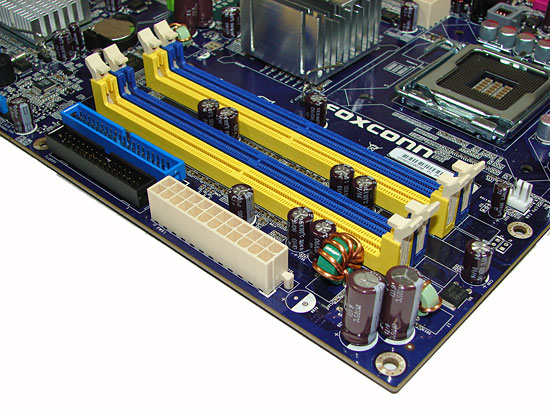
The DIMM module slots' color coordination is correct for dual channel setup based upon the premise of installing DIMMs in the same colored slots for dual-channel operation. It was very easy to install memory modules with a full size video card placed in the PCI Express x16 slot. Foxconn places the CPU fan header above the first DIMM slot and it is an easy reach for most CPU fan/heatsink cables.
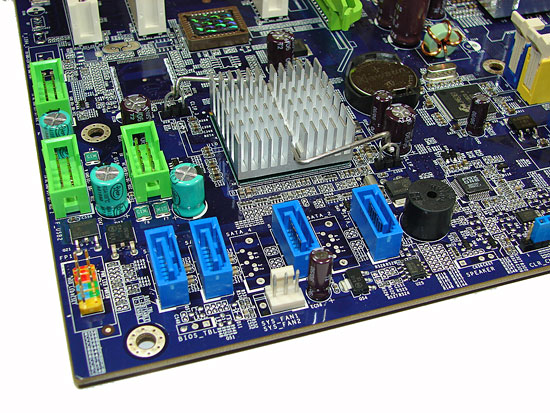
The four Intel ICH8 SATA ports are blue and are conveniently located below the ICH8 Southbridge along with the second fan header. The SATA ports feature the newer clamp and latch design. We found the positioning of the SATA ports to be very good when utilizing the PCI 2.3 slots although we had to bend our SATA cable a little when using the first port with an NVIDIA 8800GTX . The ICH8 is passively cooled and remained cool to the touch throughout testing. The chassis panel and USB connectors are located along the left edge of the board.
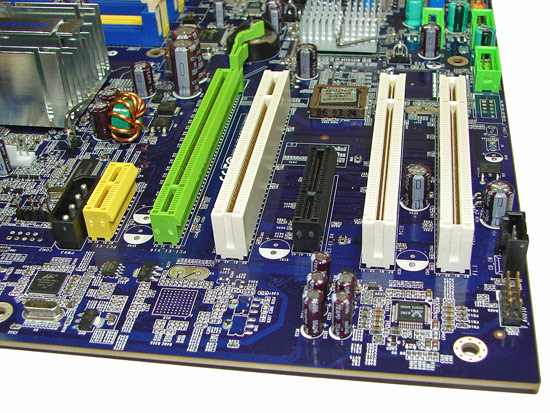
The board comes with one physical PCI Express x16 connector, one PCI Express x4, one PCI Express x1, and three PCI 2.3 connectors. The layout of this design offers one of the better single x16 connector designs we have worked with to date. Only the first PCI slot will be physically unavailable if you use a double slot video card in the PCI Express x16 slot. There is a 4-pin 12V Molex connector that is required for dual graphic card operation (though that will require the use of a non-x16 card as the second GPU) that worked with the latest BIOS release.
 |
| Click to enlarge |
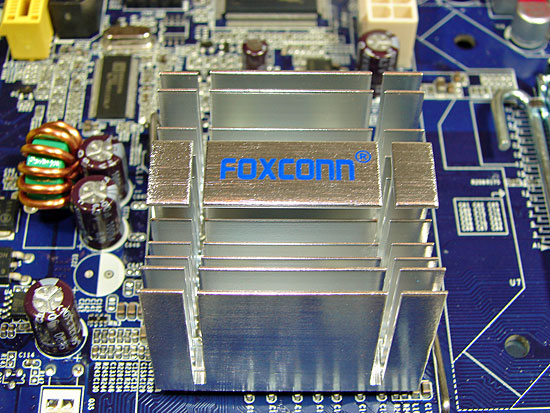
Getting back to the CPU socket area, we find a fair amount of room for alternative cooling solutions. We utilized the stock heatsink/fan in our normal testing but also verified a few larger Socket-775 air cooling solutions would fit in this area during our overclocking tests. The Intel P965 MCH chipset is passively cooled with a mid-rise heatsink unit that did not interfere with any installed peripherals. However, it was slightly difficult routing the 8-pin ATX power cable with a cooling solution like the Tuniq Tower 120 installed. Also, the large capacitor near the bottom right mounting hole requires some tender loving care when mounting a large air cooler.
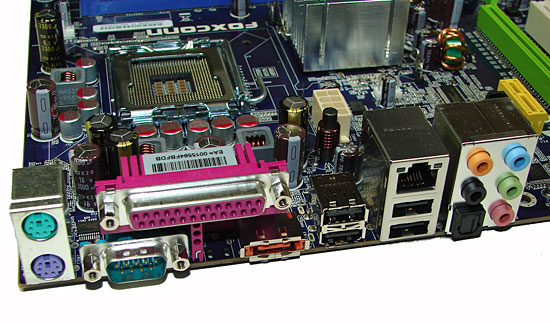
The rear panel contains the PS/2 mouse and keyboard ports, LAN port, and 4 USB 2.0 ports. The LAN (RJ-45) port has two LED indicators representing Activity and Speed of the connection through the Marvell 88E8056 Gigabit PCI-E chipset. The audio panel consists of 6 ports that can be configured for 2, 4, 6, and 8-channel audio connections for the Realtek ALC 883 HD codec along with an S/PDIF optical out port. The IO panel also has a serial, parallel, and e-SATA port.
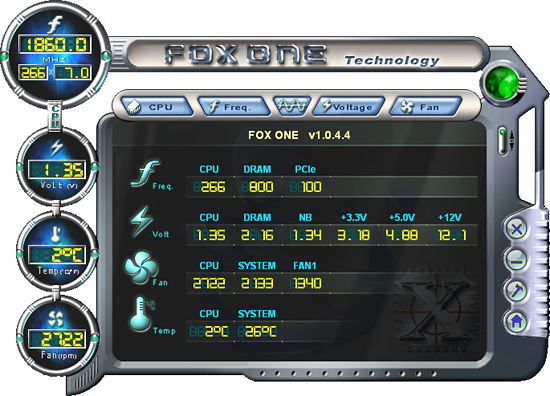
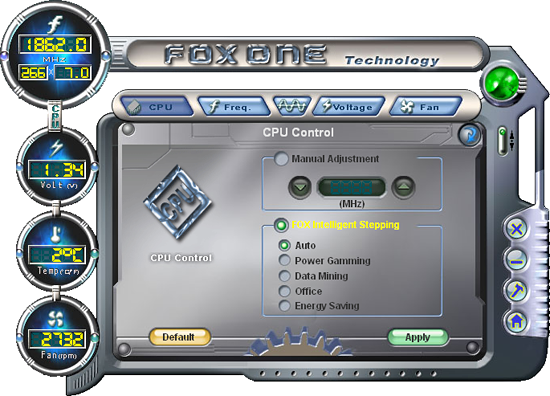
Foxconn includes their Fox One and Fox LiveUpdate software utilities with the board: an Overclock Program, Hardware Monitoring application, Smart Fan Utility, and an online BIOS update applet that is not pictured. The Fox One utility allows for changes to the FSB and basic system voltages and includes a smart fan utility that allows control of the system fan headers within Windows, though the BIOS options are more significant in regards to temperature control. The Hardware Monitoring utility allows for real-time monitoring of CPU temperature, CPU fan speeds, and basic system voltages. Foxconn includes an automatic overclocking utility in their BIOS that offers five different settings.
We selected the Power Gaming setting in the BIOS and after a quick reboot our speeds increased by around 5%~7% during usage. Overall, the automatic overclocking worked without any issues and provided an increase in speed or power savings just as Foxconn intended. As usual, users will still be able to eke more performance out of the board through manual overclocking.
FSB Overclocking Results
| Standard Test Bed Performance Test Configuration |
|
| Processor: | Intel Core 2 Duo E6300 Dual Core, 1.86GHz, 2MB Unified Cache 1066FSB, 7x Multiplier |
| RAM: | Geil PC2-6400 800MHz Plus (2x1GB- GX22GB6400PDC) (Micron Memory Chips) |
| Hard Drive: | Seagate 320GB 7200RPM SATA2 16MB Buffer |
| System Platform Drivers: | Intel - 8.1.1.1010 |
| Video Cards: | 1 x MSI X1950XTX |
| Video Drivers: | ATI Catalyst 6.11 |
| CPU Cooling: | Scythe Infinity |
| Power Supply: | OCZ GameXstream 700W |
| Optical Drive: | Sony 18X AW-Q170A-B2 |
| Case: | Cooler Master CM Stacker 830 |
| Motherboards: | Asus P5B-E (Intel P965 C2, 1.01G) - BIOS 0601 - Memory at 2.10V Asus P5B-E (Intel P965 C2, 1.02G) - BIOS 0601 Asus P5NSLI (NVIDIA 570SLI) - BIOS 0601 Asus P5W-Deluxe (Intel 975X) - BIOS 1407 Abit AB9-Pro (Intel P965 C1) - BIOS 1.5 BioStar T-Force 965 Deluxe (Intel P965 C1) - BIOS IP96a803 BioStar T-Force 965PT (Intel P965 C1) - BIOS P96CA914BS FOXCONN P9657AA-8KS2H (Intel P965 C2) - BIOS P32 Gigabyte GA-965P-DS3 (Intel P965 C2) - BIOS F7 Gigabyte GA-965P-S3 (Intel P965 C2) - BIOS F6 |
| Operating System: | Windows XP Professional SP2 |
| . | |
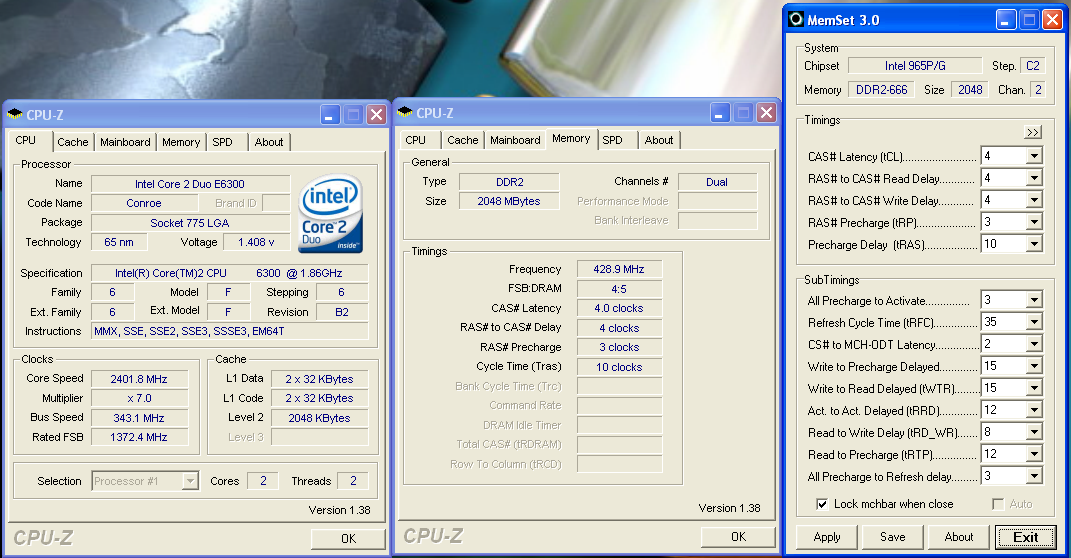 |
| Click to enlarge |
We were able to reach a final benchmark stable setting of 7x343 FSB resulting in a clock speed of 2401MHz. The board was capable of running at 7x354 FSB but would consistently fail our dual Prime95 test along with a few game benchmarks. We settled on the 7x343 FSB setting and set our VCore to an acceptable 1.4000V with Vdroop being around .03V during load testing. We were able to operate our GEIL memory at 4-3-3-10 at 2.2V at these settings, our Crucial Tenth Anniversary 2GB DDR2-667 kit at 4-4-4-3-12 at 2.2V, and the TwinMOS PC2-5300 at 5-4-4-10 at 2.15V.
Although not shown in our charts we had one anomaly with this board when overclocking and using a P4 processor. We generally found that our SATA drives would not be recognized when reaching overclocks around 285 FSB. This did not occur with our Core 2 Duo products although this same issue could explain why the board will not post above 354 FSB in our testing. There is not an option to change the PCI Express speed and we wonder if it is floating when overclocking the board. Foxconn is currently looking into this issue.
Memory Stress Testing
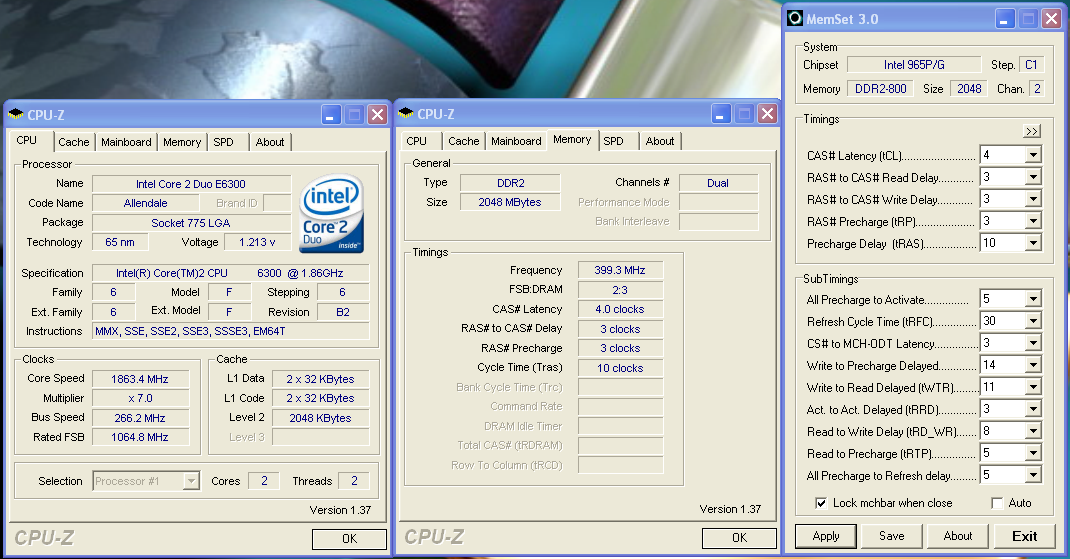 |
| Click to enlarge |
We take a look now at seeing how well our GEIL PC2-6400 memory operates in this board in both two and four DIMM testing. The screenshot above shows the actual memory settings used in our benchmark tests of the board. We do not modify the memory timings beyond the four major settings in our charts. The remaining memory settings are implemented automatically via the BIOS. Foxconn implements slightly tighter memory and MCH timings than some of the other P965 boards we have tested.
| FOXCONN P9657AA-8KS2H Stable DDR2-800 Timings - 2 DIMMs (2/4 slots populated - 1 Dual-Channel Bank) |
|
| Clock Speed: | 800MHz |
| CAS Latency: | 4 |
| RAS to CAS Delay: | 3 |
| RAS Precharge: | 3 |
| RAS Cycle Time: | 10 |
| Voltage: | 2.20V |
We were able to set our timings to 4-3-3-10 by increasing the memory voltage to 2.20V with our GEIL memory. We were able to hold these timings up to DDR2-840 on this board along with timings of 4-4-4-12 up to DDR2-860. We could not run a CAS 3 setting in a stable manner at DDR2-800 settings or above. However, the performance penalty with this board set to CAS 4 was minimal with most benchmarks not varying more than 1%~2%.
| FOXCONN P9657AA-8KS2H Stable DDR2-800 Timings - 4 DIMMs (4/4 slots populated - 2 Dual-Channel Bank) |
|
| Clock Speed: | 800MHz |
| CAS Latency: | 4 |
| RAS to CAS Delay: | 4 |
| RAS Precharge: | 4 |
| RAS Cycle Time: | 12 |
| Voltage: | 2.20V |
Our settings of 4-4-4-12 at 2.20V were not quite as good as our ASUS P5B-E 1.02G settings of 3-4-3-10 but due to fairly tight memory latencies the benchmarks were still competitive. We were able to keep this setting up to DDR2-820 before switching over to 5-4-4-12 settings that held stable until we reached DDR2-860 during our overclocking tests.
Benchmark Setup
Our Foxconn motherboard fully supports the current range of socket 775 Intel processors. We chose an E6300 for testing as we feel this will be a very popular Core 2 Duo CPU choice with the P965 motherboards, and particularly with budget priced offerings like this Foxconn board.
| Standard Test Bed Performance Test Configuration |
|
| Processor: | Intel Core 2 Duo E6300 Dual Core, 1.86GHz, 2MB Unified Cache 1066FSB, 7x Multiplier |
| RAM: | Geil PC2-6400 800MHz Plus (2x1GB- GX22GB6400PDC) (Micron Memory Chips) |
| Hard Drive: | Seagate 320GB 7200RPM SATA2 16MB Buffer |
| System Platform Drivers: | Intel - 8.1.1.1010 |
| Video Cards: | 1 x MSI X1950XTX |
| Video Drivers: | ATI Catalyst 6.11 |
| CPU Cooling: | Scythe Infinity |
| Power Supply: | OCZ GameXstream 700W |
| Optical Drive: | Sony 18X AW-Q170A-B2 |
| Case: | Cooler Master CM Stacker 830 |
| Motherboards: | Asus P5B-E (Intel P965 C2, 1.01G) - BIOS 0601 - Memory at 2.10V Asus P5B-E (Intel P965 C2, 1.02G) - BIOS 0601 Asus P5NSLI (NVIDIA 570SLI) - BIOS 0601 Asus P5W-Deluxe (Intel 975X) - BIOS 1407 Abit AB9-Pro (Intel P965 C1) - BIOS 1.5 BioStar T-Force 965 Deluxe (Intel P965 C1) - BIOS IP96a803 BioStar T-Force 965PT (Intel P965 C1) - BIOS P96CA914BS FOXCONN P9657AA-8KS2H (Intel P965 C2) - BIOS P32 Gigabyte GA-965P-DS3 (Intel P965 C2) - BIOS F7 Gigabyte GA-965P-S3 (Intel P965 C2) - BIOS F6 |
| Operating System: | Windows XP Professional SP2 |
| . | |
A 2GB memory configuration is now standard in the AT test bed as most enthusiasts are currently purchasing this amount of memory. Our choice of DDR2-800 memory from GEIL offered a very wide range of memory settings during our stock and overclocked test runs. Our memory timings are set based upon determining the best memory bandwidth via our test application results.
We are utilizing the MSI X1950XTX video card to ensure our 1280x1024 resolutions are not completely GPU bound for our motherboard test results. We did find in testing that applying a 4xAA/8xAF setting in most of today's latest games created a situation where the performance of the system starts becoming GPU limited. Our video tests are run at 1280x1024 resolution for this article at standard settings.
Synthetic Graphics Performance
The 3DMark series of benchmarks developed and provided by Futuremark are among the most widely used tools for benchmark reporting and comparisons. Although the benchmarks are very useful for providing apple to apple comparisons across a broad array of GPU and CPU configurations they are not a substitute for actual application and gaming benchmarks. In this sense we consider the 3DMark benchmarks to be purely synthetic in nature but still valuable for providing consistent measurements of performance.
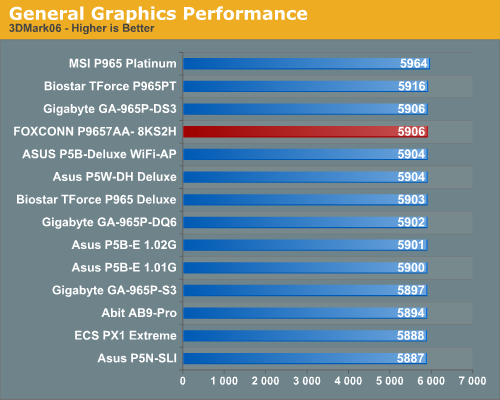
In our first tests, each P965 platform score is so close that there is no real winner here. However, we can see the overall performance of the Foxconn board is very good and scores in the upper third of the boards tested to date. The Foxconn board had no issues looping this benchmark for four hours at stock or overclocked settings.
System Performance
The PCMark05 benchmark developed and provided by Futuremark was designed for determining overall system performance for the typical home computing user. This tool provides both system and component level benchmarking results utilizing subsets of real world applications or programs. The benchmark is useful for providing comparative results across a broad array of Graphics, CPU, Hard Disk, and Memory configurations along with multithreading results. In this sense we consider the PCMark benchmark to be both synthetic and real world in nature while providing consistency in our benchmark results.
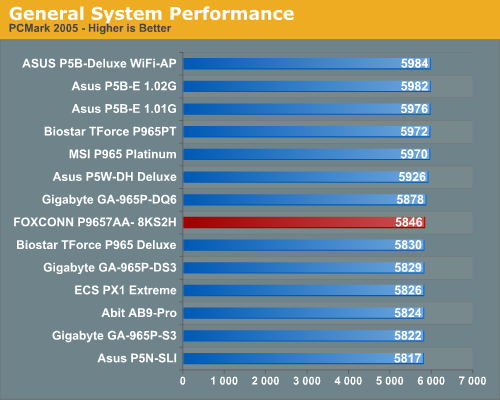
The Intel P965 based ASUS boards typically score significantly better than our other P965 boards in PCMark05 due to the final test which consists of multitasking three different applications. The ASUS P965 boards score up to 58% better in the File Encryption and HDD Virus section of the test with the File Compression result being around 16% better when compared to the Gigabyte and ECS boards. However, we find our Foxconn motherboard scoring slightly better than the Gigabyte, ECS, abit, and Biostar P965 Deluxe boards. We tried the new F8 final BIOS on the Gigabyte DS3 and it scored a 5934. It seems there are a few BIOS optimizations that can help improve the PCMark05 scores; whether these optimizations truly improve overall system performance or are merely to help with a few specific benchmarks is not yet known.
CPU Multitasking Results
We devised a script that would compress our standard test folder consisting of 444 files, ten subfolders, and 602MB worth of data, convert a 137MB High Definition QuickTime movie clip to a 37MB MPEG-4 format, play back the first two chapters of Office Space with PowerDVD, and run our AVG anti-virus program in the background. We stop the script when the file compression and video conversion are complete. This is a very taxing script for the CPU, Memory, and Storage subsystems. We also found it to be a good indicator of system stability during our overclocking testing.
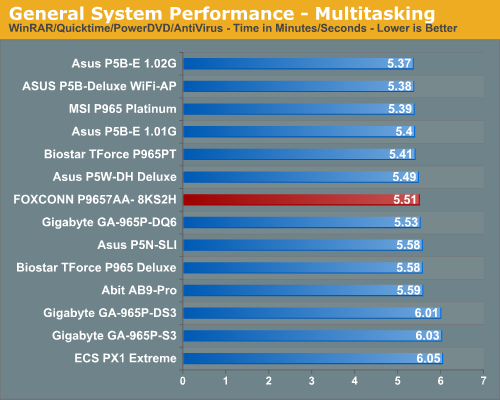
The performance difference basically mirrors our PCMark05 tests with the ASUS P965 boards scoring about 3% better overall in our multitasking test although the MSI P965 Platinum and the Biostar 965PT board are very close to the ASUS boards in this demanding multitasking test. The Foxconn board scores in the middle of the pack and continues to be competitive with the other boards despite its $100 price tag.
Media Encoding Performance
Our first encoding test is quite easy - we take our original Office Space DVD and use AnyDVD Ripper to copy the full DVD to the hard drive without compression, thus providing an almost exact duplicate of the DVD. We then fire up Nero Recode 2, select our Office Space copy on the hard drive, and perform a shrink operation to allow the entire movie along with extras to fit on a single 4.5GB DVD disc. We leave all options on their defaults except we check off the advanced analysis option. The scores reported include the full encoding process and are represented in minutes and seconds, with lower numbers providing better performance.
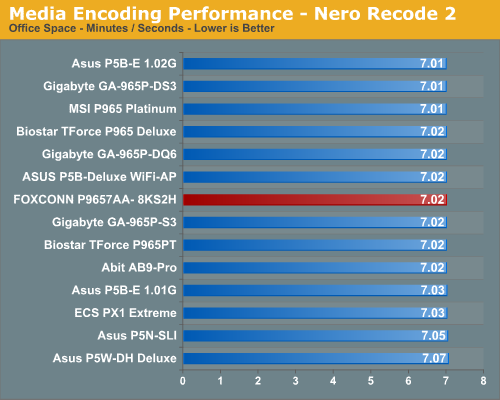
We continue to see a strong performance from the Foxconn motherboard although the differences in scores are minimal once again between the P965 boards. The 975X and NVIDIA 570SLI lag slightly behind in this test where the CPU and storage subsystems are stressed heavily.
Audio Encoding Performance
While the media encoding prowess of the P965 boards were superb in our initial media encoding testing, we wanted to see how they faired on the audio side. Our audio test suite consists of Exact Audio Copy v095.b4 and LAME 3.98a3. We utilize the INXS Greatest Hits CD that contains 16 tracks totaling 606MB of one time '80s hits.
We set up EAC for variable bit rate encoding, burst mode for extraction, use external program for compression, and to start the external compressor upon extraction (EAC will read the next track while LAME is working on the previous track, thus removing a potential bottleneck with the optical drive). We also set the number of active threads to two to ensure both cores are active during testing. The results are presented in minutes/seconds for the encoding process, with lower numbers being better.
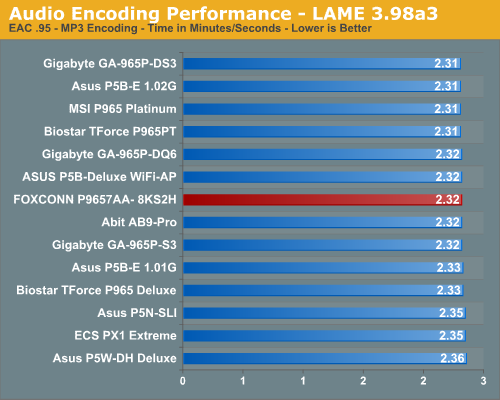
As in the media encoding section, the more intensive CPU and storage system tests seem to favor the P965 over the i975X/NV570SLI when running at the same memory timings. The Foxconn board scores near the top once again and had very consistent scores during each test run. This was surprising as the memory timings are running slower than the other boards tested except for the ECS unit.
File Compression Performance
In order to save space on our hard drives and ensure we had another CPU crunching utility, we will be reporting our file compression results with the latest version of WinRAR that fully supports multi-treaded operations and should be of particular interest for those users with dual core or multi-processor systems. Our series of file compression tests utilizes WinRAR 3.61 to compress our test folder that contains 444 files, ten subfolders, and 602MB worth of data. All default settings are utilized in WinRAR along with our hard drive being defragmented before each test.
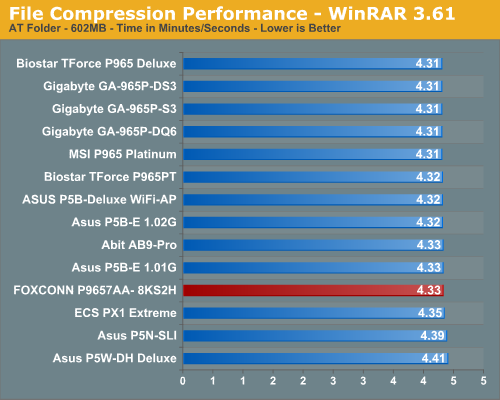
The Foxconn board scores in the bottom group of the P965 boards but the margins are extremely close between our P965 boards just reiterating the fact that boards based on the same chipset are going to offer the same performance. The 975X and 570SLI boards trail slightly but the differences are minimal.
Gaming Performance
As usual, gaming performance was tested with a variety of current games. We ran benchmarks with our standard 1280x1024 resolution. Given the number of users that run 19 inch LCDs these days, 1280x1024 represents one of the most commonly used resolutions.
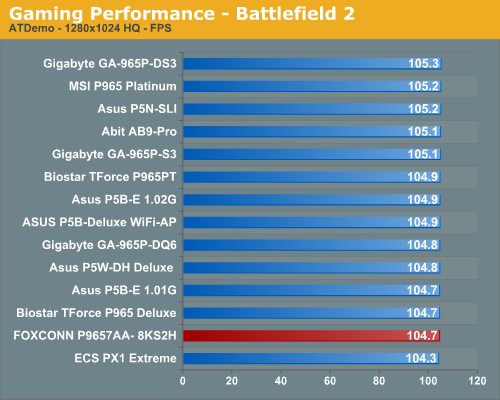
Battlefield 2
This benchmark is performed using DICE's built-in demo playback functionality with additional capture capabilities designed in house. During the benchmark, the camera switches between players and vehicles in order to capture the most action possible. There is a significant amount of smoke, explosions, and vehicle usage as this a very GPU intensive Battlefield 2 benchmark. We run Battlefield 2 using the highest quality graphics settings available in the video settings.
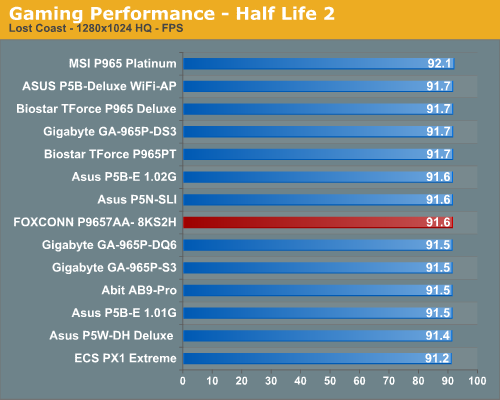
Half Life 2: Lost Coast
We use the built-in timedemo feature to benchmark the game. Our timedemo consists of starting at the bottom of the hill near the lake and ending in the old church. The Source engine timedemo feature is similar to the nettimedemo of Id's Doom 3 engine, in that it plays back more than just the graphics. The highest visual quality settings possible were used with HDR enabled for our tests.
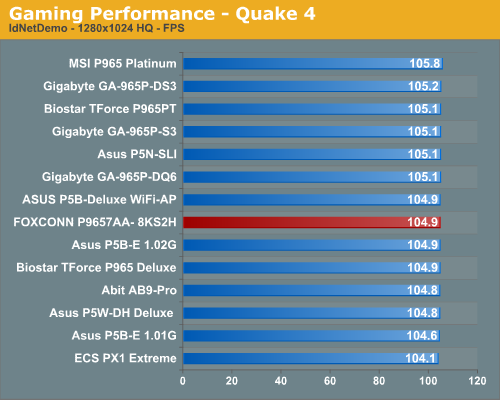
Quake 4
We utilize the nettimedemo test rather than the timedemo option for motherboard benchmarking of Quake 4. To be clear, this means our test results focus mostly on the performance one would experience during actual game play. Additionally, Quake 4 limits frame rate to 60 fps during gameplay whether or not VSync is enabled. Our benchmark utilizes the IdNetDemo. This demo includes mainly outdoor areas with numerous players trying to wipe each other out. We tested the game with High Quality settings (uncompressed normal maps), and we enabled all the advanced graphics options except for VSync.
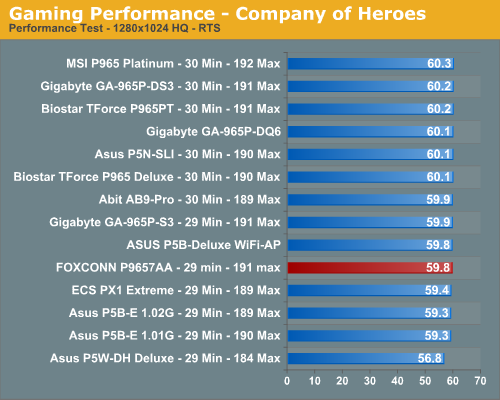
Company of Heroes
Company of Heroes is a very GPU intensive game and also requires a hefty CPU at times. The game contains a built-in performance test that utilizes the game engine to generate several different action scenes along with a coffee argument as a sideline distraction before the war starts. We found the performance test gives a good indication of how well your system will perform throughout the game on average.
Rise of Legends
Like most real-time strategy games this game is very CPU intensive but still offers a very visual experience. In order to experience the game properly you need a fast CPU, very good memory subsystem, and a decent GPU to play at the higher resolutions. We utilize FRAPS to capture the results from our replay file. Our benchmark consists of a one on one player game that takes approximately an hour to complete with some significant action throughout the game. Our camera movements are constant as we try to out play each other with a general tank rush between the two Vinci sides every few minutes. We set all video options to high but disable AA although we found it makes very little difference in the performance of the game at the lower resolutions.
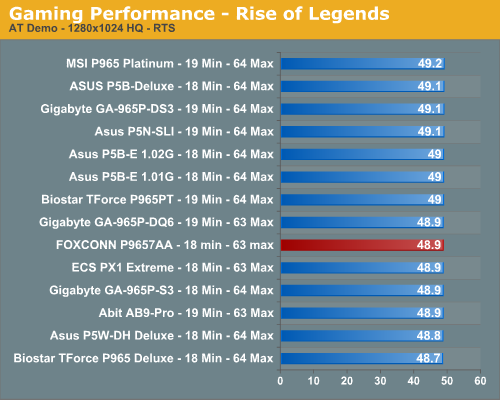
Gaming Summary
We get tired of repeating ourselves but once again if you utilize the same chipset you can expect the same basic results during benchmark testing. The differences between each board are minor and during actual game play we could not tell any differences amongst the motherboards tested today. The Foxconn P9657AA-8KS2H is just as competitive as the other P965 motherboards and while not leading the benchmarks, it was very consistent in scoring in the middle to upper ranges on each game.
We did not experience any issues during testing or during game play with the Foxconn board. We generally play every game for at least a couple of hours on each board to ensure there are no issues such as overheating, stuttering, or network issues when playing on-line with a various combination of components.
Disk Controller Performance
The AnandTech iPeak test is designed to measure "pure" hard disk controller performance, and in this case we keep the hard drive as consistent as possible while varying the hard drive controller. The idea is to measure the performance of each hard drive controller with the same hard drive.
We played back our raw files that are recorded I/O operations when running a real world benchmark - the entire Winstone 2004 suite. Intel's iPeak utility was then used to play back the trace file of all I/O operations that took place during a single run of Business Winstone 2004 and MCC Winstone 2004. To try to isolate performance differences to the controllers that we are testing we are using the Western Digital 74GB Raptor with 16MB cache for both our standard disk controller and RAID performance tests for this article. The drive is formatted before each test run and a composite average of three tests on each controller interface is tabulated in order to ensure consistency in the benchmark.
iPeak gives a mean service time in milliseconds; in other words, the average time that each drive took to fulfill each I/O operation. In order to make the data more understandable, we report the scores as an average number of I/O operations per second so that higher scores translate into better performance. This number is somewhat meaningless as far as hard disk performance is concerned, as it is just the number of I/O operations completed in a second. However, the scores are useful for comparing "pure" performance of the storage controllers in this case.
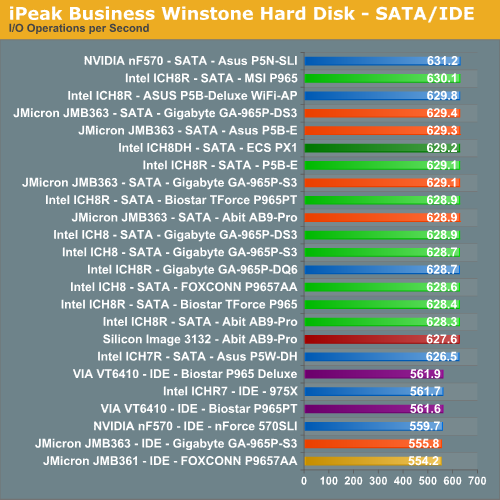
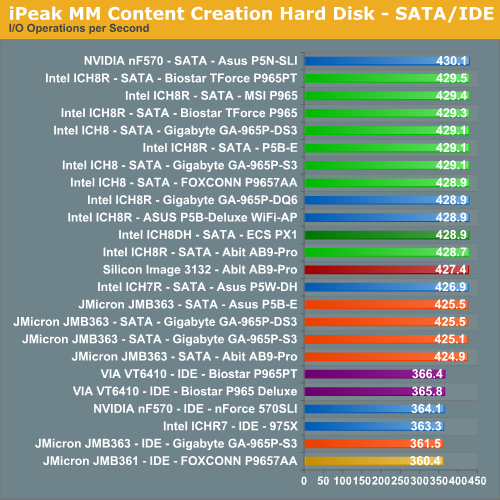
The performance patterns hold steady across both Multimedia Content I/O and Business I/O, with the NVIDIA nForce 500 based SATA controllers providing a slight improvement in I/O operations over the Intel, JMicron, and Silicon Image SATA controllers. This has been a historical trend between the two manufacturers with the NVIDIA controllers generally having a higher throughput than the Intel chipsets.
However, our recent testing of the AMD 600 chipset with the SB600 Southbridge showed the strength of this chipset by finishing ahead of the other offerings. We also noticed that the latest drivers from Intel along with optimizations on the Intel DB975XBX2 showed that the Intel chipsets are now very competitive with the new NVIDIA 680i boards.
Of note in our SATA tests is the excellent performance generated by the JMicron controller logic that scored higher than the Intel ICH7R or ICH8 based SATA controllers in the Business Winstone test. However, in the read and write heavy Content Creation tests we see the Intel SATA controllers placing ahead of the JMicron offerings. After reviewing the test script results we noticed the write operations of the JMicron JMB363 chipset was about 3% slower than the Intel ICH chipsets while being around 2% faster in read operations. We tested the e-SATA capability of the JMB361 chipset on the Foxconn board and did not encounter any issues with attaching our test drives or their performance.
The VIA VT6410 controller offered the best performance in the IDE tests with the JMicron JMB363 finishing last. During initial testing with the JMicron chipset we noticed several boards having issues with the optical drives being stuck in PIO mode resulting in terrible performance. However, this issue was solved with BIOS updates from the motherboard suppliers. We also advise that you utilize the latest JMicron JMB361 driver on the Foxconn board to avoid IDE compatibility issues with older drives.
Firewire and USB Performance
After looking at many options for Firewire and USB testing, we finally determined that an external USB 2.0, Firewire 400, and Firewire 800 hard disk would be a sensible way to look at USB and Firewire throughput. We utilize a RAM disk as our "server", since memory removes almost all overhead from the serving end. We turn off disk caching on the USB and Firewire side by setting up the drives for "quick disconnect" so our results are consistent.
We use 2GB of system memory with timings of 3-3-3-9 and set our RAM disk to 450MB with system memory at 1550MB. Our standard file is the SPECviewPerf install file, which measures 432,533,504 bytes (412.4961MB). After copying this file to our RAM disk, we measure the time for writing from the RAM disk to our external USB 2.0, Firewire 400, or Firewire 800 drive utilizing our internal Windows based timing program. The copy times in seconds are then converted into Megabits per second (Mb) to provide a convenient means of comparing throughput. Higher rates therefore mean better performance in this particular test.
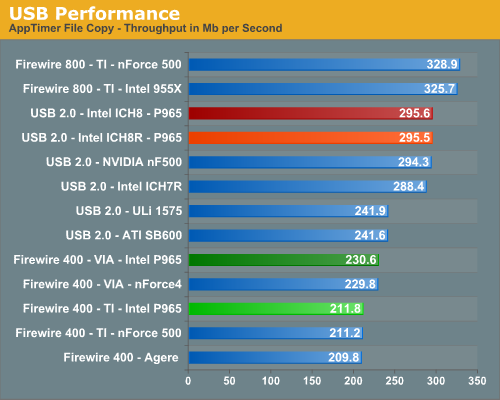
The most interesting aspect in Firewire and USB throughput tests is the outstanding performance of an external hard drive connected to Firewire 800. Our benchmarks show Firewire 800 is up to 42% faster than a drive connected to the more common Firewire 400, and about 11% faster than the fastest USB 2.0 solution.
We see our Intel ICH8 chipset finally overtake perennial champion NVIDIA in USB 2.0 performance. The Firewire solution from VIA is still slightly faster than the TI solutions normally used on most motherboards.
Ethernet Performance
The current motherboard test suite includes LAN performance measurements. All of these boards utilize PCI or PCI Express based Gigabit controllers with the only difference being the supplier of the core logic.
The Windows 2000 Driver Development Kit (DDK) includes a useful LAN testing utility called NTttcp. We used the NTttcp tool to test Ethernet throughput and the CPU utilization of the various Ethernet Controllers used on the Intel motherboards.
We set up one machine as the server; in this test, an Intel system with an Intel CSA Gigabit LAN connection. Intel CSA has a reputation for providing fast throughput and is a logical choice for our Gigabit LAN server.
On the server side, we used the following Command Line as suggested by the VIA whitepaper on LAN testing:
Ntttcpr -m 4,0,‹server IP› -a 4 -l 256000 -n 30000
On the client side (the motherboard under test), we used the following Command Line:Ntttcps -m 4,0,‹client IP› -a 4 -l 256000 -n 30000
At the conclusion of the test, we captured the throughput and CPU utilization figures from the client screen.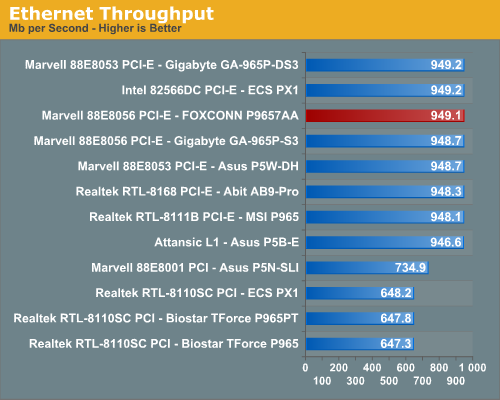
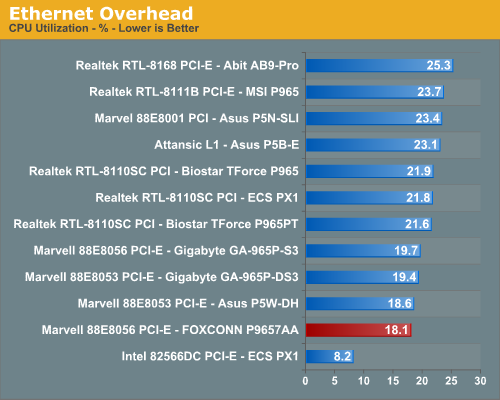
The CPU utilization performance favors the Marvell Gigabit controllers with the Realtek solutions having the highest utilization numbers. However, the Intel solution on the ECS board has the lowest CPU utilization numbers we have seen in testing. The throughput numbers also favor the Marvell and Intel Gigabit controllers with the Realtek options close behind. The Foxconn board utilizes the Marvell 88E8056 solution used on the Gigabyte S3 board.
ASUS is now using the Attansic L1 PCI Express based controller chip and it posted comparable numbers to the more widely used Realtek and Marvell solutions. ASUS utilizes a PCI based Gigabit controller on the 570SLI even though the NVIDIA chipset has native support for Gigabit operations. This decision results in the worse throughput and average CPU utilization numbers. However, even with throughput at 646Mb/s it still exceeds what most home networks are capable of and certainly any DSL or Cable based Internet connection.
Audio Performance
We are no longer showing the individual CPU utilization rates as the use of a dual core processor means the driver load is balanced between each processor with our audio solutions. The 2.3 version of Rightmark properly supports dual core processors but the results are almost meaningless for dual-core users. We have found the CPU utilization rate improvements with the dual-core setup in this test do not have any bearing on actual game benchmarks as the reduction in frame rate percentages are the same as on our single core systems.
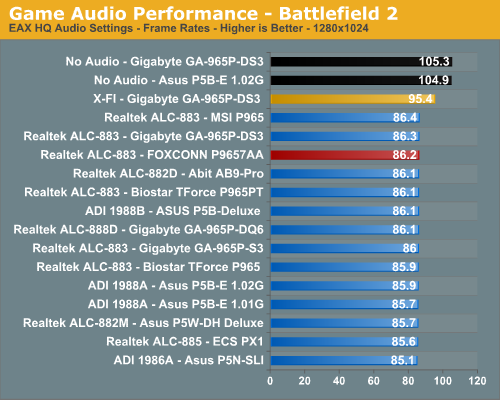
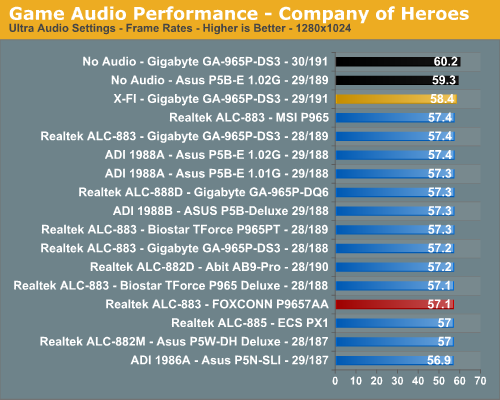
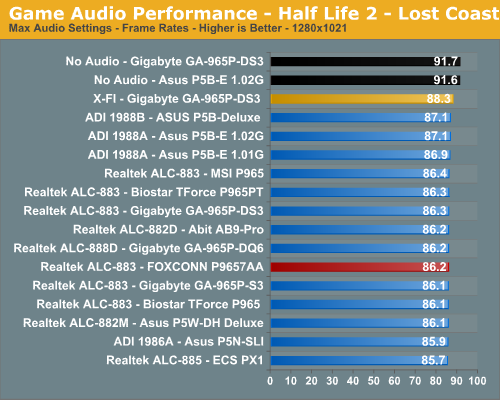
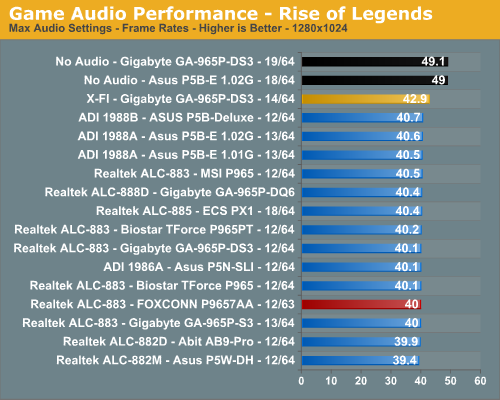
The audio performance numbers remain consistent between the Analog Devices and Realtek Codecs but both finish consistently behind the SoundBlaster X-Fi in the benchmarks. This is to be expected as the ADI and Realtek Codecs are host processing units dependent upon the CPU and drivers for generating their audio streams. The SoundBlaster X-Fi on the other hand has dedicated hardware that generates its audio streams and offloads this burden from the CPU. We are finding the CPU utilization rates to be constantly decreasing for the onboard solutions as CPU processing power increases and driver optimizations improve but they still take a toll in certain games. This is reflected in our numbers as Battlefield 2 has an average loss of 22% (was 28%), Half Life 2: Lost Coast at 5%, Company of Heroes at 5%, and Rise of Legends at 22%.
Rise of Legends is a very CPU intensive game with numerous sound effects and as such the CPU hit for generating audio is significant although we did not notice any stuttering during game play. Battlefield 2 utilizes EAX 2 for our ADI and Realtek HD Codecs which creates another significant demand on the CPU to process the audio streams, especially with the sound effects set to high.
Analog Devices has made news lately claiming other host-based audio solutions (Realtek is obviously in their crosshairs) do not properly generate EAX compatible audio in their drivers. After comparing the ADI 1988A to the Realtek ALC-882D in Battlefield 2 we completely agree the issues we heard before are strictly driver related. In fact, the ADI 1988A generated EAX 2 sound effects that were very close or equal to our Audigy 2 and within hearing distance of our X-FI at times.
The audio quality differences in EAX 2.0 capable games between the ADI and Realtek HD Audio Codecs were almost startling. We firmly believe this is due to obstructions and occlusions not being implemented correctly in the Realtek drivers although we did find minor improvements in the latest 1.51 release. In EAX 2 capable games that feature outdoor areas or vast expanses we found sounds at one end of the map to have the same volume and distance correlation as sounds in front of the character. We compared earlier driver releases from Realtek and noticed this issue has become worse over the course of the last year. We suggest turning off EAX 2 in games when utilizing the Realtek solution, as the games will just sound better the majority of time.
The audio differences in other games such as Company of Heroes were minimal although still present. This was especially true in the CoH benchmark where the two American soldiers are treading through the water to meet their group. You could hear the water gently move as they walked while with the Realtek solution the water sounded like a whale coming ashore. This pattern held true for all of our games we tested throughout the benchmark process including thirty games that we tested off-line.
Obviously, if you are a serious gamer, then a dedicated sound card is still useful to ensure consistent frame rates averages across a wide variety of games, and in the case of the Sound Blaster X-FI, you also get improved audio quality and EAX3/4/5 support. If you'd like more details on the Realtek or ADI solutions, you can refer to the Realtek HD Audio Codec Specifications or SoundMAX HD Audio Codec Specifications.
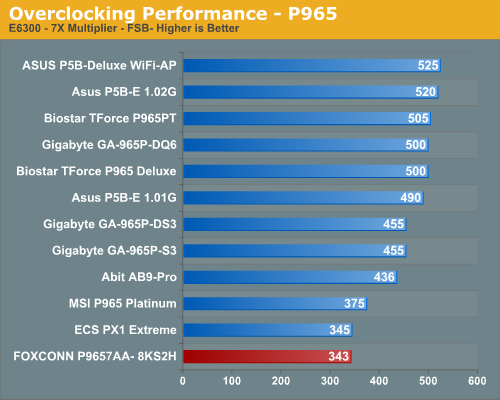
As we mentioned earlier in the article, the Foxconn board did not generate comparative FSB numbers with our other P965 motherboards. This will be disappointing to some users and we expected a little better overclocking capability based upon the quality of the board and its BIOS options. However, we will not hold this against the board as we think it strikes the right blend of performance and stability for a P965 motherboard priced right under $100.
Final Words
Once again we have a P965 based motherboard that performs equally with our other review units at stock levels. This is not necessarily a bad thing because with the base level performance basically being equal you can decide if features, price, quality, overclocking performance, or support will be the determining factor in your buying decision.
Our expectations of the Foxconn P9657AA-8KS2H varied over the course of testing as we did not anticipate much from a $100 P965 board at first. These expectations changed as we noticed the quality of the motherboard, its components, and general layout. Once we booted the board and updated to the latest BIOS our interest was piqued as maybe this motherboard would offer that perfect yet elusive price to performance ratio that we have been looking for during our P965 review process. We were at first disappointed with the overclocking capability of the board and then took a moment to recheck our original expectations of the board but more importantly ourselves.
Our original expectations of this board were centered on the stability and performance we would experience on a board that was selling for right under $100. We were also interested in the feature set and more importantly if Foxconn had designed a board that would live up to their marketing materials. Except for their recently released NVIDIA 590SLI motherboard which received a great deal of attention from NVIDIA's engineering group, their previous WinFast product lines were not the best enthusiast level boards.
This board is part of the CORE Series that promises leading technology products at affordable prices. Foxconn delivers on this point with the P9657AA-8KS2H motherboard. While not perfect, this board does exactly what it promises at a price that we find amazing for a board based on the Intel P965 chipset. The overall quality of the motherboard and its components are excellent while the feature set and layout is very good. We found the board was rock solid during several weeks of outright abuse in testing along with very good technical support from Foxconn.
We were originally disappointed with the overclocking performance and then realized we were expecting something from this board that was not promised by Foxconn in this series of product. We have grown accustomed to grading a board with the latest technology on its overclocking and pure performance aspects first and then looking at the features, stability, and other aspects of the board. We usually do this based upon how the motherboard is marketed but at times we also expect or demand premium performance at budget prices.
There have been just enough motherboards that have met these expectations to spoil us but they were usually a surprise and not an expectation. We have recently started to readjust our expectations to the point where features, quality, support, and overall platform stability are at the top of the list. Once those are addressed then we will certainly dive headfirst into the performance potential of the motherboard but with our eyes open as to what market the product is intended to reach. This board is intended for the mainstream user who needs stability, a good set of features, basic overclocking potential, and a strong technical support group behind the product. We believe this board is near perfect for that user and those buying the product looking for outrageous overclocks or class leading performance will be disappointed.
Not all is perfect with this board but a few minor issues can be overlooked considering the price/performance considerations. The location of the 8-pin ATX power connector will mean some creative cable routing will be required for the larger air coolers and even the stock unit to some degree. The overclocking capability of both the FSB and memory is limited but up to that limit the board was very stable. This board needs decent DDR2-800 to extract its performance potential but there is no need to purchase expensive kits as CAS 3 timings are not recommended. We had a few ghost issues such as our SATA drives not being recognized at various overclocks with a P4 processor or the Fox One utility occasionally not reporting the correct CPU temperature. One last minor quibble would be the addition of another fan header and Firewire support.
Overall, this is the best P965 motherboard available for under $100. It is not meant for the enthusiast group or even the hardcore gaming user. However, for the mainstream user that needs a high quality and stable Intel platform for general use then we highly recommend the Foxconn P9657AA-8KS2H.


