Original Link: https://www.anandtech.com/show/2075
Fall '06 NVIDIA GPU Refresh - Part I: GeForce 7900 GS
by Derek Wilson on September 6, 2006 9:00 AM EST- Posted in
- GPUs
It's been a while since we've seen any truly new graphics architectures from ATI or NVIDIA. G7x and R5xx GPUs have had quite a long lifespan, dating back to almost 12 months ago for ATI and 15 months for NVIDIA. When you consider that the G7x architecture is really just a refinement of NV4x (similar to how R4xx was a refinement of R3xx), we could even say that NVIDIA's current architecture is almost 2 1/2 years old! That's practically an eternity in the world of GPUs, where for a while we were seeing new architectures every 18 months or less. Things seem to have settled down a bit in terms of architecture progression, but the war for the fastest GPU(s) certainly hasn't tapered off.
During the past two years, we have seen the introduction of SLI and CrossFire as ways to eke more performance out of the current architectures. NVIDIA has lately taken that a step further with quad SLI configurations, or cards like the 7950 GX2 which feature "SLI on a single card". If we were to conservatively estimate the number of variants of the different graphics cards that have been launched in the past two years, it would certainly be over 40. This proliferation of GPU models has been done in an attempt to target all of the various price points, from the $50 budget cards all the way up to the $600 super cards. Microsoft seems intent to get in on the action as well, as Windows Vista will launch with nine different variants at last count.
We bring up Windows Vista for more reasons than one. With Windows Vista will come the launch of DirectX 10, bringing with it an expanded feature set and improved performance. In order to fully support DirectX 10, however, NVIDIA and ATI need to do a decent amount of work on new architectures. This work takes time, although with the delays of Windows Vista perhaps that isn't a bad thing. We expect to see new graphics architectures from both ATI and NVIDIA either late this year or early in 2007, just in time for Windows Vista to start shipping. In the meantime, the battle for consumer dollars wages on.
In order to keep filling in the gaps, improving value, and competing, NVIDIA is following ATI (who followed NVIDIA...) in releasing another run of rebadged graphics solutions. The two new solutions are the 7900 GS launching today, with the 7950 GT scheduled to launch next week. NVIDIA is targeting the $200 and $300 price points (respectively) with these new offerings in two different ways. For the 7900 GS, NVIDIA is disabling vertex/pixel pipelines, while the 7950 GT will be taking advantage of the high overclockability of the G71 chips. Let's take a closer look at what will be offered with the new GPUs.
What's New Today?
Two new cards are making their debut today, but only one will be available as of this publication. The card available today is the GeForce 7900 GS, for which we will also be able to talk about performance. We will have to wait at least a week for the second part of this two part series to talk about the performance of the other new part: the GeForce 7950 GT. The GeForce 7950 GT will be available on September 14th.
Don't be confused by the 7950 moniker: the 7950 GT is a single GPU solution that is slower than a single 7900 GTX. NVIDIA intends for the GX2 postfix to indicate a dual GPU solution, and those who don't do their research might think a higher marketing number means higher performance. GeForce 7950 GT is a horrible name for this card no matter how we slice it. The plan is for this new card to compete with the X1900 XT (512MB) and highly overclocked versions of the 7900 GT, at a price point above $300 USD.
For today's tests, we will have to make do with only the GeForce 7900 GS. This card will come in between $200 and $250 and compete directly with the X1900 GT. Until now, as we saw in our earlier midrange roundup, the X1900 GT had no direct competitor from NVIDIA at its current price point -- at least if you're talking about MSRPs and prices without mail-in rebates. At present, the X1900 GT is selling for $225-$245, with street prices of the 7900 GT ranging from $262-$312 before rebates, depending on clock speed and features. With rebates, 7900 GT cards can be had for as little as $236. That puts the 7900 GS in an interesting position, as it will need to compete with not only the ATI offerings, but it will also have to go against some of NVIDIA's own products. The 7900 GS will certainly have to fall closer to the $200 price point rather than the $250 price point if it is to be successful.
Both companies have some other products falling close to the $200 price point. ATI offers the X1800 GTO, and you can sometimes find X1800 XL and XT cards carrying similar prices. Availability of some of these parts is sketchy at best, so they are not the primary focus of our current GPU articles. NVIDIA also offers 7600 GT cards ranging in price from $167 ($132 with MIR) to $219. Depending on the performance the 7900 GS offers, we may see 7600 GT prices drop in the coming weeks.
This is obviously a crowded market, and NVIDIA is absolutely hoping that the 7900 GS (and factory overclocked variants) will be able to reclaim the performance and value lead at this very important price point. It is somewhat interesting (humorous?) to note that NVIDIA's literature compares the 7900 GS to the X1800 GTO, which obviously isn't the right comparison to make. Of course we will be running our own performance tests, and in our attempt to discover whether or not NVIDIA has succeeded in recapturing the lead of the mainstream $200 segment, we have an XFX 7900 GS that we will run through our benchmark suite.
XFX Card and Competitors
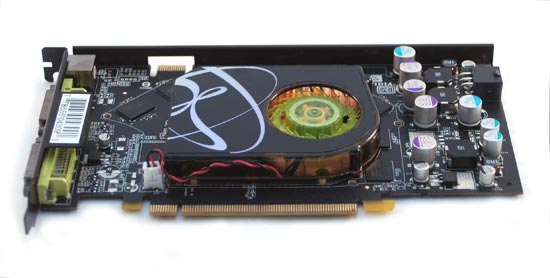
XFX's card comes slightly overclocked, so in order to provide a look at standard 7900 GS performance we used the Coolbits registry tweak and forced the card to stock clock speeds. We will include both the stock and overclocked results in our performance testing. The 480M Extreme comes with a 480MHz core clock and a 700MHz (1400MHz data rate) memory clock. Here's a quick look at the XFX card.
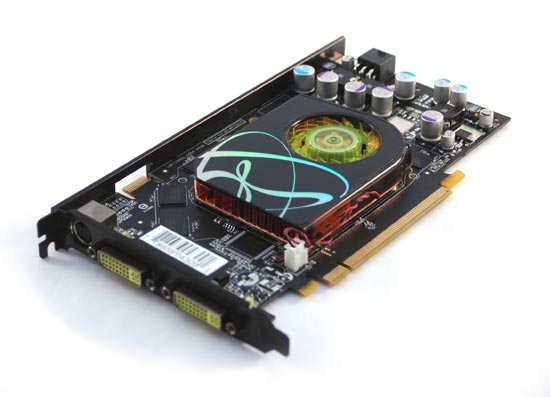
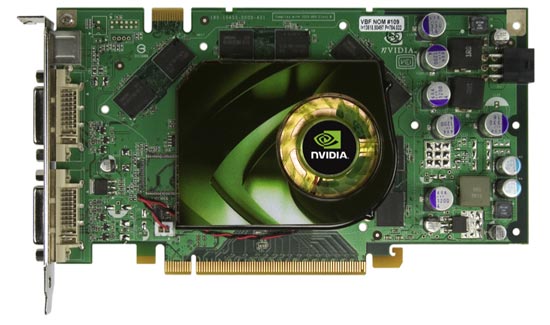
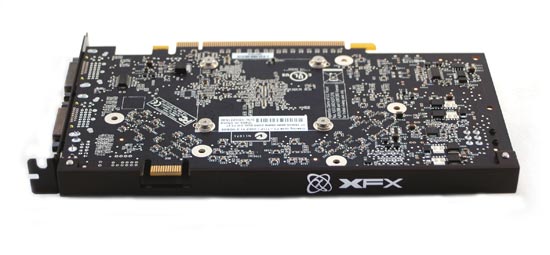
While the sleek black PCB and XFX logo will obviously be different depending on the manufacturer, we can expect the same basic card design to carry over to other manufacturers. It should come as little surprise that the 7900 GS PCB is identical to the 7900 GT PCB, as is the heatsink. By sticking with the same circuit board, NVIDIA is able to keep board costs down as well as decrease the time to market.
All of the features for the 7900 GS are also the same as the 7900 GT. PureVideo/PureVideo HD are supported, up to XHD resolutions (2560x1600) are possible, Shader Model 3.0, HDR, transparency antialiasing, and SLI support are all features of the G70/71/73 series of GPUs. HDCP support is also available, but the actual implementation is left up to the card manufacturers. In order to take advantage of HDCP output, you will need a card with an HDCP chip, an HDCP monitor, and a media player that supports the standard (InterVideo and CyberLink both have players available for Windows XP, while Microsoft will wait for Windows Vista to include built in HDCP support).
As we mentioned, this is a very crowded market and there's definitely overlap between many of the products offered. In order to help keep things straight, we've created a table showing the features and specifications of the various cards we will be testing, along with the 7950 GT which we will test in the near future.
| NVIDIA Graphics Card Specifications | ||||||||
Vert Pipes |
Pixel Pipes |
Raster Pipes |
Core Clock |
Mem Clock |
Mem Size (MB) |
Mem Bus (bits) |
Price |
|
| GeForce 7950 GX2 | 8x2 |
24x2 |
16x2 |
500x2 |
600x2 |
512x2 |
256x2 |
$600 |
| GeForce 7900 GTX | 8 |
24 |
16 |
650 |
800 |
512 |
256 |
$450 |
| GeForce 7950 GT | 8 |
24 |
16 |
550 |
700 |
512 |
256 |
$300-$350 |
| GeForce 7900 GT | 8 |
24 |
16 |
450 |
660 |
256 |
256 |
$280 |
| GeForce 7900 GS | 7 |
20 |
16 |
450 |
660 |
256 |
256 |
$200-$250 |
| GeForce 7600 GT | 5 |
12 |
8 |
560 |
700 |
256 |
128 |
$160 |
| GeForce 7600 GS | 5 |
12 |
8 |
400 |
400 |
256 |
128 |
$120 |
| GeForce 7300 GT | 4 |
8 |
2 |
350 |
667 |
128 |
128 |
$100 |
| GeForce 7300 GS | 3 |
4 |
2 |
550 |
400 |
128 |
64 |
$65 |
| ATI Graphics Card Specifications | ||||||||
Vert Pipes |
Pixel Pipes |
Raster Pipes |
Core Clock |
Mem Clock |
Mem Size (MB) |
Mem Bus (bits) |
Price |
|
| Radeon X1950 XTX | 8 |
48 |
16 |
650 |
1000 |
512 |
256 |
$450 |
| Radeon X1900 XTX | 8 |
48 |
16 |
650 |
775 |
512 |
256 |
$375 |
| Radeon X1900 XT | 8 |
48 |
16 |
625 |
725 |
256/512 |
256 |
$280/$350 |
| Radeon X1900 GT | 8 |
36 |
12 |
525 |
600 |
256 |
256 |
$230 |
| Radeon X1650 Pro | 5 |
12 |
4 |
600 |
700 |
256 |
128 |
$99 |
| Radeon X1600 XT | 5 |
12 |
4 |
590 |
690 |
256 |
128 |
$150 |
| Radeon X1600 Pro | 5 |
12 |
4 |
500 |
400 |
256 |
128 |
$100 |
| Radeon X1300 XT | 5 |
12 |
4 |
500 |
400 |
256 |
128 |
$89 |
| Radeon X1300 Pro | 2 |
4 |
4 |
450 |
250 |
256 |
128 |
$79 |
The 7900 GS is identical to the stock 7900 GT in clock speeds. The difference is that it comes with one less vertex pipeline and four fewer pixel pipelines. It also comes with an MSRP of $199 compared to $299 for the 7900 GT, so while it may offer slightly lower performance, the difference in price appears likely to make it a more attractive card for many people. In raw pixel processing power, the additional pipelines make the 7900 GT potentially up to 20% faster, which is in line with the price difference we expect to see. We will take a closer look at how the GT compares to the GS later to see if this approximation is accurate.
The Test
Coming up with an ideal testbed for graphics card comparisons has become a bit tricky of late. In the past, we used AMD Athlon 64/X2 configurations as these were the highest performing platforms. We had the added benefit of being able to run SLI and/or CrossFire with the best chipset options for the respective GPUs. Intel's Core 2 Duo launch has muddied the waters somewhat, as we are now stuck with testing CrossFire on a non-ATI chipset, and SLI testing with Core 2 Duo requires that we use a somewhat outdated nForce4 SLI X16-based motherboard. NForce 590 SLI for Intel will become available in the near future, and although the primary difference will be in features, performance may also be better.
In the end, decisions have to be made on how to test our GPUs, and compromises may be necessary. For now, we have restricted testing to single PCI-E X16 solutions. When we provide the second part of this GPU launch covering the 7950 GT, we will also take a look at CrossFire and SLI performance from the various offerings. Here's the test configuration we used.
| CPU: | Intel Core 2 Extreme X6800 (2.93GHz/4MB) |
| Motherboard: | Intel D975XBX (LGA-775) |
| Chipset: | Intel 975X |
| Chipset Drivers: | Intel 7.2.2.1007 (Intel) |
| Hard Disk: | Seagate 7200.7 160GB SATA |
| Memory: | Corsair XMS2 DDR2-800 4-4-4-12 (1GB x 2) |
| Video Card: | Various |
| Video Drivers: | ATI Catalyst 6.8 NVIDIA ForceWare 91.47 |
| Desktop Resolution: | 1920 x 1440 - 32-bit @ 60Hz |
| OS: | Windows XP Professional SP2 |
The games we have chosen to test represent a wide variety of engines and styles. We are testing 7 games today due to the time constraints of this article. As the interest in HDR and advanced visual effects continues to rise, the tradeoff required for antialiasing is often overshadowed by the quality available from other options. This is especially true in games like Splinter Cell: Chaos Theory, Oblivion, and Black & White 2. In every game but Splinter Cell: Chaos Theory and Oblivion, we will be testing with and without 4x antialiasing. These games really shine when HDR is enabled, so we won’t bother disabling it.
In reporting our results, in hopes to increase readability, we will be including a snapshot of one resolution using our standard graphing engine graphs along side a resolution scaling line graph.
GeForce 7900 Battle: GT vs. GS
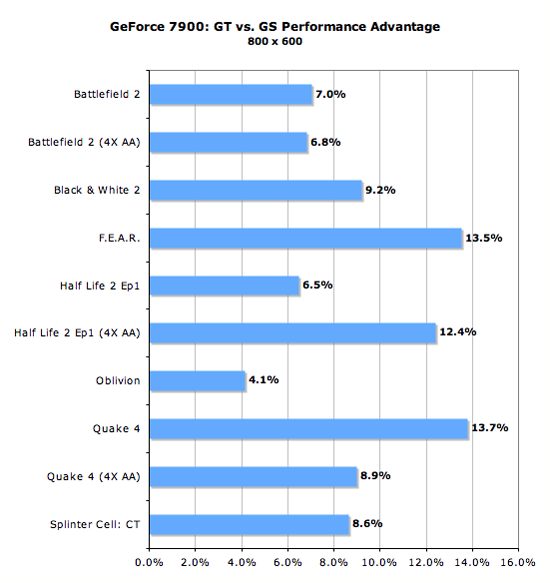
With equivalent stock clock speeds and potential 14% and 20% advantages in vertex and pixel processing respectively, we have the opportunity to better understand how G71 scales with parallelism. The following graphs are percent increases in performance from the 7900 GS to the 7900 GT for teach game at each resolution tested.
800 x 600 1024 x 768 1280x1024 1600x1200 1920x1440
The 7900 GT shows at most a 15% performance improvement over the 7900 GS in our testing. The largest performance improvement is under Oblivion at a relatively low resolution. Most of the biggest improvements seem to appear at 1024x768. As we increase resolutions, we become more bandwidth limited, and with both cards offering the same amount and speed of memory the scores begin to tighten up. Interestingly, Half-Life 2 shows zero performance difference between the GS and GT at higher resolutions. These cards are by no means CPU bound under such conditions, so we seem to have run into a bandwidth bottleneck.
XFX 480M Extreme vs. Stock Performance
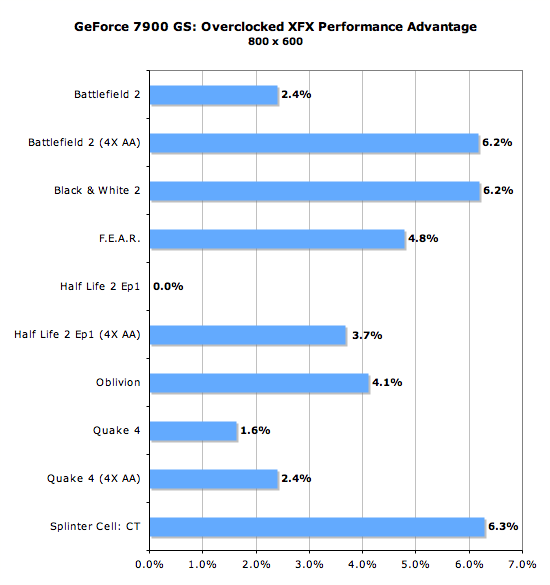
We are quite interested in understanding the scalability of this new 7 vertex pipe, 5 quad configuration. In order to demonstrate the performance increase we can expect from overclocked 7900 GS parts, we've run percent increase numbers from stock performance to the performance we measured with the XFX 480M Extreme version.
800 x 600 1024 x 768 1280x1024 1600x1200 1920x1440
Interestingly, it seems like the largest performance difference between our stock and overclocked 7900 GS cards occurs at 1024x768. With a 6.7% core clock boost and a 6% memory clock increase, the XFX 480M Extreme is able to consistently perform over 6% faster than its stock brethren. The increased clocks allow for an increase in performance of up to 12% if a game makes full use of both memory bandwidth and pure processing power. Note, that the maximum theoretical performance increase shouldn't simply be memory clock percent increase added to core clock percent increase: it's a much more complex relationship that we can't explain without intimate knowledge of how NVIDIA handles latency hiding, data moving, and scheduling.
With Oblivion, we hit over a 11% increase. This indicates that the latest Elder Scrolls game is very tough on all aspects of a graphics card. The fact that the game reflects a very higher performance increase can also be explained by the higher than normal variance of our FRAPS test with Oblivion.
Battlefield 2 Performance
This benchmark is performed using DICE's built in demo playback functionality with a few added extras built in house. When using the built in demo playback features of BF2, frames rendered during the loading screen are counted in the benchmark. In order to get a real idea of performance, we use the instantaneous frametime and frames per second data generated from a benchmark run. We discard the data collected during the loading screen and calculate a result that represents the actual gameplay that was benchmarked. While DICE maintains that results over 100fps aren't reliable, our methods have allowed us to get useful data from high performing systems.
During the benchmark, the camera switches between players and vehicles in order to capture the most action possible. There is a lot of smoke and explosions, so this is a very GPU intensive Battlefield 2 benchmark. The game itself is best experienced with average in-game framerates of 35 and up.
We ran Battlefield 2 using the highest quality graphics settings we could. Shadows, lighting, and especially view distance are very important in order to best play the game. In our opinion view distance should never be set to less than the max, but other settings can be decreased slightly if a little more performance or a higher resolution is required.
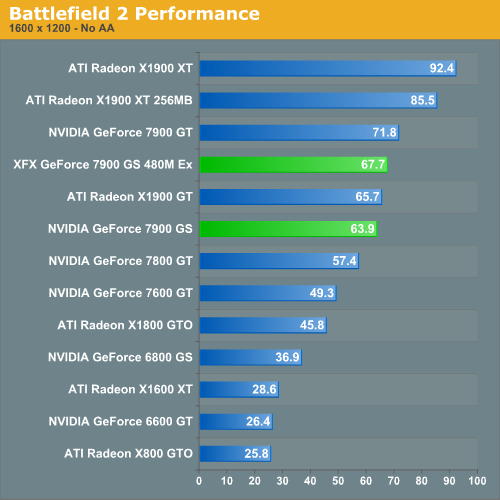
For a little less money, the overclocked 7900 GS delivers a little more performance than the X1900 GT under Battlefield 2. It seems like the X1900 GT may have a CPU limited advantage here, but at higher resolutions the XFX 7900 GS can deliver about 6% higher performance under the highest settings (without AA) for slightly less money. The X1900 GT is more competitive with the stock 7900 GS, but the advantage NVIDIA has in this case is in value.
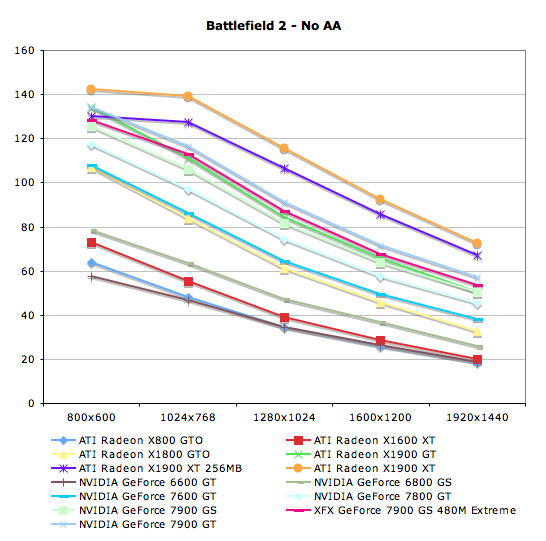
| Battlefield 2 Performance - No AA | |||||
800x600 |
1024x768 |
1280x1024 |
1600x1200 |
1920x1440 |
|
| ATI Radeon X800 GTO | 63.9 |
48.2 |
34.3 |
25.8 |
18.6 |
| ATI Radeon X1600 XT | 72.9 |
55.4 |
39.1 |
28.6 |
20.1 |
| ATI Radeon X1800 GTO | 107.1 |
83.9 |
61.1 |
45.8 |
32.5 |
| ATI Radeon X1900 GT | 134 |
111.1 |
84.3 |
65.7 |
50.2 |
| ATI Radeon X1900 XT 256MB | 130.1 |
127.5 |
106.6 |
85.5 |
66.9 |
| ATI Radeon X1900 XT | 142.4 |
139.2 |
115.4 |
92.4 |
72.7 |
| NVIDIA GeForce 6600 GT | 57.7 |
46.5 |
34.6 |
26.4 |
18.7 |
| NVIDIA GeForce 6800 GS | 78.6 |
63.6 |
47.3 |
36.9 |
25.9 |
| NVIDIA GeForce 7600 GT | 108 |
86.3 |
64.3 |
49.3 |
38.2 |
| NVIDIA GeForce 7800 GT | 117.2 |
96.8 |
74.4 |
57.4 |
45.2 |
| NVIDIA GeForce 7900 GS | 125.4 |
105.9 |
81.8 |
63.9 |
50.2 |
| XFX GeForce 7900 GS 480M Extreme | 128.4 |
112.7 |
87.1 |
67.7 |
53.3 |
| NVIDIA GeForce 7900 GT | 134.2 |
116.6 |
91.2 |
71.8 |
57 |
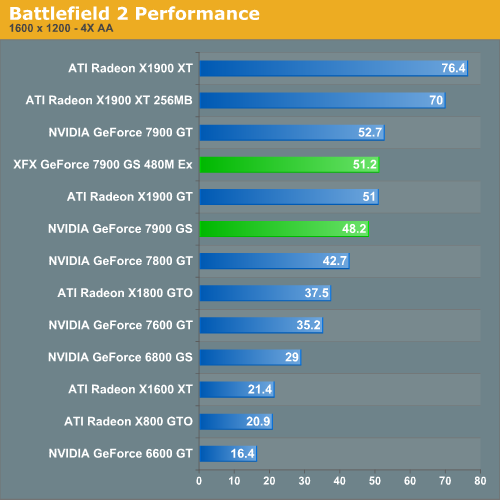
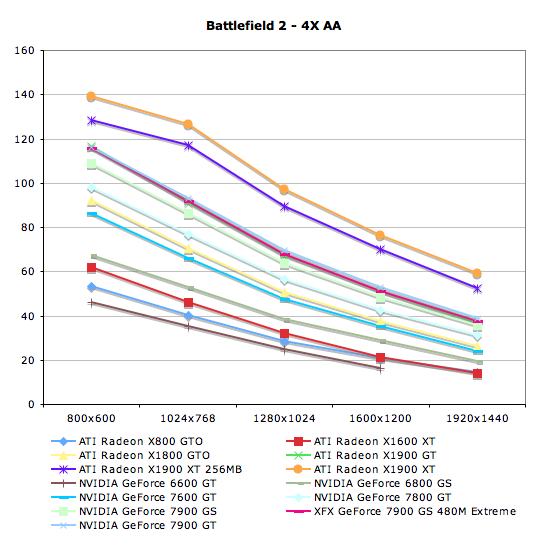
With AA enabled, the X1900 GT closes the gap on the overclocked 7900 GS and outperforms the stock version. When all is said and done, the XFX 480M offers performance and value at least at the level of the X1900 GT in BF2. For those who wish to save the extra $20, the performance hit for not choosing the overclocked model is not huge. Which is the better deal will have to come down to personal preference and/or finance.
| Battlefield 2 Performance - 4X AA | |||||
800x600 |
1024x768 |
1280x1024 |
1600x1200 |
1920x1440 |
|
| ATI Radeon X800 GTO | 53.4 |
40.1 |
28.3 |
20.9 |
14.6 |
| ATI Radeon X1600 XT | 61.8 |
45.9 |
32.3 |
21.4 |
14.1 |
| ATI Radeon X1800 GTO | 92.2 |
70.4 |
50.6 |
37.5 |
26.1 |
| ATI Radeon X1900 GT | 116.6 |
91.4 |
67.2 |
51 |
36.8 |
| ATI Radeon X1900 XT 256MB | 128.2 |
117.2 |
89.4 |
70 |
52.6 |
| ATI Radeon X1900 XT | 139.2 |
126.5 |
97.3 |
76.4 |
59.4 |
| NVIDIA GeForce 6600 GT | 46.1 |
35.2 |
25 |
16.4 |
|
| NVIDIA GeForce 6800 GS | 67.2 |
52.7 |
38.3 |
29 |
19.6 |
| NVIDIA GeForce 7600 GT | 86.4 |
66.2 |
47.3 |
35.2 |
24.1 |
| NVIDIA GeForce 7800 GT | 97.9 |
77 |
56.7 |
42.7 |
31.2 |
| NVIDIA GeForce 7900 GS | 108.9 |
86.2 |
63.7 |
48.2 |
35.5 |
| XFX GeForce 7900 GS 480M Extreme | 115.6 |
91.7 |
67.6 |
51.2 |
37.7 |
| NVIDIA GeForce 7900 GT | 116.3 |
93.3 |
69.4 |
52.7 |
38.7 |
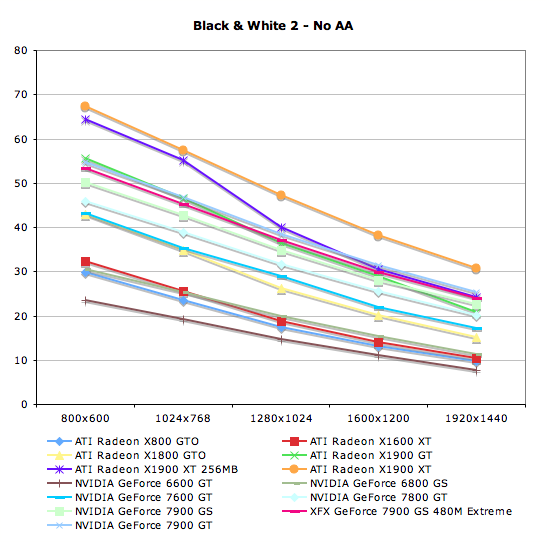
Black & White 2 Performance
The AnandTech benchmark for Black & White 2 is a FRAPS benchmark. Between the very first tutorial land and the second land there is a pretty well rounded cut scene rendered in-game. This benchmark is indicative of real world performance in Black & White 2. We are able to see many of the commonly rendered objects in action. The most stressful part of the benchmark is a scene where hundreds of soldiers come running over a hill, which really pounds the geometry capabilities of these cards. At launch, ATI cards were severely out matched when it came to B&W2 performance because of this scene, but two patches applied to the game and quite a few Catalyst revisions later give ATI cards a much needed boost in performance over what we first saw.
A desirable average framerate for Black & White 2 is anything over 20 fps. The game does remain playable down to the 17-19 fps range, but we usually start seeing the occasional annoying hiccup during gameplay here. While this isn't always a problem as far as getting things done and playing the game, any jerkiness in frame rate degrades the overall experience.
We did test with all the options on the highest quality settings under the custom menu. Antialiasing has quite a high performance hit in this game, and is generally not worth it at high resolutions unless the game is running on a super powerhouse of a graphics card. If you're the kind of person who just must have AA enabled, you'll have to settle for a little bit lower resolution than we tend to like on reasonably priced graphics card. Black & White 2 is almost not worth playing at low resolutions without AA, depth of field, or bloom enabled. At that point, we tend to get image quality that resembles the original Black & White. While various people believe that the original was a better game, no one doubts the superiority of B&W2's amazing graphics.
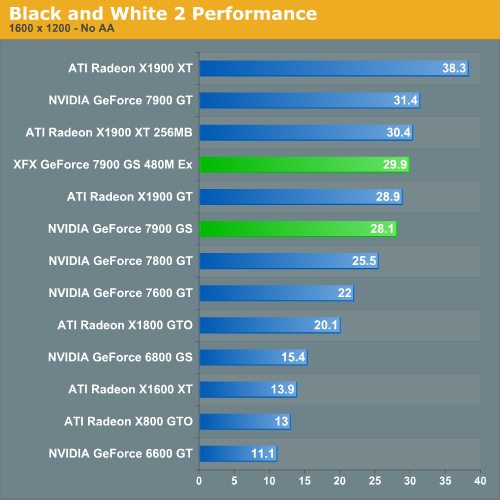
While spending $200 or more will earn you playable performance at up to 1920x1440 without AA under Black & White 2, the X1900 GT does fall a bit short due to its slightly higher price tag and slightly lower performance compared to the overclocked 7900 GS. As with Battlefield 2, the stock and overclocked 7900 GS parts mostly sandwich the performance of the X1900 GT. This is pretty impressive considering there is only about a 6% difference between the stock and XFX cards in the performance of most games.
| Black & White 2 - No AA | |||||
800x600 |
1024x768 |
1280x1024 |
1600x1200 |
1920x1440 |
|
| ATI Radeon X800 GTO | 29.9 |
23.5 |
17.4 |
13 |
9.7 |
| ATI Radeon X1600 XT | 32.3 |
25.5 |
18.7 |
13.9 |
10.3 |
| ATI Radeon X1800 GTO | 43 |
34.7 |
26.3 |
20.1 |
15.2 |
| ATI Radeon X1900 GT | 55.7 |
46.5 |
36.4 |
28.9 |
20.9 |
| ATI Radeon X1900 XT 256MB | 64.5 |
55.2 |
40.1 |
30.4 |
24.1 |
| ATI Radeon X1900 XT | 67.3 |
57.5 |
47.2 |
38.3 |
30.7 |
| NVIDIA GeForce 6600 GT | 23.5 |
19.2 |
14.7 |
11.1 |
7.7 |
| NVIDIA GeForce 6800 GS | 30.5 |
25.4 |
19.8 |
15.4 |
11.2 |
| NVIDIA GeForce 7600 GT | 43.1 |
35.3 |
28.9 |
22 |
17.2 |
| NVIDIA GeForce 7800 GT | 45.8 |
38.8 |
31.6 |
25.5 |
20.2 |
| NVIDIA GeForce 7900 GS | 50.2 |
42.7 |
34.9 |
28.1 |
22.5 |
| XFX GeForce 7900 GS 480M Extreme | 53.3 |
45.3 |
37.1 |
29.9 |
23.9 |
| NVIDIA GeForce 7900 GT | 54.8 |
46.8 |
38.5 |
31.4 |
25.2 |
The Elder Scrolls IV: Oblivion Performance
While it is disappointing that Oblivion doesn't have a built in benchmark, our FRAPS tests have proven to be fairly repeatable and very intensive on every part of a system. While these numbers will reflect real world playability of the game, please remember that our test system uses the fastest processor we could get our hands on. If a purchasing decision is to be made using Oblivion performance alone, please check out our two articles on the CPU and GPU performance of Oblivion. We have used the most graphically intensive benchmark in our suite, but the rest of the platform will make a difference. We can still easily demonstrate which graphics card is best for Oblivion even if our numbers don't translate to what our readers will see on their systems.
Running through the forest towards an Oblivion gate while fireballs fly by our head is a very graphically taxing benchmark. In order to run this benchmark, we have a saved game that we load and run through with FRAPS. To start the benchmark, we hit "q" which just runs forward, and start and stop FRAPS at predetermined points in the run. While not 100% identical each run, our benchmark scores are usually fairly close. We run the benchmark a couple times just to be sure there wasn't a one time hiccup.
As for settings, we tested a few different configurations and decided on this group of options:
| Oblivion Performance Settings | |
| Texture Size | Large |
| Tree Fade | 60% |
| Actor Fade | 20% |
| Item Fade | 10% |
| Object Fade | 25% |
| Grass Distance | 30% |
| View Distance | 100% |
| Distant Land | On |
| Distant Buildings | On |
| Distant Trees | On |
| Interior Shadows | 45% |
| Exterior Shadows | 20% |
| Self Shadows | Off |
| Shadows on Grass | Off |
| Tree Canopy Shadows | Off |
| Shadow Filtering | High |
| Specular Distance | 80% |
| HDR Lighting | On |
| Bloom Lighting | Off |
| Water Detail | Normal |
| Water Reflections | On |
| Water Ripples | On |
| Window Reflections | On |
| Blood Decals | High |
| Anti-aliasing | Off |
Our goal was to get acceptable performance levels under the current generation of cards at 1600x1200. This was fairly easy with the range of cards we tested here. These settings are amazing and very enjoyable. While more is better in this game, no current computer will give you everything at high res. Only the best multi-GPU solution and a great CPU are going to give you settings like the ones we have at high resolutions, but who cares about grass distance, right?
While very graphically intensive, and first person, this isn't a twitch shooter. Our experience leads us to conclude that 20fps gives a good experience. It's playable a little lower, but watch out for some jerkiness that may pop up. Getting down to 16fps and below is a little too low to be acceptable. The main point to bring home is that you really want as much eye candy as possible. While Oblivion is an immersive and awesome game from a gameplay standpoint, the graphics certainly help draw the gamer in.
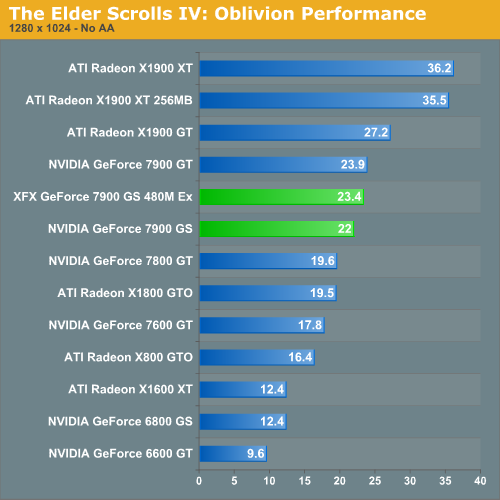
ATI's X1900 GT outperforms NVIDIA's latest midrange offering under Oblivion with our midrange detail settings. In general, ATI's architecture performs better under Oblivion than NVIDIA's, though much of the choppiness has gone away with newer drivers and the game's 1.1 patch. While framerates of under 20 can remain playable for Oblivion on the PC, the extra headroom of the X1900 GT might just allow for the all important increase in Actor and Object distances. If Oblivion performance is highly important, then the 7900 GS (in either stock or overclocked form) falls short of the competition.
The 7900 GS does perform better than the X1800 GTO, which is at least something. An X1800 XL or XT would certainly outperform the 7900 GS though.
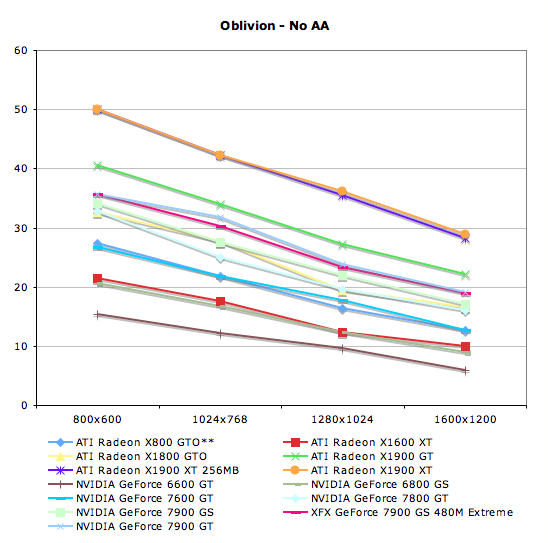
**The X800 GTO does not support SM3.0, and thus was run without HDR enabled.
| The Elder Scrolls IV: Oblivion - No AA | ||||
800x600 |
1024x768 |
1280x1024 |
1600x1200 |
|
| ATI Radeon X800 GTO | 27.4 |
21.8 |
16.4 |
12.6 |
| ATI Radeon X1600 XT | 21.5 |
17.6 |
12.4 |
9.9 |
| ATI Radeon X1800 GTO | 32.7 |
27.7 |
19.5 |
16.6 |
| ATI Radeon X1900 GT | 40.5 |
34 |
27.2 |
22.2 |
| ATI Radeon X1900 XT 256MB | 50 |
42.3 |
35.5 |
28.2 |
| ATI Radeon X1900 XT | 50 |
42.3 |
36.2 |
28.9 |
| NVIDIA GeForce 6600 GT | 15.4 |
12.1 |
9.6 |
5.9 |
| NVIDIA GeForce 6800 GS | 20.6 |
16.7 |
12.4 |
8.9 |
| NVIDIA GeForce 7600 GT | 26.7 |
21.8 |
17.8 |
12.7 |
| NVIDIA GeForce 7800 GT | 32.8 |
25 |
19.6 |
16 |
| NVIDIA GeForce 7900 GS | 34.2 |
27.5 |
22 |
17.1 |
| XFX GeForce 7900 GS 480M Extreme | 35.6 |
30.3 |
23.4 |
19 |
| NVIDIA GeForce 7900 GT | 35.6 |
31.7 |
23.9 |
19.1 |
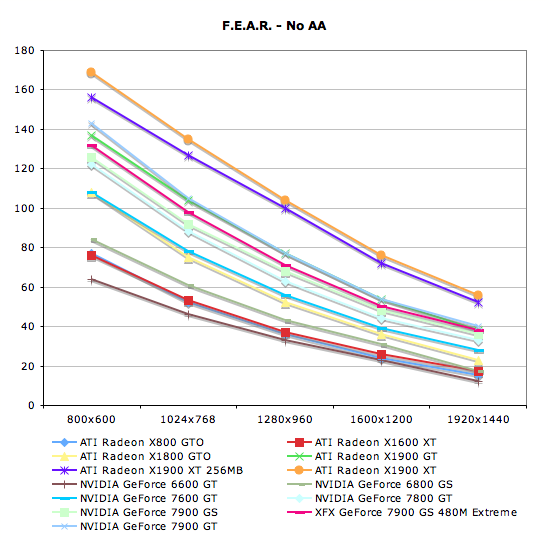
F.E.A.R. Performance
F.E.A.R. has a built in test that we make use of in this performance analysis. This test flies through some action as people shoot each other and things blow up. F.E.A.R. is very heavy on the graphics, and we enable most of the high end settings for our test.
During our testing of F.E.A.R., we noted that the "soft shadows" don't really look soft. They jumped out at us as multiple layers of transparent shadows layered on top of each other and jittered to appear soft. Unfortunately, this costs a lot in performance and not nearly enough shadows are used to make this look realistic. Thus, we disable soft shadows in our test even though its one of the large performance drains on the system.
Again we tested with anisotropic filtering at 8x, and all options were on their highest quality (with the exception of soft shadows which was disabled). Frame rates for F.E.A.R. can get pretty low for a first person shooter, but the game does a good job of staying playable down to about 25 fps.
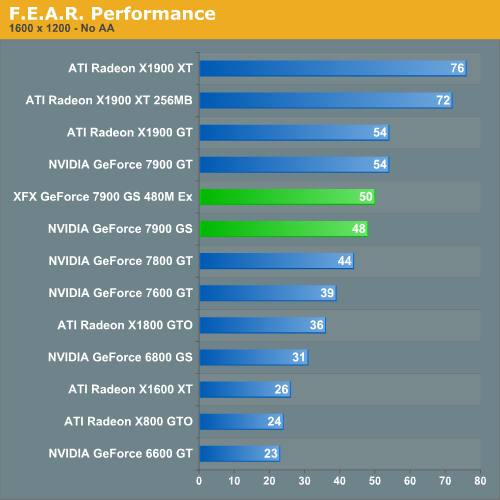
The X1900 GT maintains an advantage through out this DirectX 9 based title. While the overclocked XFX M480 7900 GS is able to just catch up at 1920x1440, the cost savings and promise of SLI of the NVIDIA based cards are only enough to call this a toss up in the value category.
| F.E.A.R. - No AA | |||||
800x600 |
1024x768 |
1280x1024 |
1600x1200 |
1920x1440 |
|
| ATI Radeon X800 GTO | 77 |
52 |
36 |
24 |
15 |
| ATI Radeon X1600 XT | 76 |
53 |
37 |
26 |
17 |
| ATI Radeon X1800 GTO | 108 |
75 |
52 |
36 |
23 |
| ATI Radeon X1900 GT | 137 |
104 |
77 |
54 |
38 |
| ATI Radeon X1900 XT 256MB | 156 |
127 |
100 |
72 |
52 |
| ATI Radeon X1900 XT | 169 |
135 |
104 |
76 |
56 |
| NVIDIA GeForce 6600 GT | 64 |
46 |
33 |
23 |
12 |
| NVIDIA GeForce 6800 GS | 84 |
61 |
43 |
31 |
17 |
| NVIDIA GeForce 7600 GT | 108 |
78 |
56 |
39 |
28 |
| NVIDIA GeForce 7800 GT | 122 |
88 |
63 |
44 |
33 |
| NVIDIA GeForce 7900 GS | 126 |
92 |
68 |
48 |
36 |
| XFX GeForce 7900 GS 480M Extreme | 132 |
98 |
71 |
50 |
38 |
| NVIDIA GeForce 7900 GT | 143 |
105 |
77 |
54 |
40 |
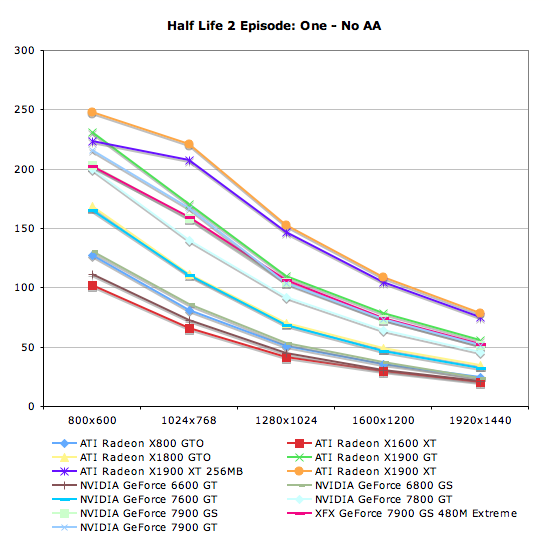
Half-Life 2: Episode One Performance
Episode One of the new Half-Life 2 series makes use of recent Source engine updates to include Valve's HDR technology. While some people have done HDR that won't allow antialiasing (even on ATI cards), Valve put a high value on building an HDR implementation that everyone can use with whatever settings they want. Consistency of experience is usually not important enough to developers who care about pushing the bleeding edge of technology, so we are very happy to see Valve going down this path.
We use the built-in timedemo feature to benchmark the game. Our timedemo consists of a protracted rocket launcher fight and features much debris and pyrotechnics. The source engine timedemo feature is more like the nettimedemo of Id's Doom 3 engine, in that it plays back more than just the graphics. In fact, Valve includes some fairly intensive diagnostic tools that will reveal almost everything about every object in a scene. We haven't found a good use for this in the context of reviewing computer hardware, but our options are always open.
The highest visual quality settings possible were used including the "reflect all" setting which is normally not enabled by default, and anisotropic filtering was set at 8x. While the Source engine is notorious for giving great framerates for almost any hardware setup, we find the game isn't as enjoyable if it isn't running at at least 30fps. This is very attainable even at the highest resolution we tested on most cards, and thus our target framerate is a little higher in this game than others.
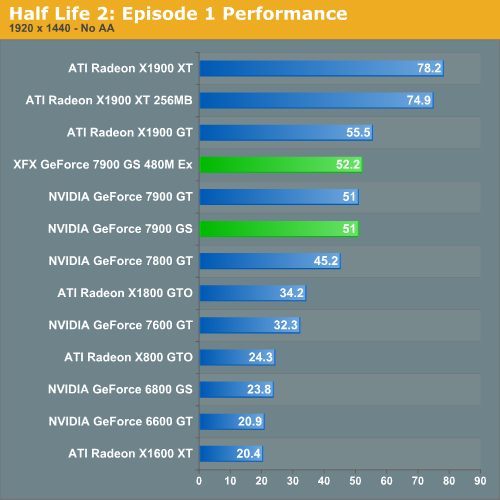
Under Half-Life 2 with Valve's HDR enabled, ATI rises to the top. The X1900 GT shows a sustainable advantage across the board. Of course, all of these cards are playable at the highest settings. The value of a few frames per second is completely up to the end user, but a narrow margin of victory is not as important with the Source engine as it in other cases.
| Half Life 2: Episode One - No AA | |||||
800x600 |
1024x768 |
1280x1024 |
1600x1200 |
1920x1440 |
|
| ATI Radeon X800 GTO | 126.9 |
81.2 |
50.4 |
35.1 |
24.3 |
| ATI Radeon X1600 XT | 102.3 |
65.8 |
41 |
29.1 |
20.4 |
| ATI Radeon X1800 GTO | 168.9 |
111.2 |
69.6 |
48.7 |
34.2 |
| ATI Radeon X1900 GT | 231.1 |
170.6 |
109.7 |
78.4 |
55.5 |
| ATI Radeon X1900 XT 256MB | 223.4 |
206.9 |
146.7 |
104.8 |
74.9 |
| ATI Radeon X1900 XT | 247.7 |
220.9 |
152.6 |
109.1 |
78.2 |
| NVIDIA GeForce 6600 GT | 110.9 |
72.1 |
44.7 |
30.6 |
20.9 |
| NVIDIA GeForce 6800 GS | 130.4 |
86.3 |
53.4 |
37.2 |
23.8 |
| NVIDIA GeForce 7600 GT | 164.8 |
110 |
68.1 |
46.6 |
32.3 |
| NVIDIA GeForce 7800 GT | 200.1 |
140 |
92 |
64.1 |
45.2 |
| NVIDIA GeForce 7900 GS | 203 |
158.3 |
104.5 |
73 |
51 |
| XFX GeForce 7900 GS 480M Extreme | 202.6 |
159.2 |
105.8 |
74.2 |
52.2 |
| NVIDIA GeForce 7900 GT | 216.1 |
166.9 |
103.9 |
73.2 |
51 |
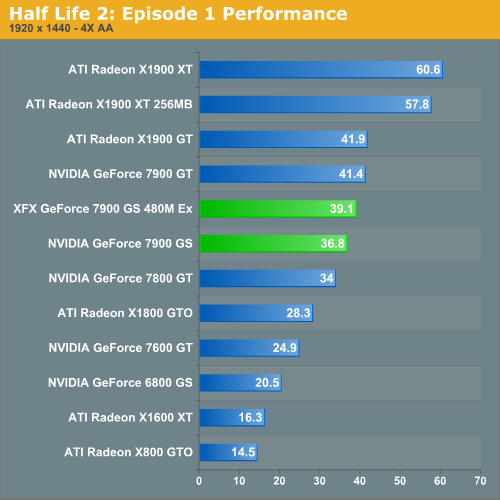
Interestingly, when we enable AA, NVIDIA becomes more competitive. This is not usually the case, and especially not with HL2. At higher resolutions, ATI's X1900 GT does retake the performance lead from the overclocked 7900 GS, but even the stock 7900 GS remains competitive up through 1600x1200.
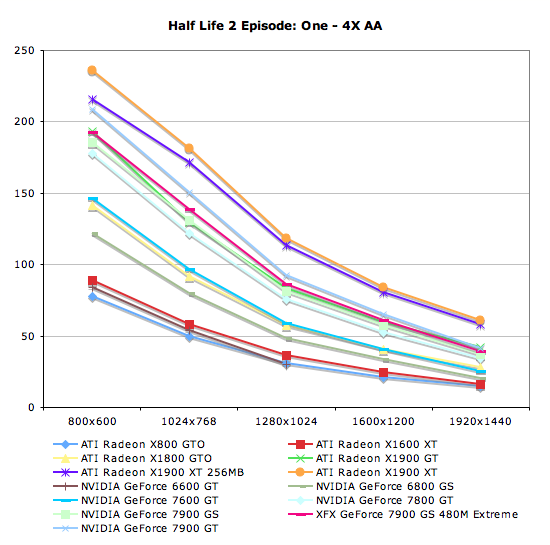
| Half Life 2: Episode One - 4X AA | |||||
800x600 |
1024x768 |
1280x1024 |
1600x1200 |
1920x1440 |
|
| ATI Radeon X800 GTO | 77.5 |
49.7 |
30.5 |
21.3 |
14.5 |
| ATI Radeon X1600 XT | 89.2 |
57.8 |
36.4 |
24.5 |
16.3 |
| ATI Radeon X1800 GTO | 141.3 |
91.4 |
57.7 |
40.4 |
28.3 |
| ATI Radeon X1900 GT | 193.1 |
129.8 |
83.3 |
59.6 |
41.9 |
| ATI Radeon X1900 XT 256MB | 215.8 |
171.6 |
113.5 |
80.3 |
57.8 |
| ATI Radeon X1900 XT | 235.8 |
181.4 |
118.5 |
84.2 |
60.6 |
| NVIDIA GeForce 6600 GT | 83.7 |
54.1 |
30 |
||
| NVIDIA GeForce 6800 GS | 121.6 |
79.9 |
48.5 |
33.6 |
20.5 |
| NVIDIA GeForce 7600 GT | 146.7 |
96.4 |
58.6 |
40.4 |
24.9 |
| NVIDIA GeForce 7800 GT | 177.6 |
121.5 |
75.5 |
52.8 |
34 |
| NVIDIA GeForce 7900 GS | 185.7 |
131 |
81.3 |
57.1 |
36.8 |
| XFX GeForce 7900 GS 480M Extreme | 192.5 |
139 |
86.4 |
60.8 |
39.1 |
| NVIDIA GeForce 7900 GT | 208.7 |
150.4 |
92.1 |
65 |
41.4 |
Quake 4 Performance
There has always been a lot of debate in the community surrounding pure timedemo benchmarking. We have opted to stick with the timedemo test rather than the nettimedemo option for benchmarking Quake 4. To be clear, this means our test results focus mostly on the capability of each graphics card to render frames generated by Quake 4. The frame rates we see here don't directly translate into what one would experience during game play.
Additionally, Quake 4 limits frame rate to 60 fps during gameplay whether or not VSync is enabled. Performance characteristics of a timedemo do not reflect actual gameplay. So why do we do them? Because the questions we are trying to answer have only to do with the graphics subsystem. We want to know what graphics card is better at rendering Quake 4 frames. Any graphics card that does better at rendering Quake 4 frames will play Quake 4 better than another card for Quake 4. While that doesn't mean the end user will see higher performance in the game, it does mean that the potential for seeing more performance is there. For instance, if the user upgrades a CPU before the next graphics card upgrade.
What this means to the end user is that in-game performance will almost always be lower than timedemo performance. It also means that graphics cards that do slightly better than other graphics cards will not always show a tangible performance increase on an end user's system. As long as we keep these things in mind, we can make informed conclusions based on the data we collect.
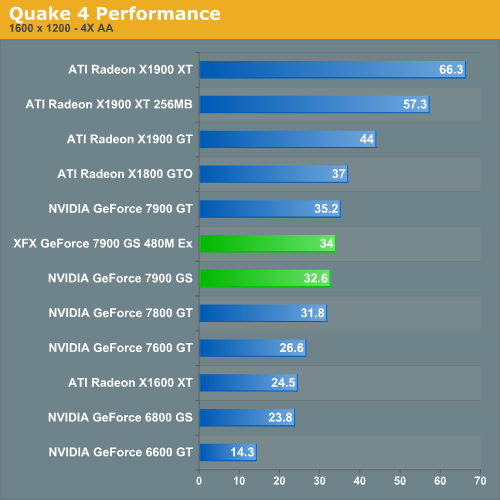
Our benchmark consists of the first few minutes of the first level. This includes both inside and outdoor sections, with the initial few fire fights. We tested the game with Ultra Quality settings (uncompressed normal maps), and we enabled all the advanced graphics options except for VSync. Id does a pretty good job of keeping framerate very consistent, and so in-game framerates of 25 are acceptable. While we don't have the ability to make a direct mapping to what that means in the timedemo test, our experience indicates that a timedemo fps of about 35 translates into an enjoyable experience on our system. This will certainly vary on other systems, so take it with a grain of salt. But the important thing to remember is that this is more of a test of relative performance of graphics cards when it comes to rendering Quake 4 frames -- it doesn't directly translate to Quake 4 experience.
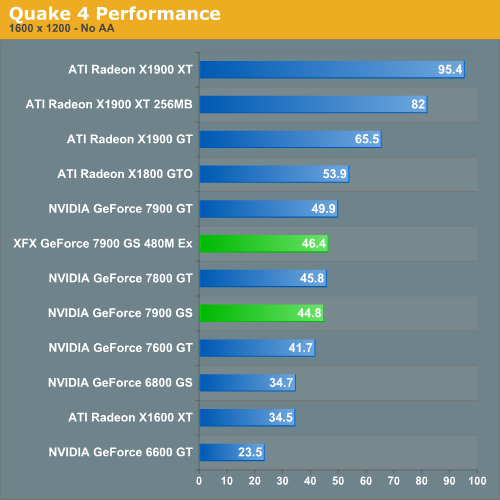
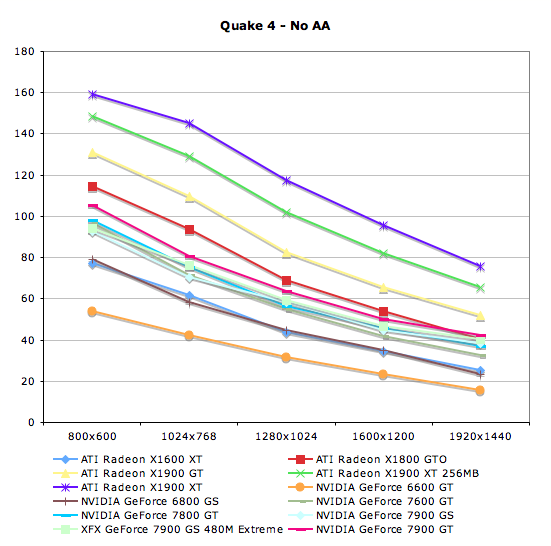
It seems that even an overclock can't save NVIDIA's newest part from succumbing to the latest ATI OpenGL enhancements that have drastically improved Doom 3 engine based game performance. Of course, not all OpenGL games faired well with the latest round of drivers from ATI, with City of Heros/Villains performing very poorly in spite of its use of OpenGL. ATI cards seem to do very well in this benchmark indeed with the X1900 GT coming out the clear performance and value winner.
| Quake 4 - No AA | |||||
800x600 |
1024x768 |
1280x1024 |
1600x1200 |
1920x1440 |
|
| ATI Radeon X1600 XT | 77.1 |
61.8 |
43.8 |
34.5 |
25.3 |
| ATI Radeon X1800 GTO | 114.7 |
93.5 |
68.9 |
53.9 |
40.3 |
| ATI Radeon X1900 GT | 130.8 |
109.6 |
82.7 |
65.5 |
51.7 |
| ATI Radeon X1900 XT 256MB | 148.3 |
129.2 |
101.8 |
82 |
65.6 |
| ATI Radeon X1900 XT | 159.2 |
145.2 |
117.5 |
95.4 |
75.7 |
| NVIDIA GeForce 6600 GT | 54 |
42.4 |
31.3 |
23.5 |
15.5 |
| NVIDIA GeForce 6800 GS | 78.9 |
58.4 |
44.8 |
34.7 |
23.5 |
| NVIDIA GeForce 7600 GT | 96.5 |
71.2 |
54.6 |
41.7 |
32.4 |
| NVIDIA GeForce 7800 GT | 98 |
75.3 |
56.3 |
45.8 |
36.9 |
| NVIDIA GeForce 7900 GS | 92.5 |
70.2 |
58.2 |
44.8 |
38.3 |
| XFX GeForce 7900 GS 480M Extreme | 94 |
76.1 |
59.3 |
46.4 |
40.1 |
| NVIDIA GeForce 7900 GT | 105.2 |
80.6 |
63.6 |
49.9 |
42.2 |
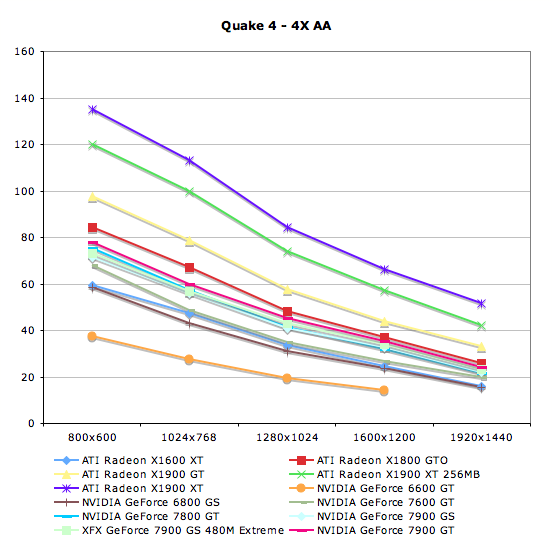
Enabling 4xAA serves to clench Quake 4 as a benchmark that greatly favors ATI hardware when running at the highest possible quality settings. This is the exact opposite of what we have been saying about Quake 4 performance ever since the game launched, but it seems ATI has finally solved their OpenGL performance issues -- at least with this particular engine.
| Quake 4 - 4X AA | |||||
800x600 |
1024x768 |
1280x1024 |
1600x1200 |
1920x1440 |
|
| ATI Radeon X1600 XT | 59.4 |
47.5 |
33.7 |
24.5 |
15.7 |
| ATI Radeon X1800 GTO | 84.2 |
67.1 |
48.3 |
37 |
25.7 |
| ATI Radeon X1900 GT | 97.7 |
78.6 |
57.5 |
44 |
33.1 |
| ATI Radeon X1900 XT 256MB | 119.8 |
99.8 |
73.9 |
57.3 |
42.1 |
| ATI Radeon X1900 XT | 134.9 |
113 |
84.2 |
66.3 |
51.5 |
| NVIDIA GeForce 6600 GT | 37.6 |
27.7 |
19.3 |
14.3 |
|
| NVIDIA GeForce 6800 GS | 58.7 |
42.8 |
30.9 |
23.8 |
15.3 |
| NVIDIA GeForce 7600 GT | 67.9 |
48.5 |
34.7 |
26.6 |
19.9 |
| NVIDIA GeForce 7800 GT | 75.1 |
57.1 |
41.2 |
31.8 |
21.5 |
| NVIDIA GeForce 7900 GS | 71.6 |
55.8 |
40.9 |
32.6 |
22.1 |
| XFX GeForce 7900 GS 480M Extreme | 73.3 |
56.9 |
43 |
34 |
23.1 |
| NVIDIA GeForce 7900 GT | 78 |
60 |
45.1 |
35.2 |
23.9 |
Splinter Cell: Chaos Theory Performance
We make use of the Lighthouse demo for Splinter Cell: Chaos Theory. We have been using this benchmark for quite some time and facilitate automation with the scripts published at Beyond 3D. This benchmark is fairly close to in game performance for our system, but midrange users may see a little lower real world performance when tested with a lower speed processor.
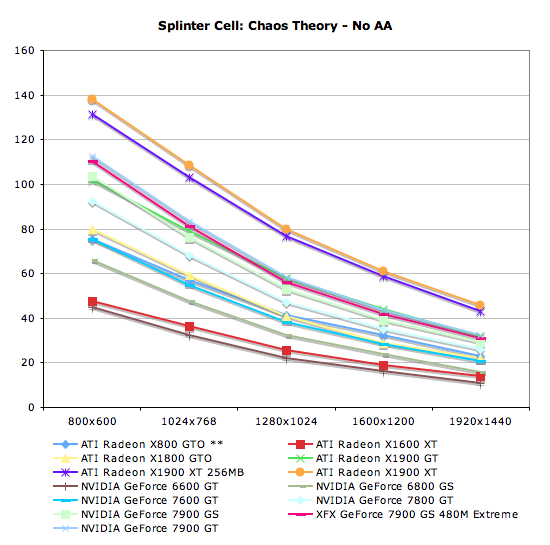
Our settings all used the highest quality level possible including the extra SM3.0 features. As the advanced shaders and antialiasing are mutually exclusive under SC:CT, we left AA disabled and focused on the former. We set anisotropic filtering to 8x for all cards.
For this 3rd person stealth game, ultra high frame rates are not necessary. We have a good playing experience at 25 fps or higher. There may be the framerate junkie out there who likes it a little higher, but our recommendation is based on consistency of experience and ability to play the game without a degraded experience.
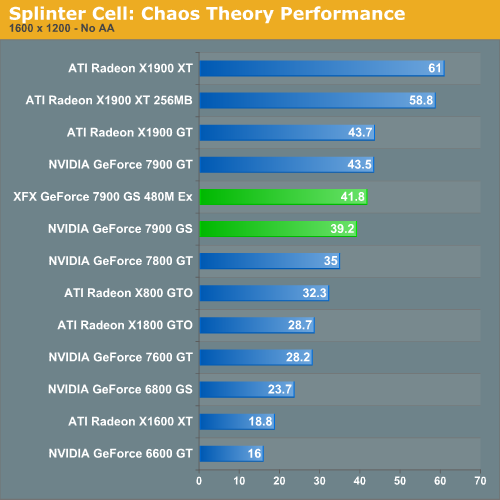
While slightly outperformed by the X1900 GT, the 7900 GS is still a very good value for Splinter Cell: Chaos Theory. Playable frame rates can drop much lower than 30 fps, so spending less to get the stock 7900 GT might be a viable option in this case. The performance lead the X1900 GT holds over the 7900 GS in this case just isn't enough to make it a worth while alternative in SC:CT.
| Splinter Cell: Chaos Theory - No AA | |||||
800x600 |
1024x768 |
1280x1024 |
1600x1200 |
1920x1440 |
|
| ATI Radeon X800 GTO | 75.3 |
56.9 |
41.2 |
32.3 |
23 |
| ATI Radeon X1600 XT | 47.6 |
36.2 |
25.6 |
18.8 |
13.8 |
| ATI Radeon X1800 GTO | 79.6 |
59.1 |
40.9 |
28.7 |
21.9 |
| ATI Radeon X1900 GT | 101.9 |
78.8 |
57.6 |
43.7 |
31.9 |
| ATI Radeon X1900 XT 256MB | 131.2 |
103.2 |
76.7 |
58.8 |
43.1 |
| ATI Radeon X1900 XT | 137.9 |
108.5 |
79.8 |
61 |
45.6 |
| NVIDIA GeForce 6600 GT | 44.6 |
32.1 |
22 |
16 |
10.6 |
| NVIDIA GeForce 6800 GS | 65.8 |
47.5 |
32.4 |
23.7 |
15.9 |
| NVIDIA GeForce 7600 GT | 75.4 |
54.6 |
38.2 |
28.2 |
20.7 |
| NVIDIA GeForce 7800 GT | 92.4 |
67.9 |
47 |
35 |
25.8 |
| NVIDIA GeForce 7900 GS | 103.6 |
76.1 |
52.7 |
39.2 |
29 |
| XFX GeForce 7900 GS 480M Extreme | 110.1 |
81.1 |
56.1 |
41.8 |
30.9 |
| NVIDIA GeForce 7900 GT | 112.5 |
83.5 |
58.1 |
43.5 |
32.1 |
Final Words
The introduction of the GeForce 7900 GS has certainly tightened up the competition between the $200 and $250 marks: there really is no hands down winner in this match. The X1900 GT did manage to at least edge out even the overclocked XFX 7900 GS in most benchmarks, which is hardly surprising considering the X1900 GT was already competitive with the 7900 GT. ATI does get points for the inclusion of a high quality AF mode and the capability to perform AA on fp16 render targets, but NVIDIA's Transparency AA is higher quality than ATI's Adaptive AA. With the X1900 GT costing only slightly more than a modestly overclocked 7900 GS, the value of these two cards is very close.
This is one of those times where a choice will have to come down to individual gaming tests. Those in the market for a new card at the $220 price point will need to pay careful attention to each game test and decide which ones are most important on an individual basis. It is much too difficult to declare a clear winner here without including an absurdly huge volume of game tests. At the same time, the stock 7900 GS is no slouch and the cheaper price tag may make it possible for people with a hard budget cap to reach a very comfortable level of performance.
High resolutions with high detail settings are not always attainable with these ~$200 cards, but you do get performance roughly equal to last year's $400-$500 offerings. Gamers who play at the highly prevalent resolutions of 1280x1024 and 1600x1200 will be more than satisfied with these cards under current gaming conditions (with the possible exception of Oblivion). It is difficult to be forward looking about the increased demand for performance from games when a new version of DirectX is around the corner, but we certainly feel comfortable saying that these cards can handle just about anything developers will throw at a DX9/PS3.0 class of hardware at a reasonable resolution. For all but the most demanding gamers, the X1900 GT and 7900 GS/GT are very good values.
In our intra-architectural comparisons, our tests indicate that the 7900 GS has good potential to scale well with clock speed. If NVIDIA decided to bin and sell these chips based on the failure of one vertex pipe and one quad, it is likely that we could see the same huge potential for overclockability we noted with the 7900 GT. Hopefully this time around manufacturers will better understand the limitations of the hardware before selling parts with clock speeds and failure rates that are both way too high.
We can also say with confidence that the extra vertex and pixel pipelines aren't just their for looks on the 7900 GT. With every game but Half-Life 2: Episode One we saw a substantial performance increase due to the inclusion of 4 more pixel pipes and one more vertex pipe. With performance increases of 10-15% being common otherwise, the efficiency of adding more hardware in parallel is very clear. We don't see a perfectly linear scaling with vertex or pixel pipelines, but we certainly see a huge boost as we move to wider GPUs.
For those more demanding gamers, we will have to wait to see if the 7950 GT can quench our desire for affordable high resolution gaming. Based on clock speeds, we can easily say that performance will fall short of the 7900 GTX. As the 7950 GT is basically an overclocked 7900 GT with twice the memory on board (or an underclocked 7900 GTX if you prefer), it wouldn't be beyond the realm of possibility to see some overclocked 7900 GT solutions winning out in some benchmarks. We are hoping to demonstrate this next week.
We have not included SLI/CrossFire performance testing in this article, and NVIDIA touts that is one of the major advantages the 7900 GS holds over the competition. We will be looking at multi-GPU performance next week in the 7950 GT article. That does present some additional considerations, as you will have the option of getting two 7900 GS cards as opposed to a single 7900 GTX -- provided you have the appropriate motherboard.
On a slightly more editorial note, while we do have a hard launch for the 7900 GS, the 7950 GT is not available today. Between this semi-hard launch and ATI's paper launch last month, we are a little concerned about the future. Not only do hard launches make it easier for reviewers to recommend the proper product, they help protect consumers from debacles on the order of the phantom Radeon X700 XT. Unless we can buy it when it launches, we can't be sure it will even exist in the retail market. We sincerely hope that these recent missteps by ATI and NVIDIA are not the beginning of a pattern.


