Original Link: https://www.anandtech.com/show/16878/zotac-zbox-magnus-one-sff-gaming-pc-review-desktop-comet-lake-charges-up-with-ampere
Zotac ZBOX MAGNUS ONE SFF Gaming PC Review: Desktop Comet Lake Charges Up with Ampere
by Ganesh T S on August 13, 2021 10:00 AM EST
Zotac has been a pioneer in bringing compact small form-factor (SFF) machines to the market right since the ION days. The introduction of the ZBOX EI750 in 2014 marked the beginning of Zotac's foray into the SFF gaming PC segment. With the burgeoning market for compact systems (kickstarted by the success of the Intel NUC initiative), Zotac has also grown from strength to strength. The company now has around 8 different mini-PC families targeting different segments. The ZBOX E series (E initially stood for 'EPIC GAMING', before becoming the more arcane 'Enthusiast' in recent years) caters to the gaming crowd and is marketed under the MAGNUS tag. The first mini-PC in this series, the ZBOX EI750, used the eDRAM-augmented CrystalWell parts in 2014. The MAGNUS EN970 introduced in 2015 was Zotac's first attempt at integrating a discrete GPU board into the mini-PC form-factor.
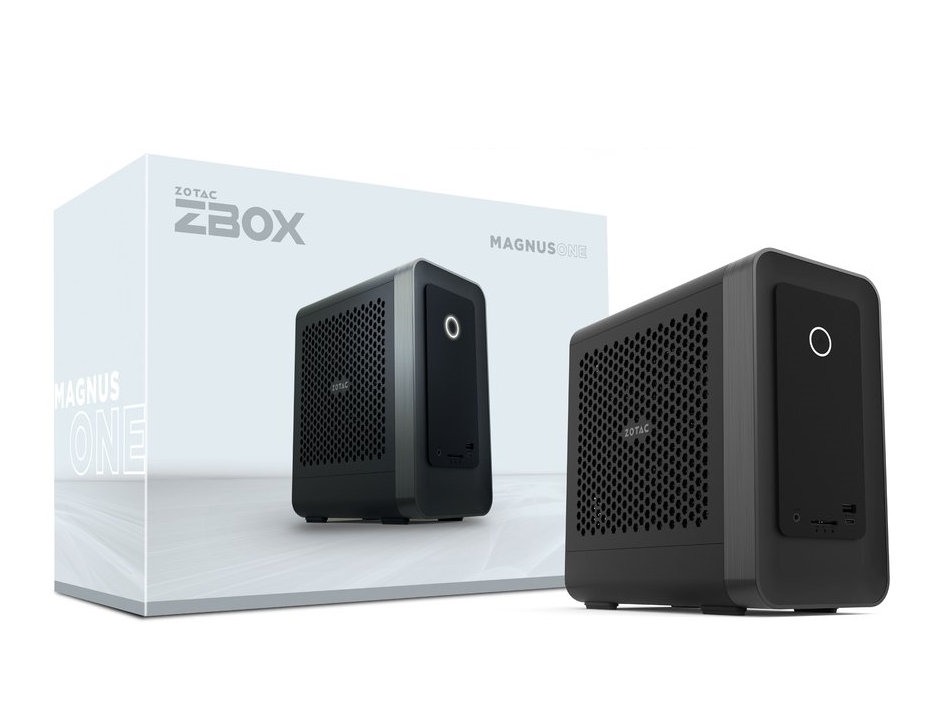
Gaming mini-PCs have always had to deal with tradeoffs in terms of processor TDP, GPU TDP, and PSU integration. Almost all of the early gaming mini-PCs involved re-imagining a gaming notebook motherboard in a desktop form-factor - MXM GPUs and sub-45W TDP processors were the norm. Intel's gaming-focused Enthusiast and Extreme NUCs have been upping the ante in this department, and Zotac has also been up to the challenge. The company's current flagship is the ZBOX MAGNUS ONE (introduced at the 2021 CES). Coupling a desktop Comet Lake CPU with a desktop nVIDIA Ampere GPU, it promises plenty of gaming prowess. This review takes a look at the performance and value proposition of the top-end ZBOX MAGNUS ONE model - the ZBOX-ECM73070C-W2B.
Introduction and Product Impressions
Zotac's E-series mini-PCs have enjoyed great success in the gaming mini-PC market, prompting the company to regularly update the lineup with the latest and greatest CPUs and GPUs. Tracing the history of Zotac's flagship E-series systems, we find different tradeoffs applied between the CPU TDP, GPU TDP, and PSU. Higher TDP components have typically carried a premium price tag to accommodate a liquid cooling solution, prompting the company to experiment with air-cooled systems to broaden the market appeal with lower pricing. The details of the gaming flagships in each generation are listed below:
- 2014 ZBOX EI750: CrystalWell (65W TDP for CPU + integrated Iris Pro GPU), 120W external power brick
- 2015 ZBOX MAGNUS EN970: Broadwell-U 15W TDP CPU + 100W TDP GTX 970M, 180W external power brick
- 2016 ZBOX MAGNUS EN980: Skylake-S 65W TDP CPU + 180W TDP GTX 980, 2x180W external power bricks
- 2016 ZBOX MAGNUS EN1080: Skylake-S 65W TDP CPU + 180W TDP GTX 1080, 2x180W external power bricks
- 2017 ZBOX MAGNUS EN1080K: Kaby Lake-S 65W TDP CPU + 180W TDP GTX 1080, 2x180W external power bricks
- 2018 ZBOX MAGNUS EK71080: Kaby Lake-H 45W TDP CPU + 180W TDP GTX 1080, 330W external power brick
- 2019 ZBOX MAGNUS EN72080V: Coffee Lake-H 45W TDP CPU + 150W TDP RTX 2080 Mobile, 330W external power brick
- 2020 ZBOX MAGNUS EN072080S: Comet Lake-H 45W TDP CPU + 150W TDP RTX 2080 Super Mobile, 330W external power brick
- 2021 ZBOX MAGNUS ONE: Comet Lake-S 65W TDP CPU + 220W TDP RTX 3070, 500W internal PSU
Between the MAGNUS EK71080 and the MAGNUS ONE, Zotac started focusing more on the content creators market with their high-end E-series units. The flagship Inspire Studio sported a 65W TDP Coffee Lake-S CPU and a 175W TDP RTX 2060 SUPER, with a form-factor similar to that of the MAGNUS EK71080. The EN72080V and EN072080S were based on the thinner EN970 form-factor. The 2021 MAGNUS ONE thus marks Zotac's strong return to the SFF gaming market with a proper desktop CPU and GPU.
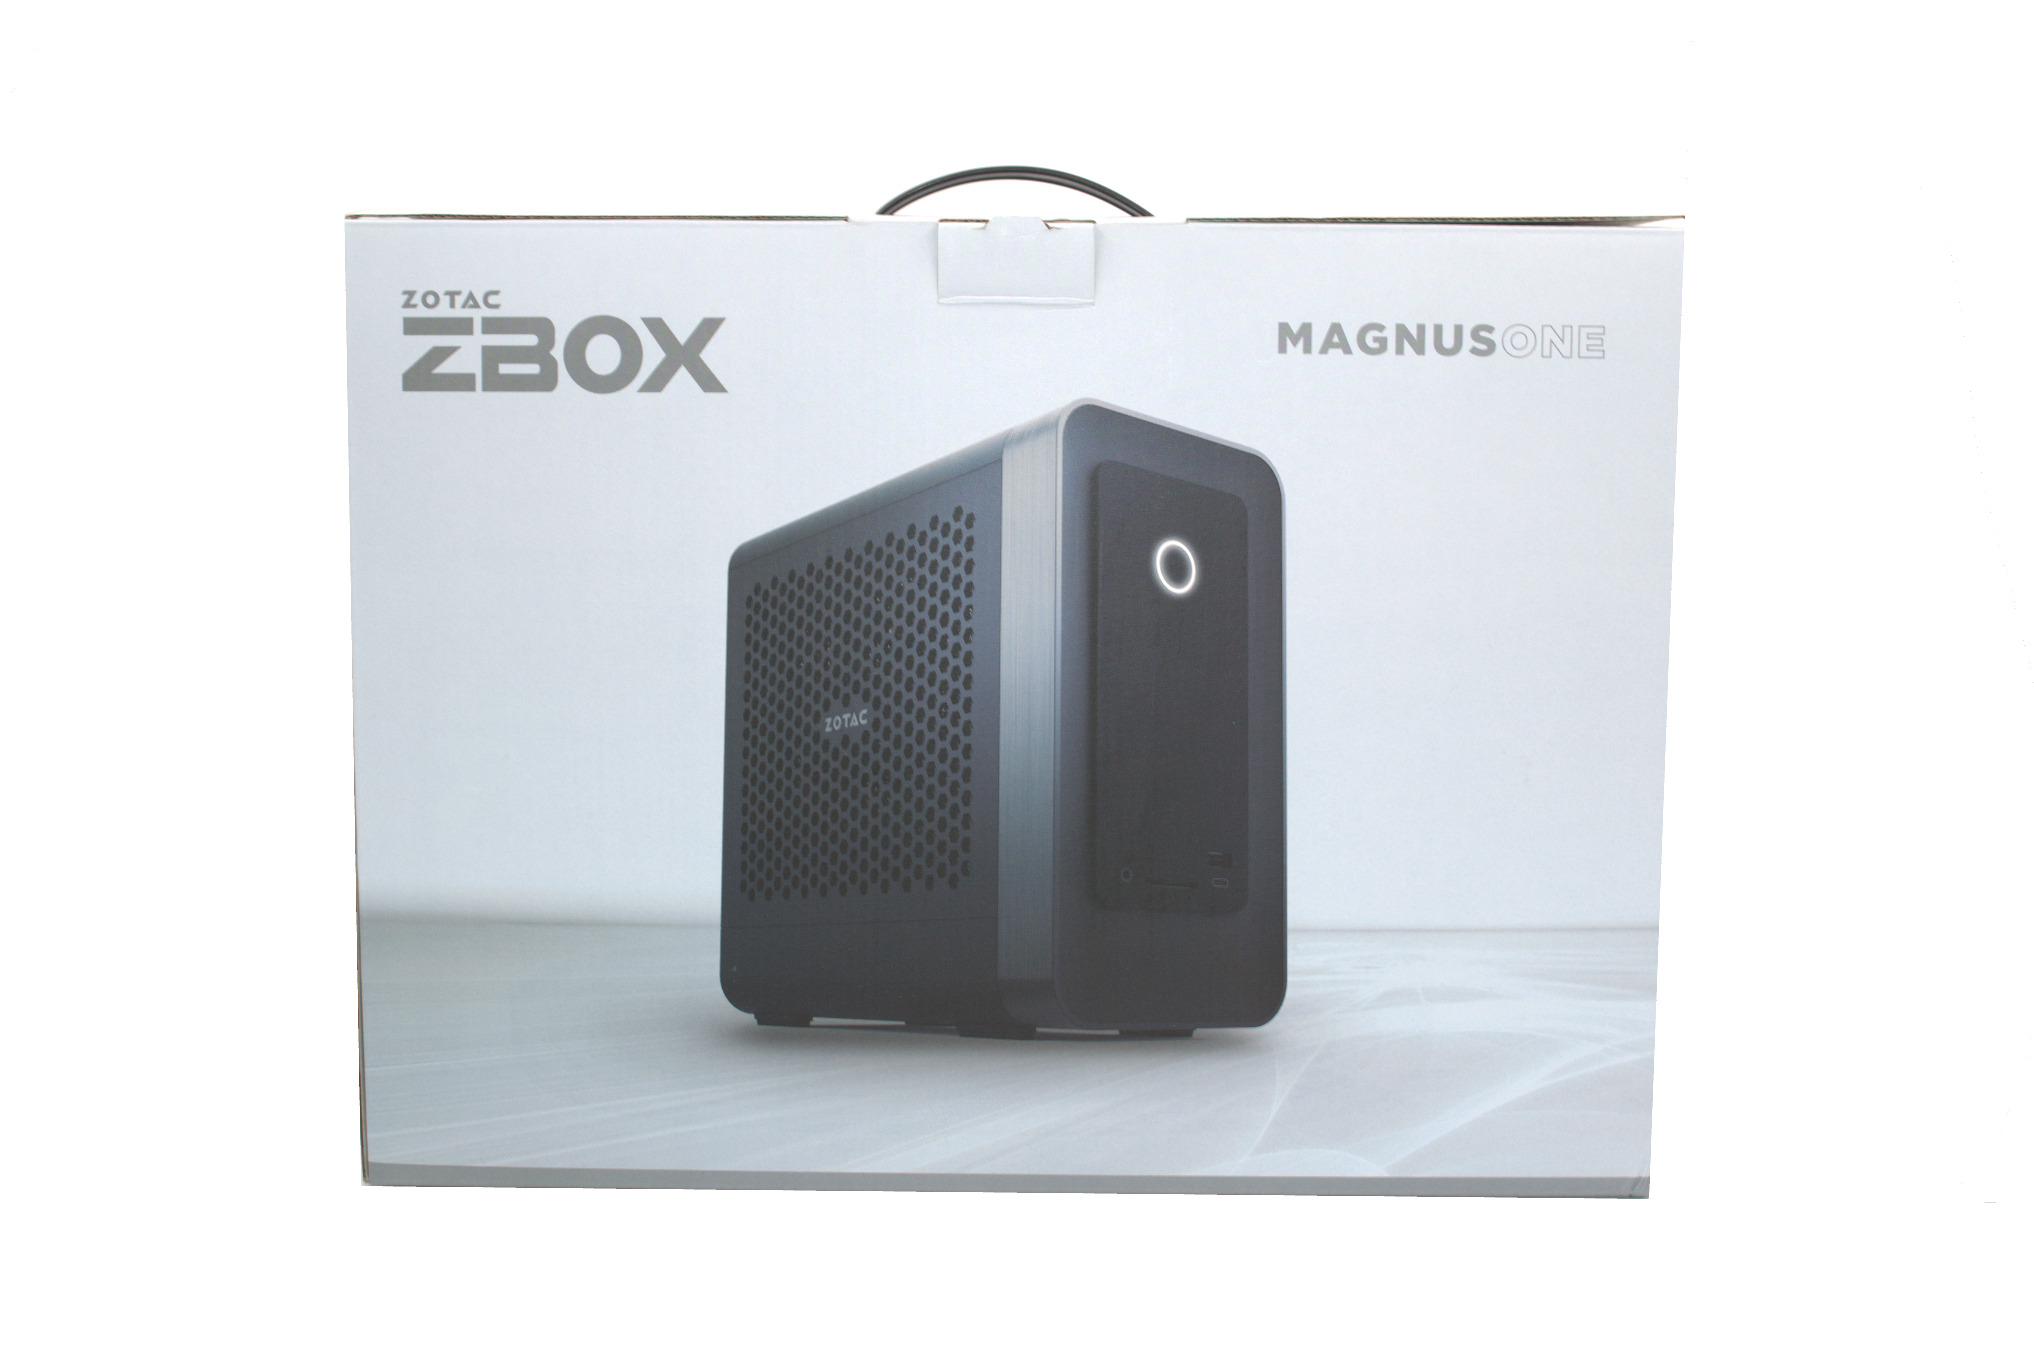
Zotac supplied us with an engineering sample of the high-end MAGNUS ONE SKU - the ZBOX-ECM73070C-W2B. It sports the Intel Core i7-10700 Comet Lake-S CPU and a GeForce RTX 3070 Ampere GPU (Zotac RTX 3070 Twin Edge), along with a 512GB NVMe SSD and a 1TB 2.5" HDD. A 16GB DDR4 SODIMM is also part of the package. Windows 10 Home x64 is pre-installed on the SSD. The whole system is housed in 265.5mm x 126mm x 249mm (10.45in x 4.96in x 9.8in) 8.3L chassis. Taking the cue from Intel's Ghost Canyon NUCs, Zotac has integrated a 500W 80+ Platinum PSU and redesigned the chassis for vertical orientation. These contribute to the creation of a compact and easily transportable system.
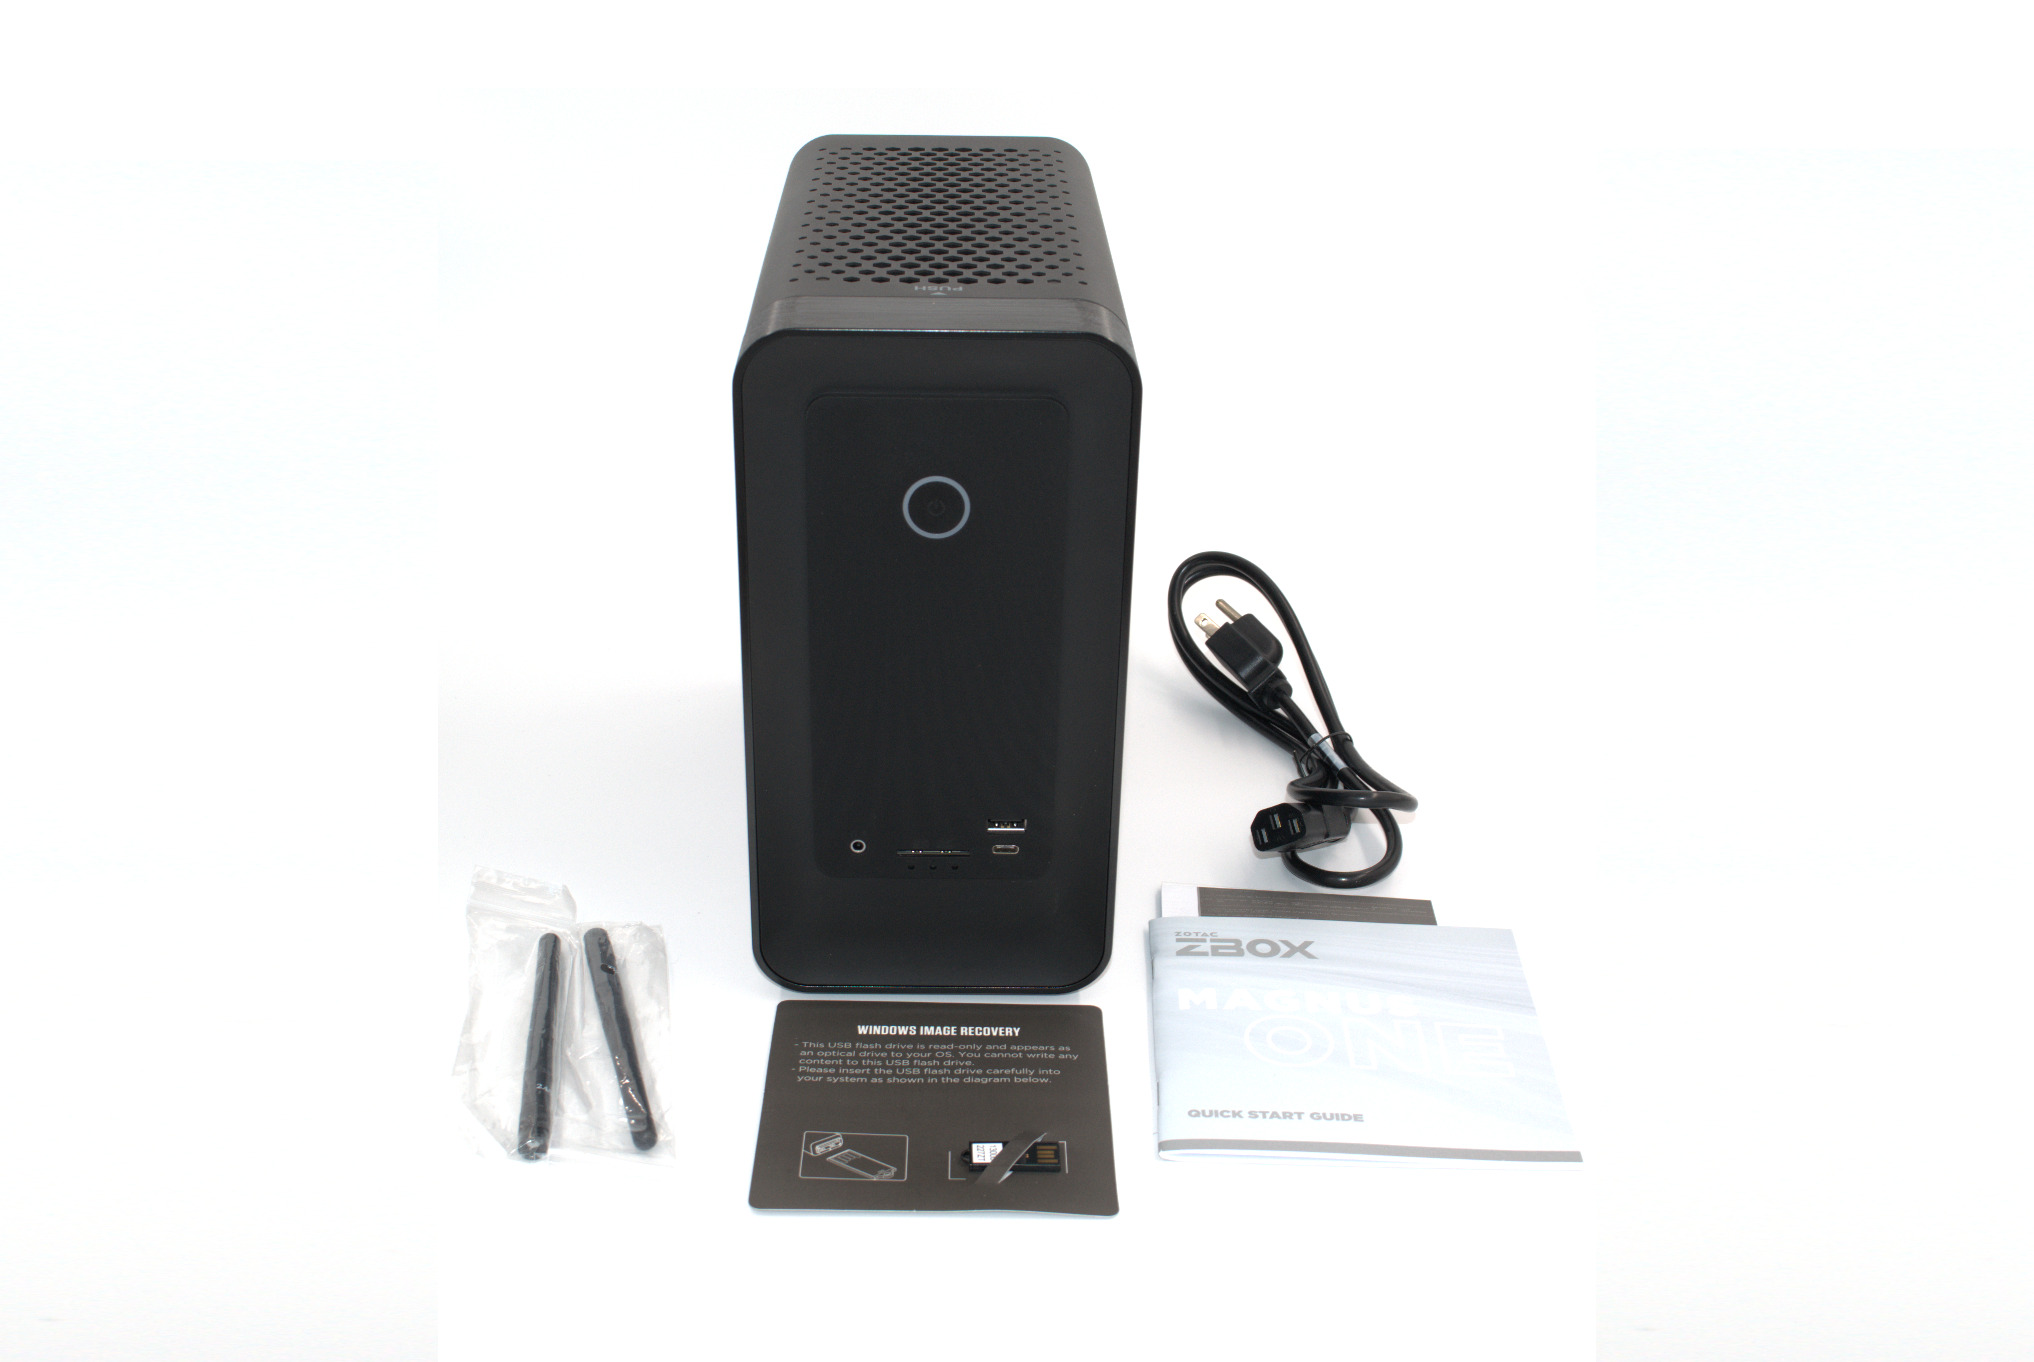
Thanks to the integrated PSU, the package contents are largely simplified compared to the other E-series mini-PCs. There is a US AC power cord, two WLAN antennae, a read-only USB key for Windows Image Recovery, and a quick start guide.
The specifications of our review configuration are summarized in the table below:
| Zotac ZBOX MAGNUS ONE (ECM73070C) Specifications | |
| Processor | Intel Core i7-10700 Comet Lake-S, 8C/16T, 2.9 - 4.8 GHz, 14nm+++, 16MB L2, 65W TDP |
| Memory | Crucial CT16G4SFS832A DDR4-3200 SODIMM 22-22-22-52 @ 3200 MHz 1x16 GB |
| Graphics | Zotac Gaming GeForce RTX 3070 Twin Edge 5888 CUDA Cores 8 GB GDDR6 Intel UHD Graphics 630 |
| Disk Drive(s) | Phison E13 Reference Design (Zotac-sourced) (500 GB; M.2 Type 2280 PCIe 3.0 x4 NVMe; Kioxia 96L 3D TLC) (Phison E13 Controller) Seagate BarraCuda ST1000LM048 (1 TB; 2.5in SATA 6Gb/s) |
| Networking | Intel Killer Wi-Fi 6 AX1650x 1 × Realtek RTL8168 Gigabit Ethernet 1 × Killer Ethernet E3000 2.5Gbps controller |
| Audio | 3.5mm Headphone Jack Capable of 5.1/7.1 digital output with HD audio bitstreaming (HDMI / DP) |
| Miscellaneous I/O Ports | 1 x USB 3.1 Gen 1 Type-A (Front) 1 x USB 3.1 Gen 1 Type-C (Front) 1 x SDXC UHS-I (Front) 2 x USB 3.1 Gen 1 Type-A (Rear) 4 x USB 3.1 Gen 2 Type-A (Rear) |
| Operating System | Retail unit is Windows 10 Home x64, but we installed Windows 10 Enterprise x64 |
| Pricing (as configured) | $2400 |
| Full Specifications | Zotac ZBOX MAGNUS ONE ECM73070C with Windows 10 Specifications |
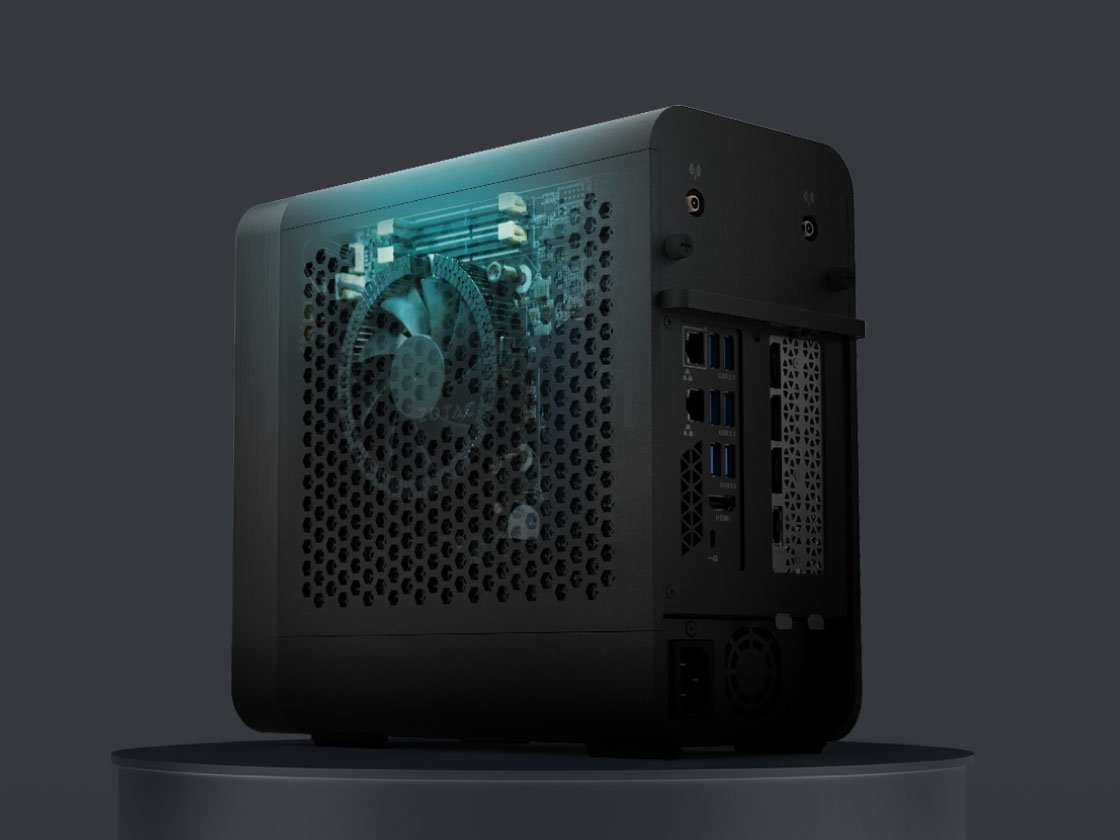
In terms of external appearance, the impact of the Ghost Canyon NUC can be clearly seen. The top panel of the chassis includes a couple of fans. It slides off easily after the two rubber screws are removed. This is a tool-less operation, unlike what we saw in the Ghost Canyon and Beast Canyon NUCs.
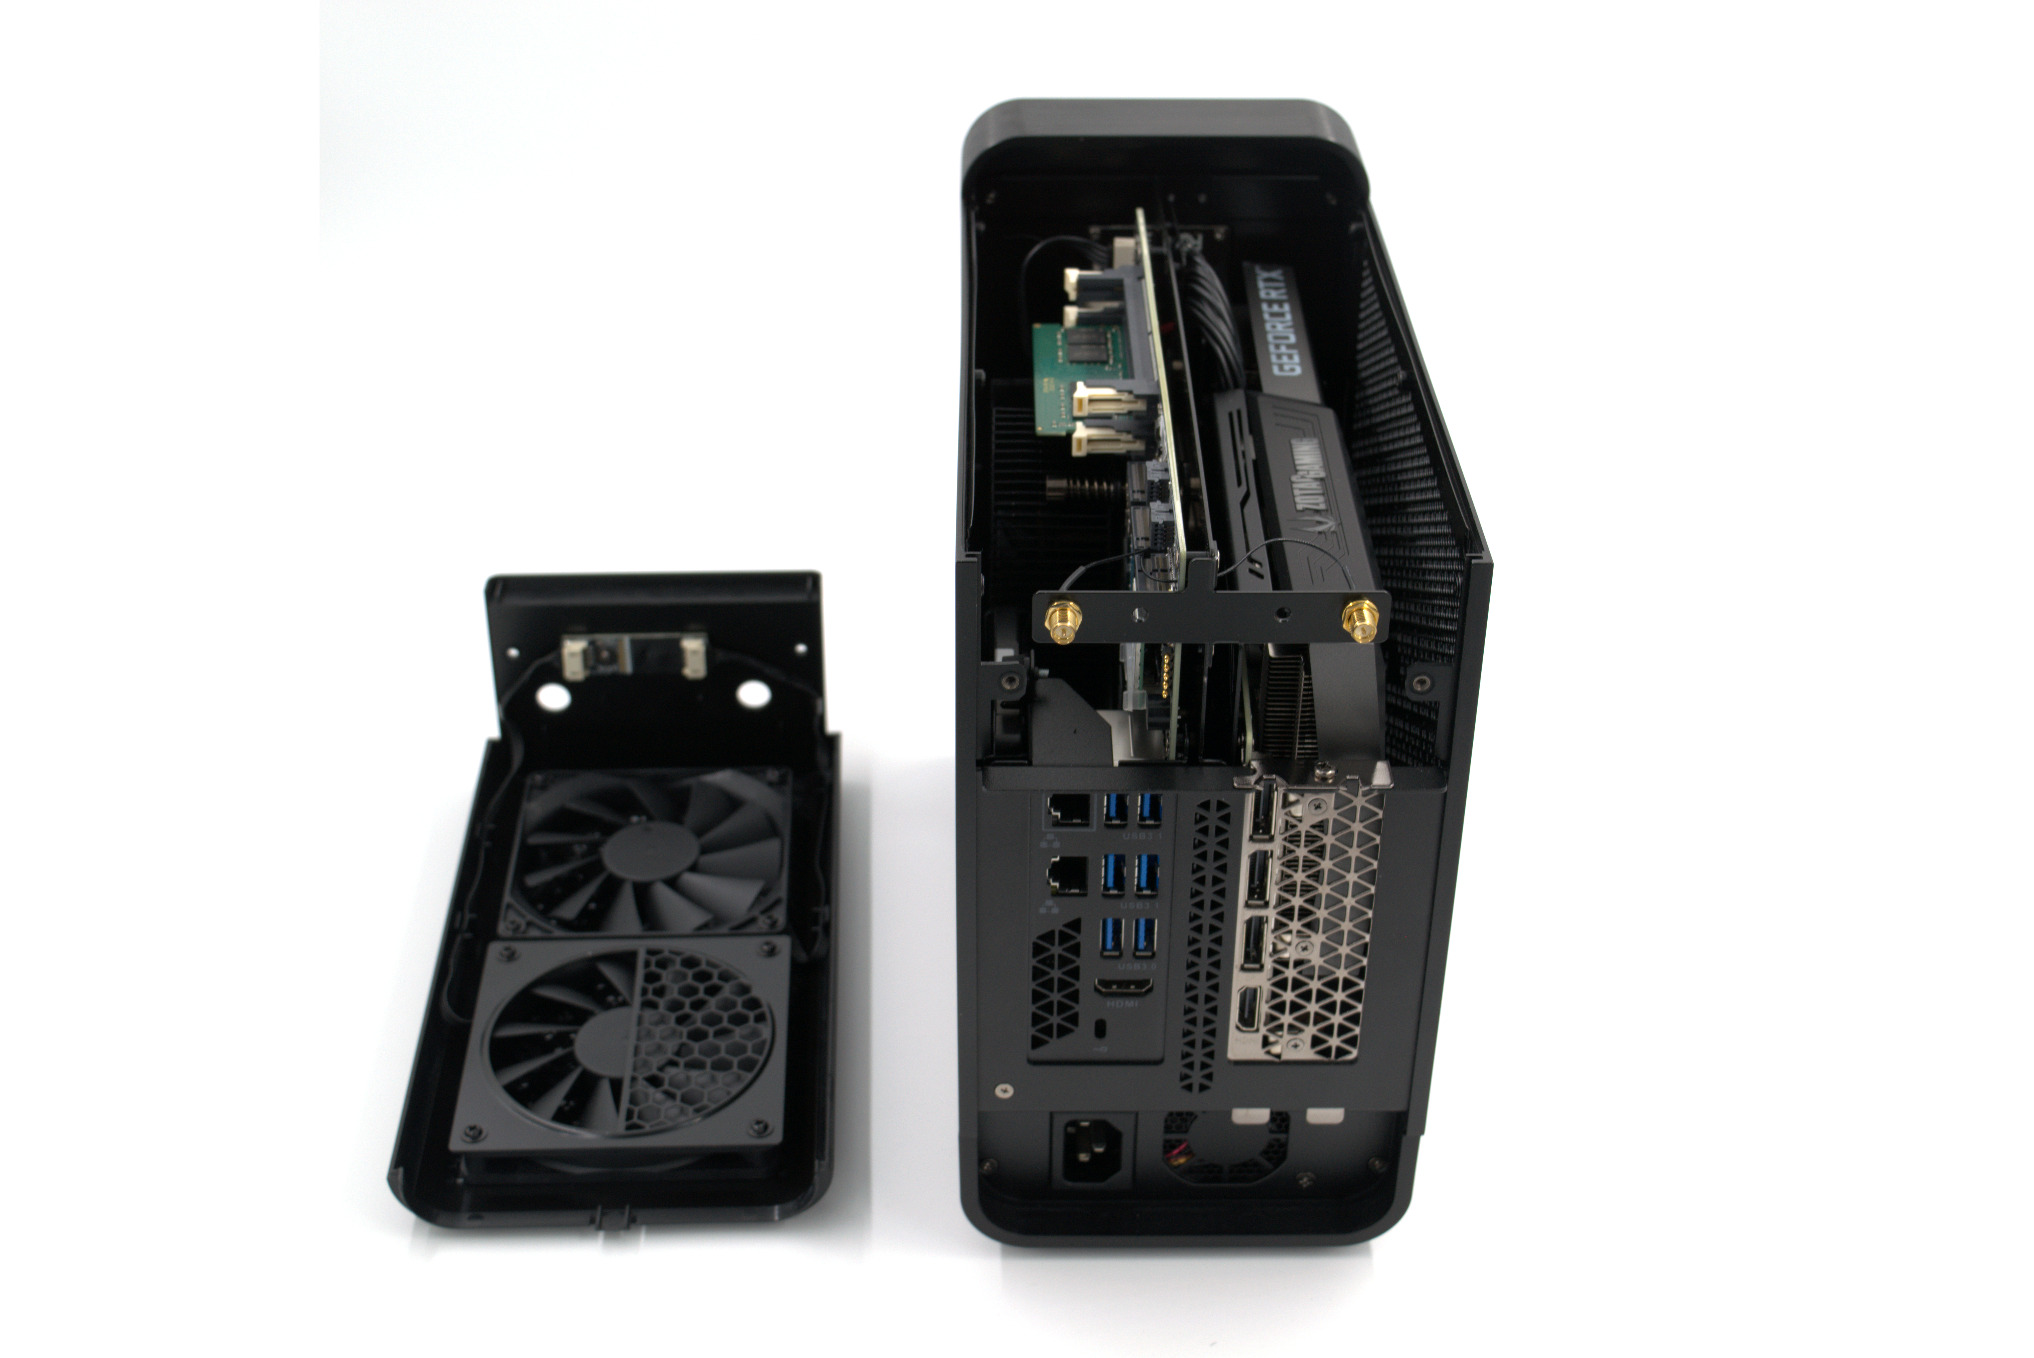
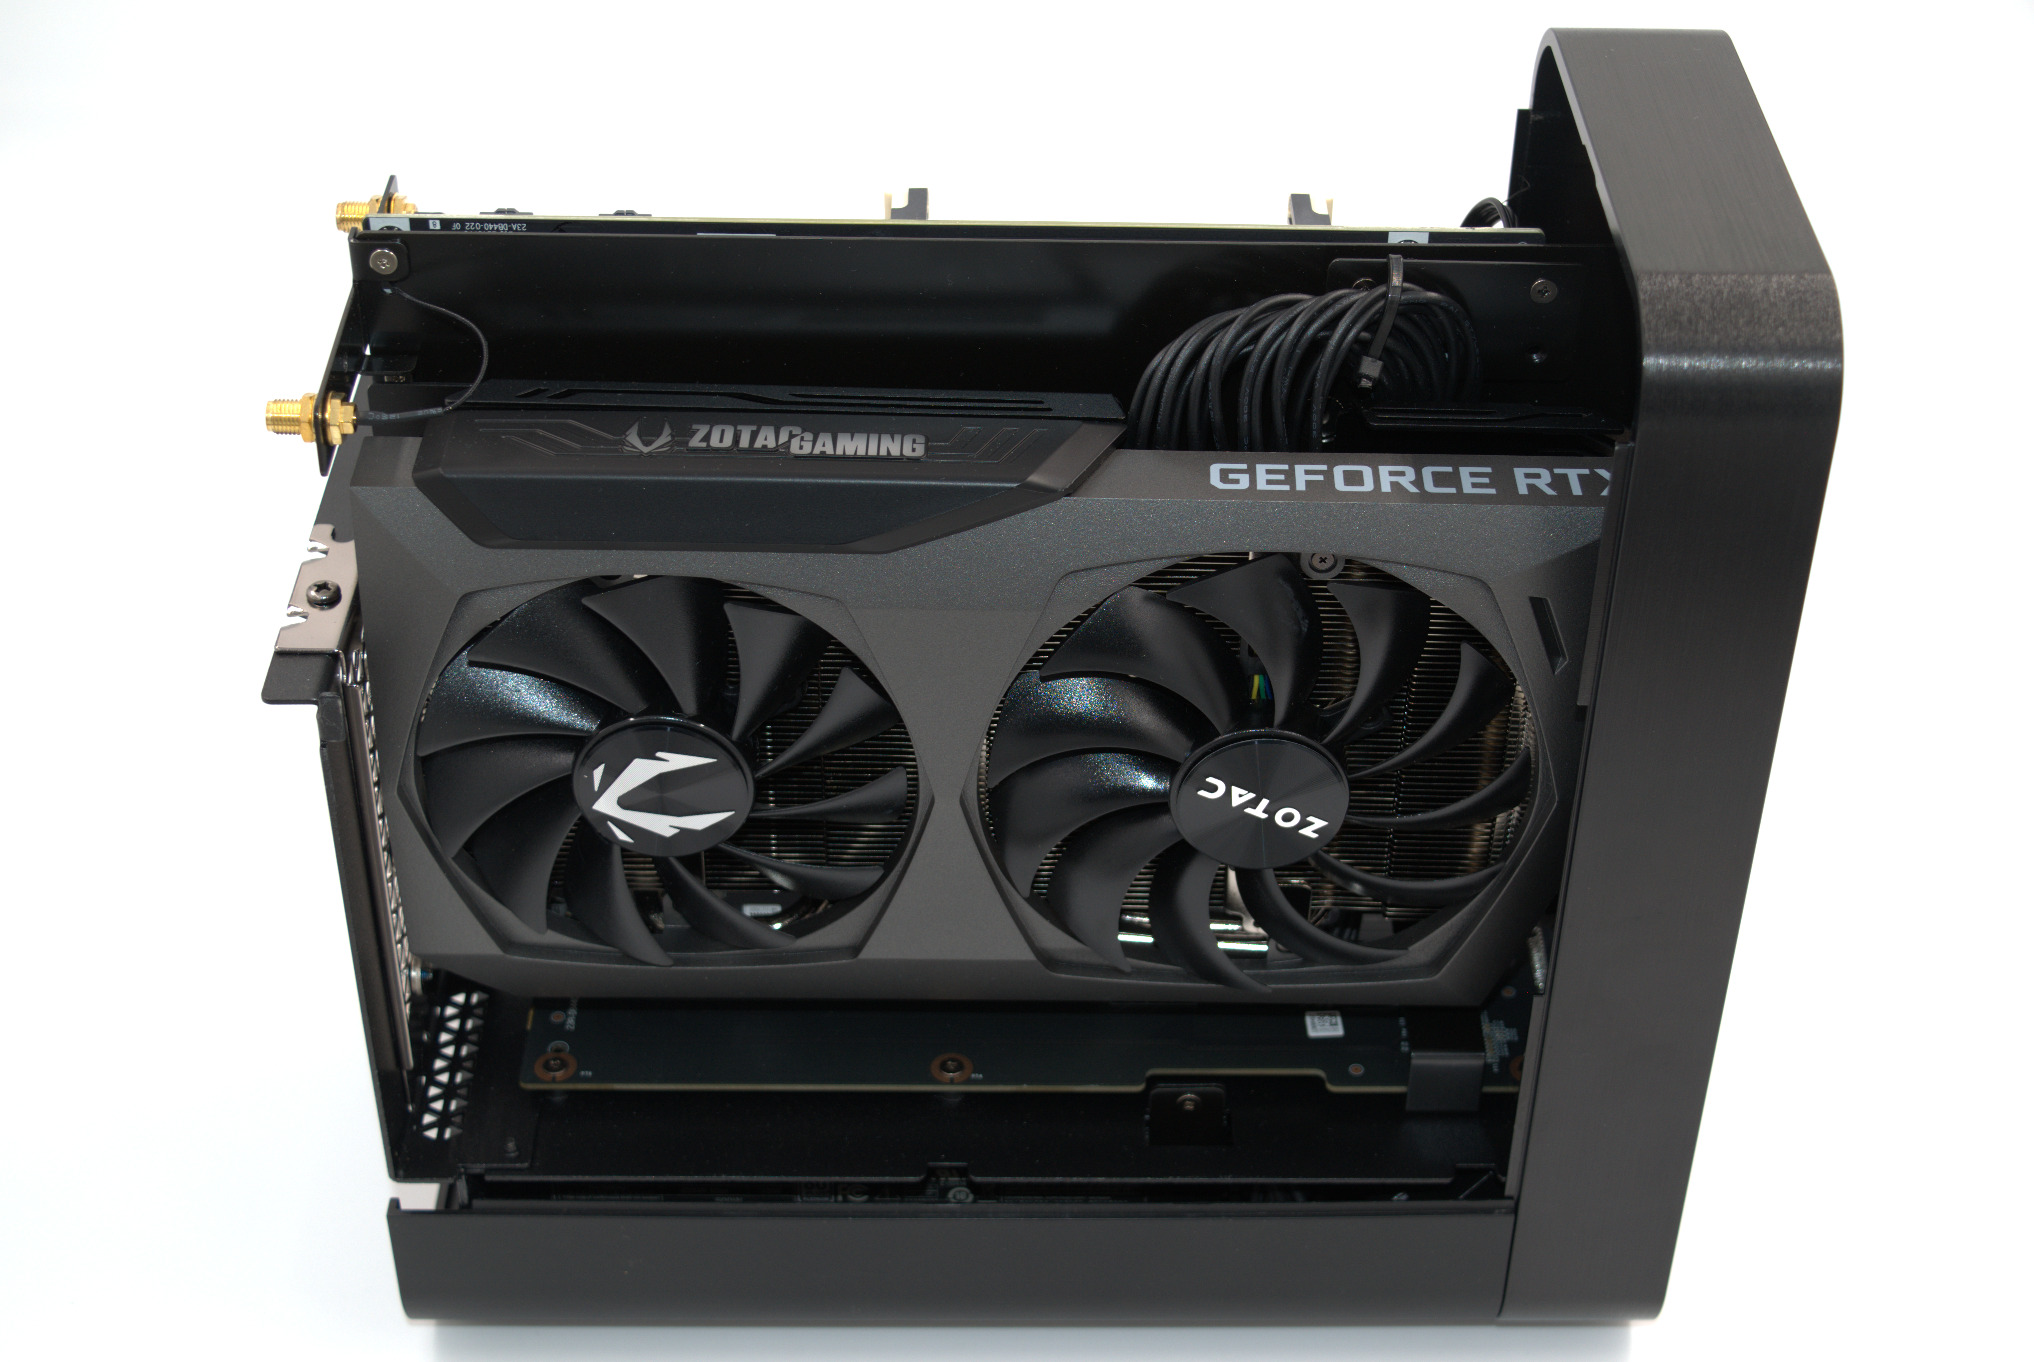
The two side panels can be removed once the top panel is out of the picture. This exposes the GPU and the motherboard on either side.
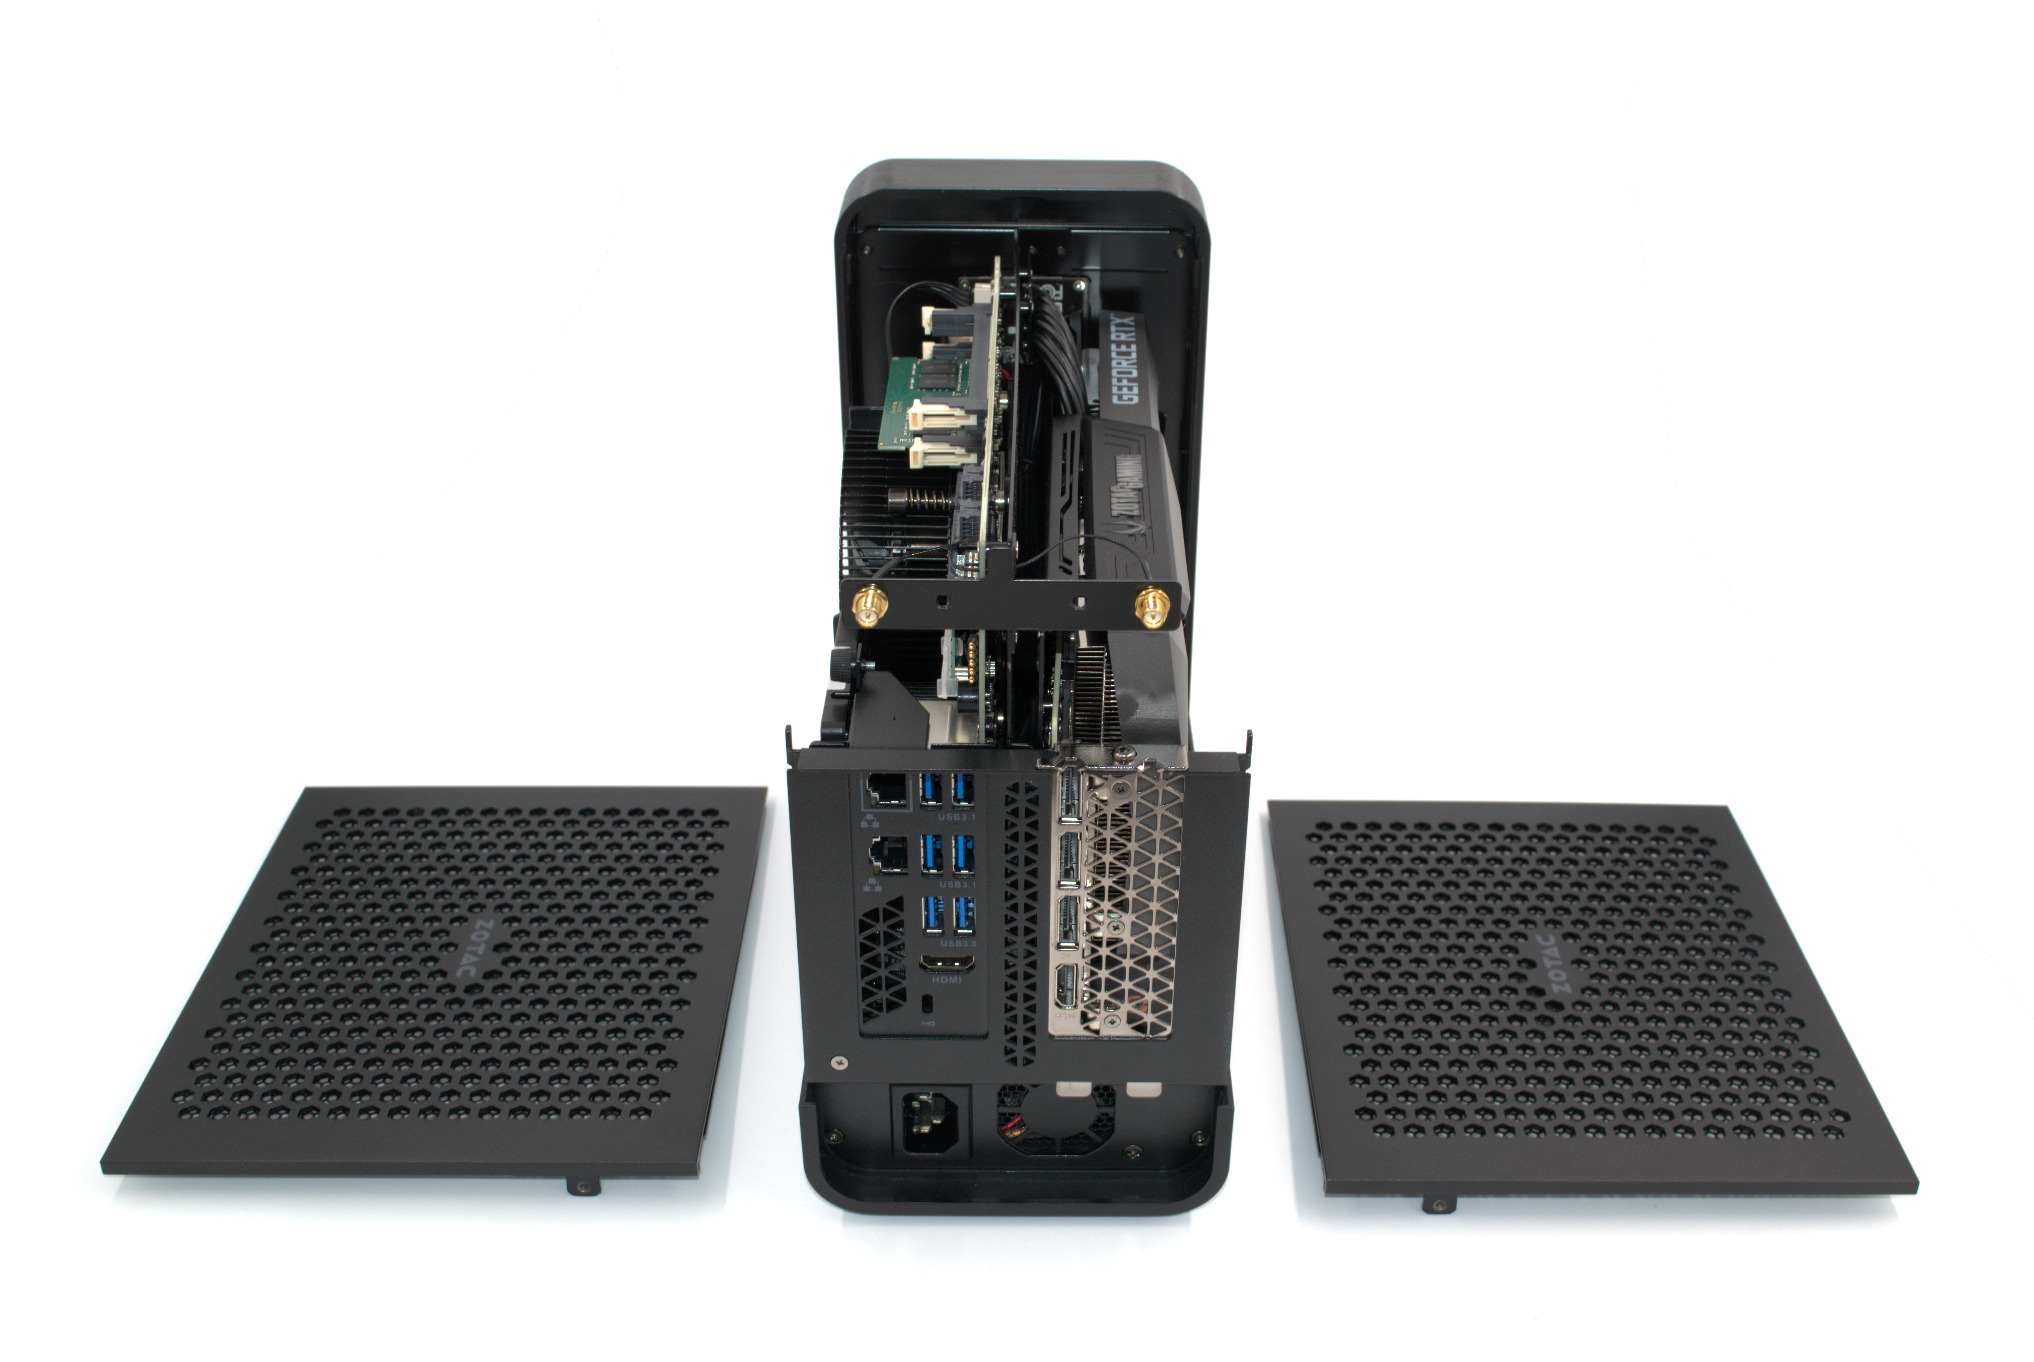
Unlike the NUCs, the M.2 SSD slots, 2.5" drive caddy, and the vertical SODIMM slots are immediately accessible after the side panel's removal.
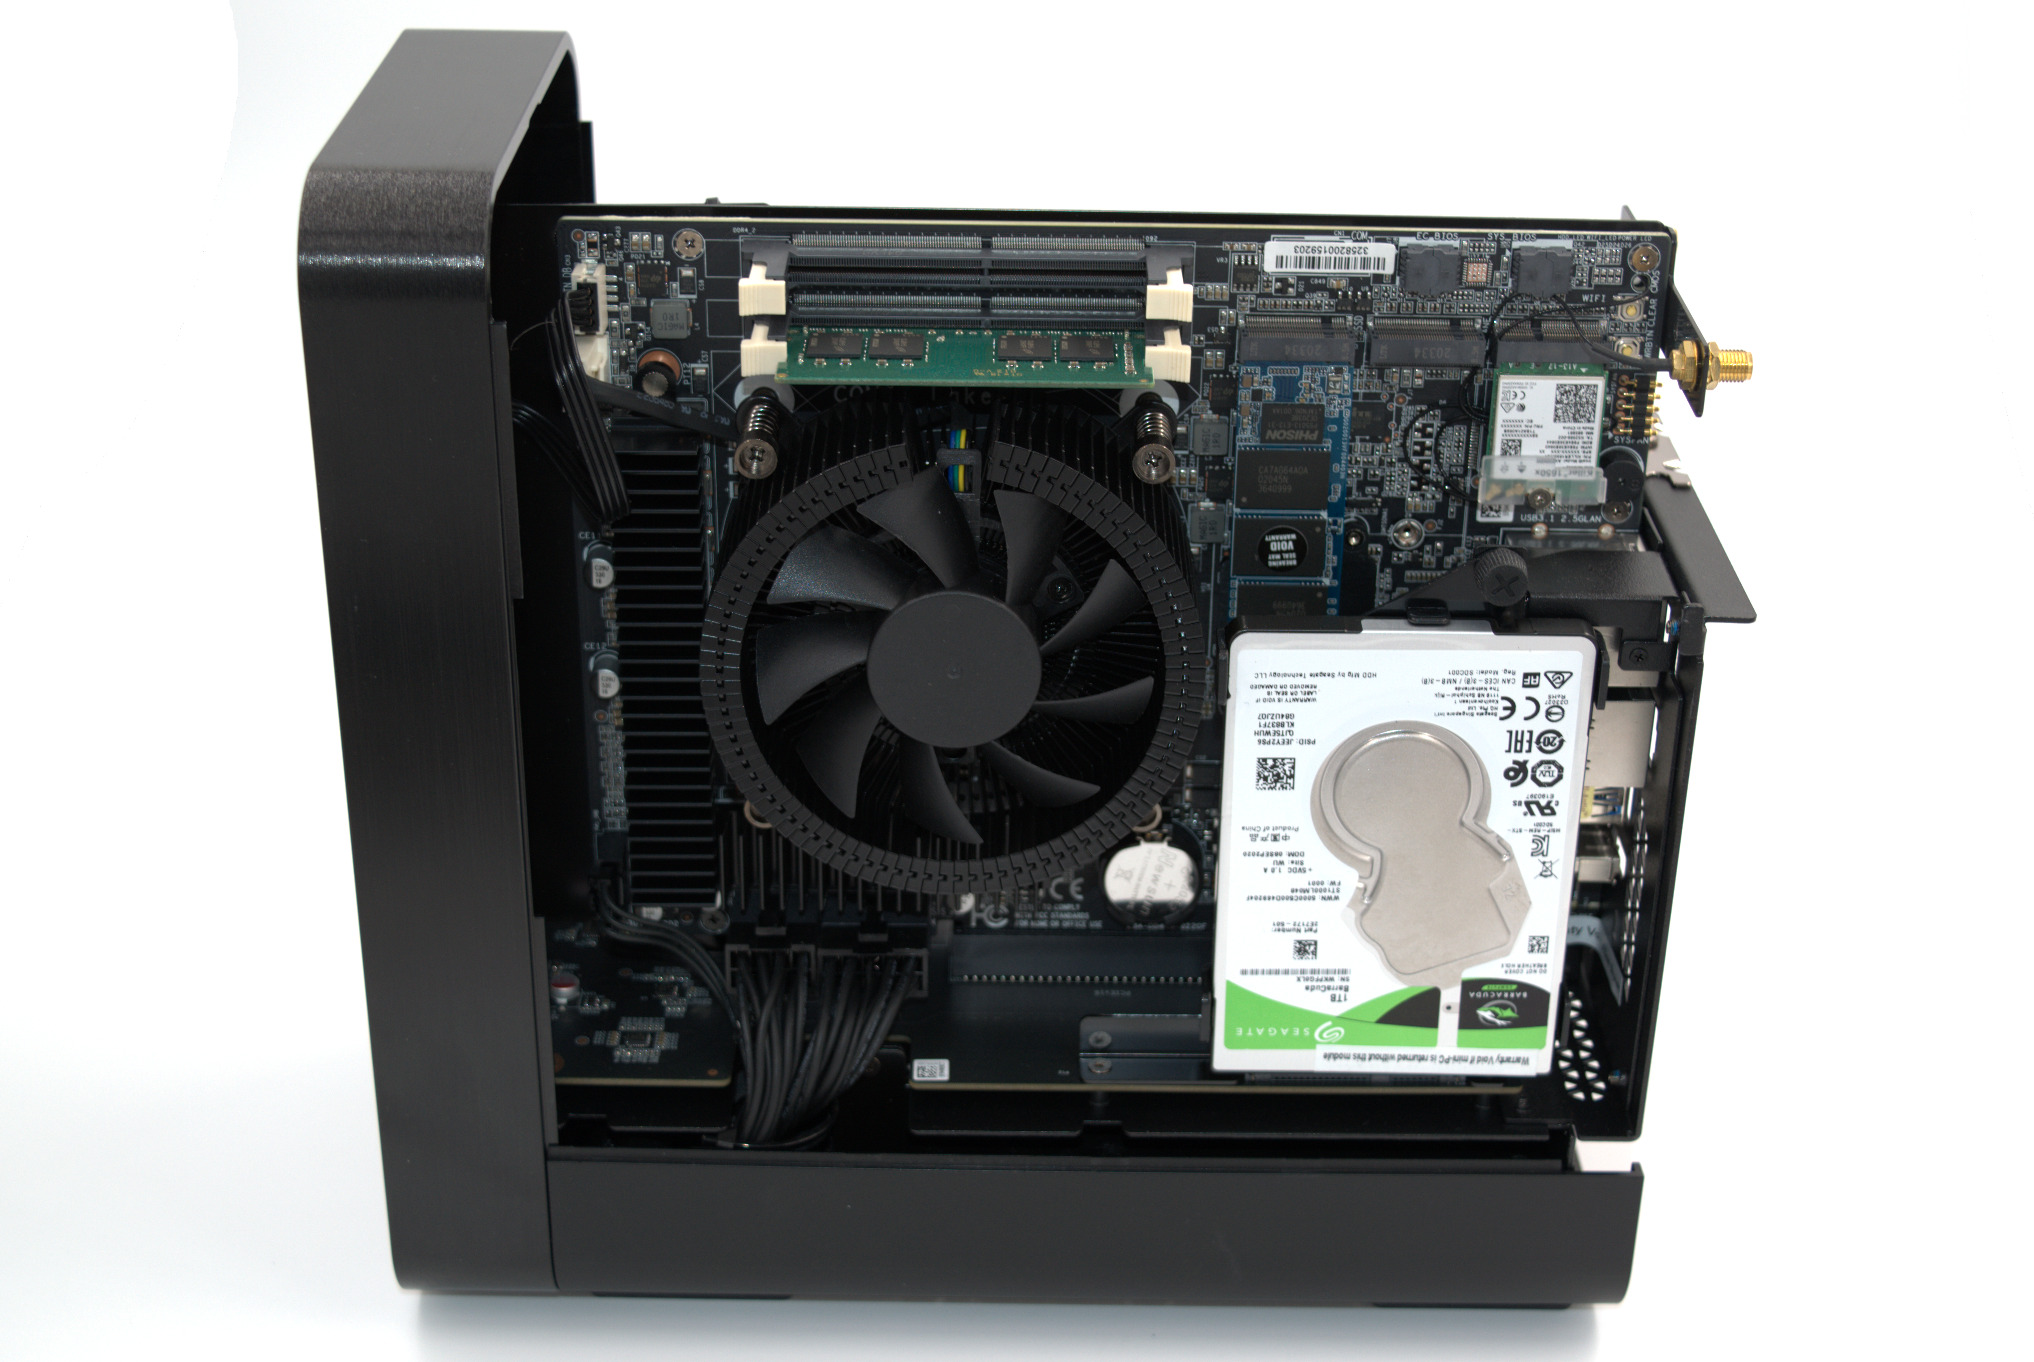
Since our review sample was essentially a pre-built system, we didn't have to install any new components inside the chassis. Zotac opts to populate only one DRAM channel in the system. This does hamstring the performance of the system, but we opted to review the system as-is in terms of hardware. We did re-image the M.2 SSD with Windows 10 Enterprise x64, as it provides more fine-grained control over benchmarking routines without unexpected interference from the OS.
In the next section, we take a look at the BIOS options along with an analysis of the motherboard platform. Following that, we have a number of sections focusing on various performance aspects before concluding with an analysis of the value proposition of the system.
Setup Notes and Platform Analysis
The motherboard in the MAGNUS ONE uses a H470 PCH. The CPU's integrated GPU display output (HDMI 1.4a) is also available in the rear panel. The RTX 3070 Twin Edge features four display outputs, and either set can be active for up to four simultaneous display streams. The PC also includes Killer AX1650 Wi-Fi and dual LAN ports (1x 1Gbps + 1x 2.5Gbps) as noted in the specifications table in the previous section.
The Zotac ZBOX MAGNUS ONE sports a redesigned GUI for its BIOS. The use of the H470 PCH and a non-overclockable CPU mean that the BIOS doesn't need a ton of enthusiast features. The video below presents the entire gamut of available options in the system's BIOS.
The AIDA64 system report for the hardware configuration supplied by Zotac provided the following information:
- [ North Bridge: Intel Comet Lake-S IMC ]:
- PCIe 3.0 x16 port #2 In Use @ x16 (nVIDIA GA104 - High Definition Audio Controller, Zotac RTX 3070 Twin Edge OC Video Adapter)
- [ South Bridge: Intel Comet Point-H H470 ]:
- PCIe 3.0 x4 port #9 In Use @ x4 (Phison PS5013 PCIe 3.0 x4 NVMe 1.3 SSD Controller)
- PCIe 3.0 x1 port #13 In Use @ x1 (Killer E3000 2.5 Gigabit Ethernet Controller)
- PCIe 3.0 x1 port #14 In Use @ x1 (Realtek RTL8168/8111 PCI-E Gigabit Ethernet Adapter)
- PCIe 3.0 x1 port #15 In Use @ x1 (Killer Wi-Fi 6 AX1650x 160MHz Wireless Network Adapter (200NGW))
A pictorial representation of the internal bus structure in relation to the external ports is presented below.
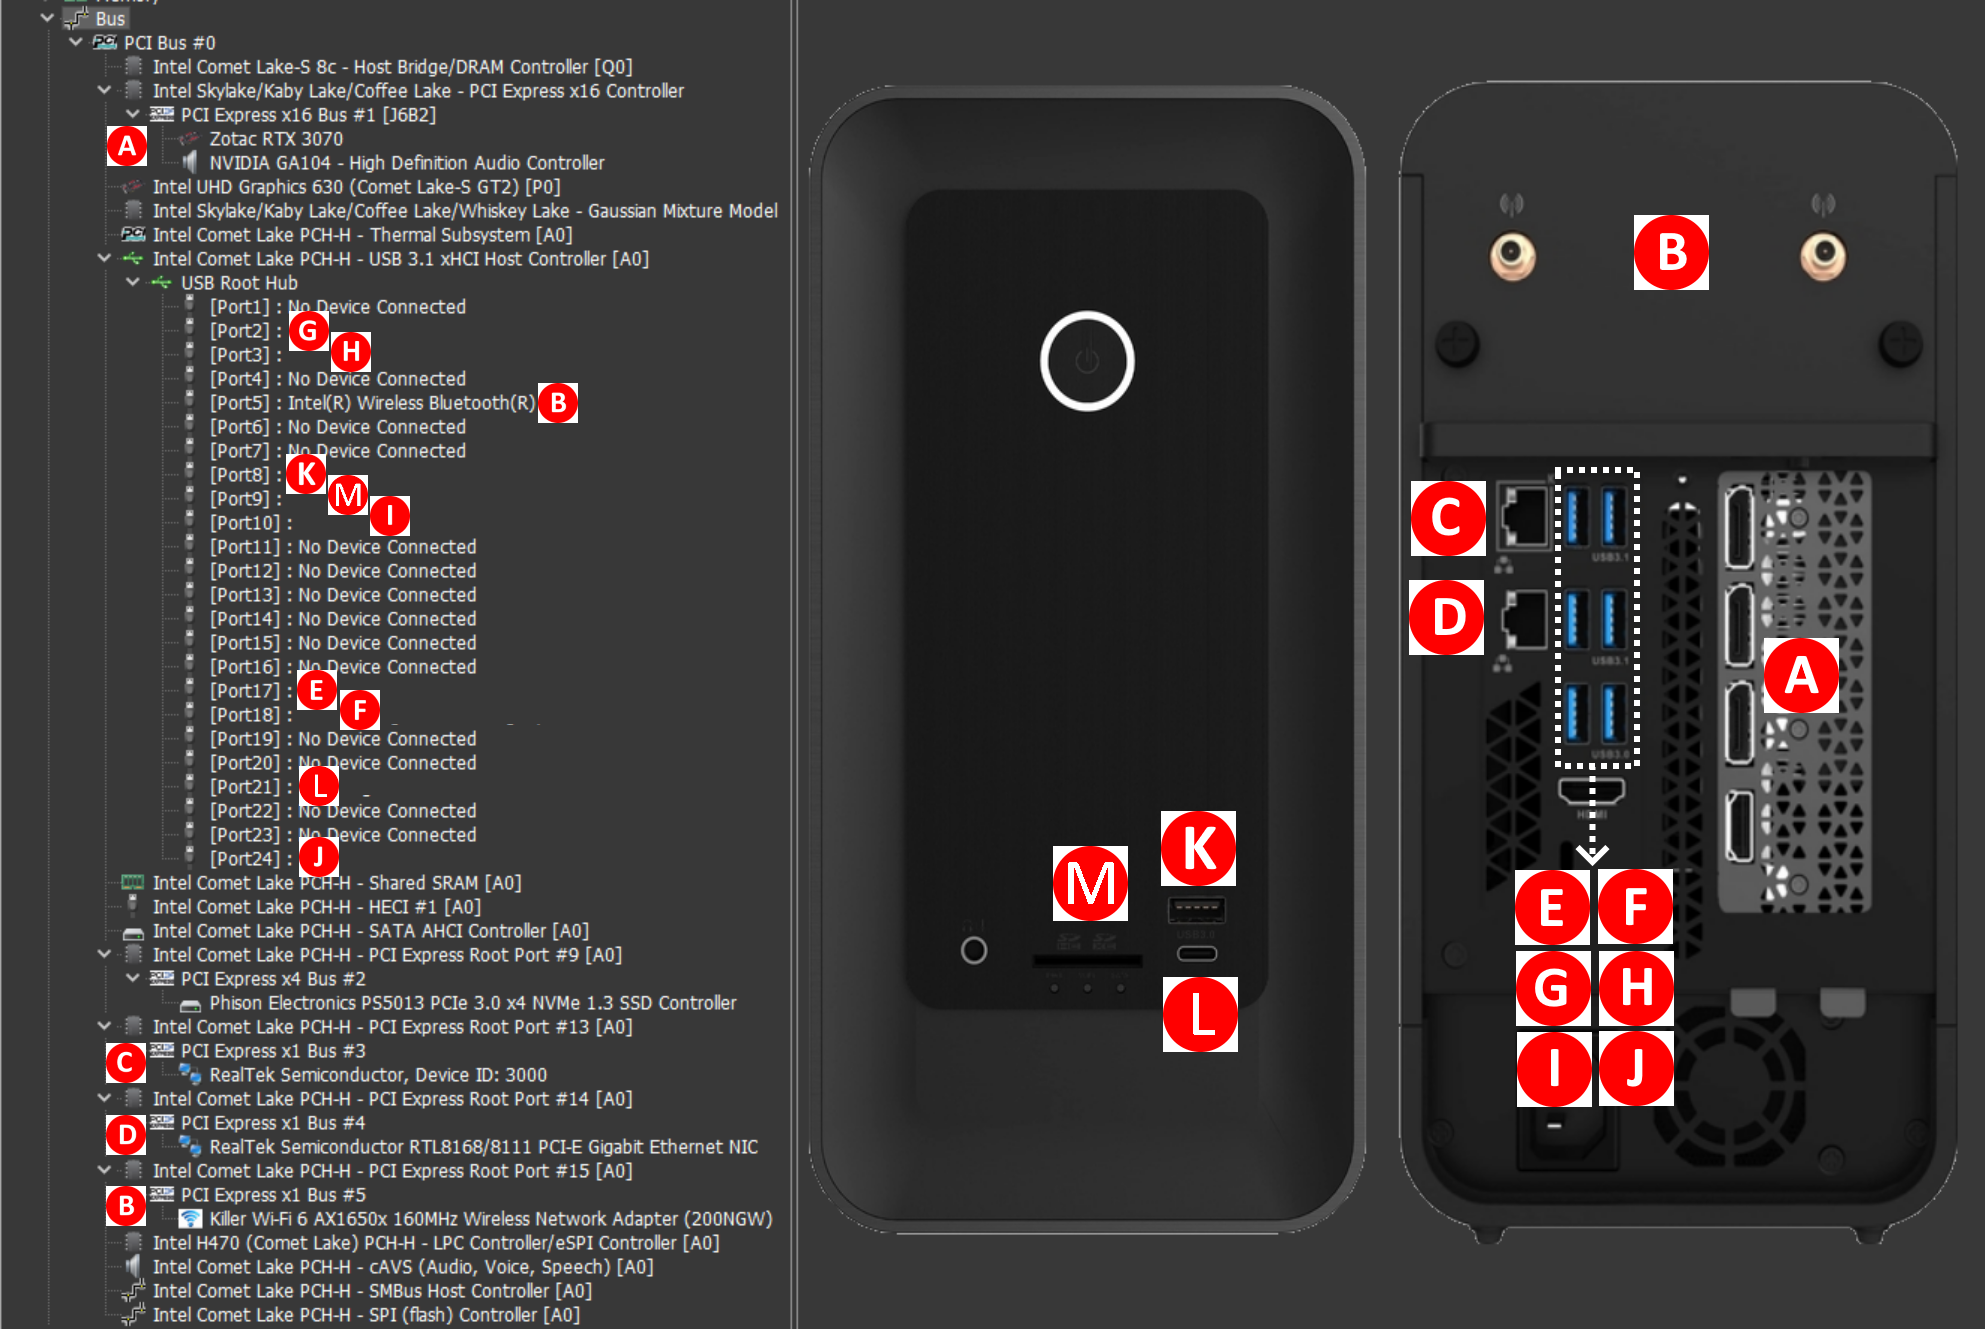
All the USB ports in the system are off a single root hub in the PCH. The SDXC card reader is enabled by a Realtek USB 2.0 card reader, and is restricted to a maximum speed of around 40 MBps practically (no UHS-II support). The audio jack is backed up by a Realtek ALC269 audio codec. Though there are plenty of USB ports to go around, the DMI bottleneck means that it might be difficult to get simultaneous peak performance from more than a couple of ports at a time. All the networking I/Os are also off the PCH, and all the 16 PCIe lanes off the processor are dedicated to the GPU (as it should be in the case of a gaming PC).
In the table below, we have an overview of the various systems that are being compared against the Zotac ZBOX MAGNUS ONE. Note that they may not belong to the same market segment. The relevant configuration details of the machines are provided so that readers have an understanding of why some benchmark numbers are skewed for or against the MAGNUS ONE when we come to those sections.
| Comparative PC Configurations | ||
| Aspect | Zotac ZBOX MAGNUS ONE (ECM73070C) | |
| CPU | Intel Core i7-10700 | Intel Core i7-10700 |
| GPU | ASUS Dual GeForce RTX 3060 12GB GDDR6 Intel UHD Graphics 630 |
ASUS Dual GeForce RTX 3060 12GB GDDR6 Intel UHD Graphics 630 |
| RAM | Crucial CT16G4SFS832A DDR4-3200 SODIMM 22-22-22-52 @ 3200 MHz 1x16 GB |
Crucial CT16G4SFS832A DDR4-3200 SODIMM 22-22-22-52 @ 3200 MHz 1x16 GB |
| Storage | Phison E13 Reference Design (Zotac-sourced) (500 GB; M.2 Type 2280 PCIe 3.0 x4 NVMe; Kioxia 96L 3D TLC) (Phison E13 Controller) Seagate BarraCuda ST1000LM048 (1 TB; 2.5in SATA 6Gb/s) |
Phison E13 Reference Design (Zotac-sourced) (500 GB; M.2 Type 2280 PCIe 3.0 x4 NVMe; Kioxia 96L 3D TLC) (Phison E13 Controller) Seagate BarraCuda ST1000LM048 (1 TB; 2.5in SATA 6Gb/s) |
| Wi-Fi | Intel Killer Wi-Fi 6 AX1650x | Intel Killer Wi-Fi 6 AX1650x |
| Price (in USD, when built) | $2400 (pre-built with Windows 10 Home x64) | $2400 (pre-built with Windows 10 Home x64) |
BAPCo SYSmark 25
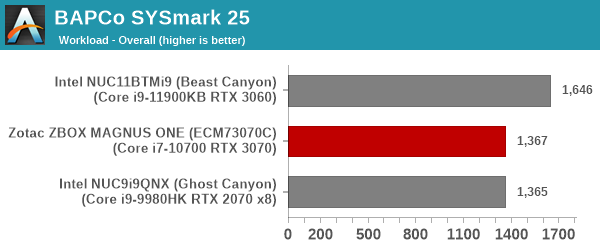
The Zotac ZBOX MAGNUS ONE (ECM73070C) was evaluated using our Fall 2018 test suite for small-form factor PCs. In the first section, we will be looking at SYSmark 25.
BAPCo's SYSmark 25 is an application-based benchmark that uses real-world applications to replay usage patterns of business users in the areas of productivity, creativity, and responsiveness. The 'Productivity Scenario' covers office-centric activities including word processing, spreadsheet usage, financial analysis, software development, application installation, file compression, and e-mail management. The 'Creativity Scenario' represents media-centric activities such as digital photo processing, AI and ML for face recognition in photos and videos for the purpose of content creation, etc. The 'Responsiveness Scenario' evaluates the ability of the system to react in a quick manner to user inputs in areas such as application and file launches, web browsing, and multi-tasking.
Scores are meant to be compared against a reference desktop (the SYSmark 25 calibration system, a Lenovo Thinkcenter M720q with a Core i5-8500T and 8GB of DDR4 memory to go with a 256GB M.2 NVMe SSD). The calibration system scores 1000 in each of the scenarios. A score of, say, 2000, would imply that the system under test is twice as fast as the reference system.

SYSmark 25 also adds energy measurement to the mix. A high score in the SYSmark benchmarks might be nice to have, but, potential customers also need to determine the balance between power consumption and the efficiency of the system. For example, in the average office scenario, it might not be worth purchasing a noisy and power-hungry PC just because it ends up with a 2000 score in the SYSmark 2014 SE benchmarks. In order to provide a balanced perspective, SYSmark 25 also allows vendors and decision makers to track the energy consumption during each workload. In the graphs below, we find the total energy consumed by the PC under test for a single iteration of each SYSmark 25 workload. For reference, the calibration system consumes 8.88 Wh for productivity, 10.81 Wh for creativity, and 19.69 Wh overall.
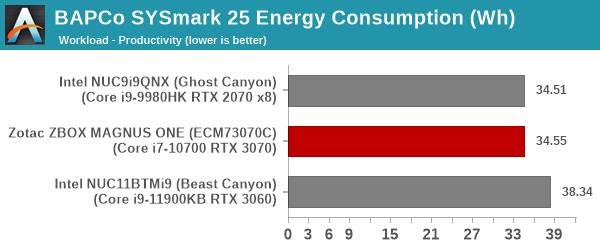
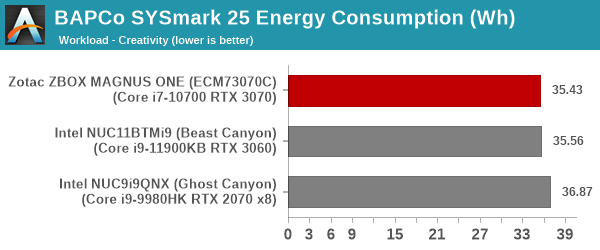
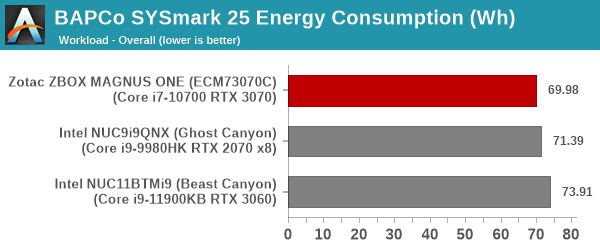
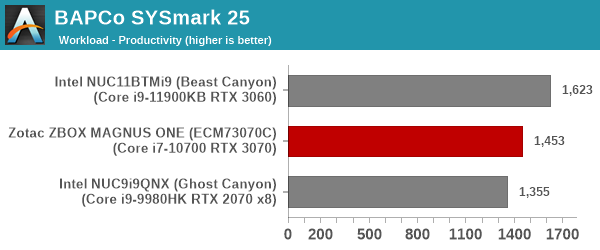
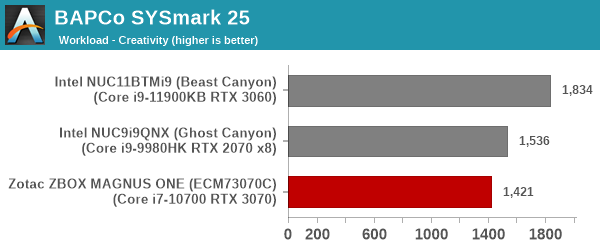
In terms of raw scores, the 65W TDP Tiger Lake processor in the Beast Canyon NUC expectedly outperforms the last-gen Comet Lake-based Core i7-10700 despite the same TDP and same number of cores / threads. The MAGNUS ONE performance for the SYSmark 25 workloads is very similar to that of the Ghost Canyon NUC, but the MAGNUS ONE comes out on top in terms of being energy-efficient while completing the workloads.
UL Benchmarks - PCMark and 3DMark
This section deals with a couple of UL Futuremark benchmarks - PCMark 10, and 3DMark. While PCMark evaluates the system as a whole, 3DMark focuses on the graphics capabilities with emphasis on gaming workloads.
PCMark 10
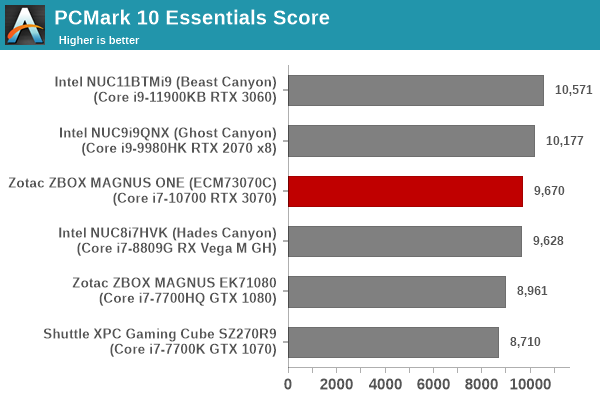
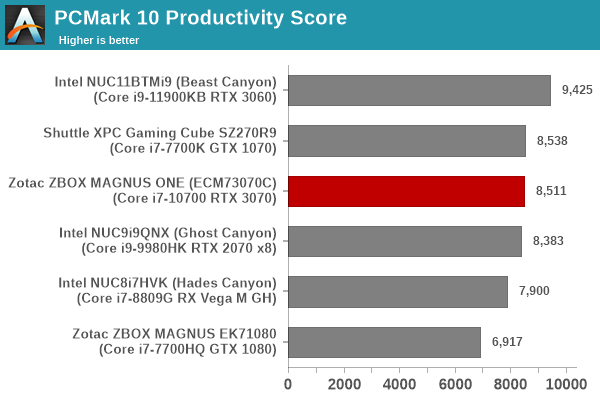
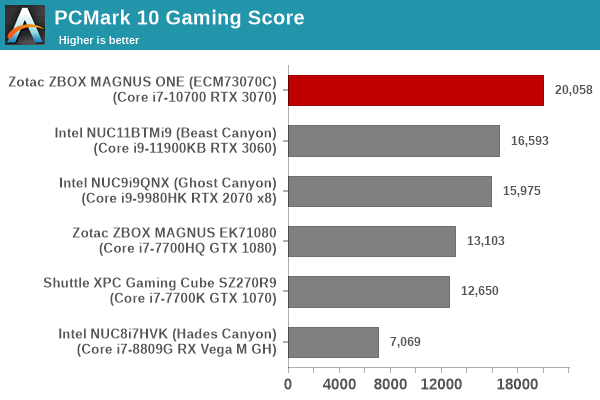
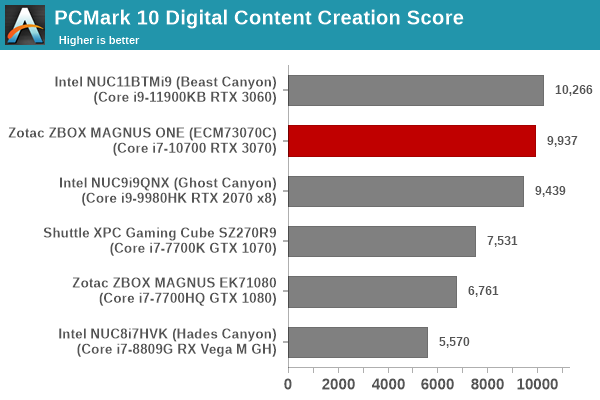
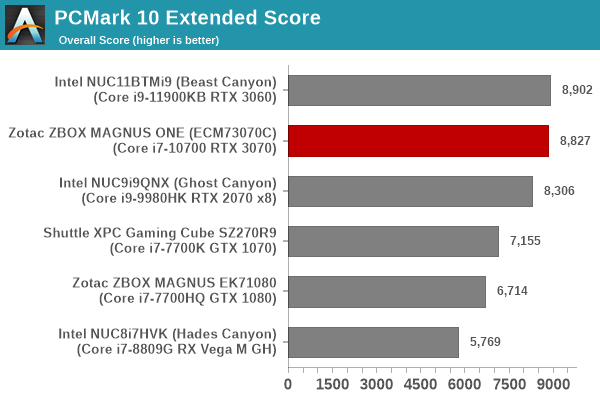
UL's PCMark 10 evaluates computing systems for various usage scenarios (generic / essential tasks such as web browsing and starting up applications, productivity tasks such as editing spreadsheets and documents, gaming, and digital content creation). We benchmarked select PCs with the PCMark 10 Extended profile and recorded the scores for various scenarios. These scores are heavily influenced by the CPU and GPU in the system, though the RAM and storage device also play a part. The power plan was set to Balanced for all the PCs while processing the PCMark 10 benchmark.
The top three slots in all the workloads are shared between the Beast Canyon NUC, the Ghost Canyon NUC, and the ZBOX MAGNUS ONE. The ZBOX comes out comfortably on top in the gaming section, but falls narrowly behind the NUCs in the others. This is nothing unexpected, given that the RTX 3070 is comfortably the highest-performing GPU we have evaluated in any mini-PC as yet.
3DMark
UL's 3DMark comes with a diverse set of graphics workloads that target different Direct3D feature levels. Correspondingly, the rendering resolutions are also different. We use 3DMark 2.4.4264 to get an idea of the graphics capabilities of the system. In this section, we take a look at the performance of the Zotac ZBOX MAGNUS ONE (ECM73070C) across the different 3DMark workloads.
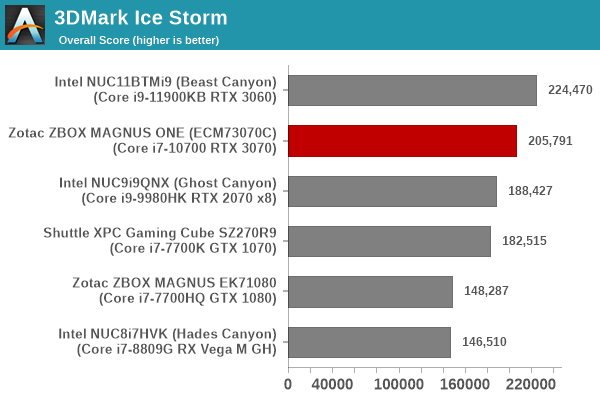
3DMark Ice Storm
This workload has three levels of varying complexity - the vanilla Ice Storm, Ice Storm Unlimited, and Ice Storm Extreme. It is a cross-platform benchmark (which means that the scores can be compared across different tablets and smartphones as well). All three use DirectX 11 (feature level 9) / OpenGL ES 2.0. While the Extreme renders at 1920 x 1080, the other two render at 1280 x 720. The graphs below present the various Ice Storm worloads' numbers for different systems that we have evaluated. Rather than being GPU-bound, the Ice Storm benchmarks benefit greatly from a faster and more efficient CPU - Tiger Lake in the Beast Canyon in this case.
This benchmark sets the tone for what we will observe in many gaming workloads - at lower resolutions and quality settings, the Core i7-10700 in the MAGNUS ONE becomes a liability when compared to the Core i9-11900KB in the Beast Canyon NUC. With the CPU becoming the bottleneck, some of the RTX 3070 potential remains untapped.
| UL 3DMark - Ice Storm Workloads | |||
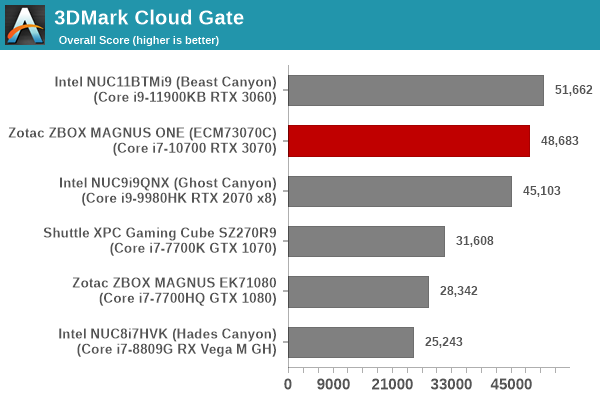
3DMark Cloud Gate
The Cloud Gate workload is meant for notebooks and typical home PCs, and uses DirectX 11 (feature level 10) to render frames at 1280 x 720. The graph below presents the overall score for the workload across all the systems that are being compared. At this low resolution, the score is impacted by the CPU rather than the GPU, and it is not much of a surprise to see the Beast Canyon coming out on top based on the analysis in the previous sub-section.
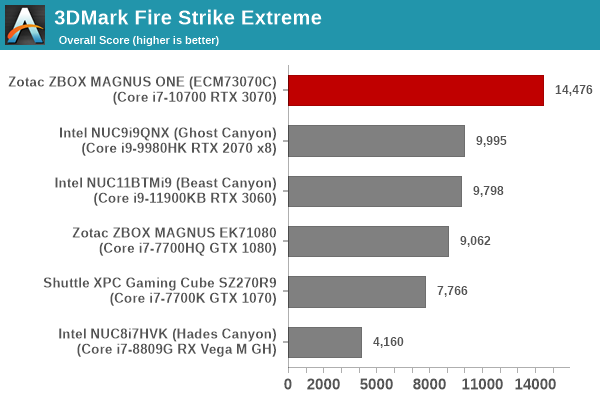
3DMark Fire Strike
The Fire Strike benchmark has three workloads. The base version is meant for high-performance gaming PCs. Similar to Sky Diver, it uses DirectX 11 (feature level 11) to render frames at 1920 x 1080. The Extreme version targets 1440p gaming requirements, while the Ultra version targets 4K gaming system, and renders at 3840 x 2160. The graph below presents the overall score for the Fire Strike Extreme and Fire Strike Ultra benchmark across all the systems that are being compared. The 1080p+ resolutions and change in quality settings finally allow the GPU in the MAGNUS ONE to shine - the system comes out on top by a huge margin compared to the other PCs in the fray.
| UL 3DMark - Fire Strike Workloads | |||
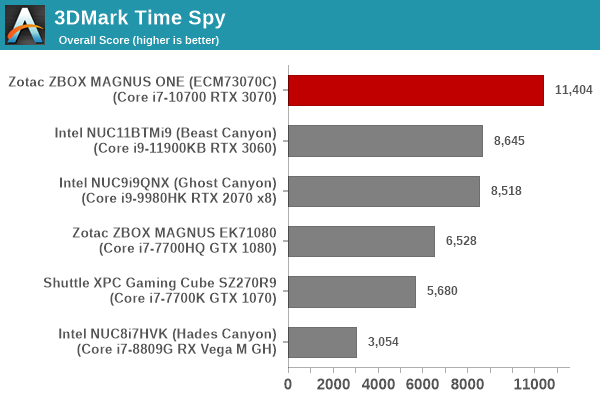
3DMark Time Spy
The Time Spy workload has two levels with different complexities. Both use DirectX 12 (feature level 11). However, the plain version targets high-performance gaming PCs with a 2560 x 1440 render resolution, while the Extreme version renders at 3840 x 2160 resolution. The graphs below present both numbers for all the systems that are being compared in this review. We again see the 1440p and 4K resolutions allowing the MAGNUS ONE to stand out, and that is no surprise given the analysis in the previous sub-sections.
| UL 3DMark - Time Spy Workloads | |||
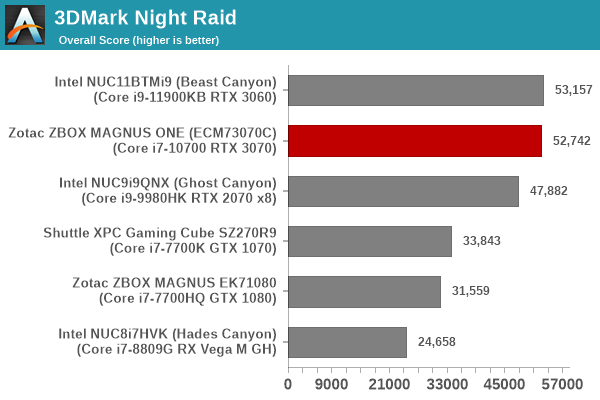
3DMark Night Raid
The Night Raid workload is a DirectX 12 benchmark test. It is less demanding than Time Spy, and is optimized for integrated graphics. The graph below presents the overall score in this workload for different system configurations. An iGPU-focused benchmark means that workload is likely to be geared towards lower resolutions and quality settings. The CPU of the MAGNUS ONE becomes the bottleneck, and the RTX 3070's potential is not fully seen. That said, the system does manage to be in the same league as that of the Beast Canyon and far ahead of others in the fray.
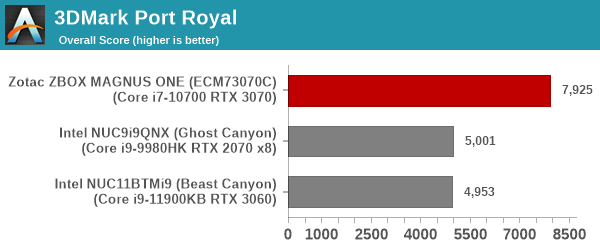
3DMark Port Royal
UL introduced the Port Royal ray-tracing benchmark as a DLC for 3DMark in early 2019. The scores serve as an indicator of how the system handles ray-tracing effects in real-time. As expected, the RTX 3070 with its higher TDP is better off compared to the RTX 3060, allowing the MAGNUS ONE to outscore the Beast and Ghost Canyons by a significant margin.
3DMark CPU Profile Benchmark
UL recently introduced a benchmark to test the multi-threaded capabilities of the CPU in a system. Since gaming workloads are often multi-threaded, it makes sense to include this testing as part of the 3DMark suite. The benchmark routine attempts to perform the simulation of birds / bird-like objects flocking together using as many advanced capabilities as offered by the processor. The workload is configured to run with different number of threads ranging from 1 to 16 (and a single entry for the maximum number of threads allowed in the system).
| UL 3DMark - CPU Profile Benchmark | |||
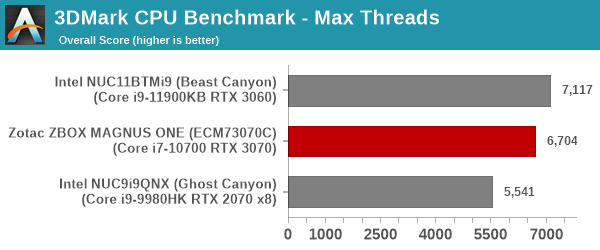
We present the benchmark results for the single and maximum threads case above. Despite the same TDP and similar thread counts, the advanced Tiger Lake microarchitecture allows the Beast Canyon NUC to score better than the MAGNUS ONE. The Ghost Canyon's CPU has a 45W TDP and the 20W delta puts the system at a disadvantage over the MAGNUS ONE and the Beast Canyon.
Miscellaneous Performance Metrics
This section looks at some of the other commonly used benchmarks representative of the performance of specific real-world applications.
Web Browser Benchmarks - JetStream and Speedometer
Web browser-based workloads have emerged as a major component of the typical home and business PC usage scenarios. This sub-section deals with the browser-focused benchmarks from the WebKit developers. Hosted at BrowserBench, JetStream 2.0 benchmarks JavaScript and WebAssembly performance, while Speedometer measures web application responsiveness. We also process MotionMark, but the confidence level of the results vary as much as +/-35%. Hence, we present only the Jetstream 2.0 and Speedometer results for the three top browsers below.
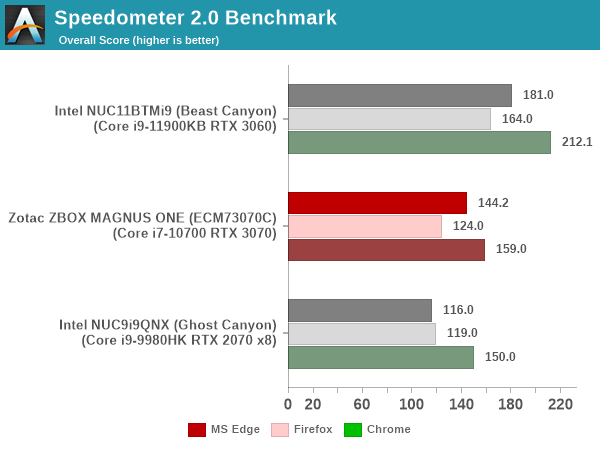
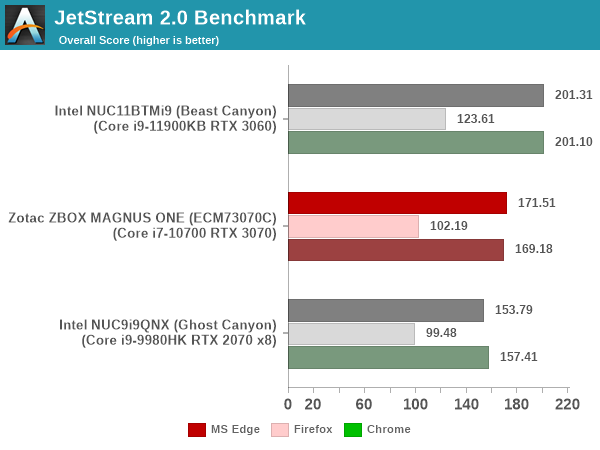
In order to maintain reproducibility, we self-host the BrowserBench benchmarks (git clone of the WebKit repository as on July 1, 2021). The browser versions used for the numbers above are presented in the table included in each system's review. Since this is a new benchmark in the suite, the tables for all systems presented in the graphs above are given below.
| Zotac ZBOX MAGNUS ONE (ECM73070C) Browser Bench | |||
| Speedometer 2.0 | JetStream 2.0 | MotionMark 1.2 | |
| Microsoft Edge (92.0.902.55) |
144.2 ± 0.92 | 171.505 | 669.43 ± 29.55% |
| Google Chrome (92.0.4515.107) |
159 ± 2.9 | 169.176 | 906.14 ± 2.05% |
| Mozilla Firefox (90.0.2.7872) |
124 ± 2.5 | 102.192 | 317.84 ± 31.01% |
BAPCo's SYSmark 25 and UL's PCMark benchmarks both include web browser activities as part of their evaluation scheme. However, the performance for this increasingly important workload tends to get lost in the presentation of a single number. JetStream and Speedometer help us focus on how different PC configurations vary in terms of the user experience with respect to web browsers. The MAGNUS ONE performs slightly better than the Ghost Canyon NUC, but falls well behind the latest Tiger Lake-based Beast Canyon NUC.
3D Rendering - CINEBENCH R23
We use CINEBENCH R23 for 3D rendering evaluation. R23 provides two benchmark modes - single threaded and multi-threaded. Evaluation of different PC configurations in both supported modes provided us the following results.
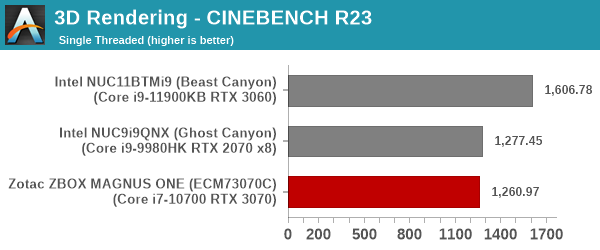
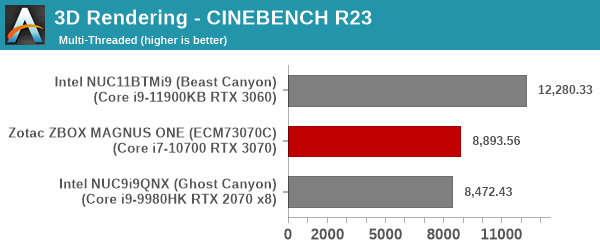
The micro-architectural improvements in Tiger Lake mean that the Beast Canyon NUC is the runaway winner here. The MAGNUS ONE and the Ghost Canyon NUC perform similarly for the single-threaded case, but the extra TDP allows the MAGNUS ONE to outscore it in the multi-threaded scenario.
x265 Benchmark
Next up, we have some video encoding benchmarks using x265 v2.8. The appropriate encoder executable is chosen based on the supported CPU features. In the first case, we encode 600 1080p YUV 4:2:0 frames into a 1080p30 HEVC Main-profile compatible video stream at 1 Mbps and record the average number of frames encoded per second.
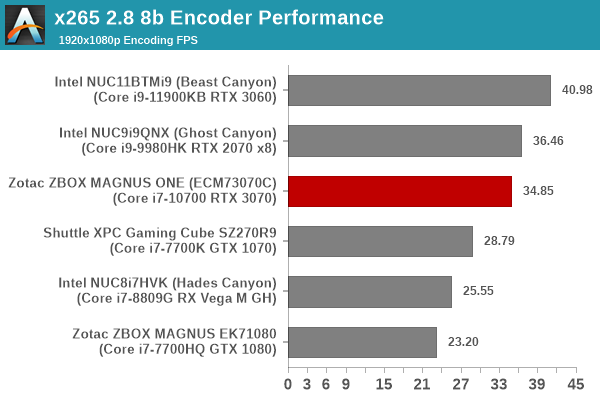
Our second test case is 1200 4K YUV 4:2:0 frames getting encoded into a 4Kp60 HEVC Main10-profile video stream at 35 Mbps. The encoding FPS is recorded.
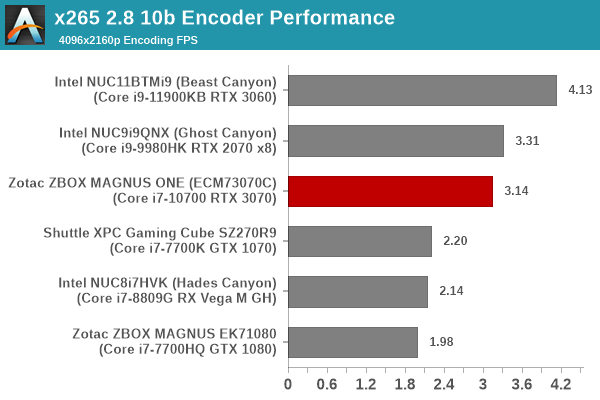
Both the Ghost Canyon NUC and the Beast Canyon NUC outscore the MAGNUS ONE, though the difference is not very significant between the Ghost Canyon NUC and the ZBOX system. The MAGNUS ONE suffers because of the single-channel memory here.
7-Zip
7-Zip is a very effective and efficient compression program, often beating out OpenCL accelerated commercial programs in benchmarks even while using just the CPU power. 7-Zip has a benchmarking program that provides tons of details regarding the underlying CPU's efficiency. In this subsection, we are interested in the compression and decompression rates when utilizing all the available threads for the LZMA algorithm.
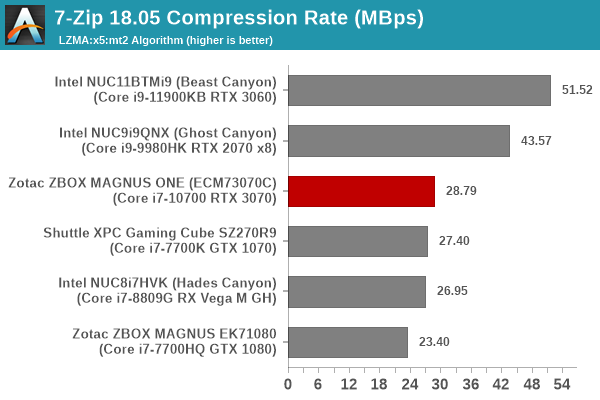
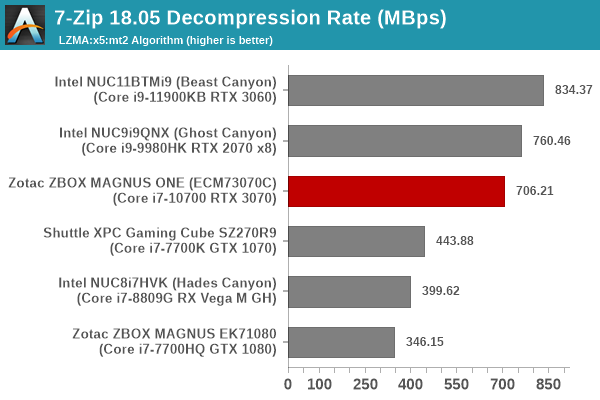
The 65W TDP Core i7-10700 should easily beat the Ghost Canyon NUC here, but the system is held back by the single channel memory configuration.
Cryptography Benchmarks
Cryptography has become an indispensable part of our interaction with computing systems. Almost all modern systems have some sort of hardware-acceleration for making cryptographic operations faster and more power efficient. In this sub-section, we look at two different real-world applications that may make use of this acceleration.
BitLocker is a Windows features that encrypts entire disk volumes. While drives that offer encryption capabilities are dealt with using that feature, most legacy systems and external drives have to use the host system implementation. Windows has no direct benchmark for BitLocker. However, we cooked up a BitLocker operation sequence to determine the adeptness of the system at handling BitLocker operations. We start off with a 2.5GB RAM drive in which a 2GB VHD (virtual hard disk) is created. This VHD is then mounted, and BitLocker is enabled on the volume. Once the BitLocker encryption process gets done, BitLocker is disabled. This triggers a decryption process. The times taken to complete the encryption and decryption are recorded. This process is repeated 25 times, and the average of the last 20 iterations is graphed below.
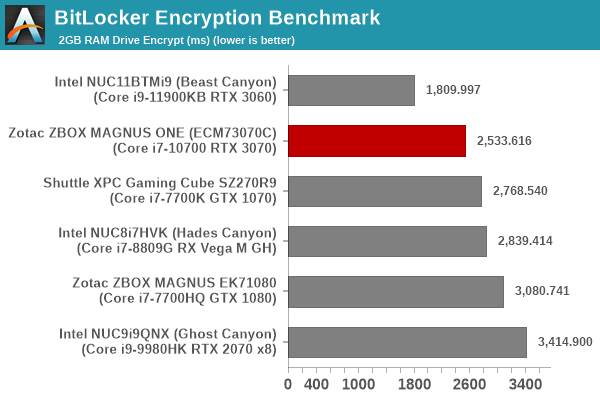
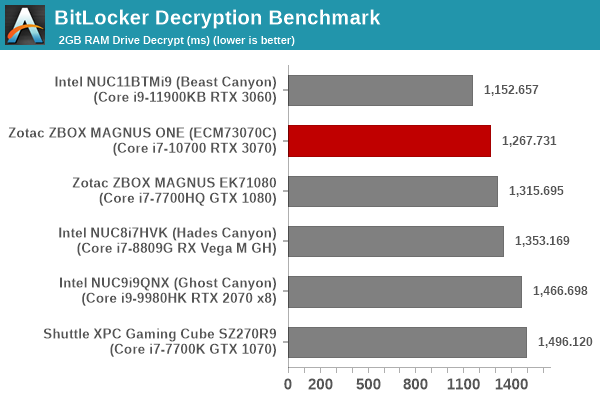
Despite being handicapped by the single-channel memory, the MAGNUS ONE performs well enough to come just behind the Tiger Lake-based Beast Canyon in this cryptography benchmark.
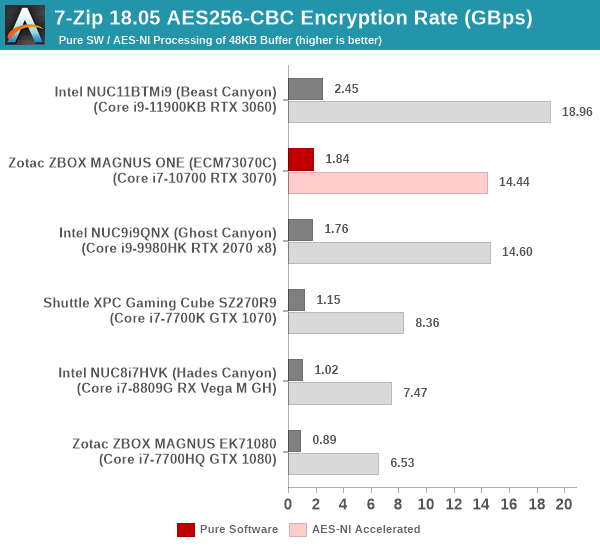
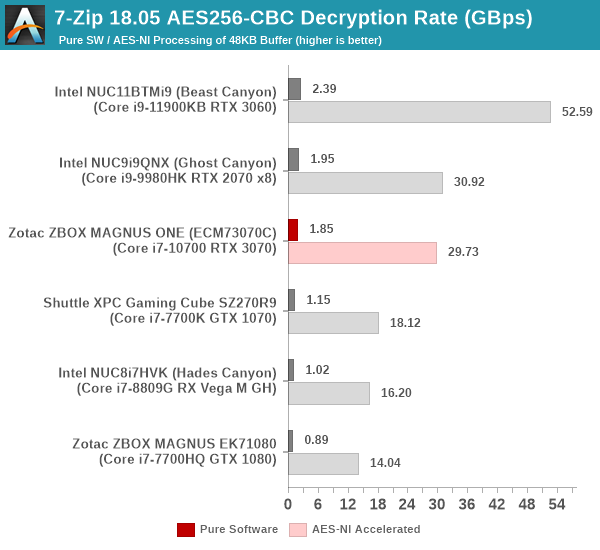
Creation of secure archives is best done through the use of AES-256 as the encryption method while password protecting ZIP files. We re-use the benchmark mode of 7-Zip to determine the AES256-CBC encryption and decryption rates using pure software as well as AES-NI. Note that the 7-Zip benchmark uses a 48KB buffer for this purpose.
Yet another cryptography application is secure network communication. OpenSSL can take advantage of the acceleration provided by the host system to make operations faster. It also has a benchmark mode that can use varying buffer sizes. We recorded the processing rate for a 8KB buffer using the hardware-accelerated AES256-CBC-HAC-SHA1 feature.

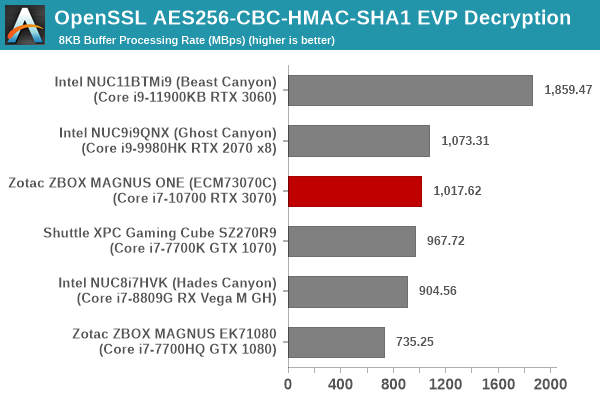
Despite the single-channel memory handicap, the MAGNUS ONE performs very similar to the Ghost Canyon NUC in the above benchmarks. The Beast Canyon NUC with Tiger Lake is in a league of its own, as expected.
Agisoft Photoscan
Agisoft PhotoScan is a commercial program that converts 2D images into 3D point maps, meshes and textures. The program designers sent us a command line version in order to evaluate the efficiency of various systems that go under our review scanner. The command line version has two benchmark modes, one using the CPU and the other using both the CPU and GPU (via OpenCL). We present the results from our evaluation using the CPU mode only. The benchmark (v1.3) takes 84 photographs and does four stages of computation:
- Stage 1: Align Photographs (capable of OpenCL acceleration)
- Stage 2: Build Point Cloud (capable of OpenCL acceleration)
- Stage 3: Build Mesh
- Stage 4: Build Textures
We record the time taken for each stage. Since various elements of the software are single threaded, and others multithreaded, it is interesting to record the effects of CPU generations, speeds, number of cores, and DRAM parameters using this software.
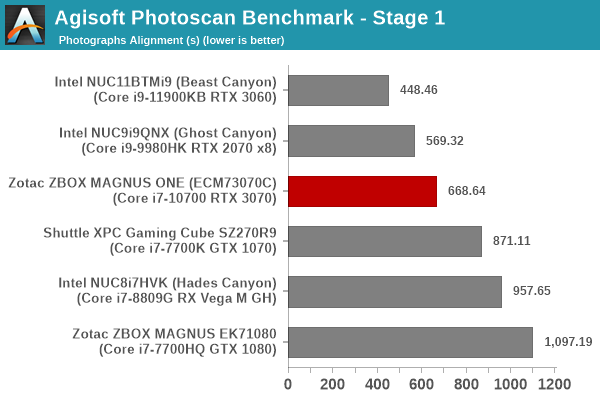
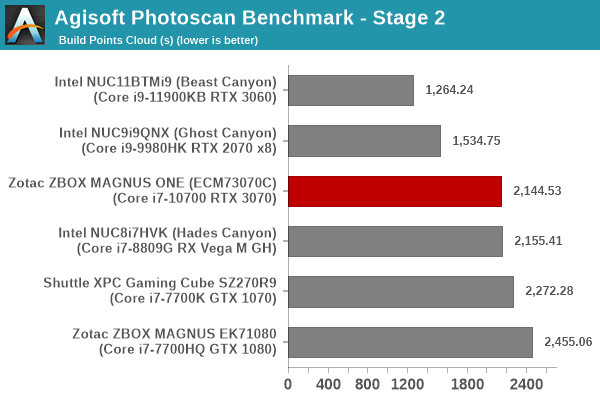
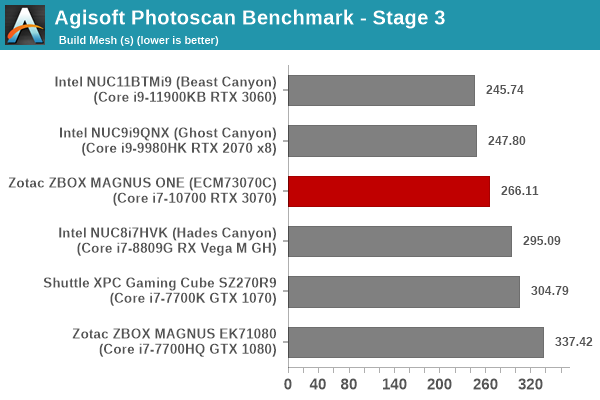
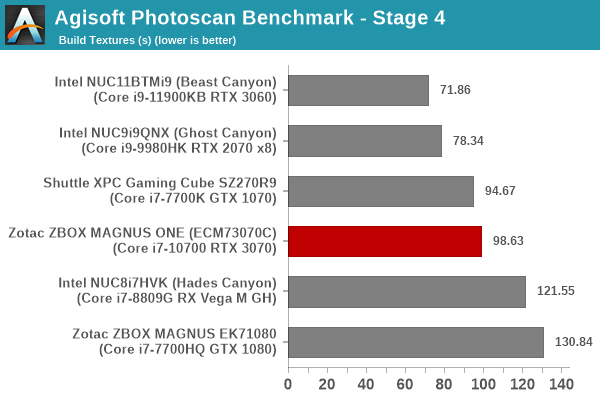
The single-channel memory configuration significantly hurts the MAGNUS ONE in the Photoscan benchmark, with the system coming in the middle of the pack overall - performing even worse than Kaby Lake-based systems in some segments.
Dolphin Emulator
Wrapping up our application benchmark numbers is the new Dolphin Emulator (v5) benchmark mode results. This is again a test of the CPU capabilities, and the memory bandwidth doesn't play much of a role.
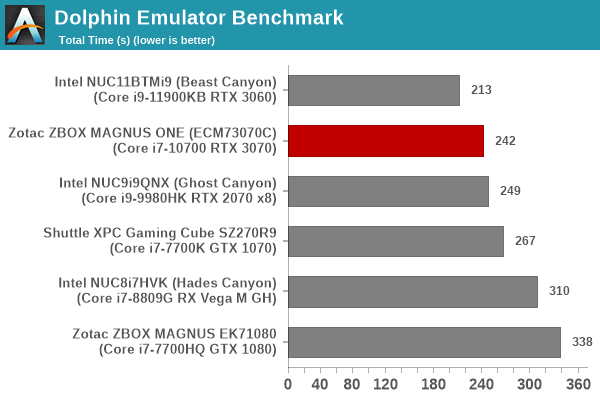
The MAGNUS ONE performs well enough to surpass the Ghost Canyon NUC despite the single-channel penalty.
GPU Performance - Gaming Workloads
The gaming prowess of the MAGNUS ONE was evaluated using our 2018 gaming test suite (to ensure we have a good set of comparison points from our previous reviews):
- Civlization VI (DX12)
- Dota 2
- F1 2017
- Grand Theft Auto V
- Middle Earth: Shadow of War
- Far Cry 5
Most system reviews take a handful of games and process them at one resolution / quality settings for comparison purposes. Recently, we have seen many pre-built systems coming out with varying gaming capabilities. Hence, it has become imperative to give consumers an idea of how a given system performs over a range of resolutions and quality settings for each game. With our latest suite, we are able to address this aspect.
Civilization VI (DX12)
The Civilization series of turn-based strategy games is very popular. For such games, the frame rate is not necessarily an important factor in the gaming experience. However, with Civilization VI, Firaxis has cranked up the visual fidelity to make the game more attractive. As a result, the game can be taxing on the GPU as well as the CPU, particularly in the DirectX 12 mode.
| Civilization VI (DirectX 12) Performance | |||
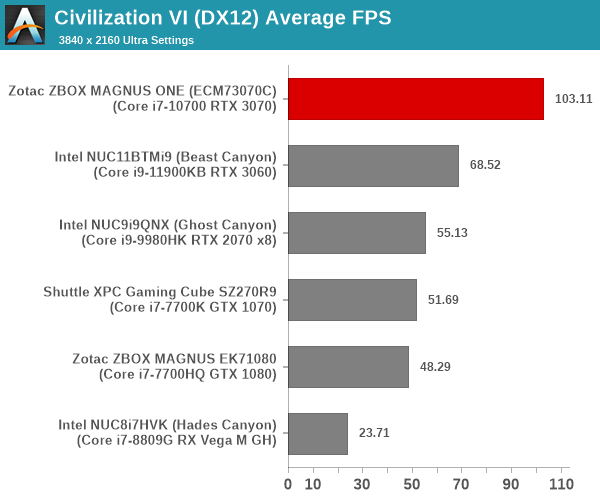
We processed the built-in benchmark at two different resolutions (1080p and 2160p), and with two different quality settings (medium and ultra, with the exact differences detailed here). At higher resolutions and quality settings, the RTX 3070 in the MAGNUS ONE is allowed to show its potential. However, for the 1080p medium setting, we see the Beast Canyon NUC leapfrog the MAGNUS ONE - showing that the slower CPU can be a handicap in certain gaming scenarios.
Dota 2
Dota 2 has been featuring in our mini-PC and notebook reviews for a few years now, but, it still continues to be a very relevant game. Our evaluation was limited to a custom replay file at 1080p resolution with enthusiast settings ('best-looking' preset). We have now revamped our testing to include multiple resolutions - This brings out the fact that the game is CPU-limited in many configurations.
Dota 2 allows for multiple renderers - we use the DirectX 11 mode. The rendering settings are set to 'enthusiast level' (best-looking, which has all options turned on, and at Ultra level, except for the Shadow Quality set to 'High'). We cycle through different resolutions after setting the monitor resolution to match the desired resolution. The core scripts and replay files are sourced from Jonathan Liebig's original Dota 2 benchmarking instructions which used a sequence of frames from Match 3061101068.
| Dota 2 - Enthusiast Quality Performance | |||
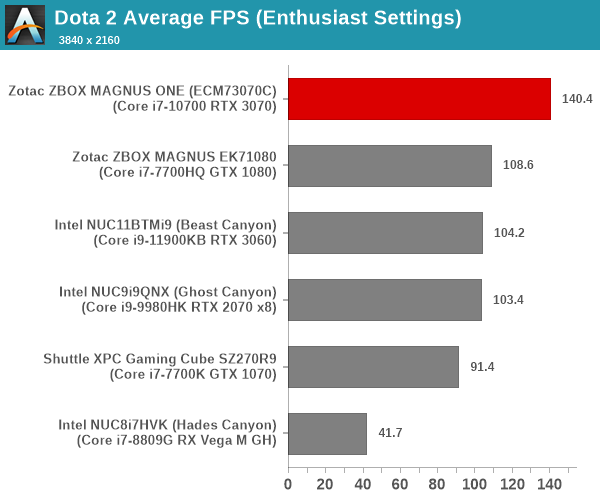
At 4K, the MAGNUS ONE comes out on top by a significant margin. However, at 1440p and lower resolutions, the CPU and single-channel memory handicap catch up with it, allowing the Ghost Canyon NUC to deliver similar / better performance, while falling well behind the Beast Canyon NUC.
F1 2017
Our gaming system reviews have always had a representative racing game in it. While our previous benchmark suite for PCs featured Dirt 2, we have moved on to the more recent F1 2017 from Codemasters for our revamp.
| F1 2017 - Ultra Quality Performance | |||
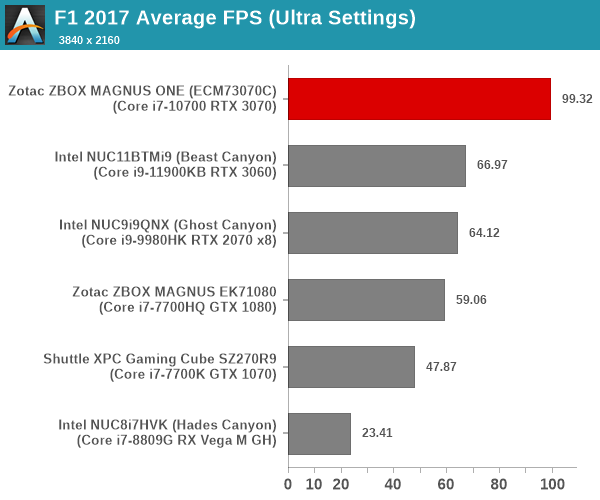
The supplied example benchmark (with some minor tweaks) is processed at four different resolutions while maintaining the graphics settings at the built-in 'Ultra' level. At 1440p and 4K, the RTX 3070 in the MAGNUS ONE leaves the other systems well behind. However, at 1080p, the Beast Canyon NUC catches up, and at 720p, even the Ghost Canyon NUC surpasses it.
Grand Theft Auto V
GTA doesn't provide graphical presets, but opens up the options to users and extends the boundaries by pushing even the hardest systems to the limit using Rockstar's Advanced Game Engine under DirectX 11. Whether the user is flying high in the mountains with long draw distances or dealing with assorted trash in the city, when cranked up to maximum it creates stunning visuals but hard work for both the CPU and the GPU. For our test we have scripted a version of the in-game benchmark. The in-game benchmark consists of five scenarios: four short panning shots with varying lighting and weather effects, and a fifth action sequence that lasts around 90 seconds. We use only the final part of the benchmark, which combines a flight scene in a jet followed by an inner city drive-by through several intersections followed by ramming a tanker that explodes, causing other cars to explode as well. This is a mix of distance rendering followed by a detailed near-rendering action sequence.
| Grand Theft Auto V Performance | |||
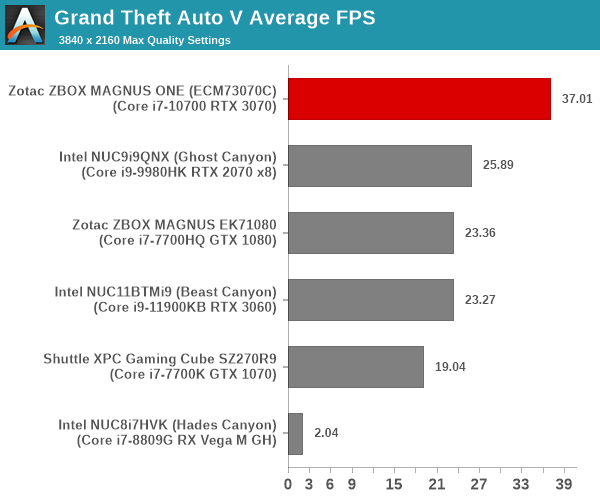
We processed the benchmark across various resolutions and quality settings (detailed here). The results are presented above. The story seen in the previous games plays out here too - for higher quality settings and larger resolutions, the MAGNUS ONE comes out on top, but lower quality settings and lower resolutions expose the CPU / memory handicap.
Middle Earth: Shadow of War
Middle Earth: Shadow of War is an action RPG. In our previous gaming benchmarks suite, we used its prequel - Shadow of Mordor. Produced by Monolith and using the new LithTech Firebird engine and numerous detail add-ons, Shadow of War goes for detail and complexity. The graphics settings include standard options such as Graphical Quality, Lighting, Mesh, Motion Blur, Shadow Quality, Textures, Vegetation Range, Depth of Field, Transparency and Tessellation. There are standard presets as well. The game also includes a 'Dynamic Resolution' option that automatically alters graphics quality to hit a pre-set frame rate. We benchmarked the game at four different resolutions - 4K, 1440p, 1080p, and 720p. Two standard presets - Ultra and Medium - were used at each resolution after turning off the dynamic resolution option.
| Middle Earth: Shadow of War Performance | |||
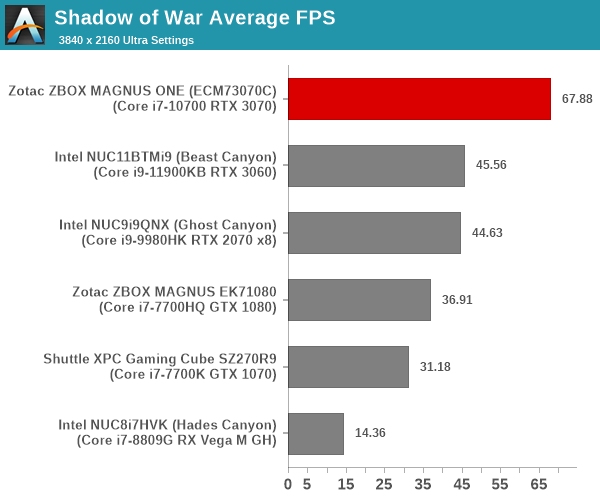
Except for the 1080p medium settings and the 720p resolution, the MAGNUS ONE comes out comfortably on top, thanks to the RTX 3070's prowess. At the lower resolutions, the CPU and memory channel handicap again play spoilsport.
Far Cry 5
Ubisoft's Far Cry 5 is an action-adventure first-person shooter game released in March 2018. The game comes with an in-built benchmark and has standard pre-sets for quality settings. We benchmarked the game at four different resolutions - 720p, 1080p, 1440p, and 2160p. Two preset quality settings were processed at each resolution - normal and ultra.
| Far Cry 5 Performance | |||
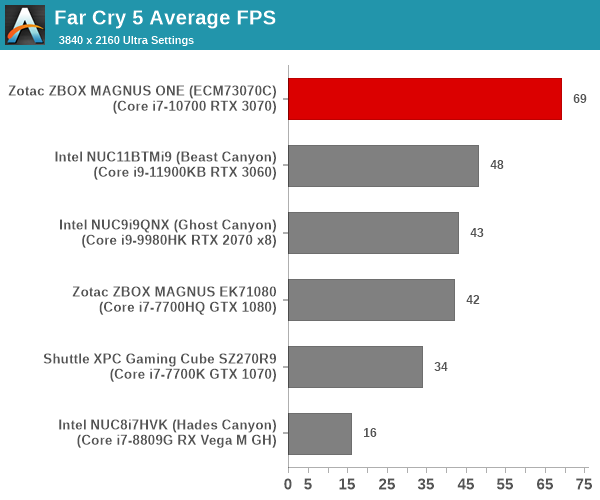
At 4K and 144p, the RTX 3070 in the MAGNUS ONE performs admirably to take the top spot. The CPU and memory channel configuration again return to haunt the system and push it towards the middle of the pack at lower resolutions.
Overall, the MAGNUS ONE is a great system for 1440p and even 4K gaming, but its performance could easily do with some improvements at lower resolutions by using dual-channel memory to get rid of any CPU bottlenecks.
GPU Performance - HTPC Workloads
Media playback and video post-processing without taxing the CPU are some of the functionalities that have been relegated to GPUs over the 10 - 15 years. The transitions to higher video resolutions and complicated video codecs have become more frequent. While the move from SD (480p) to HD (720p) took the better part of the 2000s, the transition to FHD (1080p), 4K (2160p), and now 8K (4320p) have all happened in the last decade. The rise of over-the-top (OTT) delivery platforms like YouTube, Netflix, etc. have accelerated the development and deployment of new codecs and higher resolution videos.
On Windows, GPUs expose their video decoding and post-processing capabilities via DXVA / D3D11 APIs. The DXVAChecker program provides a quick overview of the GPU features related to these aspects.
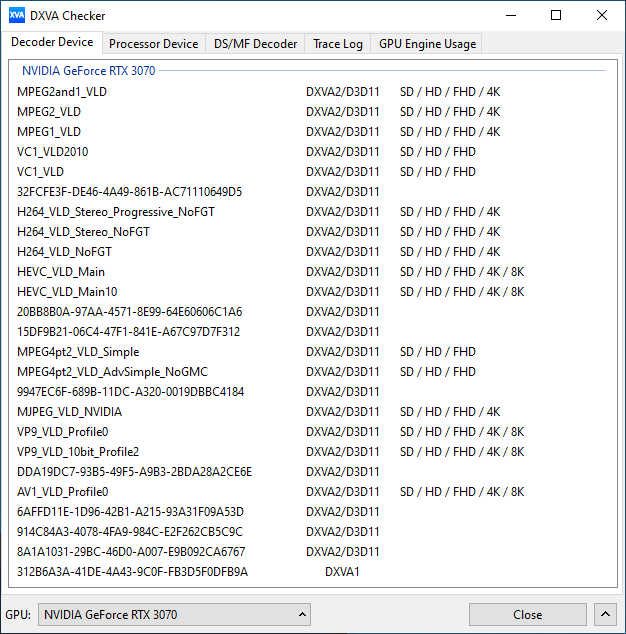
The RTX 3070 is able to decode all varieties of codecs that are currently in vogue, including AV1.
Windows has adopted an on-demand delivery of OS components for activating the usage of these APIs. Similar to the MS Store HEVC codec, the AV1 codec is also being delivered via the MS store. While open-source programs like MPC-HC can use the AV1 decoding capabilities of the GPU using the LAV Filters component, AV1 decoding with MS Edge requires the installation of the extension.
YouTube Streaming
The move to 4K and 8K, and the need to evaluate HDR support have made us choose Mystery Box's Peru 8K HDR 60FPS video as our test sample moving forward. On PCs running Windows, it is recommended that HDR streaming videos be viewed using the Microsoft Edge browser after putting the desktop in HDR mode.
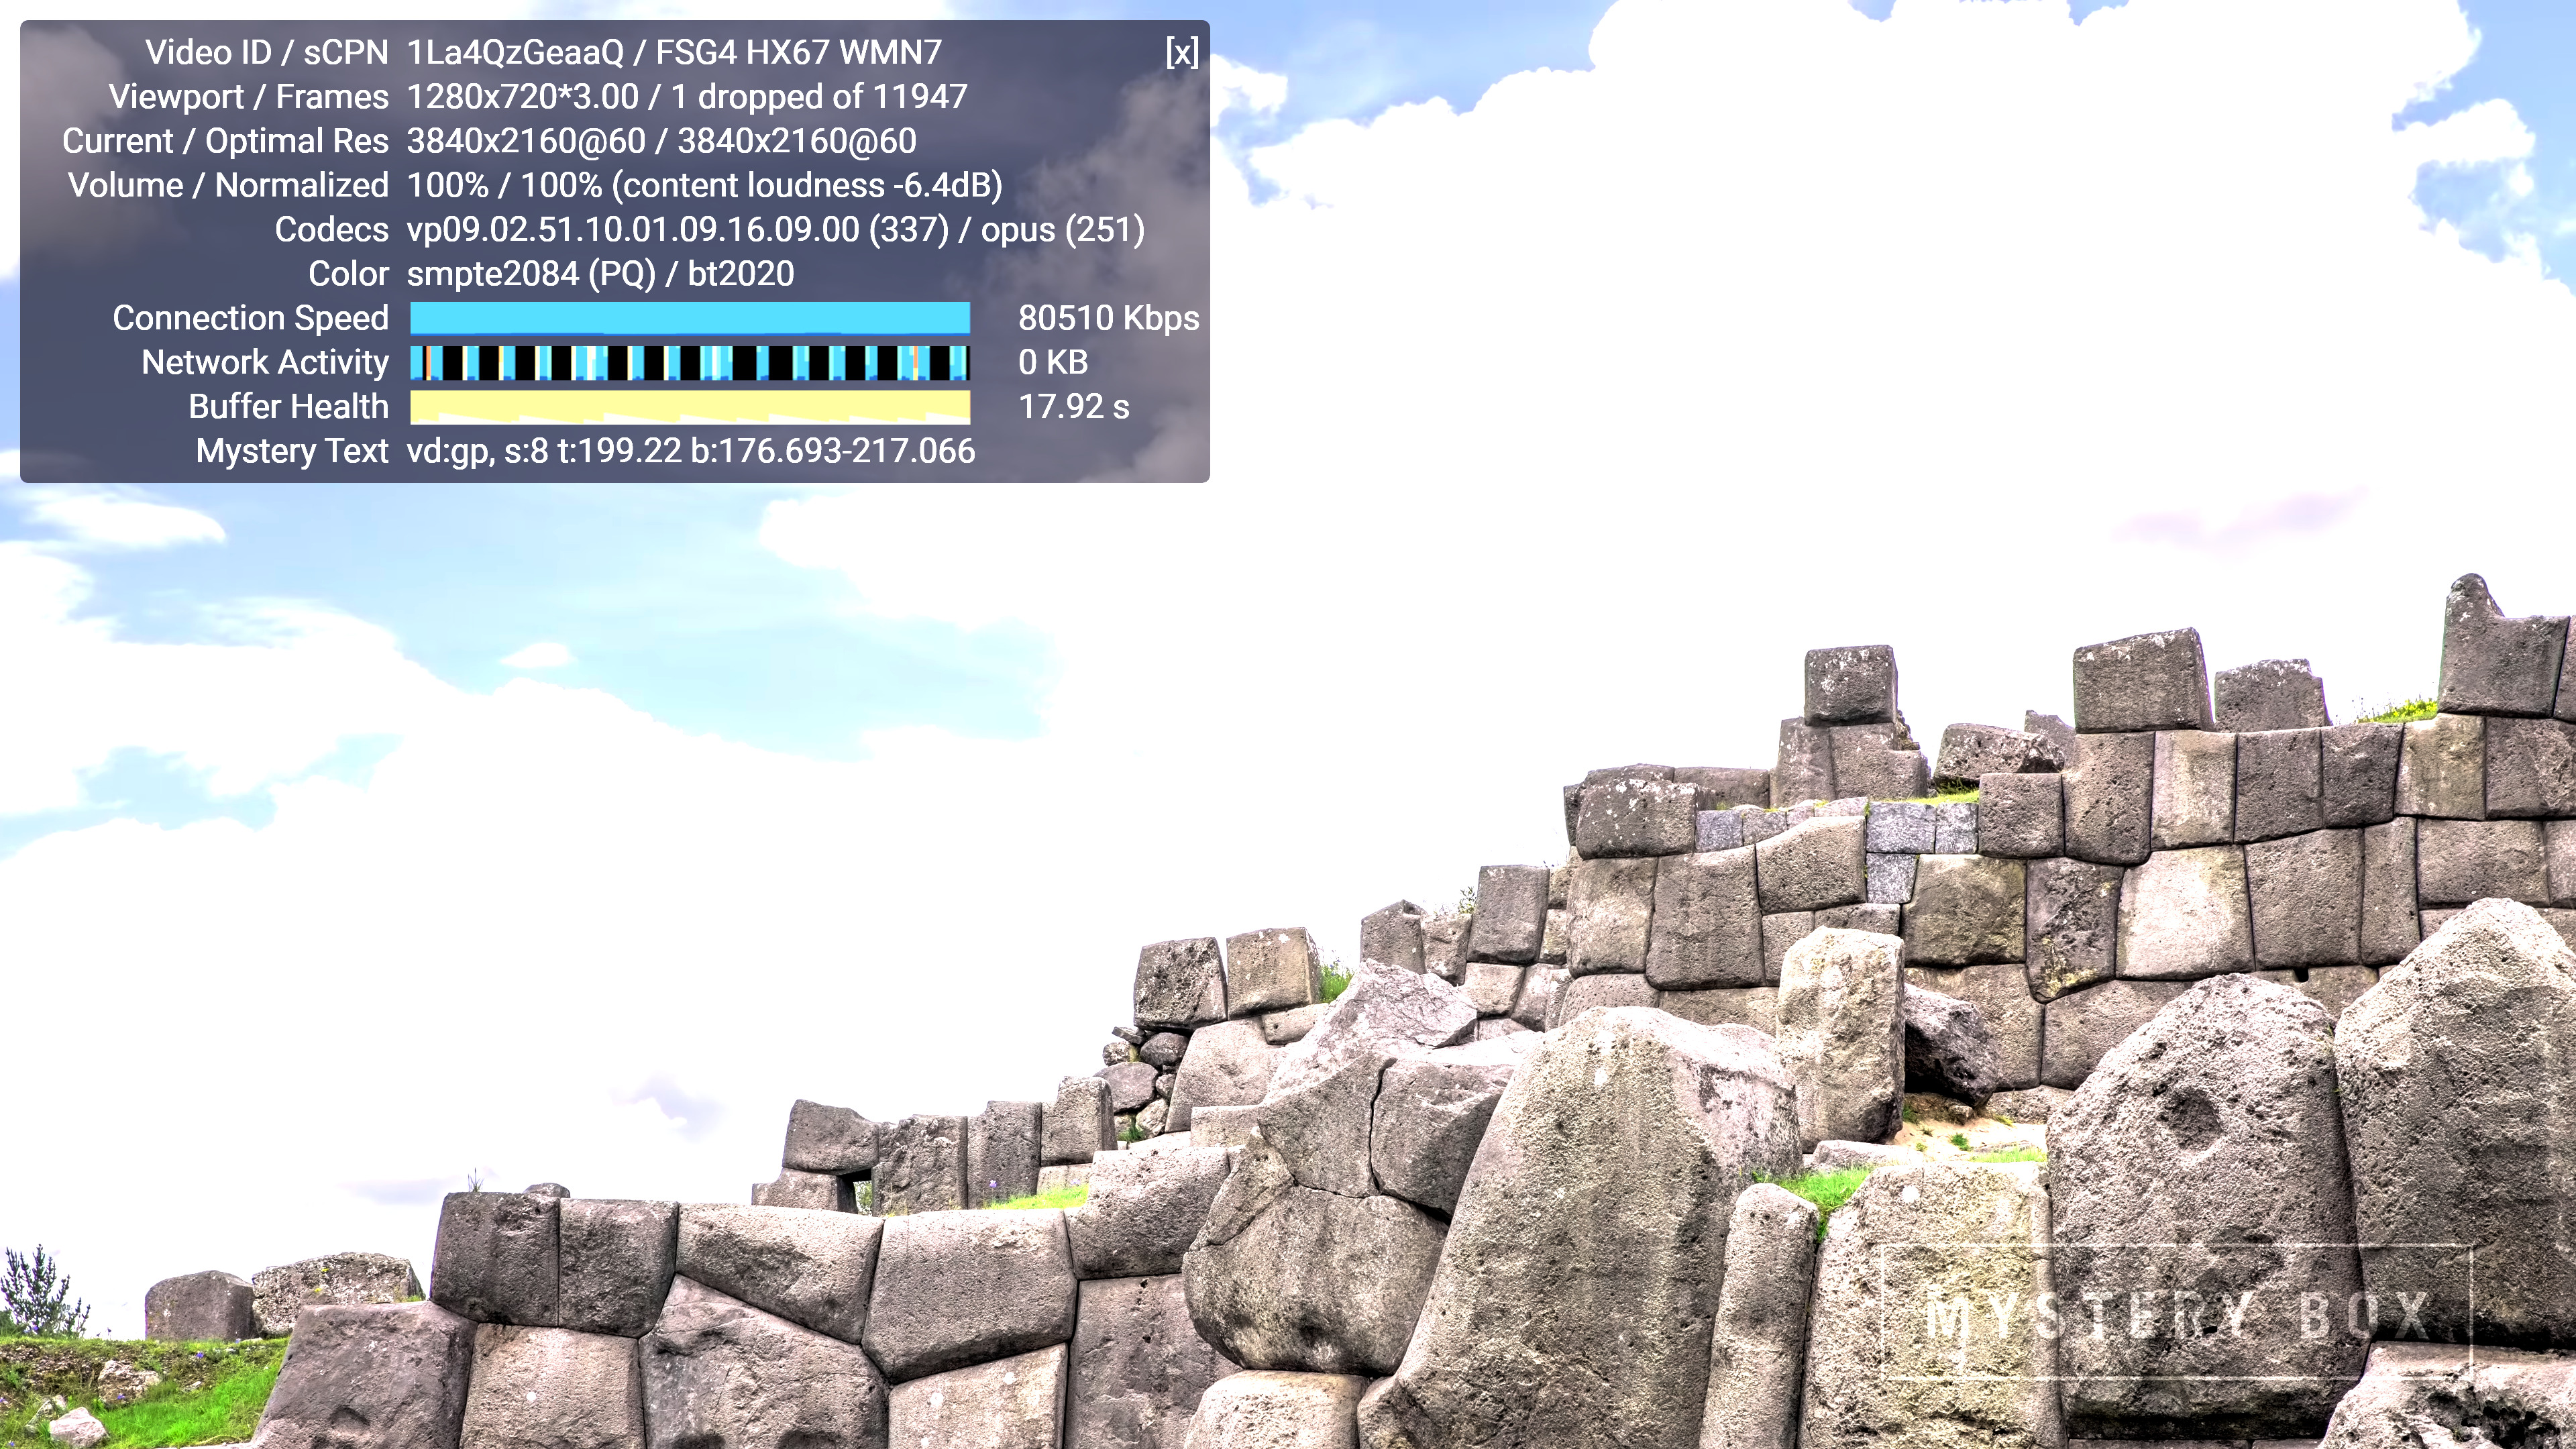
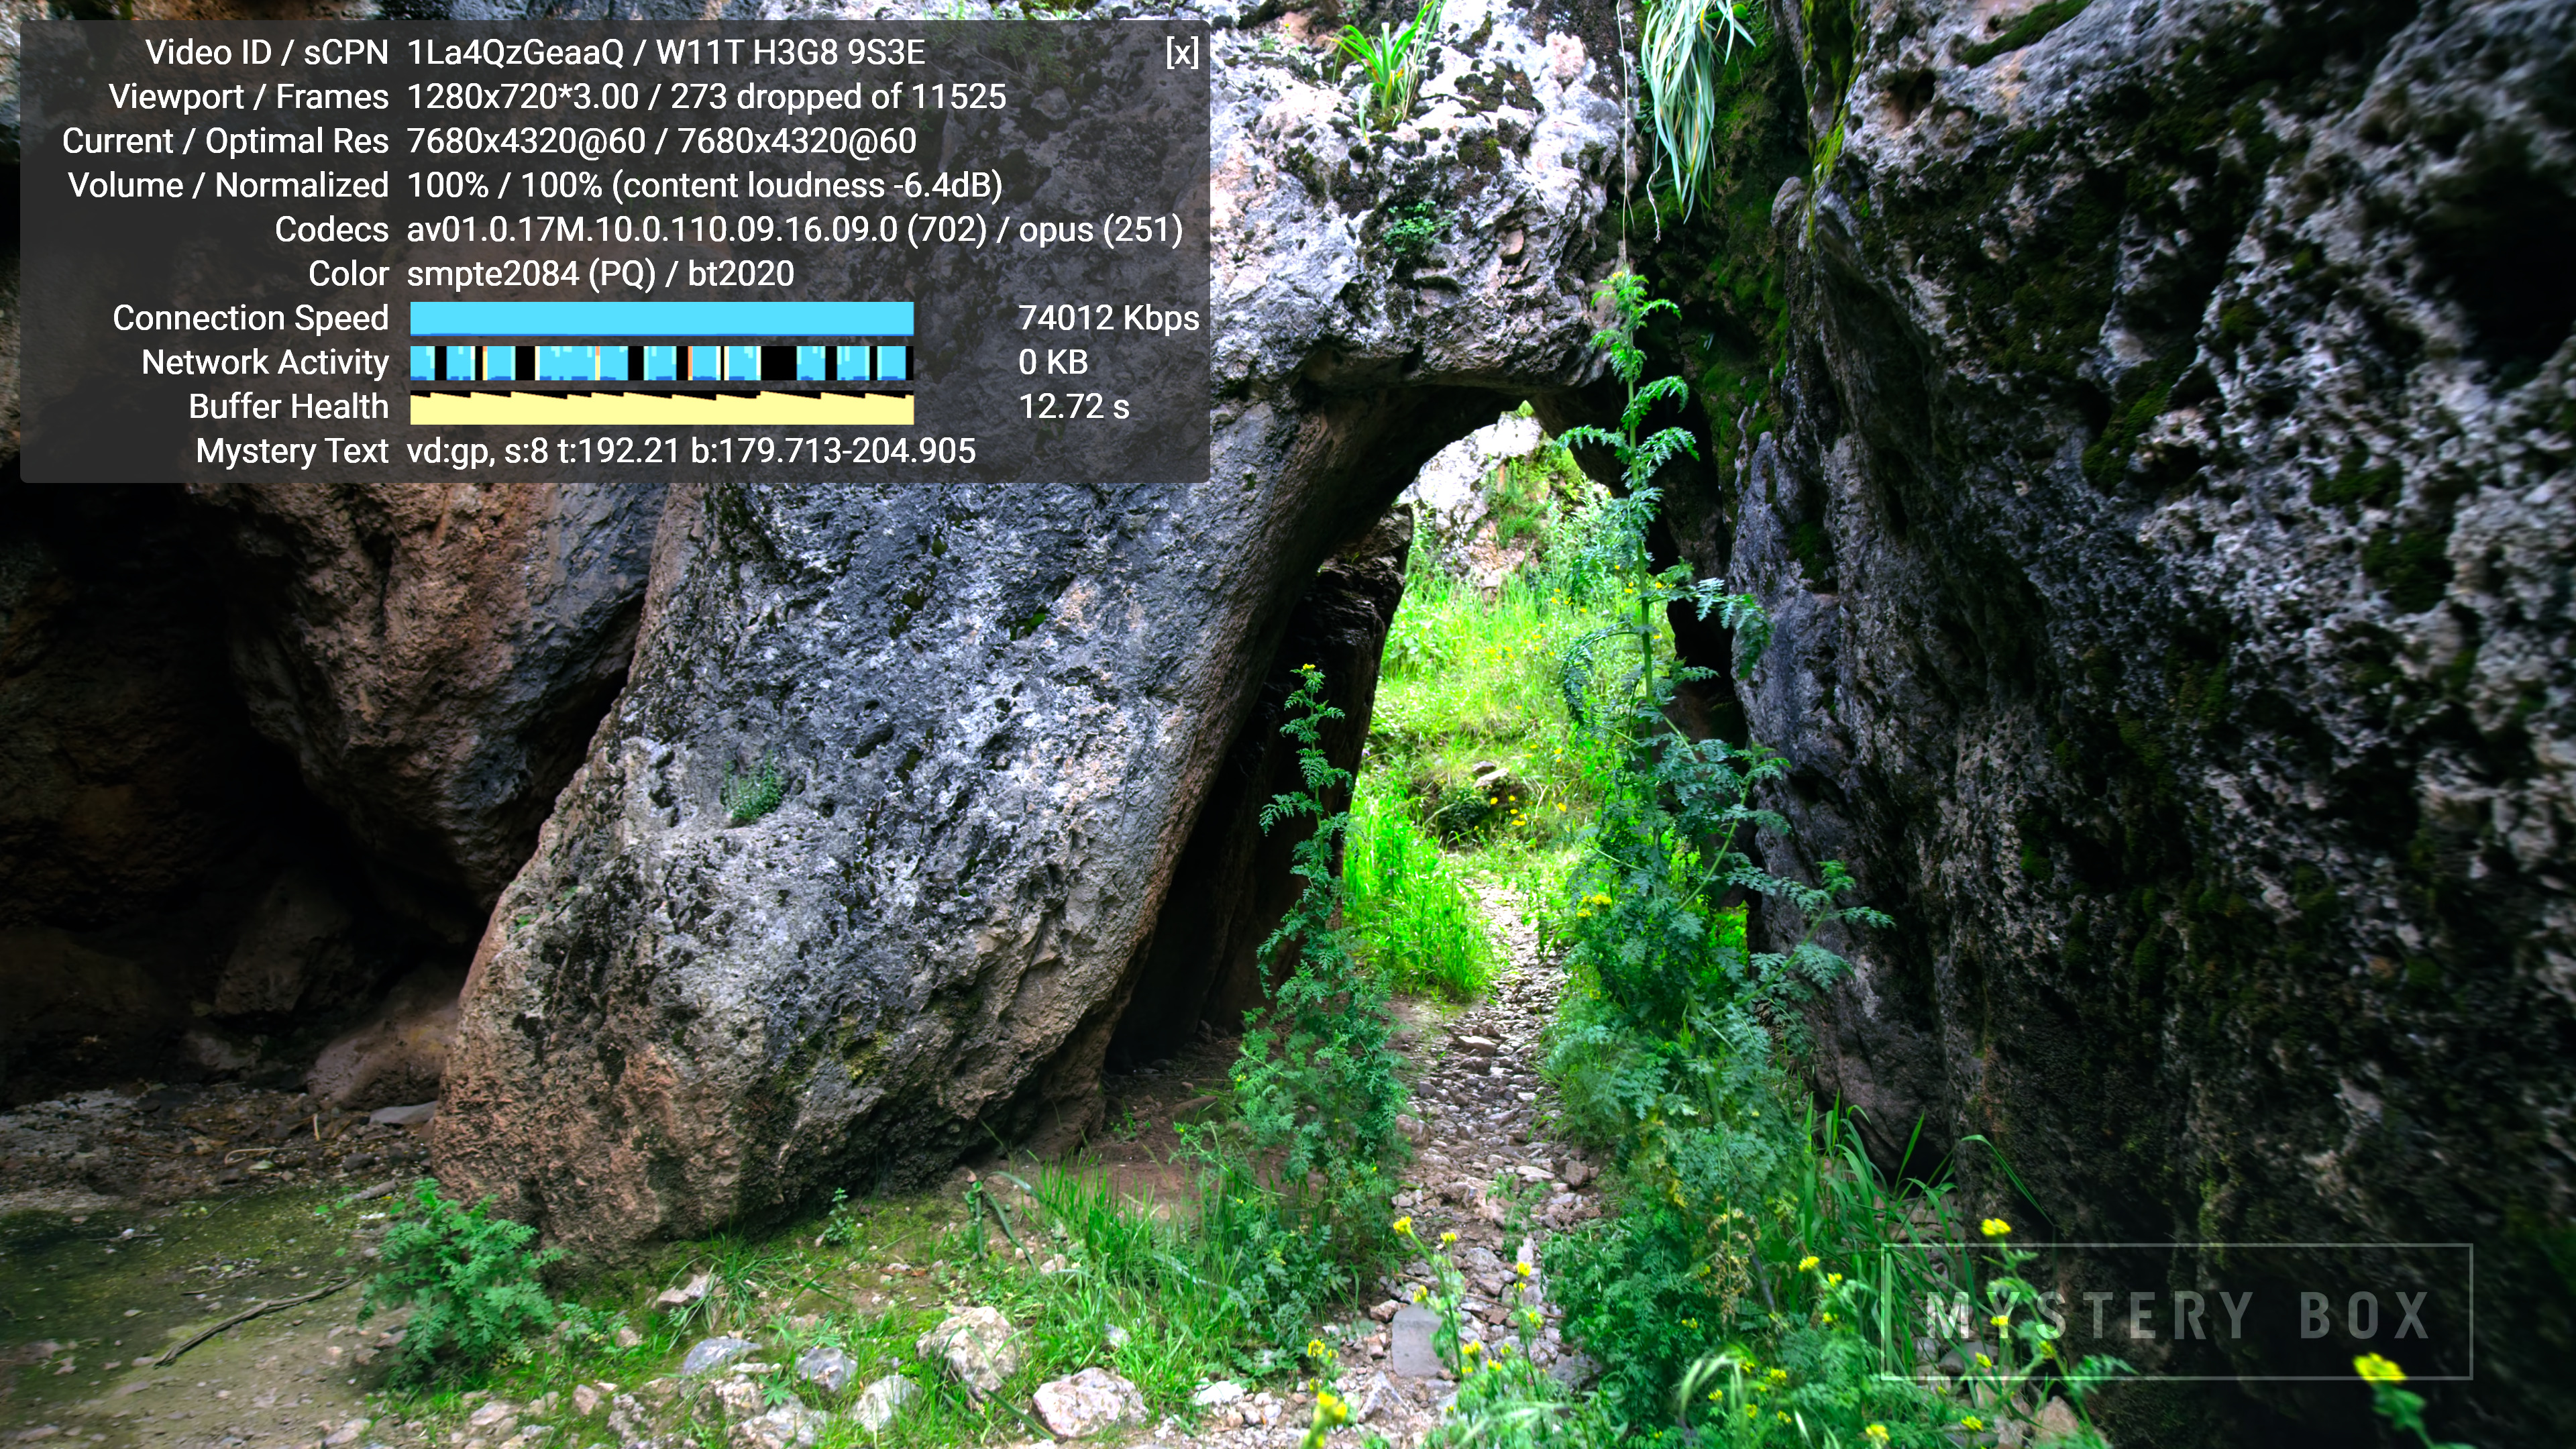
Without installing the AV1 extension, the VP9 Profile 2 4K version is played back as shown above. However, installing the extension allows flawless playback of the 8K version, as shown in the screenshot below.
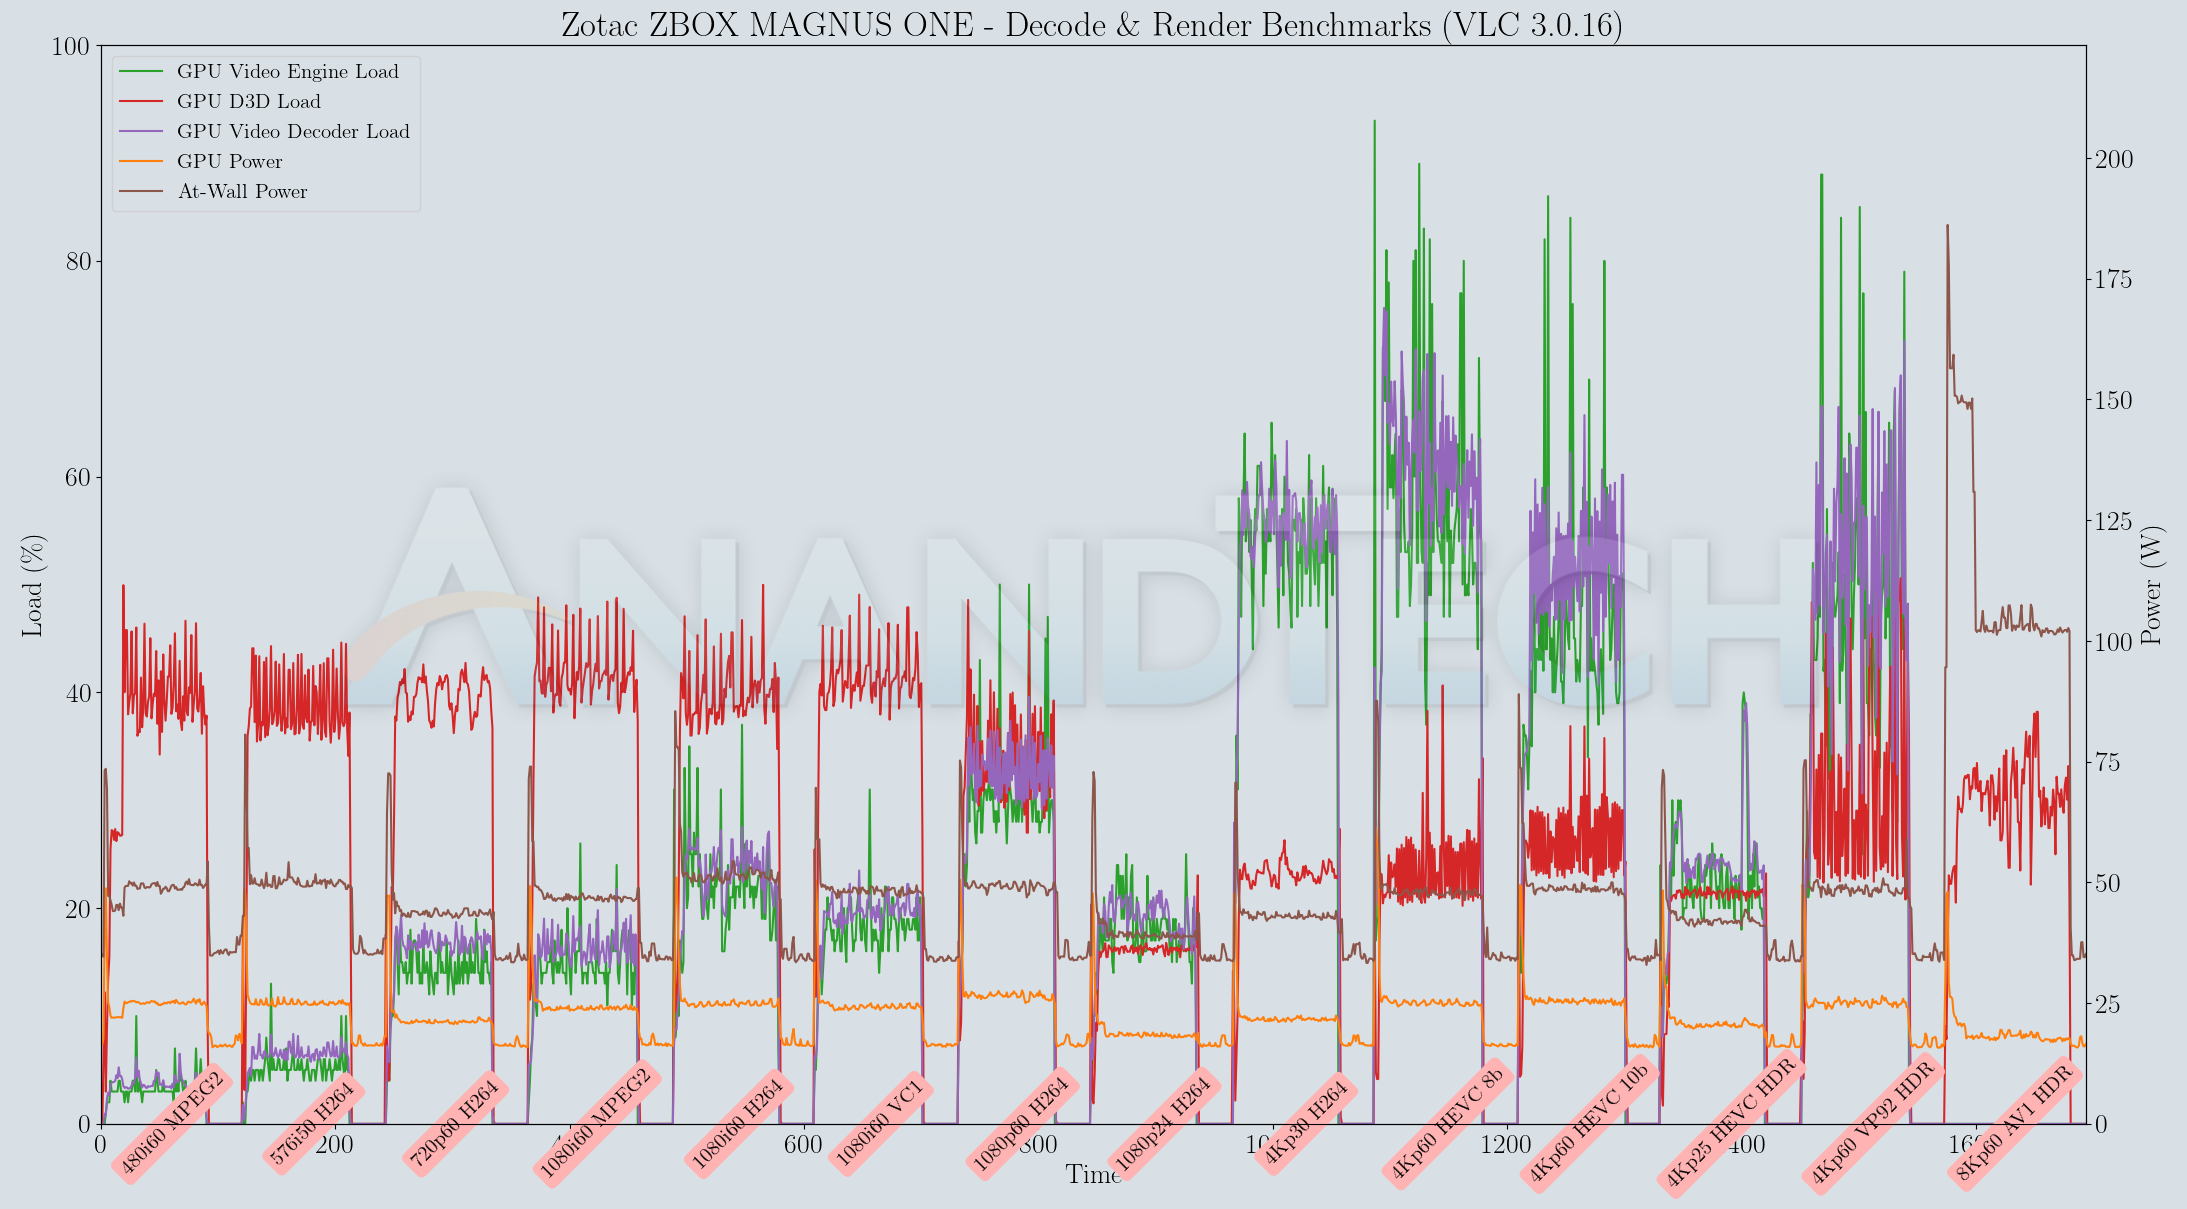
Various metrics of interest such as GPU usage and at-wall power consumption were recorded for the first four minutes of the playback of the above video. The numbers are graphed below.

The video decoder load doesn't go beyond 80% even while decoding 8Kp60 AV1 content. The at-wall power consumption is a tad high at around 130W (on an average). The playback is flawless without dropped frames in the steady state. Since we don't have any other low-power HTPCs for comparison, not much additional comment can be made regarding AV1 playback efficiency. In any case, using the MAGNUS ONE purely as a media playback machine / HTPC is probably an overkill based on just the noise factor alone.
Evaluation of local media playback and video processing is done by playing back files encompassing a range of relevant codecs, containers, resolutions, and frame rates. A note of the efficiency is also made by tracking GPU usage and power consumption of the system at the wall. Users have their own preference for the playback software / decoder / renderer, and our aim is to have numbers representative of commonly encountered scenarios. Towards this, we played back the test streams using the following combinations:
- MPC-HC x64 1.9.14 + LAV Video Decoder (DXVA2 Native) + Enhanced Video Renderer - Custom Presenter (EVR-CP)
- MPC-HC x64 1.9.14 + LAV Video Decoder (D3D11) + madVR 0.92.17 (DXVA-Focused)
- MPC-HC x64 1.9.14 + LAV Video Decoder (D3D11) + madVR 0.92.17 (Lanczos-Focused)
- VLC 3.0.16
- Kodi 19.1
Fourteen test streams comprising of various codecs and frame rates (each of 90s duration) were played back from the local disk with an interval of 30 seconds in-between. Various metrics including GPU usage and at-wall power consumption were recorded during the course of this playback.
All our playback tests were done with the desktop HDR setting turned on. It is possible for certain system configurations to have madVR automatically turn on/off the HDR capabilities prior to the playback of a HDR video, but, we didn't take advantage of that in our testing.
VLC and Kodi
VLC is the playback software of choice for the average PC user who doesn't need a ten-foot UI. Its install-and-play simplicity has made it extremely popular. Over the years, the software has gained the ability to take advantage of various hardware acceleration options. Kodi, on the other hand, has a ten-foot UI making it the perfect open-source software for dedicated HTPCs. Support for add-ons make it very extensible and capable of customization. We played back our test files using the default VLC and Kodi configurations, and recorded the following metrics.
| Video Playback Efficiency - VLC and Kodi | |||
Both VLC and Kodi attempt to do pure software decoding of the 8Kp60 AV1 stream. The resolution and frame rate are simply too much for the Core i7-10700 to handle, and the result is essentially a slideshow for that test stream. Other streams play back with hardware acceleration and consume around 50W at the wall.
MPC-HC
MPC-HC offers an easy way to test out different combinations of decoders and renderers. The first configuration we evaluated is the default post-install scenario, with only the in-built LAV Video Decoder forced to DXVA2 Native mode. Two additional passes were done with different madVR configurations. In the first one (DXVA-focused), we configured madVR to make use of the DXVA-accelerated video processing capabilities as much as possible. In the second (Lanczos-focused), the image scaling algorithms were set to 'Lanczos 3-tap, with anti-ringing checked'. Chroma upscaling was configured to be 'BiCubic 75 with anti-ringing checked' in both cases. The metrics collected during the playback of the test files using the above three configurations are presented below.
| Video Playback Efficiency - MPC-HC with EVR-CP and madVR | |||
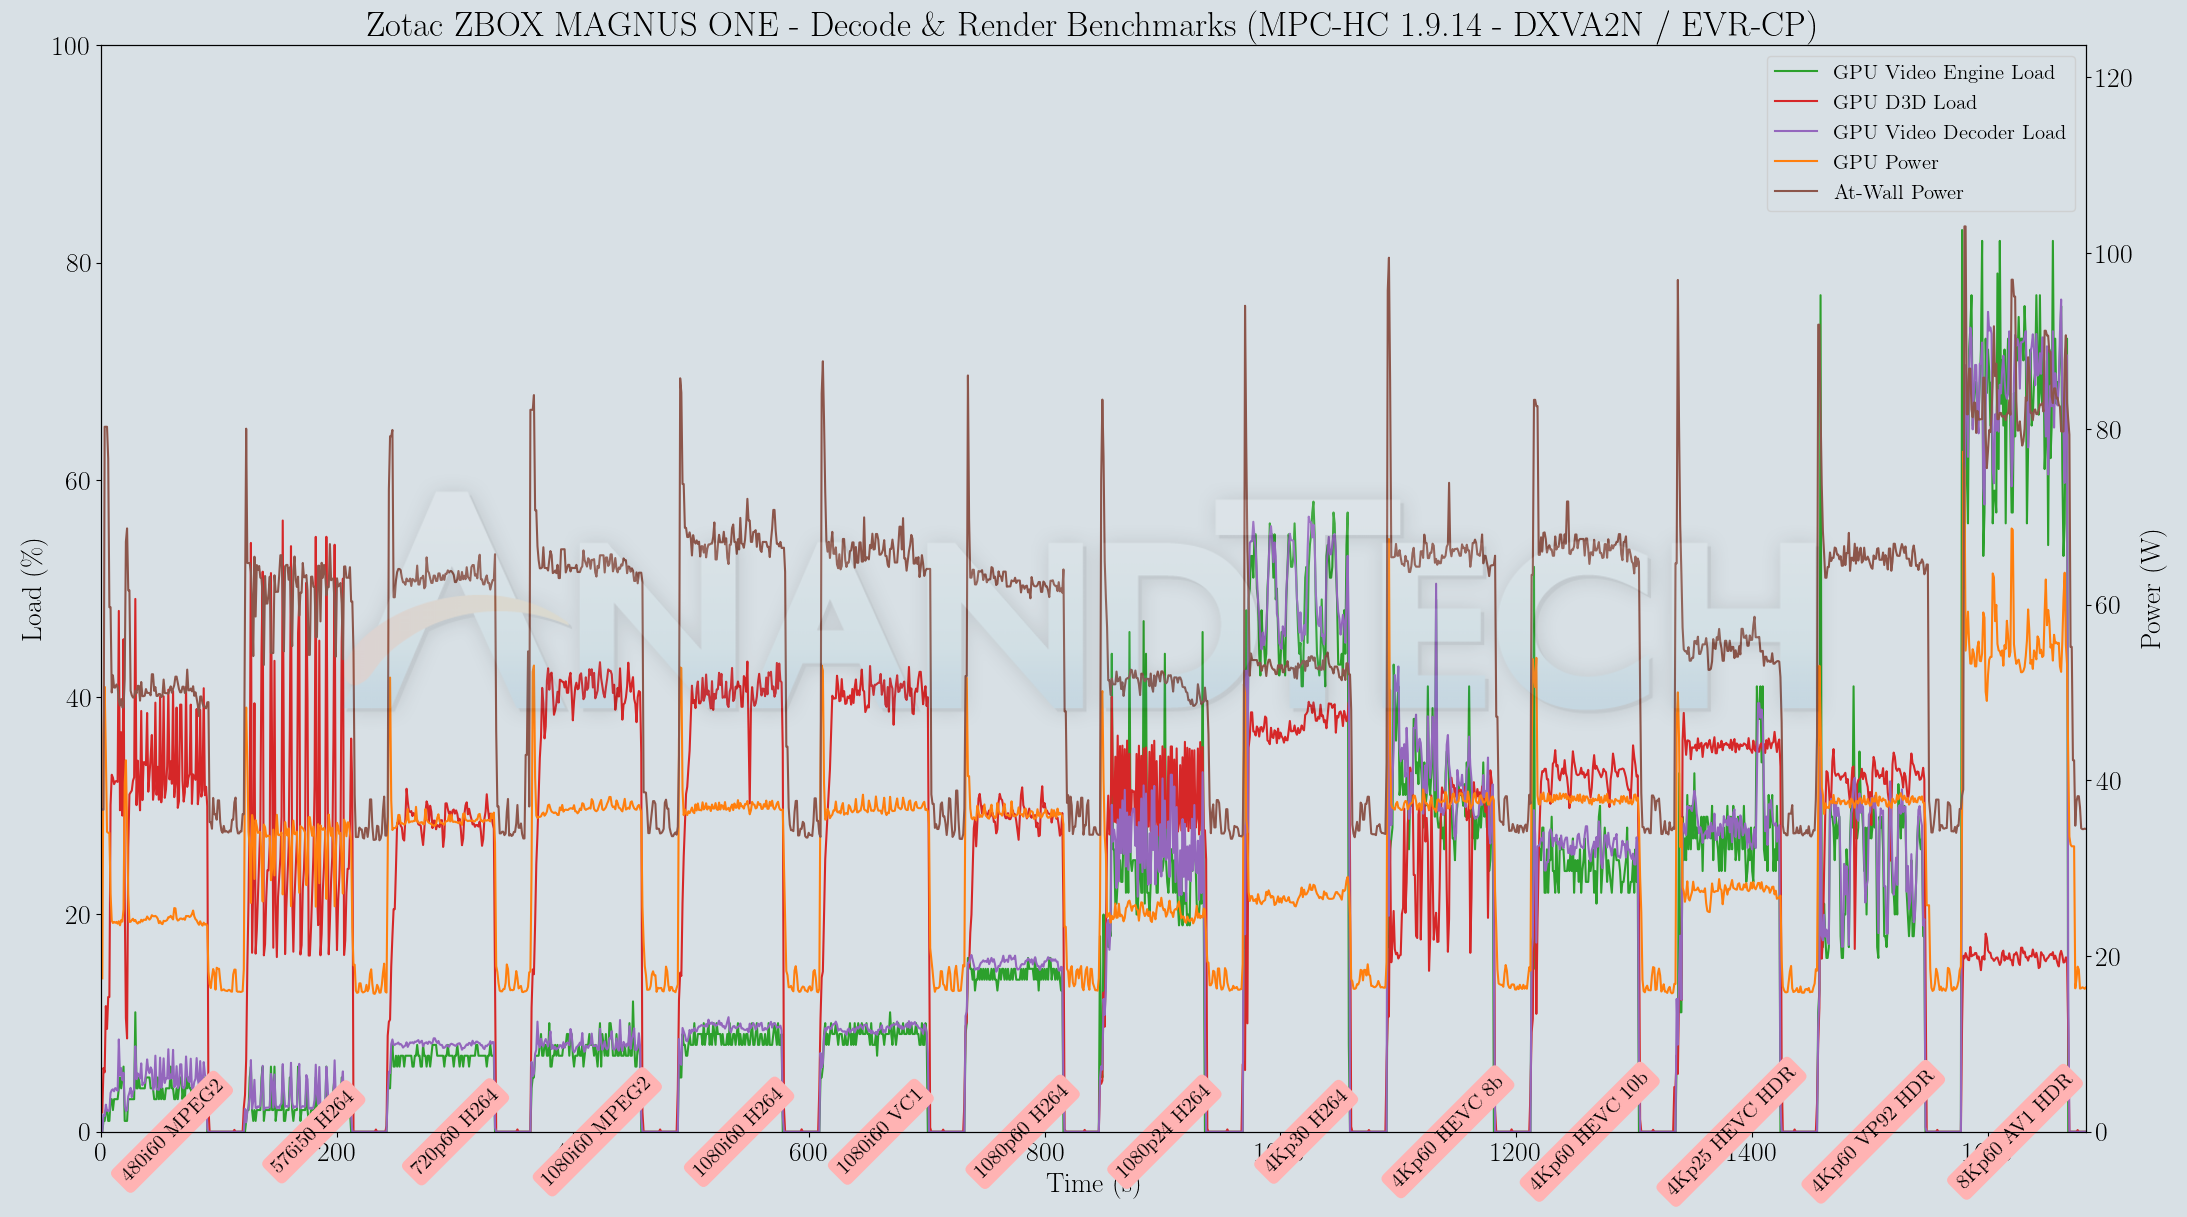
MPC-HC 1.9.14 with LAV Filters 0.75.1 is able to play back the 8Kp60 AV1 stream with perfect hardware acceleration. At-wall power consumption is a bit higher than what was obtained with VLC, but the playback is without dropped frames for all madVR configurations too.
The GPU is great for video post-processing, but it comes at the cost of power consumption and cooling requirements / noise.
Power Consumption and Thermal Performance
The power consumption at the wall was measured with a 4K display being driven through the HDMI port. In the graphs below, we compare the idle and load power of the Zotac ZBOX MAGNUS ONE (ECM73070C) with other low power PCs evaluated before. For load power consumption, we ran the AIDA64 System Stability Test with various stress components, and noted the maximum sustained power consumption at the wall.
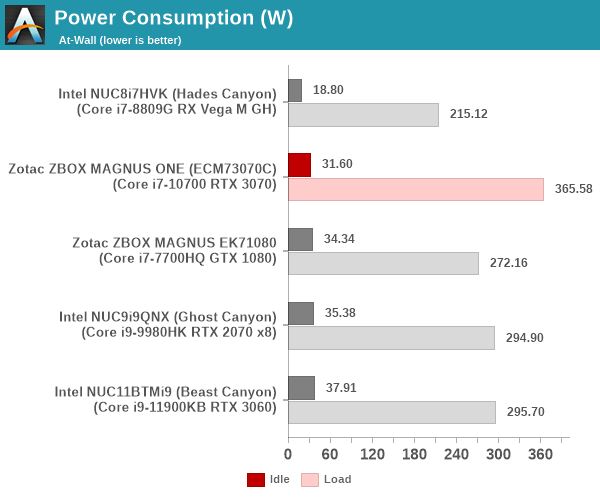
Idle power is similar to other gaming PCs, but the peak power consumption is the highest of the lot due to to the 220W TDP GPU in the PC. Simply put, the ZBOX MAGNUS ONE is the first gaming mini-PC we have seen with a 200W+ TDP GPU pre-installed.
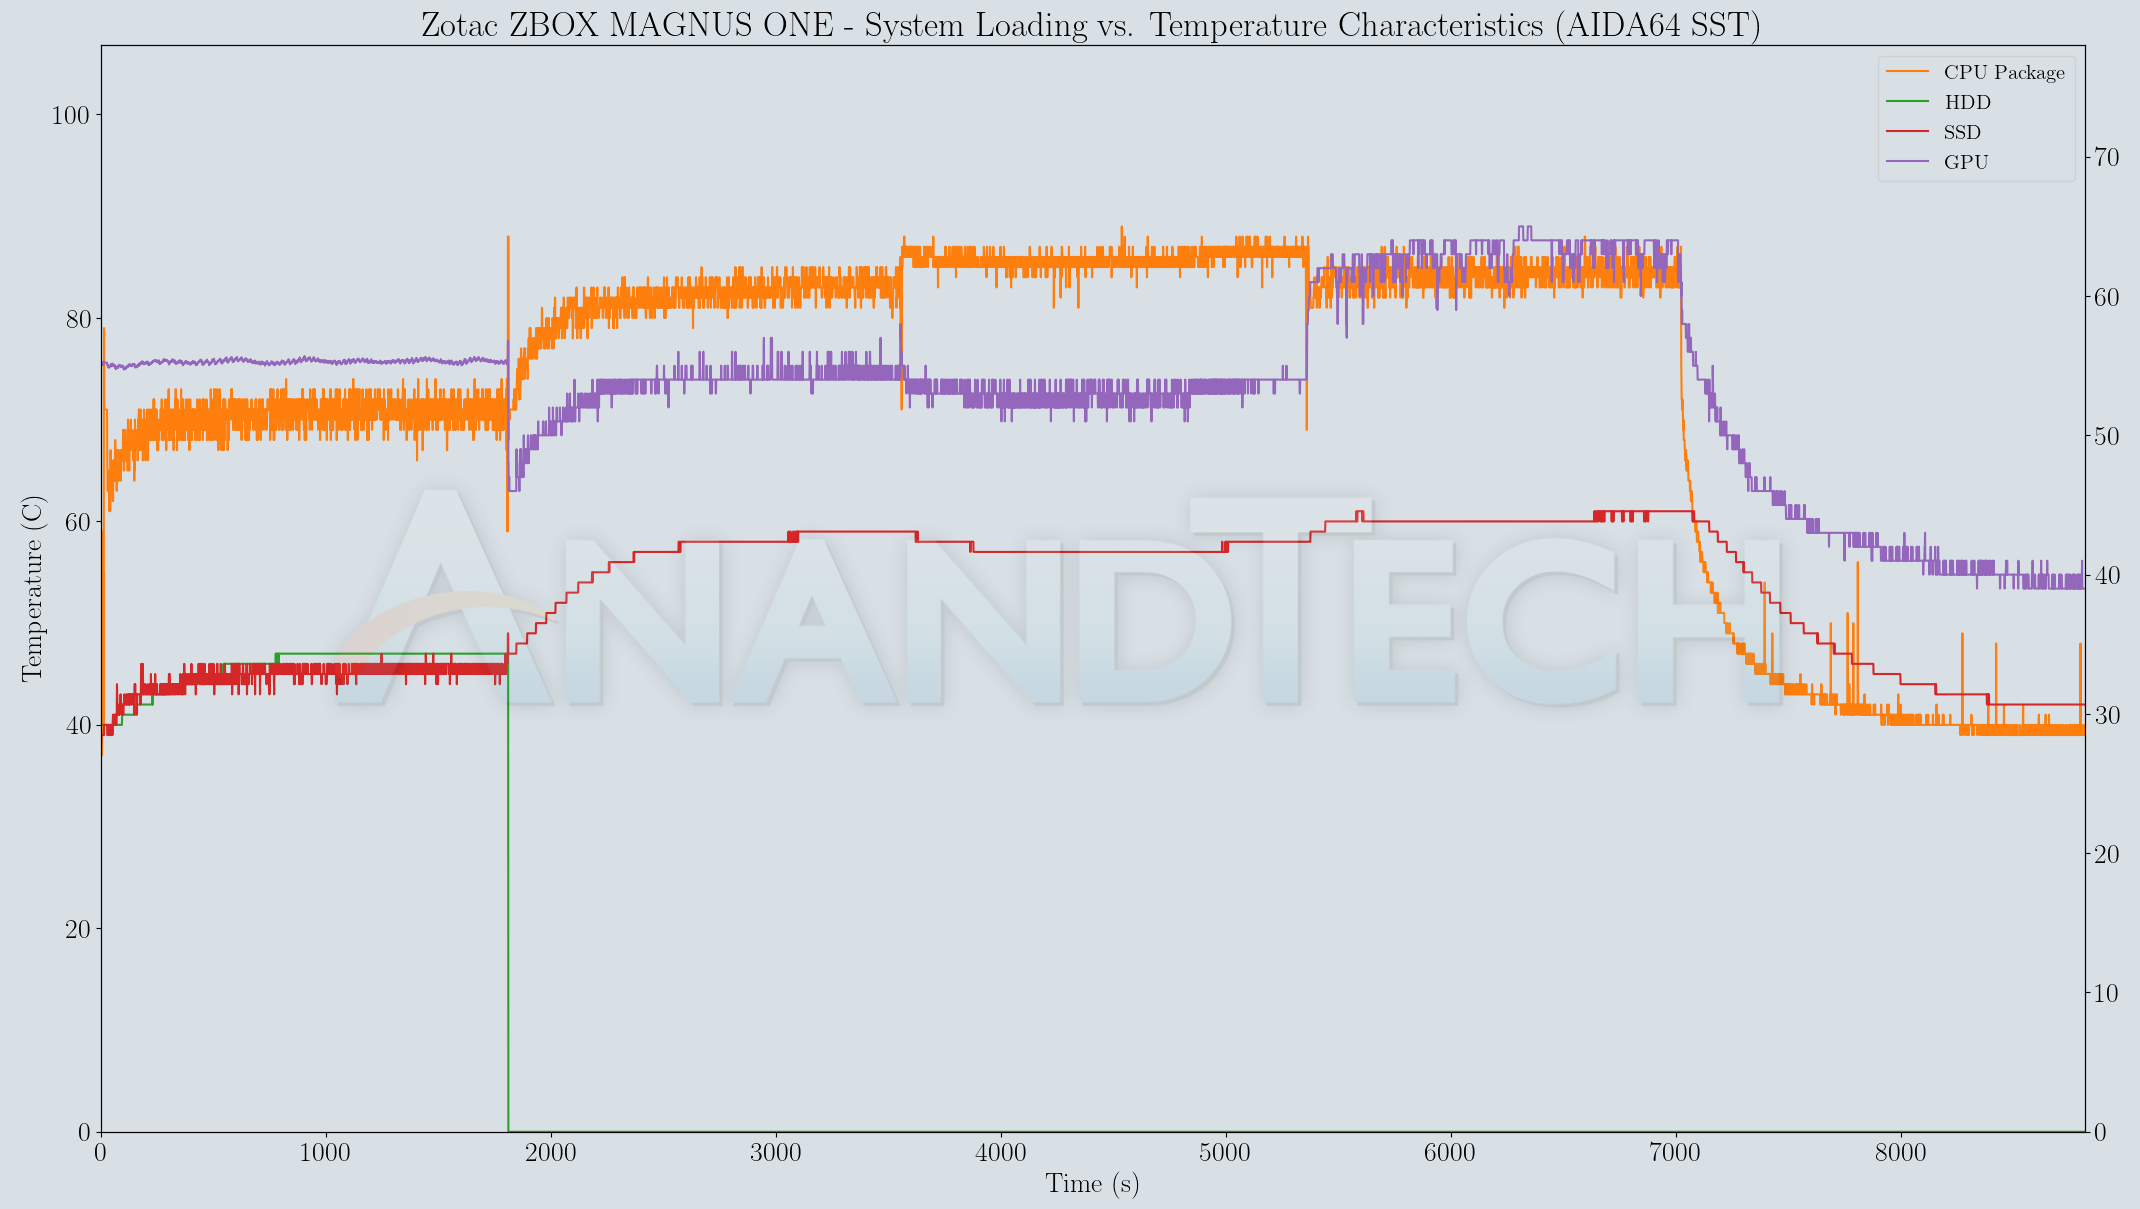
Our thermal stress routine starts with the system at idle, followed by four stages of different system loading profiles using the AIDA64 System Stability Test (each of 30 minutes duration). In the first stage, we stress the CPU, caches and RAM. In the second stage, we add the GPU to the above list. In the third stage, we stress the GPU standalone. In the final stage, we stress all the system components (including the disks). Beyond this, we leave the unit idle in order to determine how quickly the various temperatures in the system can come back to normal idling range. The various temperatures and power consumption numbers for the system during the above routine are presented in the graphs below.
| Zotac ZBOX MAGNUS ONE (ECM73070C) System Loading with the AIDA64 System Stability Test |
|
| Zotac ZBOX MAGNUS ONE (ECM73070C) System Loading with Prime95 and Furmark |
|
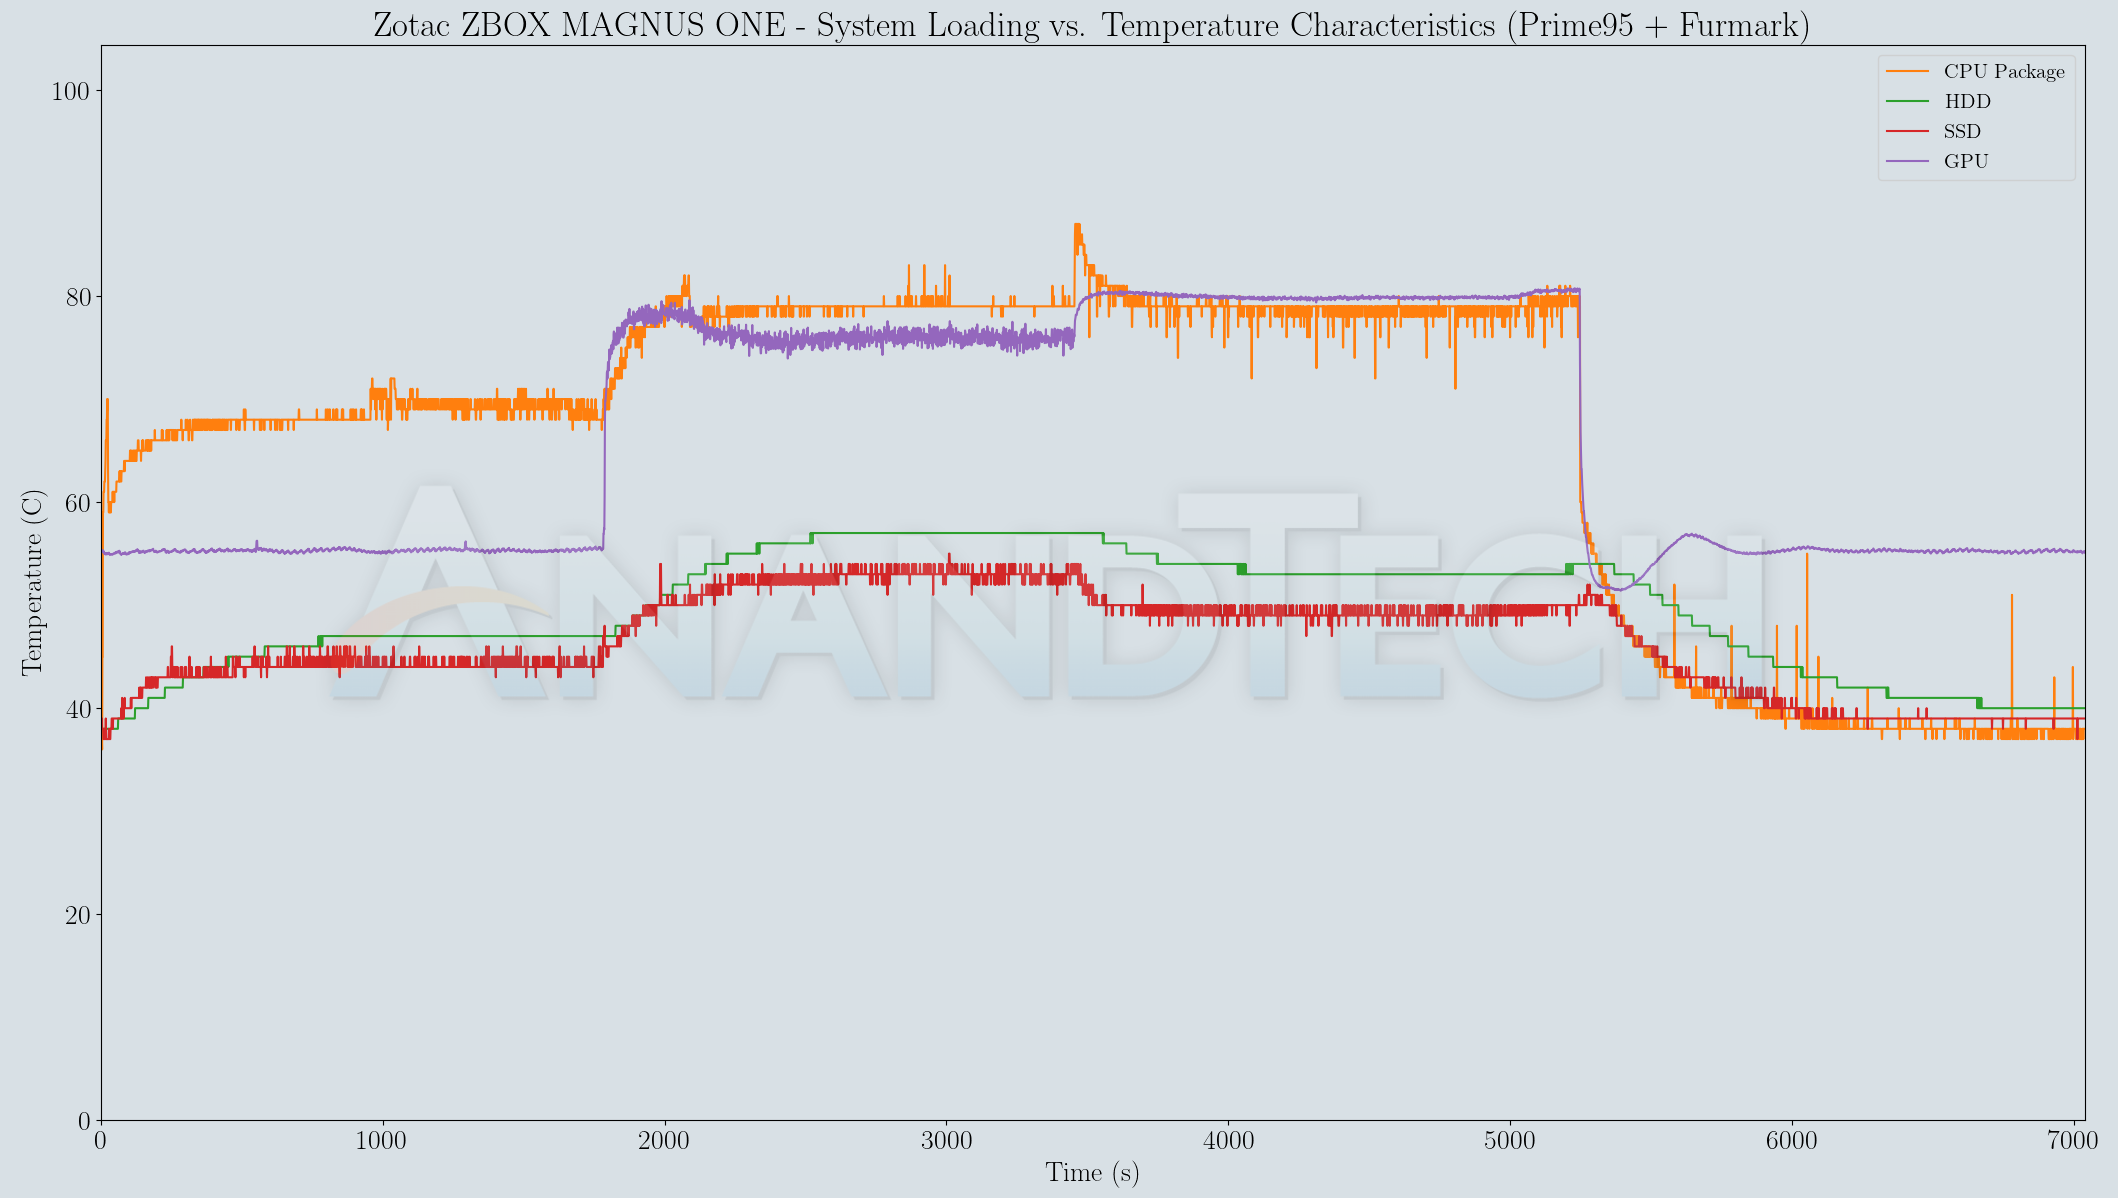
Due to the availability of active cooling, the system has no trouble in keeping the temperatures well below 90C in both stress routines. The custom stress test reveals that the CPU package is able to sustain a 65W power consumption in the steady state, and the GPU can sustain 220W too, when loaded standalone.
Overall, the system has an effective thermal solution, but that comes at the cost of fan noise. For a gaming mini-PC with a 220W TDP GPU, that is to be expected.
Miscellaneous Aspects and Concluding Remarks
Networking and storage are two major aspects which influence our experience with any computing system. This section presents results from our evaluation of these aspects in the Zotac ZBOX MAGNUS ONE (ECM73070C). On the storage side, one option would be repetition of our strenuous SSD review tests on the drive(s) in the PC. Fortunately, to avoid that overkill, UL PCMark 10 has a Full System Drive Benchmark storage test certain common workloads such as booting, loading games, and document processing are replayed on the target drive. The average access times and bandwidth numbers are recorded for each trace and the overall numbers contribute to a benchmark score.
Since the review configuration is a dual-drive system, we were able to process the benchmark on both the primary and secondary drives. The results are presented below.

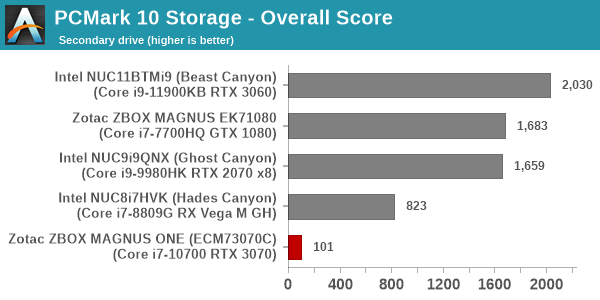
The primary drive is a DRAM-less NVMe SSD and delivers good enough performance. The secondary drive is a hard disk (something of a rarity these days). Understandably, its performance is downright abysmal compared to flash-based secondary drives in the other mini-PCs.
On the networking front, Zotac ticks all the right boxes for gamers by integrating the Killer line of wired and WLAN adapters. The Killer adapters come with specific networking features to have fine-grained control over lag, latency, and packet loss - all of which are important for online gaming sessions. The 2.5Gbps port is also a nice upgrade over the regular gigabit ports found in most Comet Lake desktop platforms.
Coming to the business end of the review, Zotac's MAGNUS ONE is undoubtedly one of the most powerful pre-built gaming mini-PCs to appear in the market. The standard configuration leaves one of the SODIMM slots empty and that handicaps the performance of the system. A 2.5" hard disk for bulk storage is welcome in a mini-PC meant for gaming purposes. However, 1TB is too small a capacity for spinning rust in modern systems. It would have been better if Zotac had gone in for one of the 4TB HDDs. Despite these shortcomings, the 4K and 1440p gaming credentials of the system far surpass that of the Ghost Canyon NUC. The Beast Canyon NUC with the Tiger Lake processor is a more capable system, but it is not available in the market yet. The MAGNUS ONE has been selling for the past 6 months and is available for purchase today. More importantly, it is in stock - one of the few ways in which one can get hold of a high-end nVIDIA Ampere GPU without paying a premium to the scalpers.
A key difference between the MAGNUS ONE and the previous MAGNUS flagships is the upgrade aspect. It is the first system that Zotac is advertising with a user-replaceable discrete GPU. As long as the GPU to be installed consumes 220W or lesser, is not longer than 230mm (9.06 in.), and takes up only two slots at the maximum, it is possible for end users to upgrade the pre-installed RTX 3070 a year or two into the system's service lifetime.
Despite lacking premium features such as Thunderbolt 4 or Wi-Fi 6E support, Zotac has made some pleasing decisions in the chassis design such as tool-less access to the internals, ease of installing components, and the presence of easily accessible Type-C and Type-A ports in the front panel. These are aspects that future Extreme NUCs and other gaming mini-PCs would do well to incorporate.
Overall, Zotac has a winner in the MAGNUS ONE. The huge demand for the nVIDIA Ampere GPUs has allowed the company to push out the high-margin pre-built SKU into the market, rather than just selling the barebones version. The system was launched at $1900 back in January, but the same configuration now retails for $2400. The price increase is a bit unfortunate, but the availability of discrete GPUs is such that the market is able to absorb the increased pricing and still keep the product moving along. The positive aspect is that the system built around the RTX 3070 by Zotac hits all the right notes for a capable gaming mini-PC.


