Original Link: https://www.anandtech.com/show/15076/the-sk-hynix-gold-s31-sata-ssd-review
The SK Hynix Gold S31 SATA SSD Review: Hynix 3D NAND Finally Shows Up
by Billy Tallis on November 13, 2019 12:00 PM EST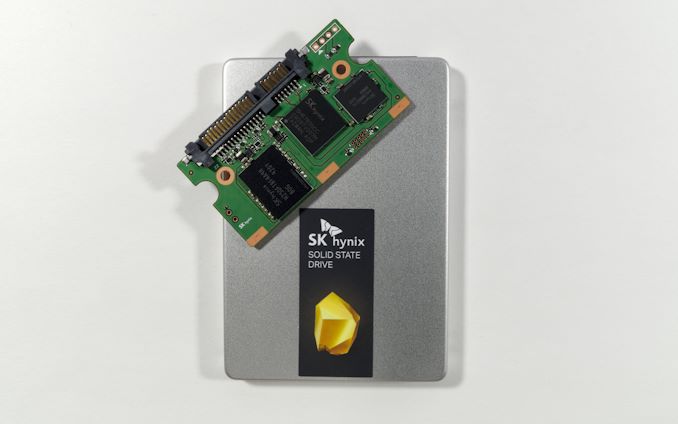
SK Hynix has been in the NAND and SSD business for a long time, but we haven't had the opportunity to review a drive with SK Hynix NAND in years. In most respects, SK Hynix fared the worst with the transition to 3D NAND, and their 3D NAND has not been used in very many SSDs aside from their own models. SK Hynix 3D NAND has been considerably more popular in mobile applications like smartphones and memory cards, and their client OEM SSDs are widespread but not sampled for review. This year, SK Hynix decided to start competing directly in the retail SSD market by introducing the SK Hynix Gold S31 SATA SSDs. (Outside North America, SK Hynix has been selling some SSDs under subsidiary brands.)
The Gold S31 showcases SK Hynix's vertical integration with the NAND, DRAM, controller and firmware all produced in-house. Samsung is the only other company that regularly produces SSDs with this degree of vertical integration; Micron uses third-party controllers for most of their SSDs, and the other NAND manufacturers have in-house controllers but don't make their own DRAM.
| SK Hynix Gold S31 SSD Specifications | |||||
| Capacity | 250 GB | 500 GB | 1 TB | ||
| Form Factor | 2.5" 7mm SATA 6Gbps | ||||
| Controller | SK Hynix "Quartz" | ||||
| NAND Flash | SK Hynix 3D-V4 72-layer 3D TLC, 512Gbit | ||||
| DRAM | SK Hynix LPDDR3 | ||||
| Sequential Read | 560 MB/s | ||||
| Sequential Write | 525 MB/s | ||||
| Warranty | 5 years | ||||
| Write Endurance | 200 TB 0.4 DWPD |
300 TB 0.3 DWPD |
600 TB 0.3 DWPD |
||
| Current Retail Price | $39.99 (16¢/GB) |
$59.99 (12¢/GB) |
$118.99 (12¢/GB) |
||
The NAND in the Gold S31 SSDs is SK Hynix's fourth generation 3D NAND, a 72-layer design that is competing against the 64L and to some extent 92/96L generations from other manufacturers. All three capacities of the S31 are made using 512Gbit TLC dies.
SK Hynix didn't share much information about the SSD controller that the S31 uses, but it's codenamed "Quartz" and is a fourth generation design. Based on the chip markings of "SH87830CC" it would appear to be a descendant of the LM87800 controller that was part of Hynix's 2012 acquisition of Link A Media Devices (LAMD).
The Gold S31 uses LPDDR3 for its DRAM cache. Aside from Samsung, most SSD vendors use DDR3L or DDR4 instead of any generation of LPDDR. Since Hynix is one of the major DRAM manufacturers, it isn't too surprising to see them go a bit fancier here.
Combined, these components are the backbone of a mainstream SATA SSD. SK Hynix has attached the typical 5-year warranty and ~0.3 drive writes per day endurance rating, and priced it to compete against other mainstream SATA drives.


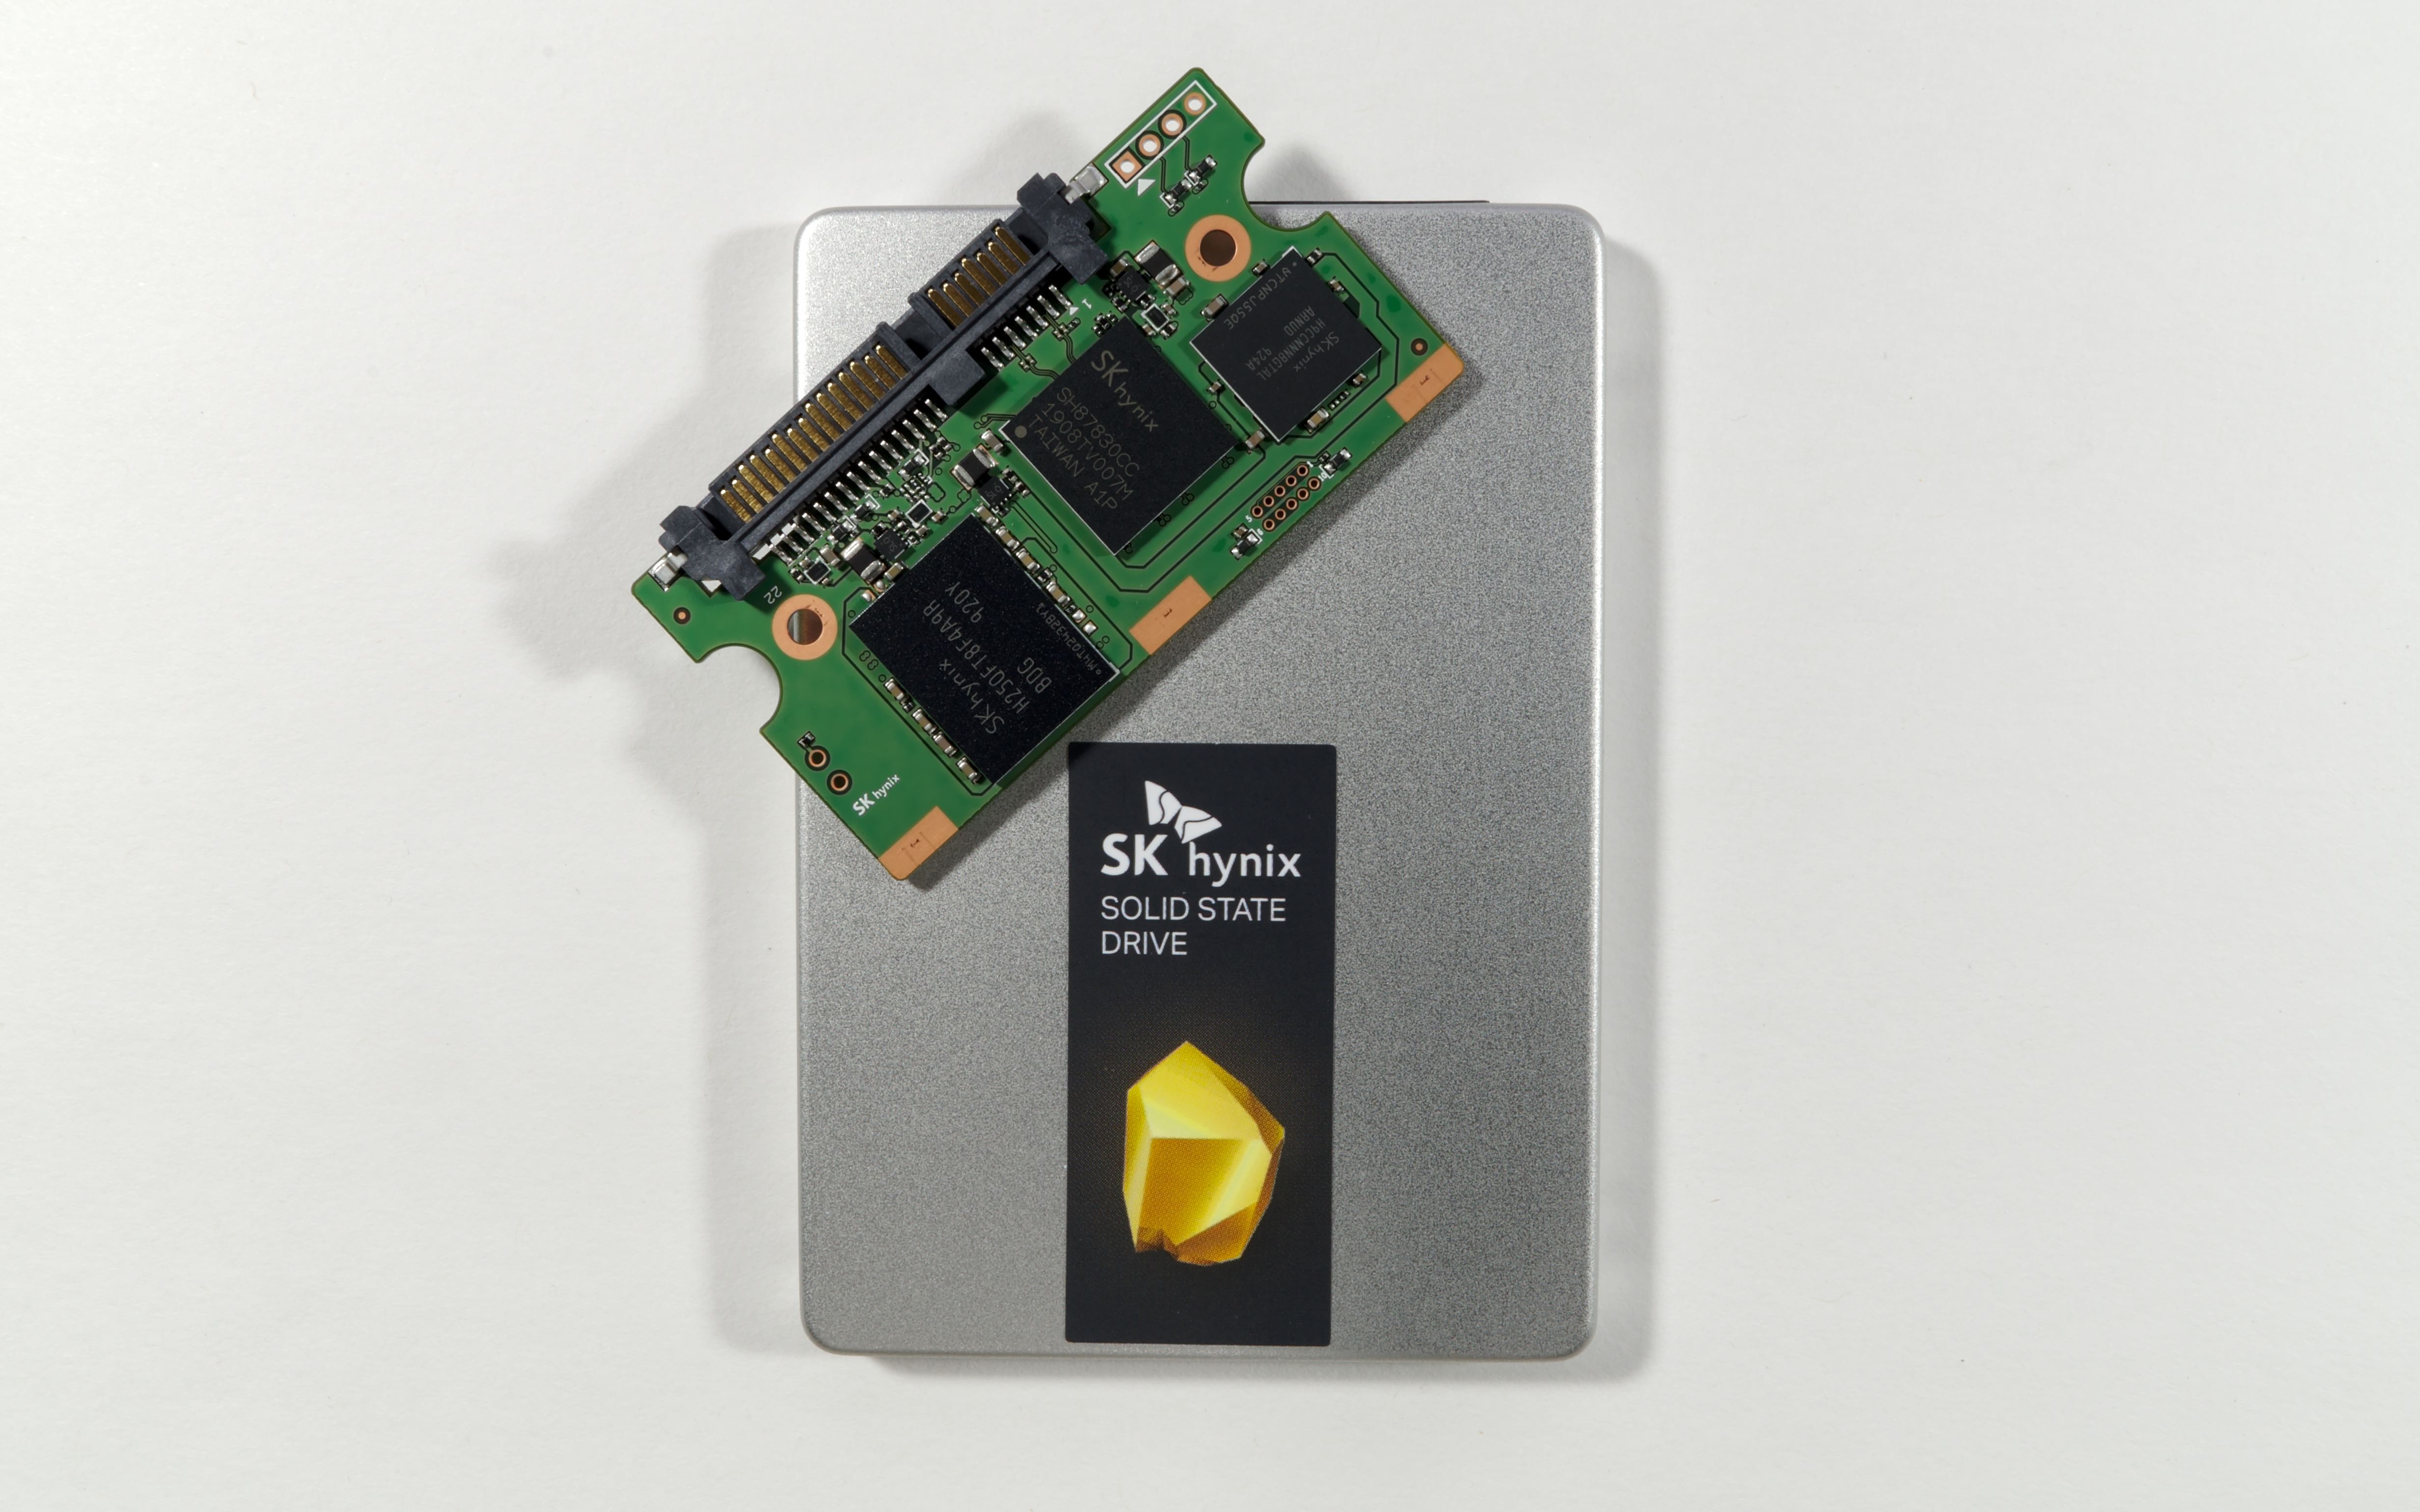
The Gold S31 is only available in the 2.5"/7mm SATA form factor, but a peek inside at the PCB layout shows how easy it is now to fit a reasonable amount of storage on a much smaller M.2 card. The PCB takes up only a fraction of the interior of a 2.5" drive case, and the board is held in place by a plastic insert. The PCB is double-sided to accommodate two NAND flash memory packages, and on the primary side of the PCB are one package each for the controller and NAND.
SK Hynix sampled us the full range of capacities for the Gold S31. Their competitors haven't sent us any current-generation 250GB-class mainstream SATA drives, so we're only comparing the smallest S31 against the DRAMless Toshiba TR200 and against larger drives. To see how the 250GB S31 matches up against older drives of similar capacity, head over to our Bench database.
| AnandTech 2018 Consumer SSD Testbed | |
| CPU | Intel Xeon E3 1240 v5 |
| Motherboard | ASRock Fatal1ty E3V5 Performance Gaming/OC |
| Chipset | Intel C232 |
| Memory | 4x 8GB G.SKILL Ripjaws DDR4-2400 CL15 |
| Graphics | AMD Radeon HD 5450, 1920x1200@60Hz |
| Software | Windows 10 x64, version 1709 |
| Linux kernel version 4.14, fio version 3.6 | |
| Spectre/Meltdown microcode and OS patches current as of May 2018 | |
- Thanks to Intel for the Xeon E3 1240 v5 CPU
- Thanks to ASRock for the E3V5 Performance Gaming/OC
- Thanks to G.SKILL for the Ripjaws DDR4-2400 RAM
- Thanks to Corsair for the RM750 power supply, Carbide 200R case, and Hydro H60 CPU cooler
- Thanks to Quarch for the HD Programmable Power Module and accessories
- Thanks to StarTech for providing a RK2236BKF 22U rack cabinet.
Whole-Drive Fill
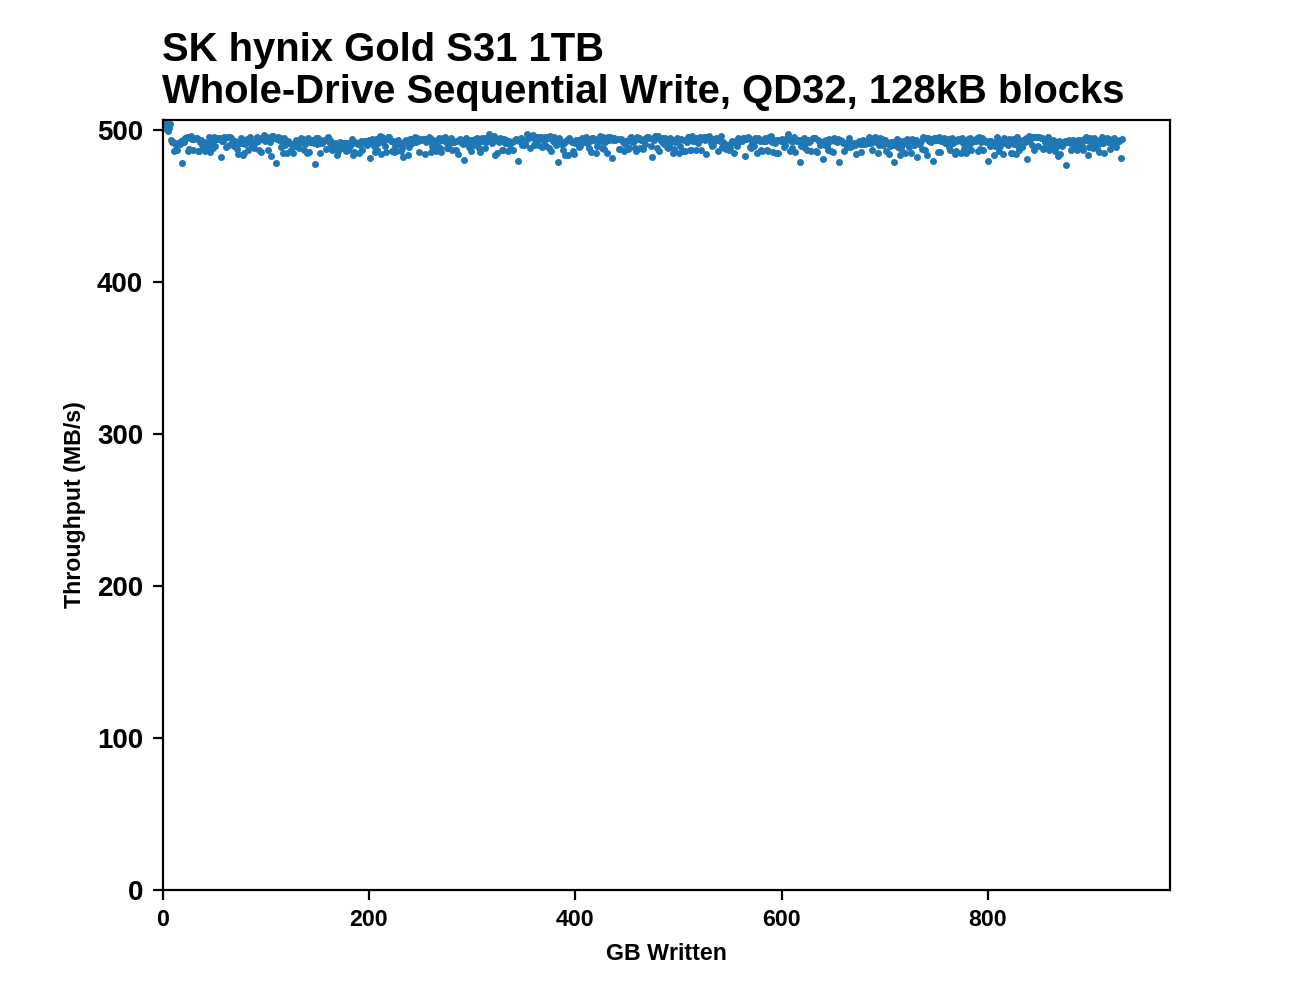
This test starts with a freshly-erased drive and fills it with 128kB sequential writes at a queue depth of 32, whilst recording the write speed for each 1GB segment. This test is not representative of any ordinary client/consumer usage pattern, but it does allow us to observe transitions in the drive's behavior as it fills up. This can allow us to estimate the size of any SLC write cache, and get a sense for how much performance remains on the rare occasions where real-world usage keeps writing data after filling the cache.
 |
|||||||||
The SK Hynix Gold S31 drives seem to have relatively small SLC cache sizes: a bit less than 4GB for the 250GB model, and around 8GB for the 500GB and 1TB models. The 1TB model barely loses any speed after the cache fills up, but the smaller two are significantly slower once the cache runs out. The 250GB S31 is also a few percent slower even at the beginning when writing to its SLC cache, but it's still pretty close to saturating the SATA link. All three S31s show very consistent sequential write speeds after the cache is full, with no long-term drift in performance and minimal short-term variation.
 |
|||||||||
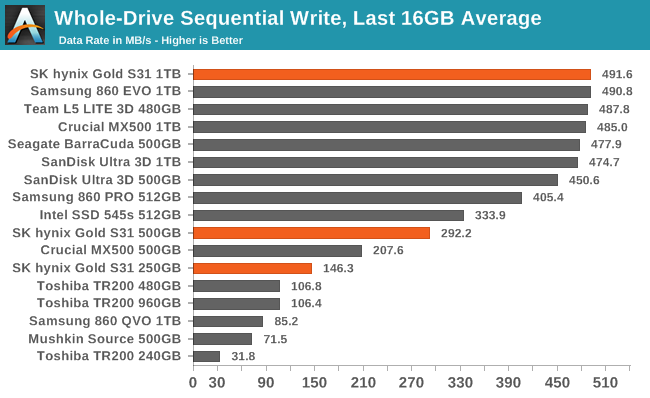
| Average Throughput for last 16 GB | Overall Average Throughput | ||||||||
The 1TB S31's post-SLC performance is as good as any other mainstream SATA drive, but the sustained performance from the two smaller models is a bit on the slow side. Most of the competition in this space uses 256Gb TLC dies, but the Hynix drives are all making due with fewer 512Gb modules, consequently having less parallelism to work with. Even so, the smallest S31 is still clearly faster than the DRAMless or QLC-based drives.
AnandTech Storage Bench - The Destroyer
The Destroyer is an extremely long test replicating the access patterns of very IO-intensive desktop usage. A detailed breakdown can be found in this article. Like real-world usage, the drives do get the occasional break that allows for some background garbage collection and flushing caches, but those idle times are limited to 25ms so that it doesn't take all week to run the test. These AnandTech Storage Bench (ATSB) tests do not involve running the actual applications that generated the workloads, so the scores are relatively insensitive to changes in CPU performance and RAM from our new testbed, but the jump to a newer version of Windows and the newer storage drivers can have an impact.
We quantify performance on this test by reporting the drive's average data throughput, the average latency of the I/O operations, and the total energy used by the drive over the course of the test.
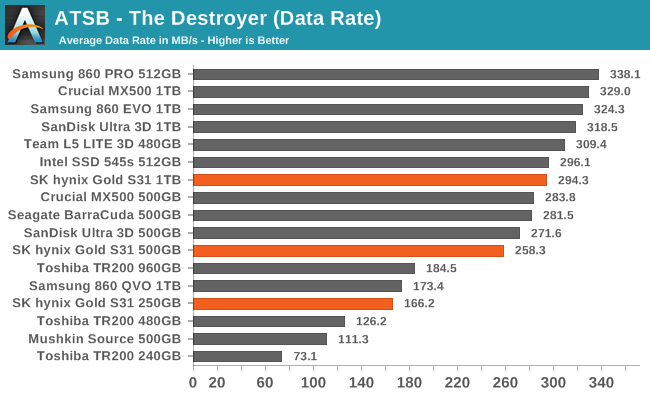
The overall performance from the 500GB and 1TB SK Hynix Gold S31 drives on The Destroyer is a bit slower than typical for mainstream SATA drives, but it's not a large gap.
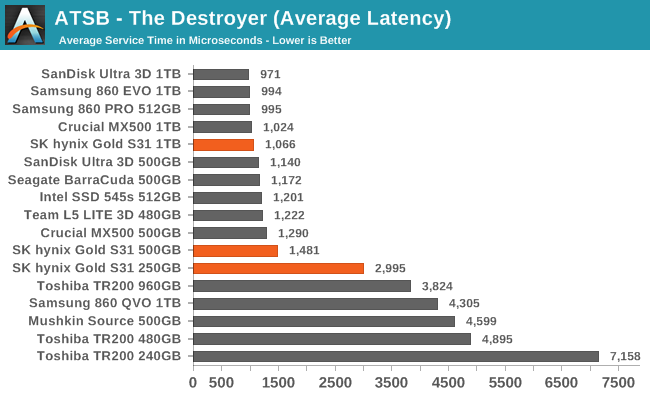
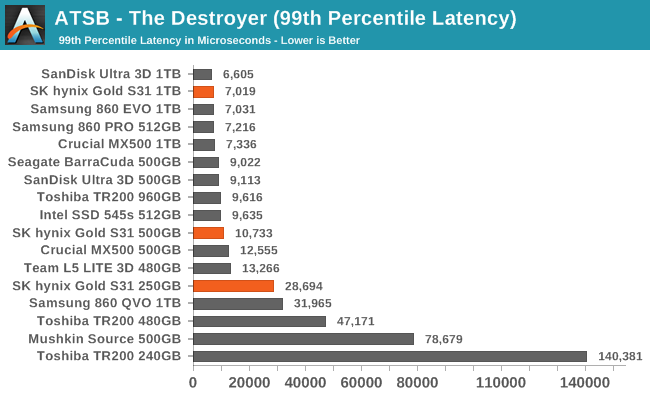
The average latency scores from the S31 on The Destroyer are reasonable, but again slightly behind the other mainstream SATA drives we've tested. The 99th percentile latency scores rank a bit better, and are definitely competitive. The 250GB model's performance is substantially worse than the larger two models.
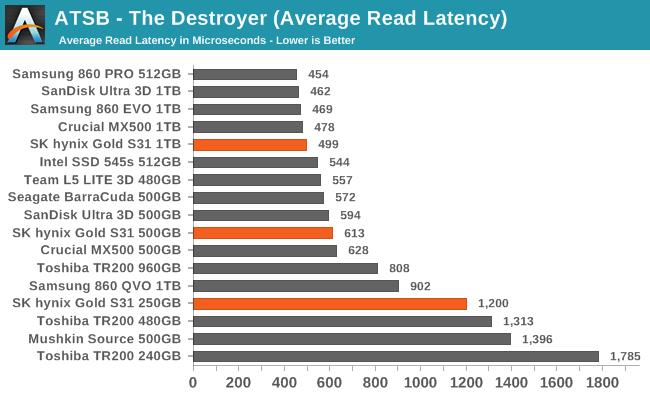
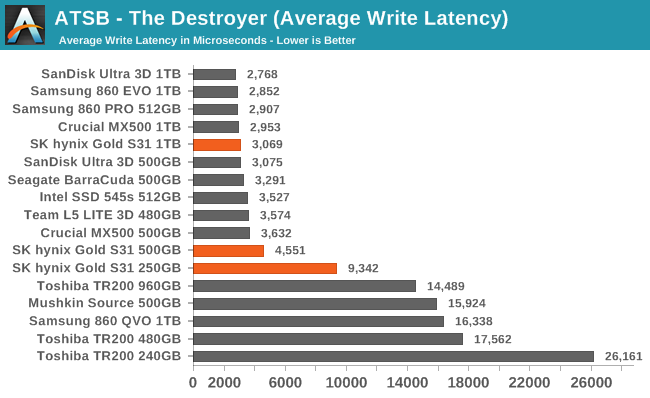
Both the average read and write latency scores show similar rankings for the S31s, with the 250GB model's latencies are roughly double that of the 500GB model, and the 1TB only slightly faster than the 500GB.
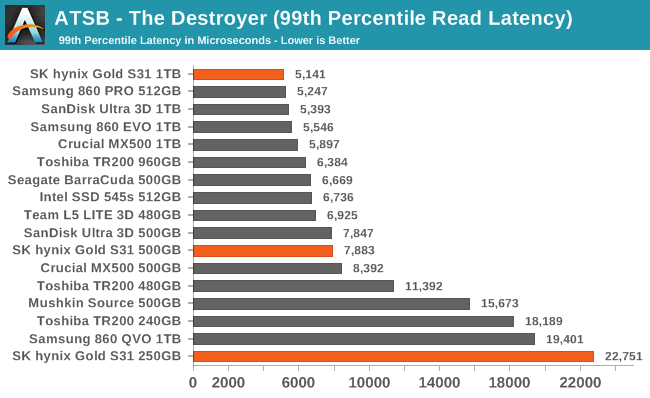
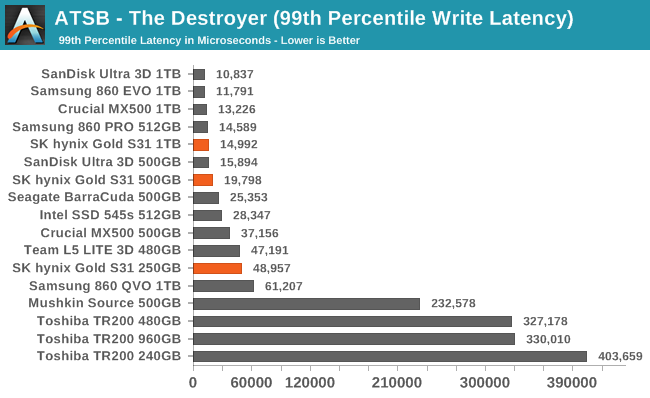
The 250GB S31 turns in the worst 99th percentile read latency score out of this batch of drives, but the 500GB's score is competitive, and the 1TB model's score is at the top of the chart. For 99th percentile write latencies, the three S31s rank much closer together, and the slowest 250GB model is still vastly faster than the DRAMless SSDs.
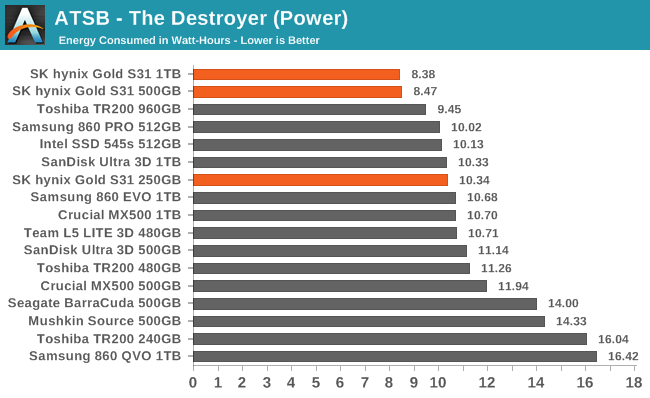
The 500GB and 1TB models of the SK Hynix Gold S31 turn in very good energy usage scores, while the smaller 250GB model ends up with efficiency that is merely typical for this class.
AnandTech Storage Bench - Heavy
Our Heavy storage benchmark is proportionally more write-heavy than The Destroyer, but much shorter overall. The total writes in the Heavy test aren't enough to fill the drive, so performance never drops down to steady state. This test is far more representative of a power user's day to day usage, and is heavily influenced by the drive's peak performance. The Heavy workload test details can be found here. This test is run twice, once on a freshly erased drive and once after filling the drive with sequential writes.
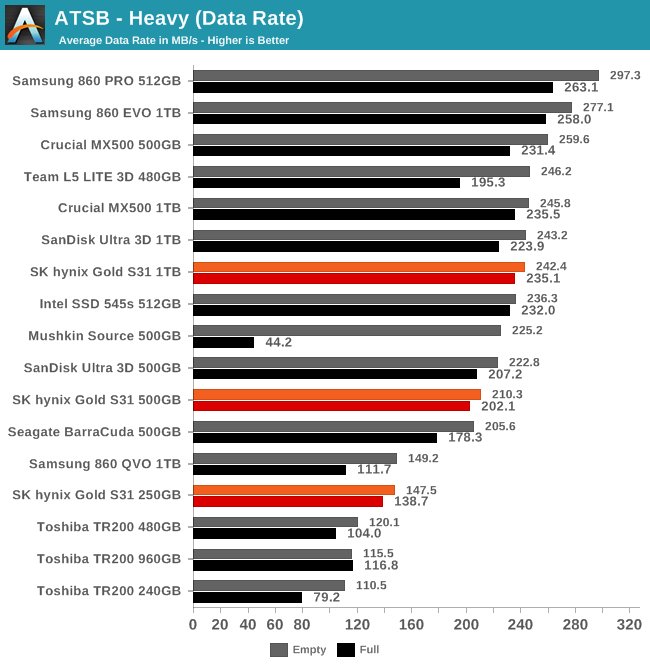
As with The Destroyer, the SK Hynix Gold S31 drives have somewhat lower performance on the Heavy test than most other mainstream SATA models, but they do an excellent job of retaining that performance even when the drive is full.
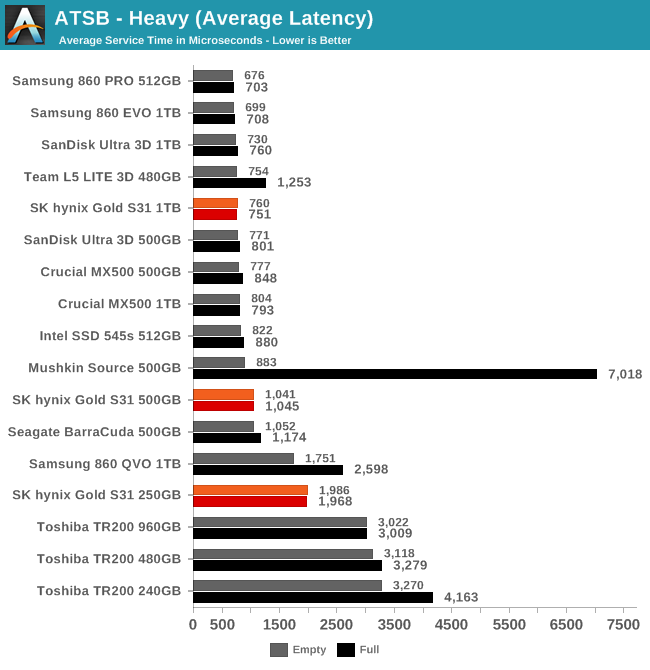
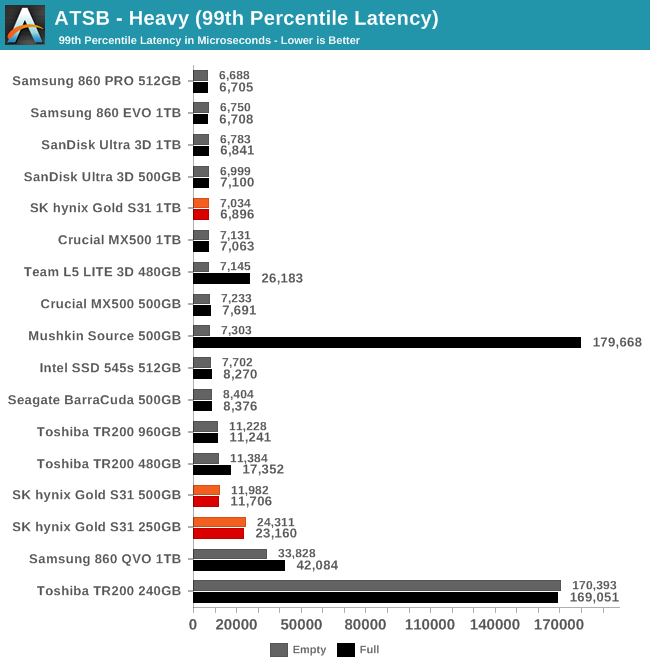
The average latencies from the S31s are reasonable and minimally affected by running the test on a full drive. For the 99th percentile latencies, the scores are actually slightly better when the drives are full, but the 500GB model in particular is a bit behind the usual for its capacity class.
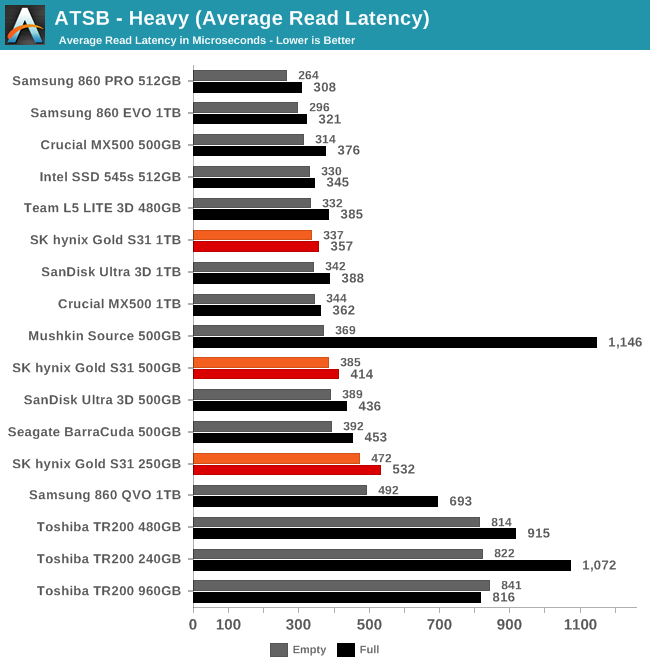

The average read latencies from the S31s during the Heavy test are competitive. For writes, the 500GB model's latency is a little bit high compared to the competition. The 250GB model's average write latency is almost double that level, but still lower than that of the DRAMless Toshiba TR200.
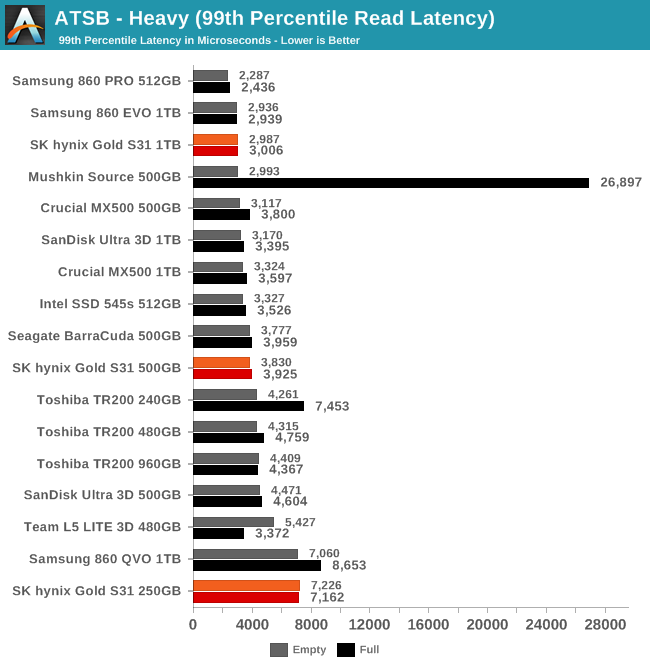
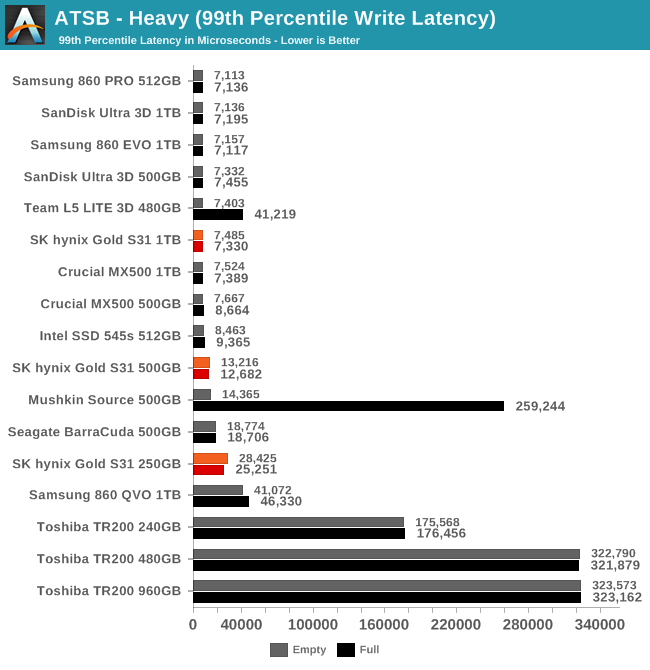
The 99th percentile read and write latencies are both fine for the larger S31 models. The 250GB model's 99th percentile read latency gets shown up by the DRAMless Toshiba TR200 when the test is run on an empty drive. However, even the smallest S31 doesn't come close to the 99th percentile write latency problems that affect the DRAMless drives.
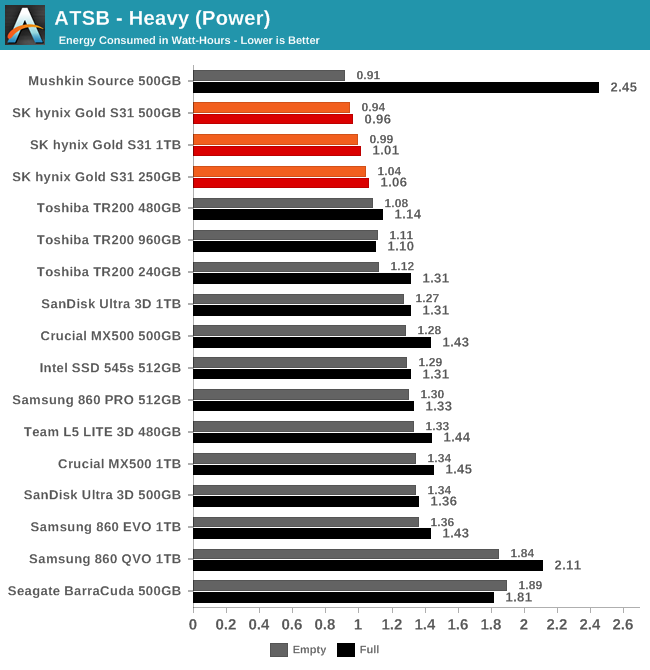
All three capacities of the SK Hynix Gold S31 turn in great power efficiency scores on the Heavy test, using substantially less energy than the competing mainstream models with DRAM caches.
AnandTech Storage Bench - Light
Our Light storage test has relatively more sequential accesses and lower queue depths than The Destroyer or the Heavy test, and it's by far the shortest test overall. It's based largely on applications that aren't highly dependent on storage performance, so this is a test more of application launch times and file load times. This test can be seen as the sum of all the little delays in daily usage, but with the idle times trimmed to 25ms it takes less than half an hour to run. Details of the Light test can be found here. As with the ATSB Heavy test, this test is run with the drive both freshly erased and empty, and after filling the drive with sequential writes.
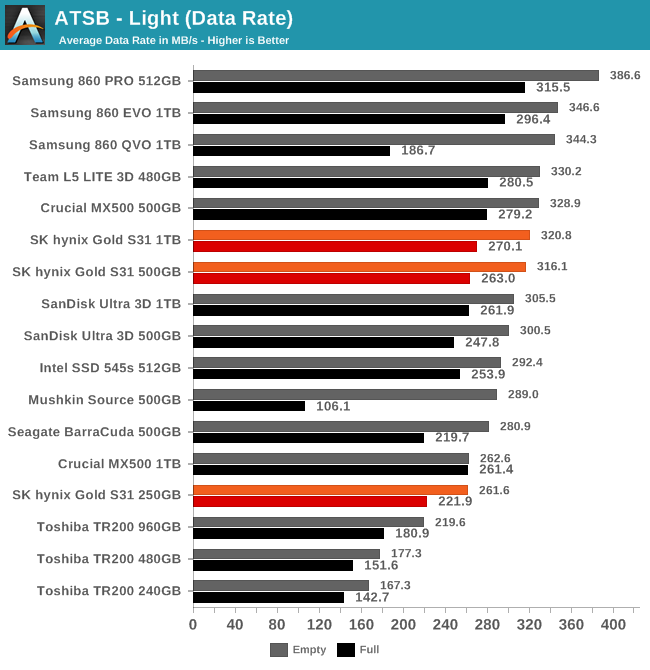
On the Light test, the SK Hynix Gold S31 SSDs all show decent overall performance, including when the test is run on a full drive. They aren't the fastest SATA drives to complete the test, but they trail by single-digit percentages.
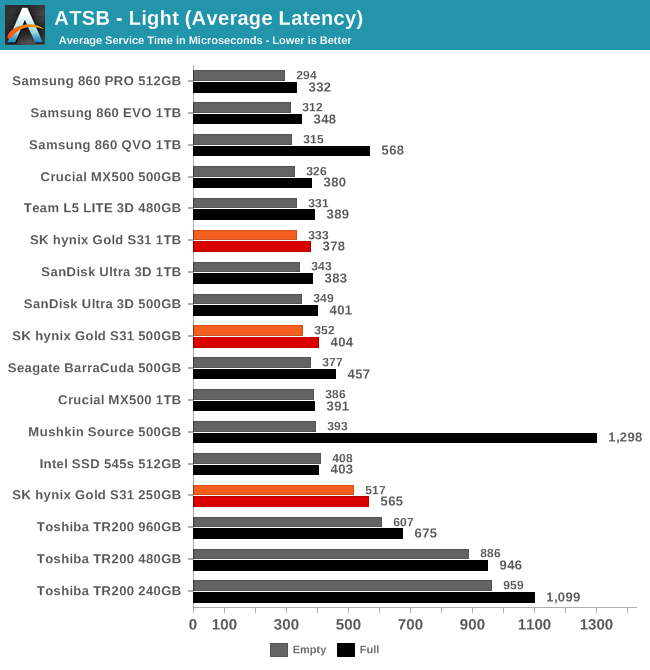
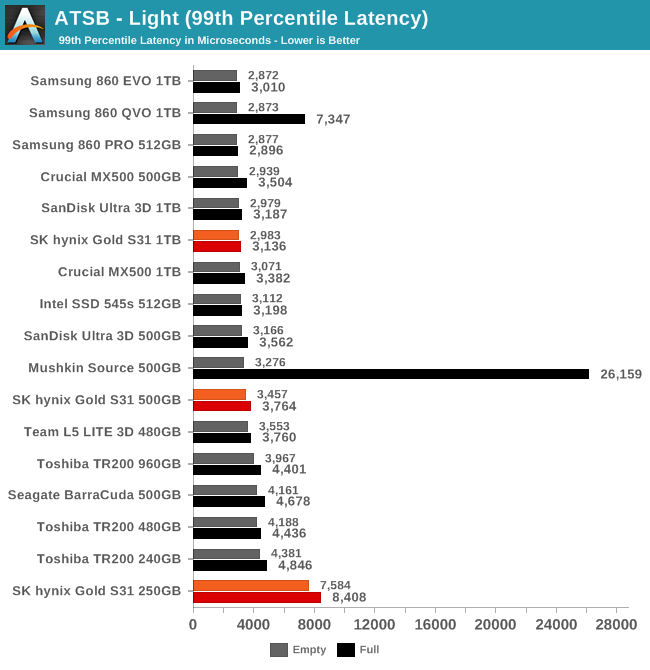
Average and 99th percentile latency is great for the larger two S31 models. The average latency for the 250GB model is a bit higher than for its larger siblings, but it's still ahead of the DRAMless drives. The 99th percentile latency score for the 250GB S31 is bad news: it's almost twice as bad as the DRAMless SSDs, though thankfully the S31's performance doesn't completely fall to pieces if the test is run on a full drive
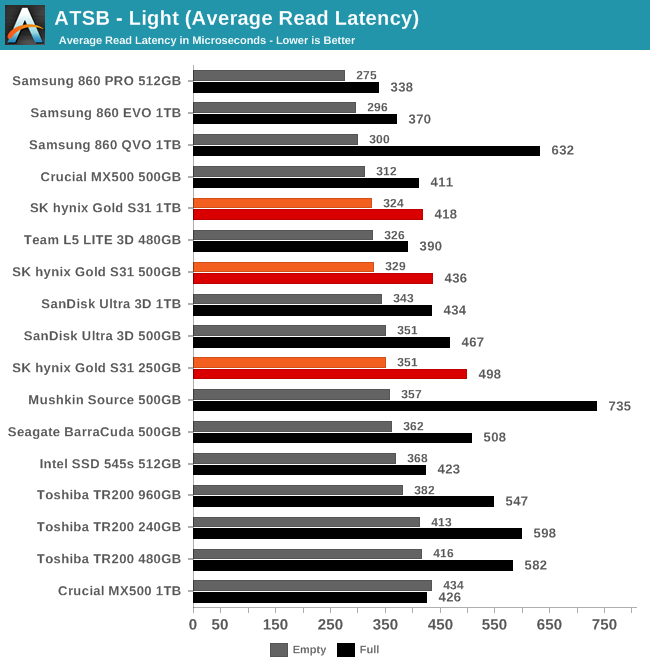
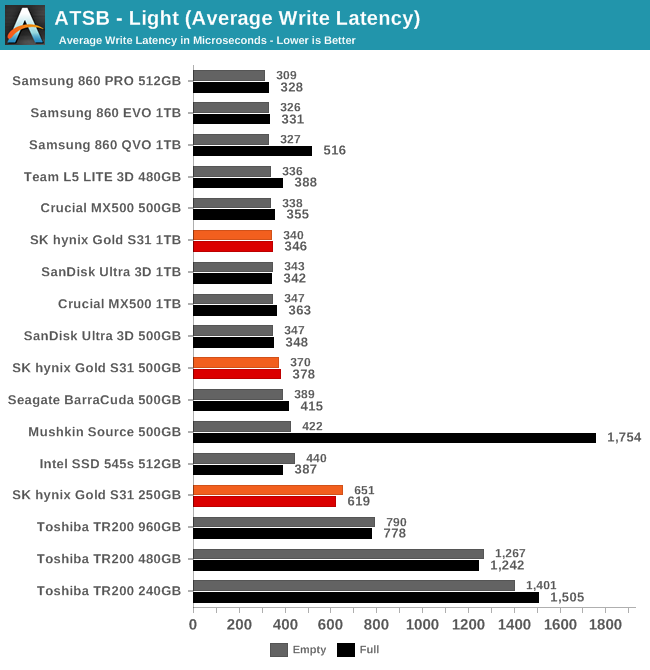
The average read latencies from the S31 drives is unremarkable. For reads, the 250GB model does stick out a bit from this crowd, but it isn't as much of an outlier as the DRAMless models.
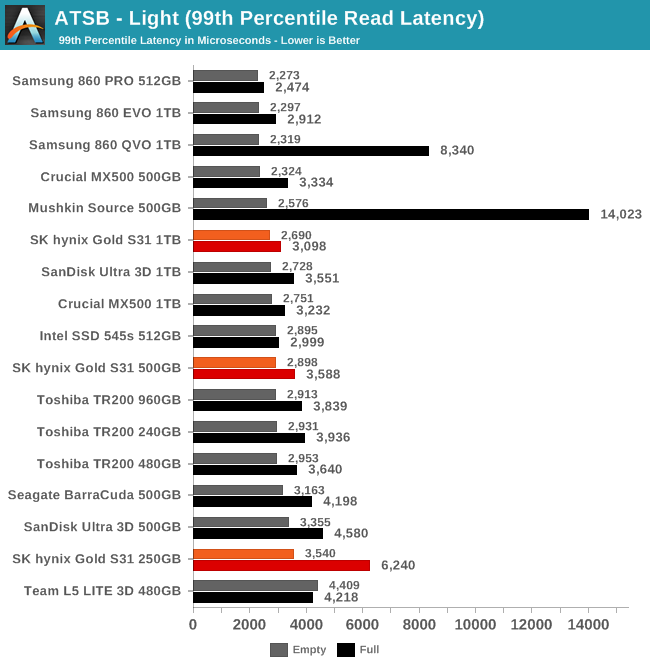
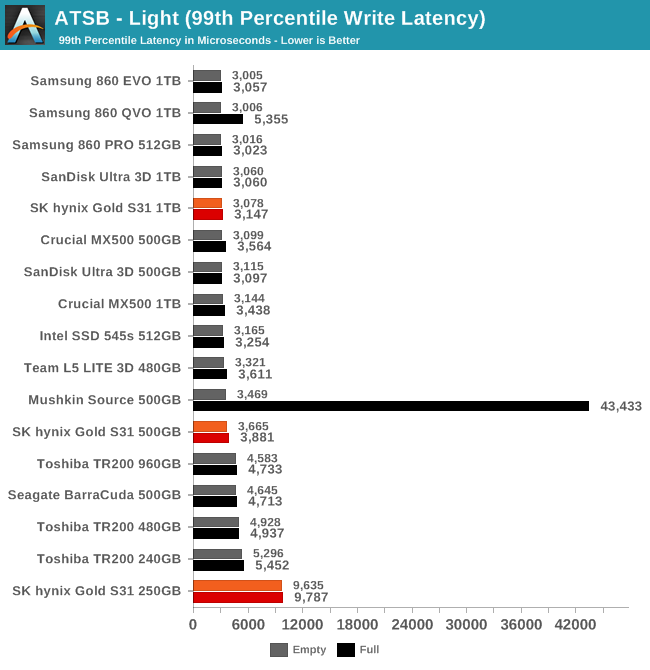
As with average read and write latencies, the 99th percentile latency subscores show that the S31 isn't really a problem for reads, and it is a minor issue for writing to the drive.
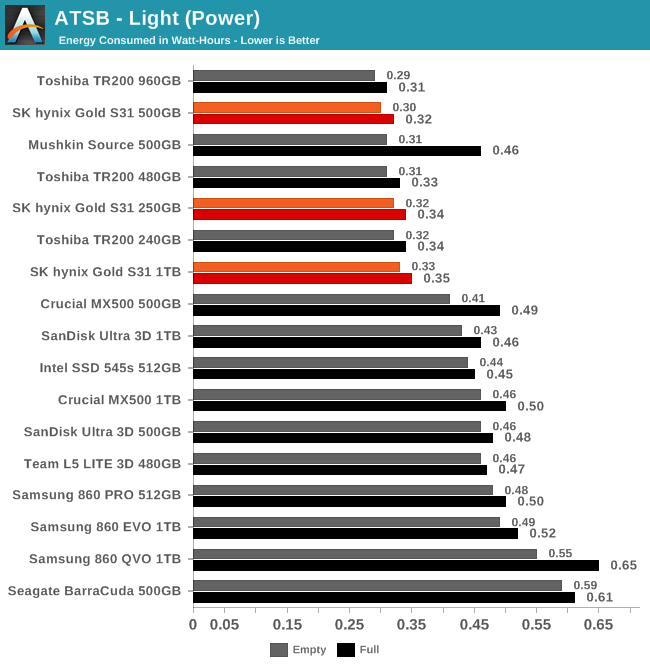
The SK Hynix Gold S31 drives are essentially tied with the DRAMless SSDs for lowest energy usage over the course of the Light test.
Random Read Performance
Our first test of random read performance uses very short bursts of operations issued one at a time with no queuing. The drives are given enough idle time between bursts to yield an overall duty cycle of 20%, so thermal throttling is impossible. Each burst consists of a total of 32MB of 4kB random reads, from a 16GB span of the disk. The total data read is 1GB.
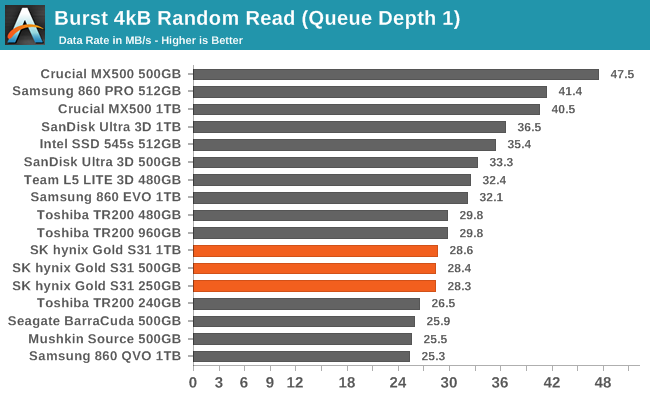
The burst random read performance of the SK Hynix Gold S31 isn't great: it's more in line with what we see from DRAMless SSDs than from most recent mainstream TLC-based drives.
Our sustained random read performance is similar to the random read test from our 2015 test suite: queue depths from 1 to 32 are tested, and the average performance and power efficiency across QD1, QD2 and QD4 are reported as the primary scores. Each queue depth is tested for one minute or 32GB of data transferred, whichever is shorter. After each queue depth is tested, the drive is given up to one minute to cool off so that the higher queue depths are unlikely to be affected by accumulated heat build-up. The individual read operations are again 4kB, and cover a 64GB span of the drive.
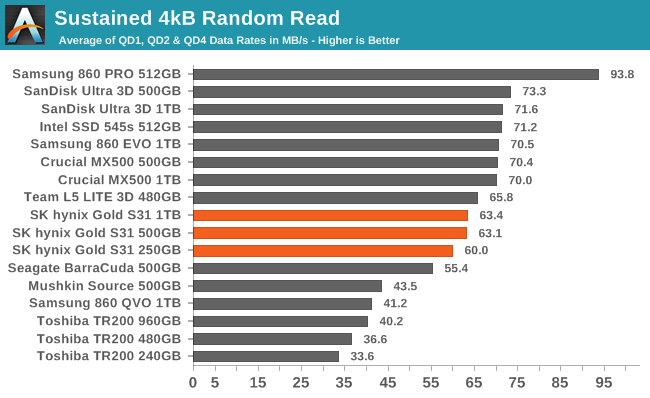
On the longer random read test, the S31s are clearly ahead of the DRAMless and QLC drives, but still a bit slower than typical for a mainstream SATA drive.
 |
|||||||||
| Power Efficiency in MB/s/W | Average Power in W | ||||||||
The SK Hynix Gold S31s all provide excellent power efficiency during the random read test; they draw only slightly more power than the DRAMless Toshiba TR200, and much less power than any of the mainstream SATA SSDs in this comparison. The MLC-based Samsung 860 PRO is the only drive in this batch that delivers a better performance per Watt ratio, which it achieves by being about 30% faster than the TLC drives while consuming similar amounts of power.
 |
|||||||||
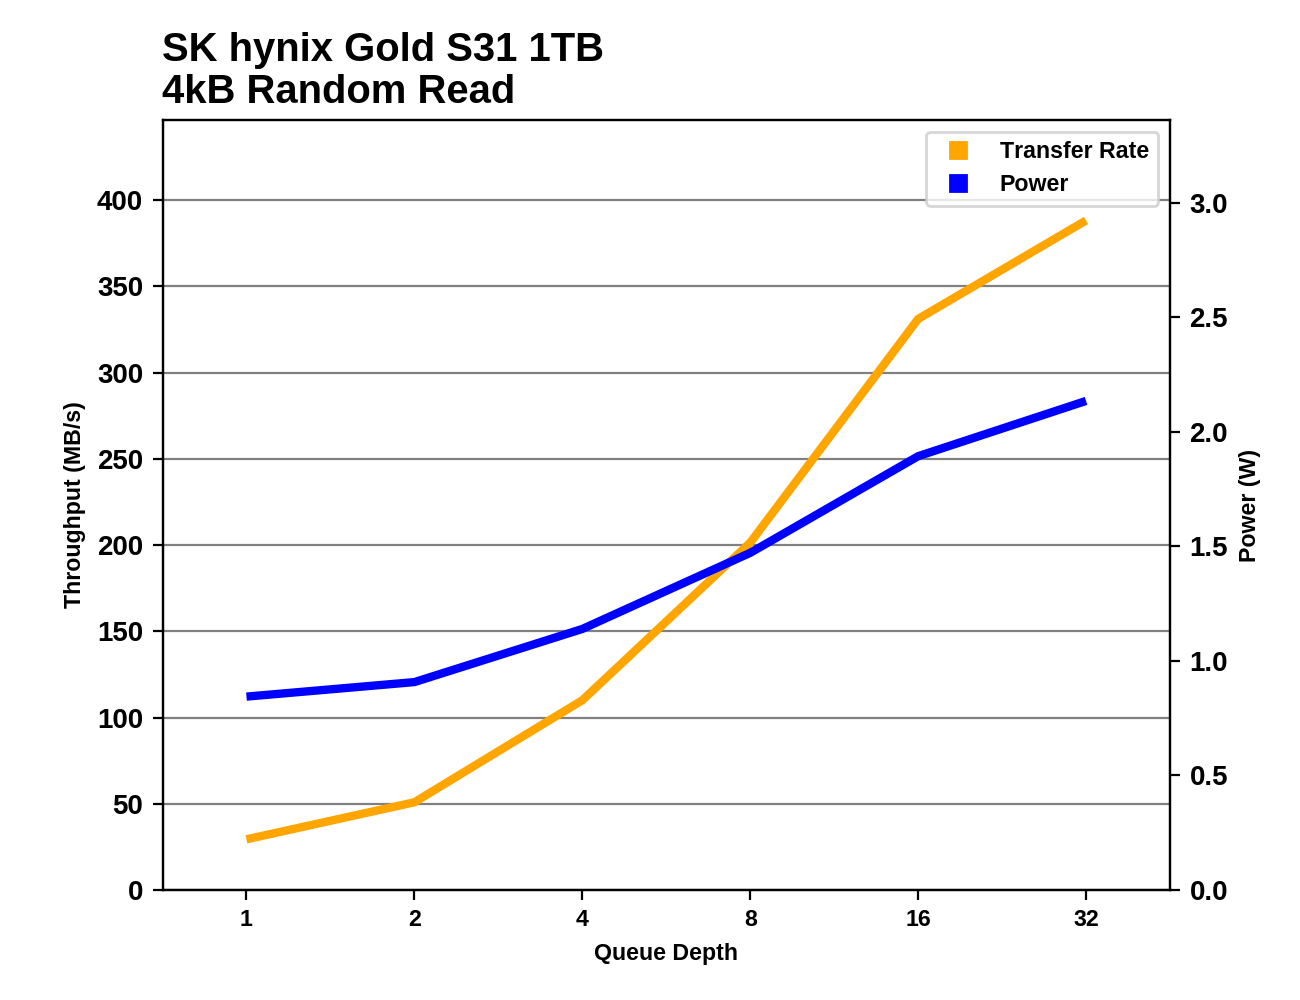
The 250GB S31's random read performance starts to fall behind the 1TB model with queue depths higher than about 4, while the 500GB more or less keeps pace through QD8. Compared to competing mainstream TLC drives from Samsung, Crucial and WD/SanDisk, the 1TB S31's performance never falls far behind, but its power consumption is almost always lower, often by a significant amount.
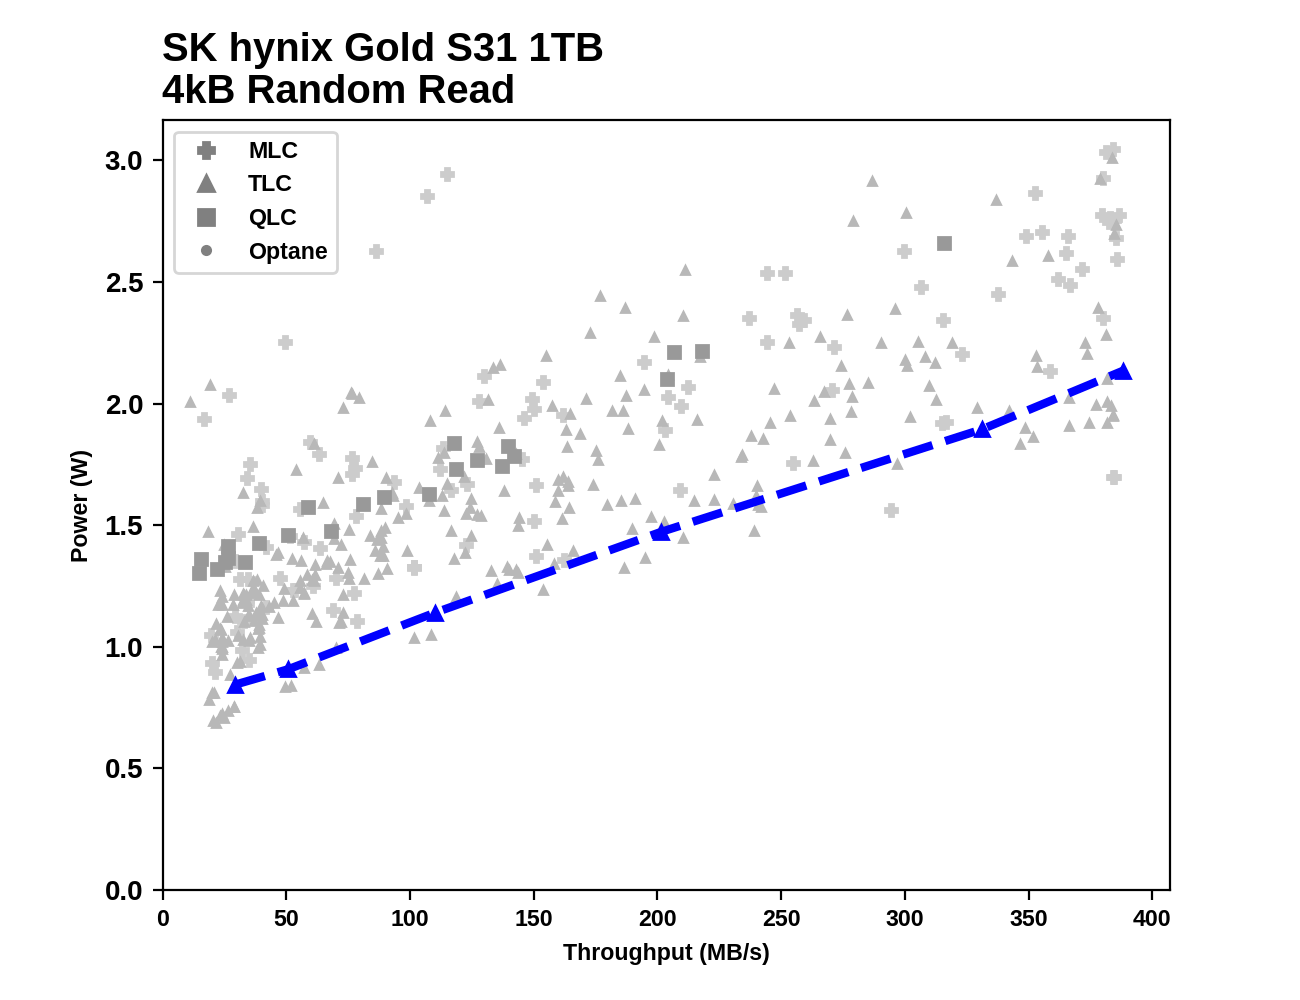
Plotting the S31's performance and power usage during the random read test against all the other SATA drives we've tested reveals that the S31 doesn't quite break the power efficiency record, but it comes pretty close except at the highest queue depths.
Random Write Performance
Our test of random write burst performance is structured similarly to the random read burst test, but each burst is only 4MB and the total test length is 128MB. The 4kB random write operations are distributed over a 16GB span of the drive, and the operations are issued one at a time with no queuing.
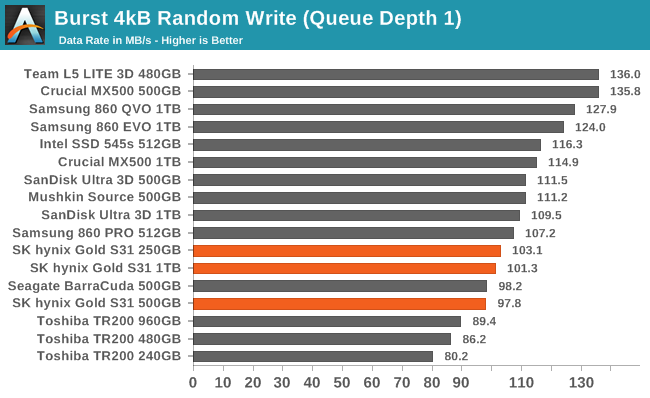
As with random reads, the burst random write performance of the SK Hynix Gold S31 is a bit slower than the competition, but this time the deficit is definitely smaller.
As with the sustained random read test, our sustained 4kB random write test runs for up to one minute or 32GB per queue depth, covering a 64GB span of the drive and giving the drive up to 1 minute of idle time between queue depths to allow for write caches to be flushed and for the drive to cool down.
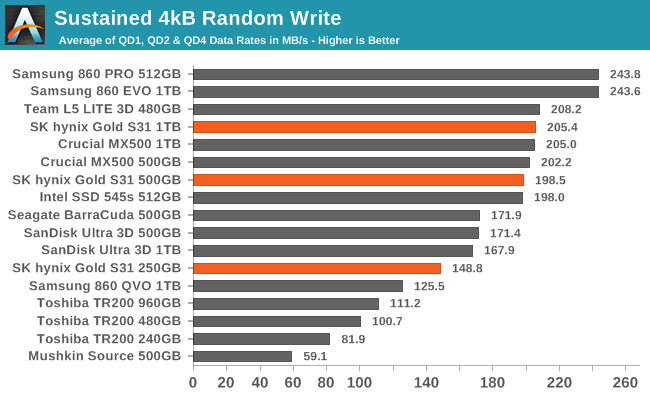
On the longer random write test, the 500GB and 1TB models of the S31 perform similarly and are competitive with everything but the Samsung drives. The 250GB model is 25% slower than the 500GB, which still leaves it substantially faster than the DRAMless or QLC-based drives.
 |
|||||||||
| Power Efficiency in MB/s/W | Average Power in W | ||||||||
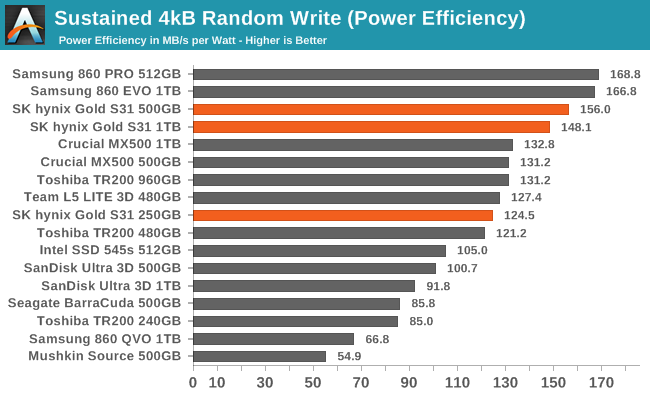
The S31 again uses less power than other mainstream SATA drives, and that allows the larger two models to turn in efficiency scores that are second only to Samsung's high-end options. The slower 250GB model's efficiency score is comparable to some of the better 500GB and 1TB competitors.
 |
|||||||||
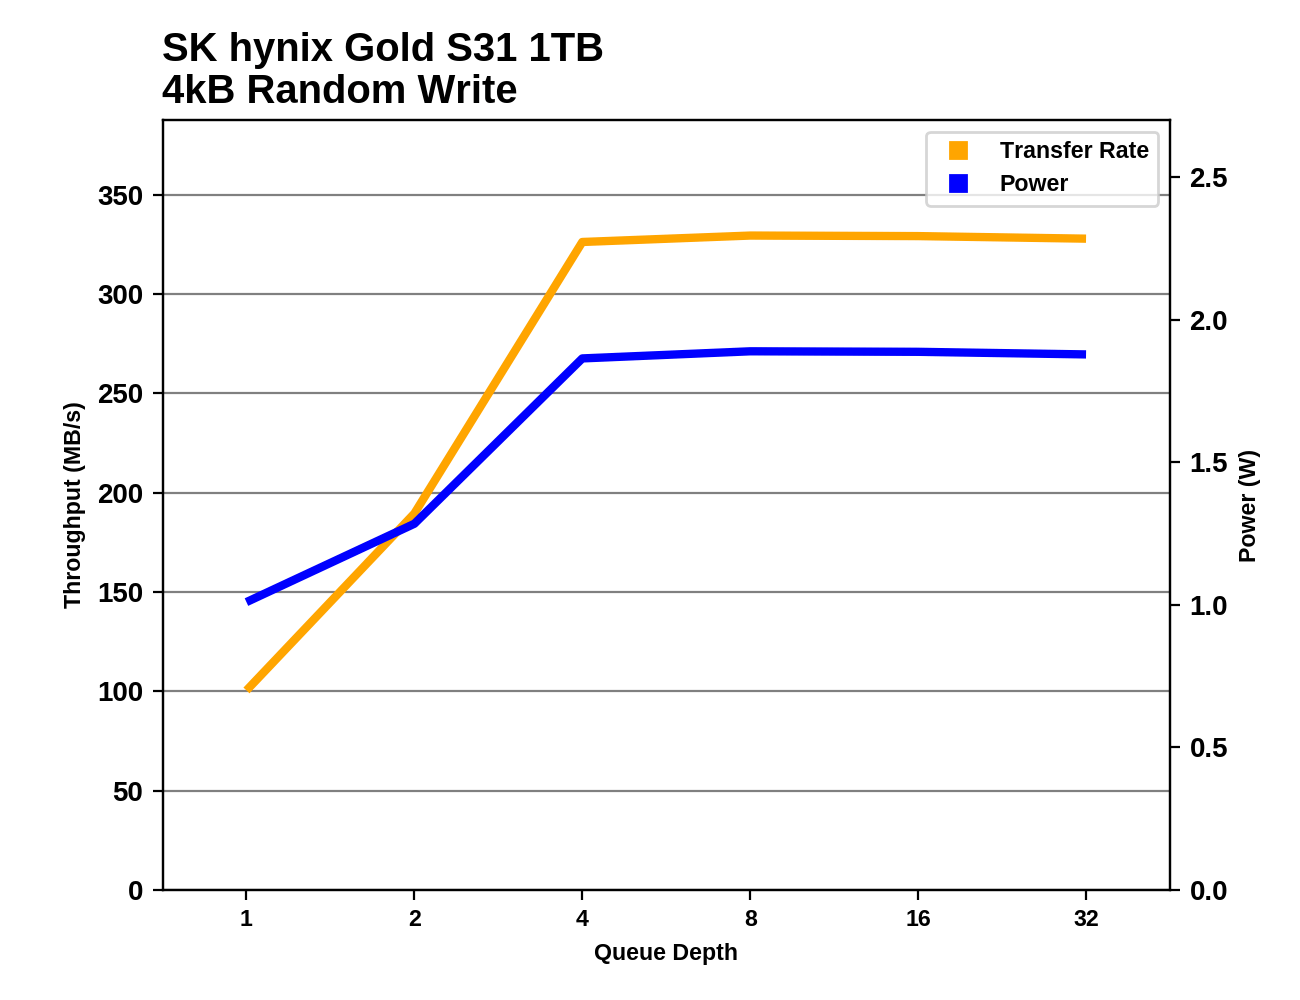
The 1TB and 500GB S31s hit full random write speed at QD4, and maintain that performance through the rest of the test without any trouble. The 250GB model saturates a bit earlier and even at QD2 is pretty close to its maximum random write throughput, but at least it too is steady and well-behaved for the rest of the test.
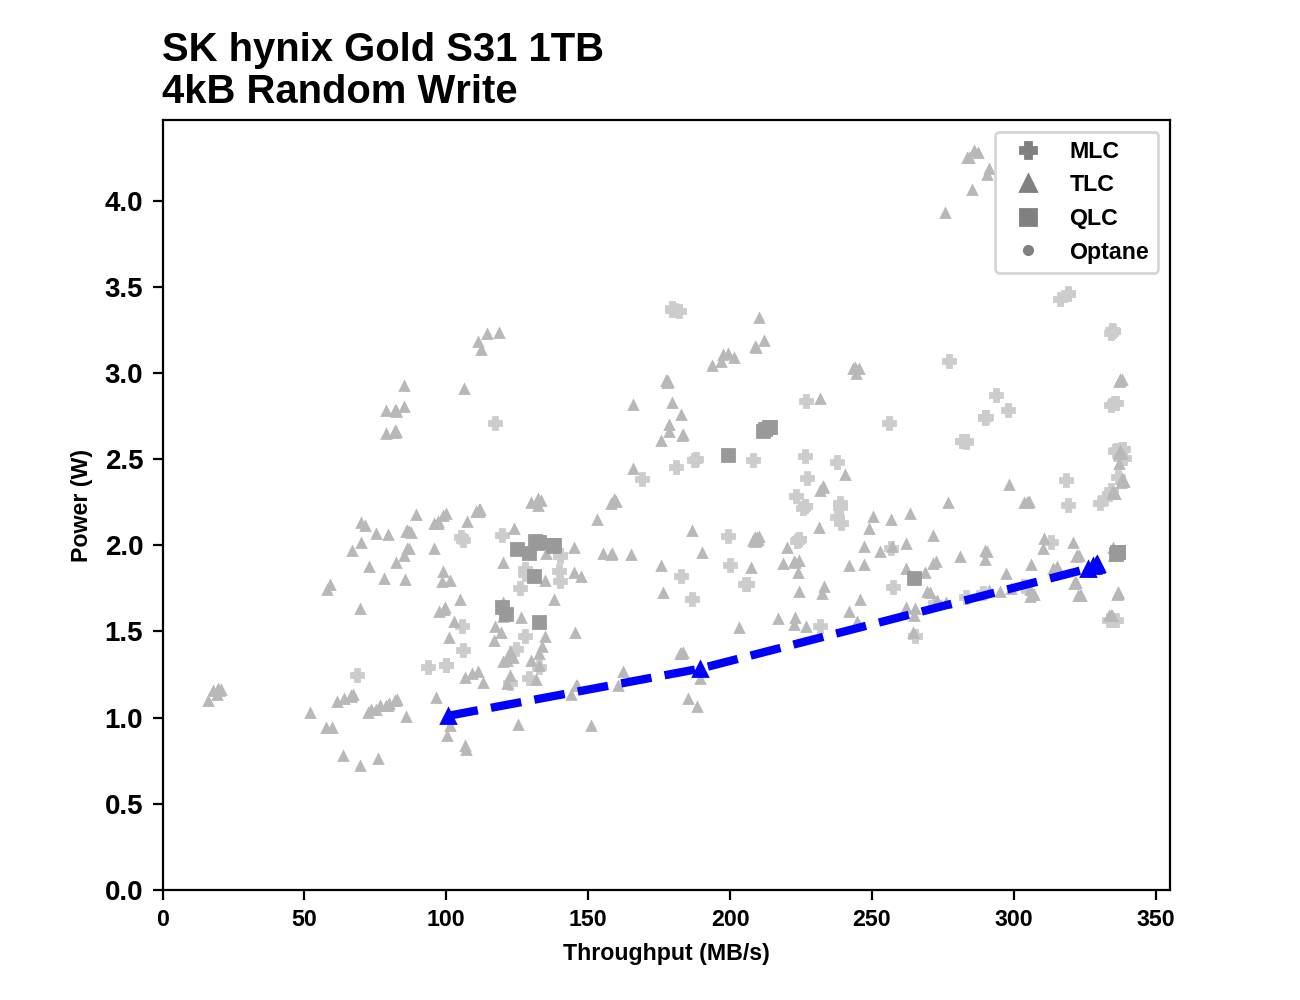
Plotting the results against the entire archive of SATA tests, the 1TB S31 again isn't setting any new efficiency record, but it is definitely one of the most power-efficient SATA drives for a random write workload.
Sequential Read Performance
Our first test of sequential read performance uses short bursts of 128MB, issued as 128kB operations with no queuing. The test averages performance across eight bursts for a total of 1GB of data transferred from a drive containing 16GB of data. Between each burst the drive is given enough idle time to keep the overall duty cycle at 20%.
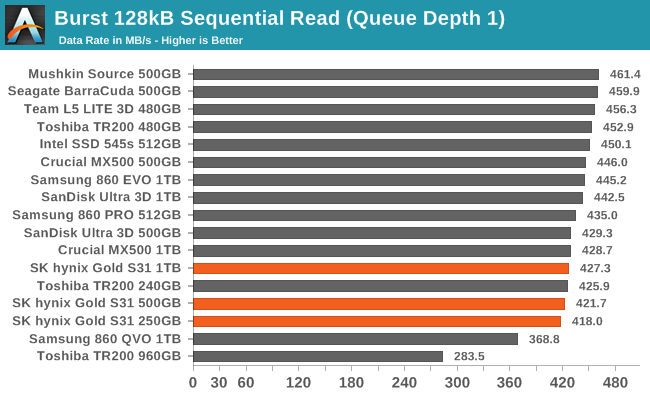
The burst sequential read performance of all three capacities of the SK Hynix Gold S31 are a bit on the slow side, but from the smallest and slowest S31 up to the fastest SATA drive in this batch is a mere 10%.
Our test of sustained sequential reads uses queue depths from 1 to 32, with the performance and power scores computed as the average of QD1, QD2 and QD4. Each queue depth is tested for up to one minute or 32GB transferred, from a drive containing 64GB of data. This test is run twice: once with the drive prepared by sequentially writing the test data, and again after the random write test has mixed things up, causing fragmentation inside the SSD that isn't visible to the OS. These two scores represent the two extremes of how the drive would perform under real-world usage, where wear leveling and modifications to some existing data will create some internal fragmentation that degrades performance, but usually not to the extent shown here.
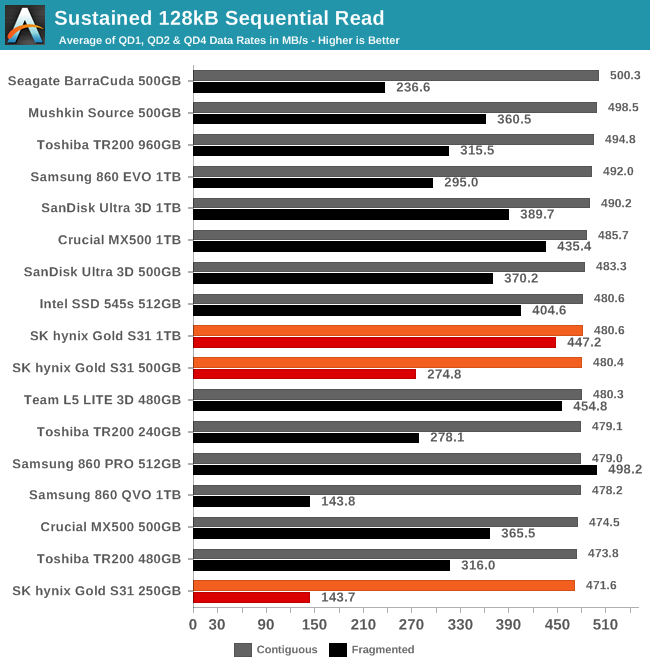
On the longer sequential read test that brings in some moderately higher queue depths, all the SATA drives perform similarly for reading data that was written sequentially. When performing sequential reads of data that was written randomly, the 1TB S31 performs quite well but the smaller models suffer significantly.
 |
|||||||||
| Power Efficiency in MB/s/W | Average Power in W | ||||||||
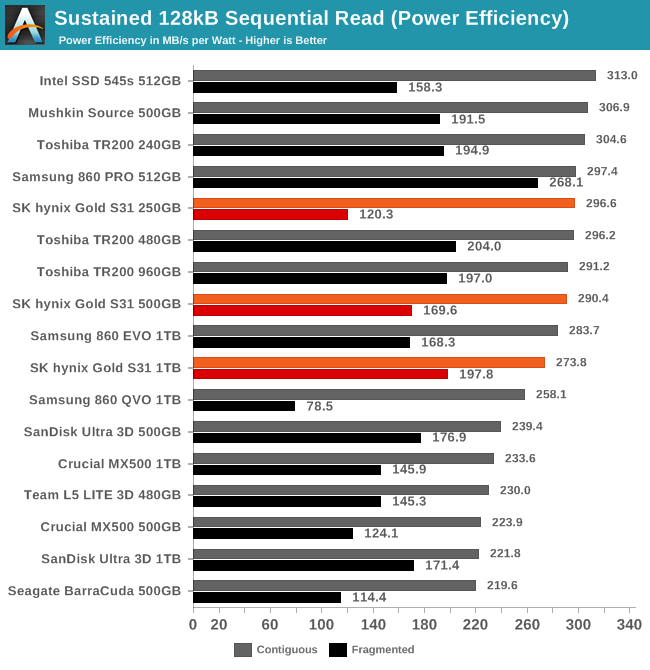
The power efficiency of the S31 doesn't stand out on the sequential read test. It doesn't consume much less power than the competition, and with the performance scores showing little variation across the entire field, the efficiency scores for the S31 are good but nothing special.
 |
|||||||||
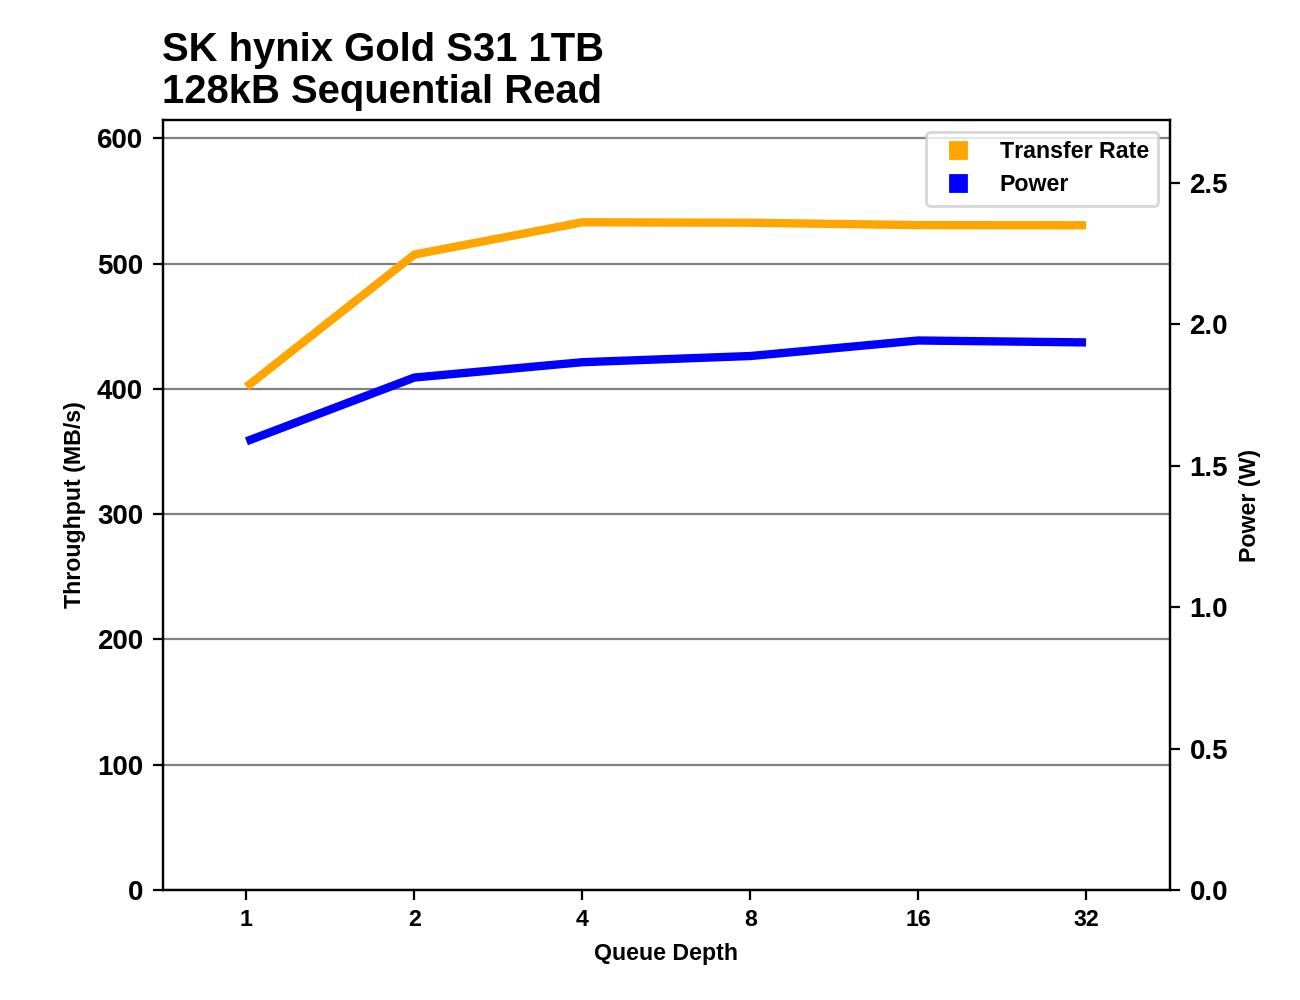
The S31 drives don't quite reach full sequential read speed until QD4. The larger two models perform identically across the entire range of queue depths, with the 1TB model consistently drawing a bit more power than the 500GB model. The 250GB model has a slight performance blip or two but otherwise it also matches the performance of the other two drives.
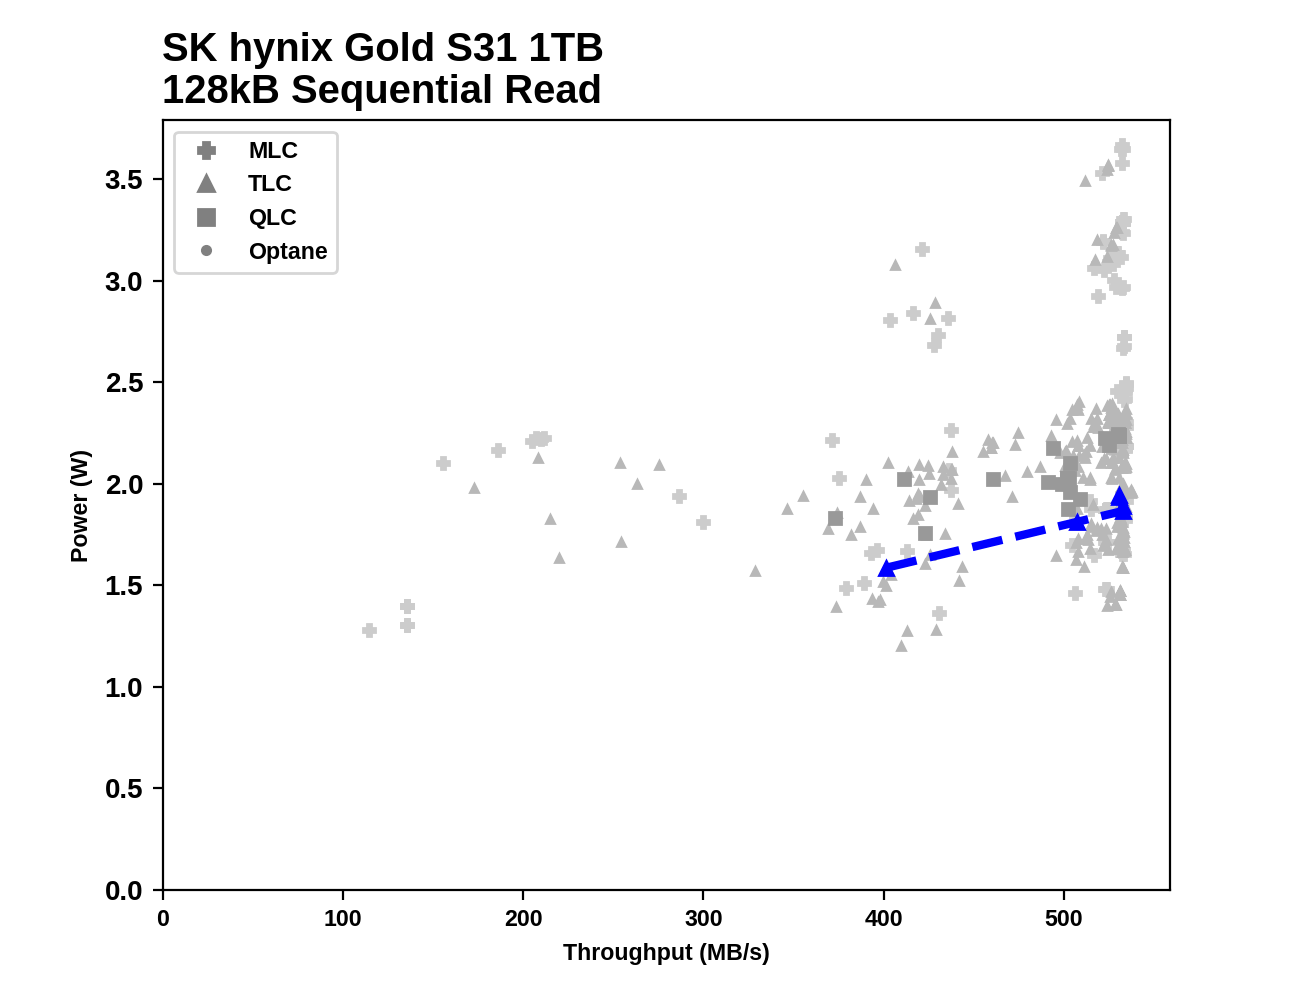
The power usage of the 1TB S31 during the sequential read test is a bit less than average, but unlike for the random IO tests it isn't standing at the limits of what is currently achievable
Sequential Write Performance
Our test of sequential write burst performance is structured identically to the sequential read burst performance test save for the direction of the data transfer. Each burst writes 128MB as 128kB operations issued at QD1, for a total of 1GB of data written to a drive containing 16GB of data.
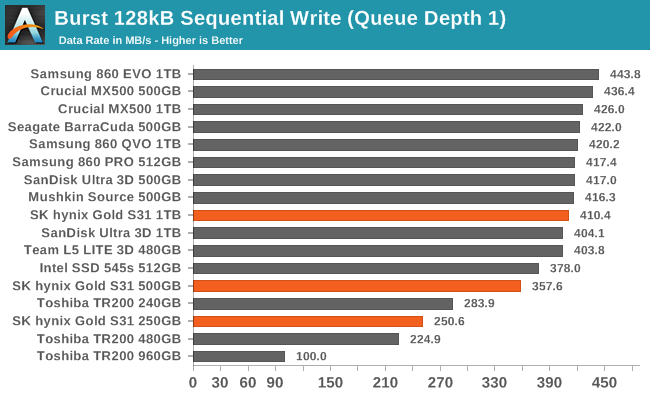
On the burst sequential write test, the 1TB SK Hynix Gold S31 turns in a decent score. The 500GB model is a little bit slower, and the 250GB S31 manages to be a bit slower than the DRAMless Toshiba TR200.
Our test of sustained sequential writes is structured identically to our sustained sequential read test, save for the direction of the data transfers. Queue depths range from 1 to 32 and each queue depth is tested for up to one minute or 32GB, followed by up to one minute of idle time for the drive to cool off and perform garbage collection. The test is confined to a 64GB span of the drive.
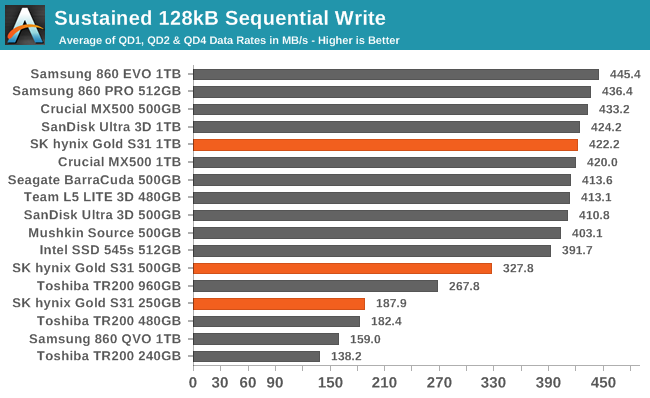
On the longer sequential write test, the 1TB S31 improves its standing to keep up with its like-sized competition while the 500GB model clearly falls behind.
 |
|||||||||
| Power Efficiency in MB/s/W | Average Power in W | ||||||||
The larger two capacities of the S31 earn decent power efficiency scores during the sequential write test, but they aren't in the top tier of drives. The 250GB model averaged less power draw than any of the other drives in this batch, but its poor performance keeps the overall efficiency score low.
 |
|||||||||
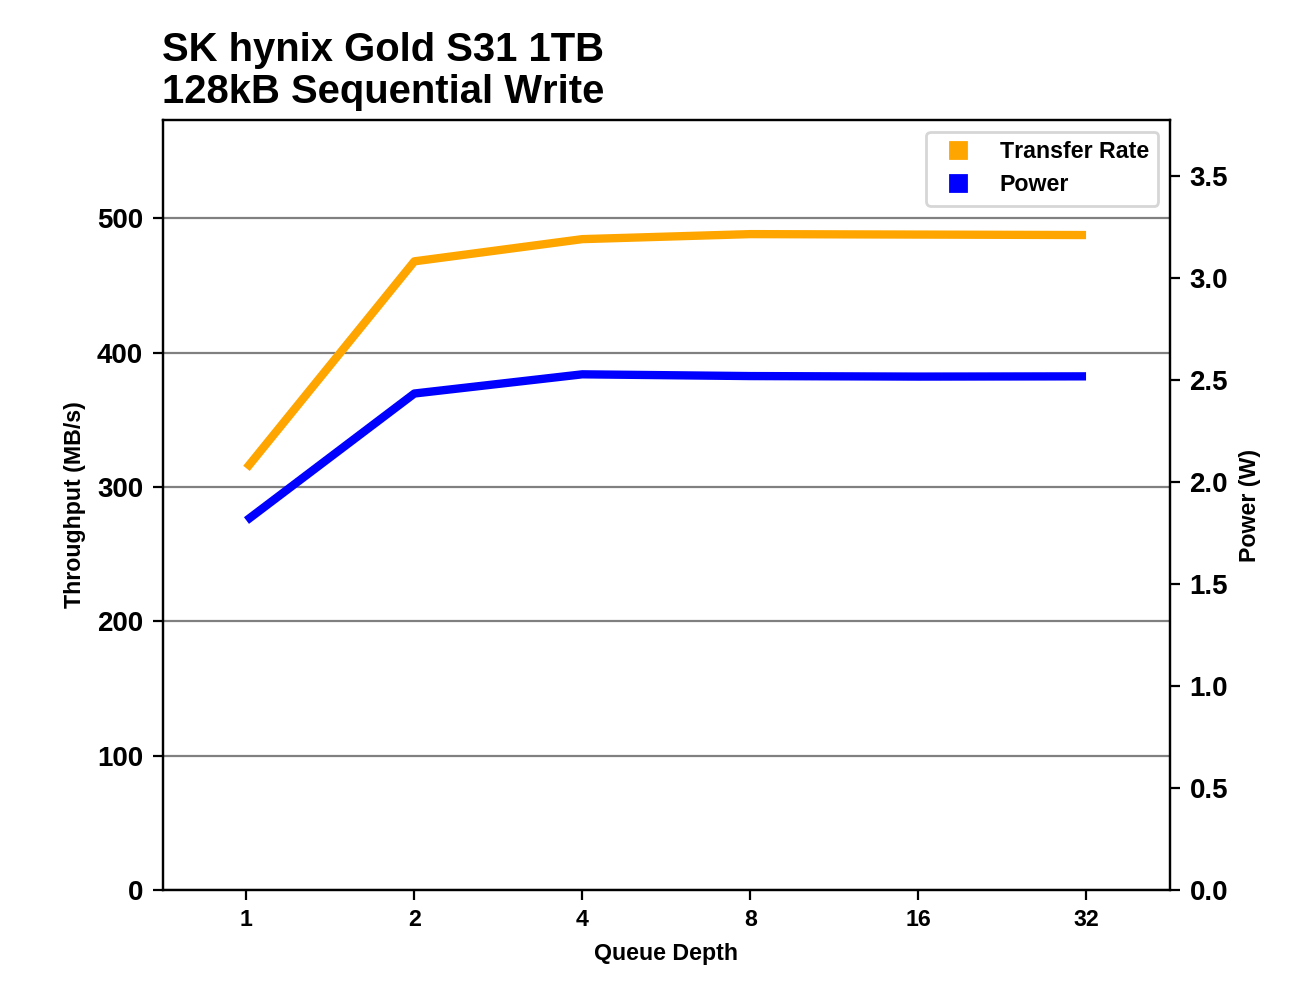
While getting full sequential read speeds out of the S31 required sufficiently high queue depths, the 500GB model is basically at its full speed at QD2 and the 250GB hardly gains anything from going past QD1.
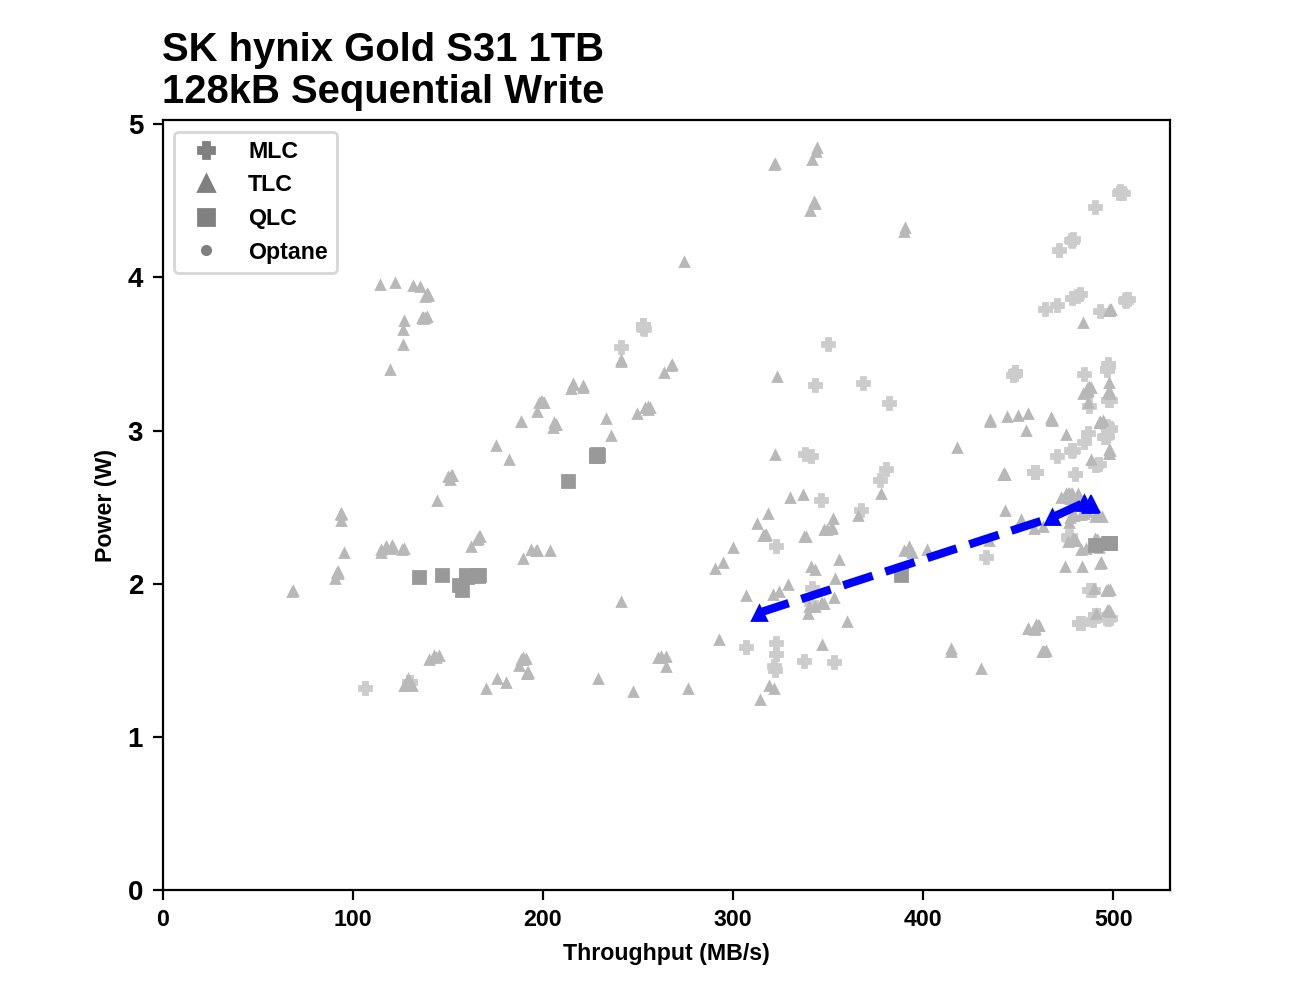
As with sequential reads, the record of all sequential writes shows that the S31 is fairly average when it comes to power draw, and there's room for improvement.
Mixed Random Performance
Our test of mixed random reads and writes covers mixes varying from pure reads to pure writes at 10% increments. Each mix is tested for up to 1 minute or 32GB of data transferred. The test is conducted with a queue depth of 4, and is limited to a 64GB span of the drive. In between each mix, the drive is given idle time of up to one minute so that the overall duty cycle is 50%.
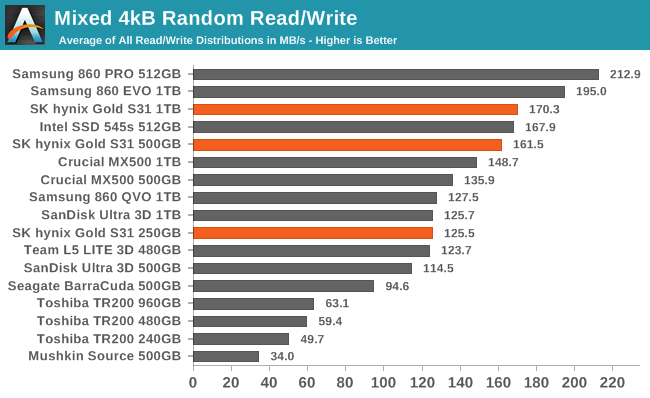
All three capacities of the SK Hynix Gold S31 perform fairly well on the mixed random IO test. The 1TB and 500GB models rank just behind their fastest competitors of like capacity, and the 250GB model performs on par with several drives of significantly higher capacity.
 |
|||||||||
| Power Efficiency in MB/s/W | Average Power in W | ||||||||
The three capacities again earn excellent power efficiency scores, second only to Samsung's 860 series drives. In absolute terms, the three are each averaging less power draw than any of the DRAM-equipped drives.
 |
|||||||||
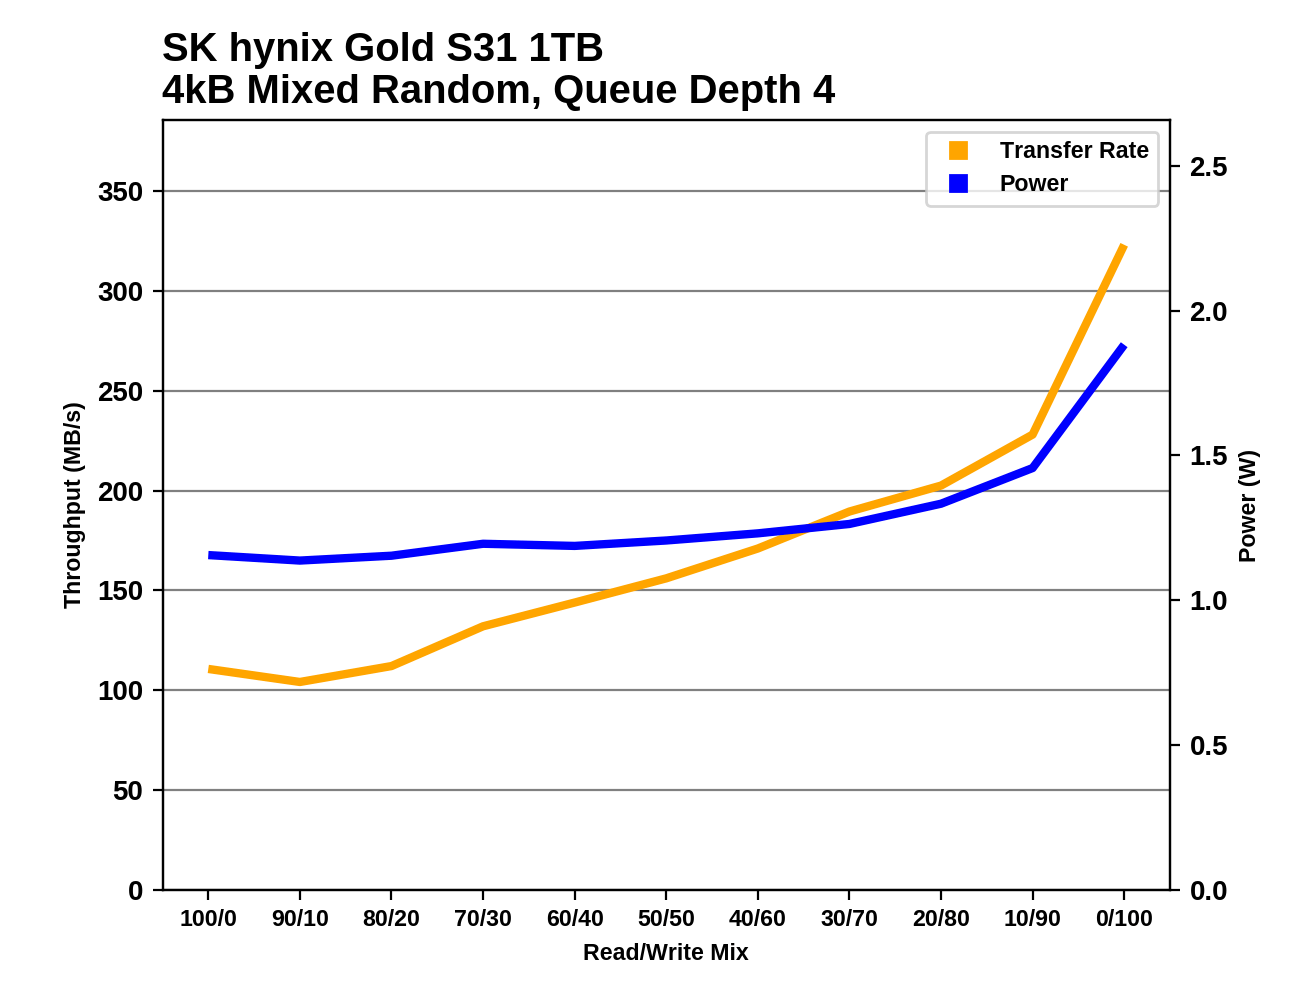
Performance for the S31 on the mixed random IO test increases quickly as the proportion of writes in the workload is increased. As is typical, the test ends with a spike in performance as the workload shifts to 100% cacheable random writes. The 250GB model starts to fall behind after writes account for more than 20% of the workload, and it doesn't really catch up even at the end of the test.
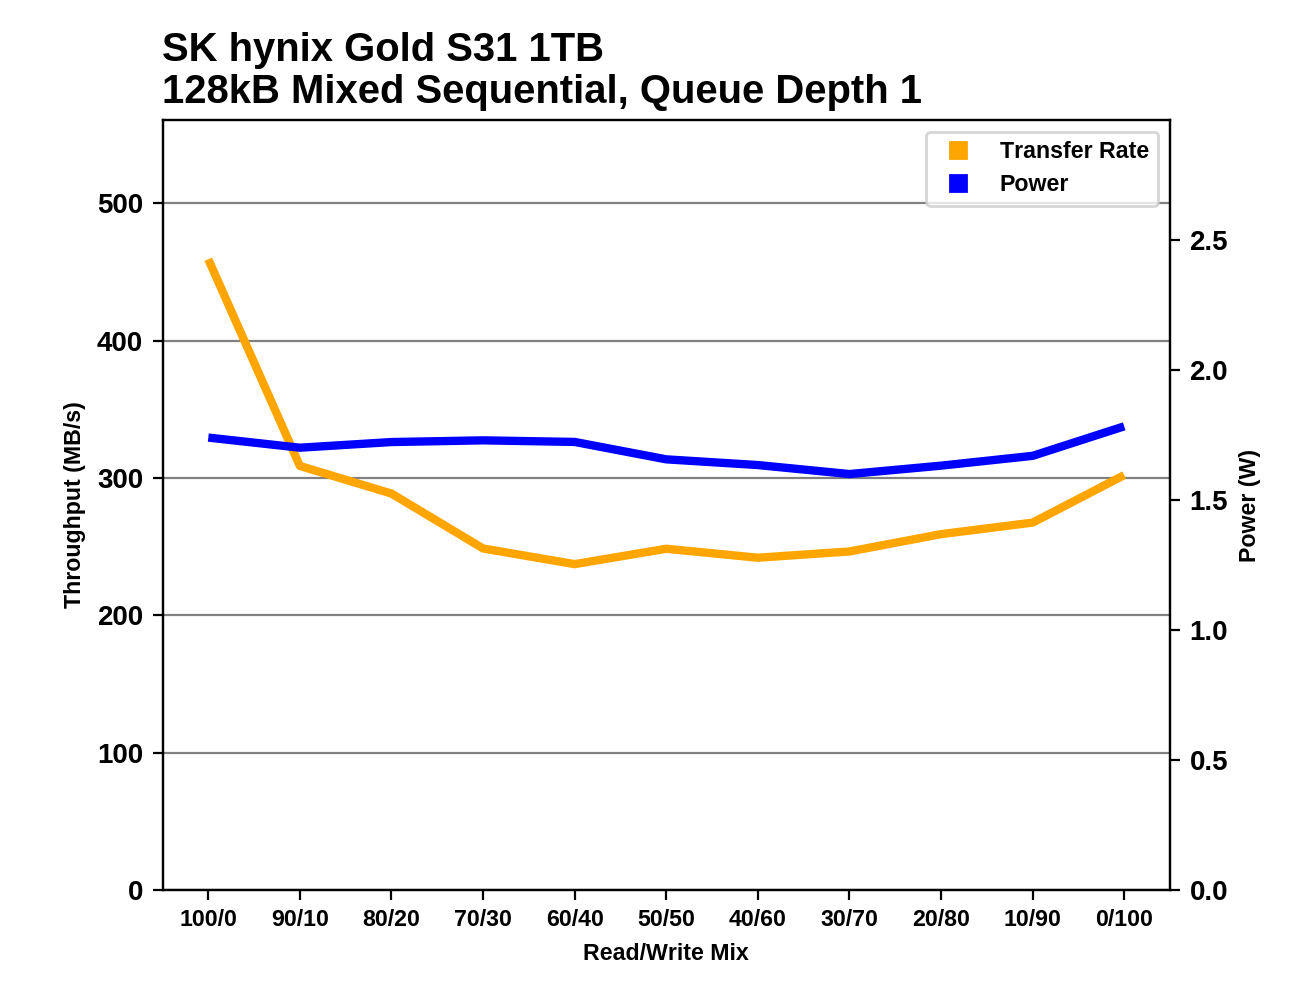
Mixed Sequential Performance
Our test of mixed sequential reads and writes differs from the mixed random I/O test by performing 128kB sequential accesses rather than 4kB accesses at random locations, and the sequential test is conducted at queue depth 1. The range of mixes tested is the same, and the timing and limits on data transfers are also the same as above.
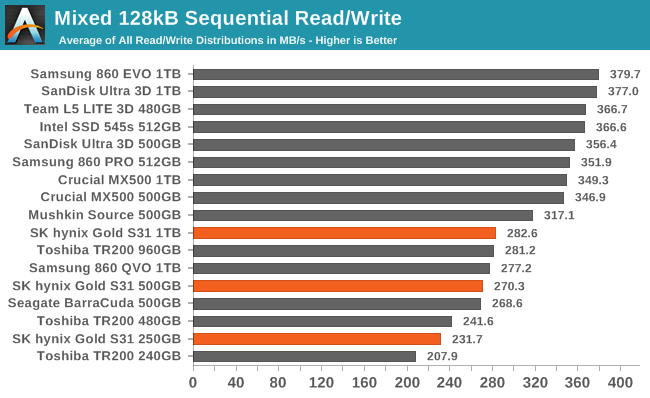
In stark contrast to the good overall performance on the mixed random IO test, the SK Hynix Gold S31 drives are all in the bottom performance tier for the mixed sequential workload test. The 1TB model is basically tied with a DRAMless SSD, and the smaller two are even slower though they outperform the DRAMless drive of similar capacity.
 |
|||||||||
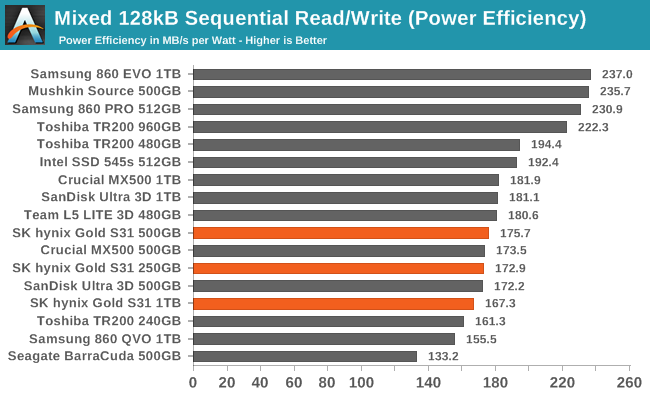
| Power Efficiency in MB/s/W | Average Power in W | ||||||||
Even though performance on the mixed sequential IO test was clearly on the low side, the drives earn power efficiency scores that are only slightly below par. Their power consumption in absolute terms is still a bit lower than most of the competition.
 |
|||||||||
All three capacities of the S31 start out with decent performance with the pure-read workload phase of this test, but performance drops off quickly. The 1TB model spends most of the test hovering around 250MB/s and the 500GB model is a bit slower than that. The 250GB model takes until the 30/70% read/write mix for performance to level out at well under 200 MB/s.
Idle Power Measurement
SATA SSDs are tested with SATA link power management disabled to measure their active idle power draw, and with it enabled for the deeper idle power consumption scores and the idle wake-up latency test. Our testbed, like any ordinary desktop system, cannot trigger the deepest DevSleep idle state.
Note: Earlier this year we upgraded our power measurement equipment and switched to measuring idle power on our Coffee Lake desktop, our first SSD testbed to have fully-functional PCIe power management. The below measurements are all new, and are not a perfect match for the older measurements in our previous reviews and the Bench database.
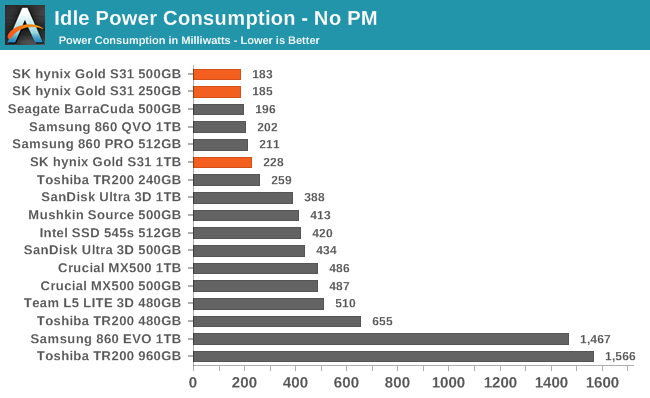
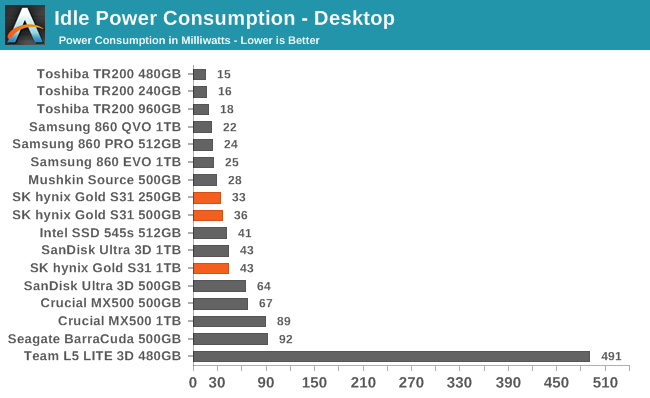
The active idle power consumption of the SK Hynix Gold S31 SSDs is among the best we've seen from SATA drives, though the largest 1TB model requires slightly more power than the two smaller models. When SATA link power management is enabled, power consumption ends up being merely the typical values for mainstream drives.
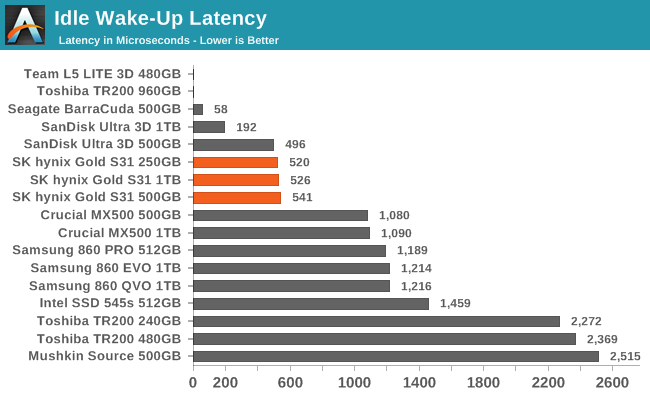
The idle wake-up process takes the S31s about half a millisecond, plenty fast and a factor of two better than other mainstream drive latency.
Conclusion
The SK Hynix Gold S31 SSDs are capable mainstream SATA drives. They are consistently a bit slower than most of the recent competition in this market segment, but the differences are seldom big enough to matter (and performance sensitive users should be shopping for NVMe drives instead). On the bright side, the Gold S31 tends to have significantly better than average power efficiency. The use of LPDDR3 DRAM instead of DDR3L or DDR4 seems to be a factor.
The 250GB model is clearly quite a bit slower on the harder tests, showing why the competition is reluctant to sample drives at that capacity. The trend toward higher per-die capacities with newer NAND flash and thus fewer dies in a drive of a given total capacity brings performance penalties that aren't being fully offset by increases in per-die performance. This hits the S31 harder than most since it is using exclusively 512Gb NAND parts while most of the competition is still using 256Gb parts, especially for lower-capacity models.
Overall, our first experience with SK Hynix's 3D NAND is positive. There's a bit of room for improvement on performance, but it works well enough for this particular product.
| SATA SSD Price Comparison (November 13, 2019) |
|||||||
| 240-256GB | 480-512GB | 1 TB | 2 TB | 4 TB | |||
| SK Hynix Gold S31 | $39.99 (16¢/GB) |
$59.99 (12¢/GB) |
$118.99 (12¢/GB) |
||||
| Samsung 860 EVO | $49.49 (20¢/GB) |
$79.99 (16¢/GB) |
$139.99 (14¢/GB) |
$299.99 (15¢/GB) |
$579.99 (14¢/GB) |
||
| WD Blue 3D NAND | $49.97 (20¢/GB) |
$64.99 (13¢/GB) |
$109.99 (11¢/GB) |
$224.99 (11¢/GB) |
$527.97 (13¢/GB) |
||
| SanDisk Ultra 3D | $49.97 (20¢/GB) |
$64.99 (13¢/GB) |
$107.99 (11¢/GB) |
$199.99 (10¢/GB) |
$499.99 (12¢/GB) |
||
| Crucial MX500 | $47.99 (19¢/GB) |
$64.50 (13¢/GB) |
$106.99 (11¢/GB) |
$219.99 (11¢/GB) |
|||
| ADATA SU800 | $34.99 (14¢/GB) |
$57.99 (11¢/GB) |
$91.99 (9¢/GB) |
$209.99 (10¢/GB) |
|||
Current retail pricing for the SK Hynix Gold S31 drives is pretty fair. They're generally a bit cheaper than the mainstream SATA drives from the top brands. Considering that the S31 tends to be slightly slower and doesn't come with the same reputation with consumers, it does need to undercut Crucial, WD and Samsung by at least a little bit.
It's nice to see SK Hynix's presence expanding beyond OEM and enterprise drives and into the retail market. The introduction of the Gold S31 is a good start for SK Hynix, but it's a small step. They still have a long way to go before they are competing with the other vertically integrated SSD companies across all market segments. We look forward to their next move.


