Original Link: https://www.anandtech.com/show/13955/the-silicon-power-p34a80-ssd-review-phison-e12-with-newer-firmware
The Silicon Power P34A80 SSD Review: Phison E12 With Newer Firmware
by Billy Tallis on February 28, 2019 10:00 AM EST- Posted in
- Storage
- SSDs
- Toshiba
- Phison
- Silicon Power
- M.2
- NVMe
- 3D TLC
- PS5012-E12
Silicon Power's SSD product line has always offered plenty of entry-level options, but they have only recently entered the NVMe market. Silicon Power is unusual among SSD brands for using controllers and reference designs from both Silicon Motion and Phison; most brands that use turnkey drive solutions are exclusive partners with just one of those two controller vendors. For their NVMe drives, Silicon Power is so far using Phison's second-generation NVMe controllers, starting last year with the P32A80 based on the Phison E8T DRAMless controller, and now followed up by the P34A80 high-end drive based on the Phison E12.
We previewed the Phison E12 controller solution with a review of an engineering sample before retail products were available, and later tested the Corsair Force Series MP510. Based on that, we have a pretty good idea of what to expect from the P34A80, but there are two potentially significant changes. First, the Silicon Power drive is configured with a larger usable capacity and thus smaller spare area than the Corsair drive: 1024GB instead of 960GB, while both drives have the same raw amount of flash memory onboard. Reserving more spare area is usually done to improve sustained performance on write-heavy workloads and to reduce worst-case write amplification and thus increase a drive's write endurance. The Silicon Power P34A80 may thus be at a disadvantage for the tests in our suite that measure performance of a completely full drive.
Second, the Silicon Power drive ships with newer firmware than we have previously tested: the Corsair MP510 was running version ECFM11.0 while the P34A80 is running ECFM12.1. We typically see many firmware versions for each Phison SSD controller. For the S10 SATA controller, quite a few of these revisions were necessary to support new NAND flash memory that was introduced over the course of the controller's long lifespan. For the E7—Phison's first NVMe controller—we saw at least four different firmware versions in shipping retail products, but ultimately none of them were able to extract enough performance to make the controller competitive against other high-end NVMe drives of the time. The Phison E12 launched as a serious contender, so there is much less need for tweaked firmware, but at the same time we have seen other controller hardware provide better performance when paired with the same Toshiba/SanDisk 64L TLC—most notably from Western Digital's in-house controller used in the WD Black product line.
Not all vendors of Phison SSDs are good about providing firmware updates. Silicon Power's current firmware updater is a year old, but they haven't yet needed to provide a firmware update for their NVMe drives. Corsair was much quicker to market with their Phison E12 drive, but they have not yet packaged the 12.1 firmware for their customers. MyDigitalSSD was another early adopter of the E12 controller with their BPX Pro, which was the first retail product to get the 12.1 firmware update.
| Silicon Power P34A80 SSD Specifications | |||||
| Capacity | 256 GB | 512 GB | 1 TB | ||
| Model Number | SP256GBP34A80M28 | SP512GBP34A80M28 | SP001TBP34A80M28 | ||
| Form Factor | M.2 2280 double-sided | ||||
| Interface | PCIe 3.0 x4 NVMe 1.3 | ||||
| Controller | Phison PS5012-E12 | ||||
| NAND Flash | Toshiba 256Gb 64L 3D TLC | ||||
| Sequential Read | 3200 MB/s | ||||
| Sequential Write | 3000 MB/s | ||||
| Warranty | 5 years | ||||
Silicon Power provides only the most basic specifications for the P34A80, lacking any numbers for random IO performance, power consumption, and write endurance. The sequential IO performance numbers aren't broken down by capacity, but are a bit conservative compared to what other brands advertise for their 1TB Phison E12 drives.
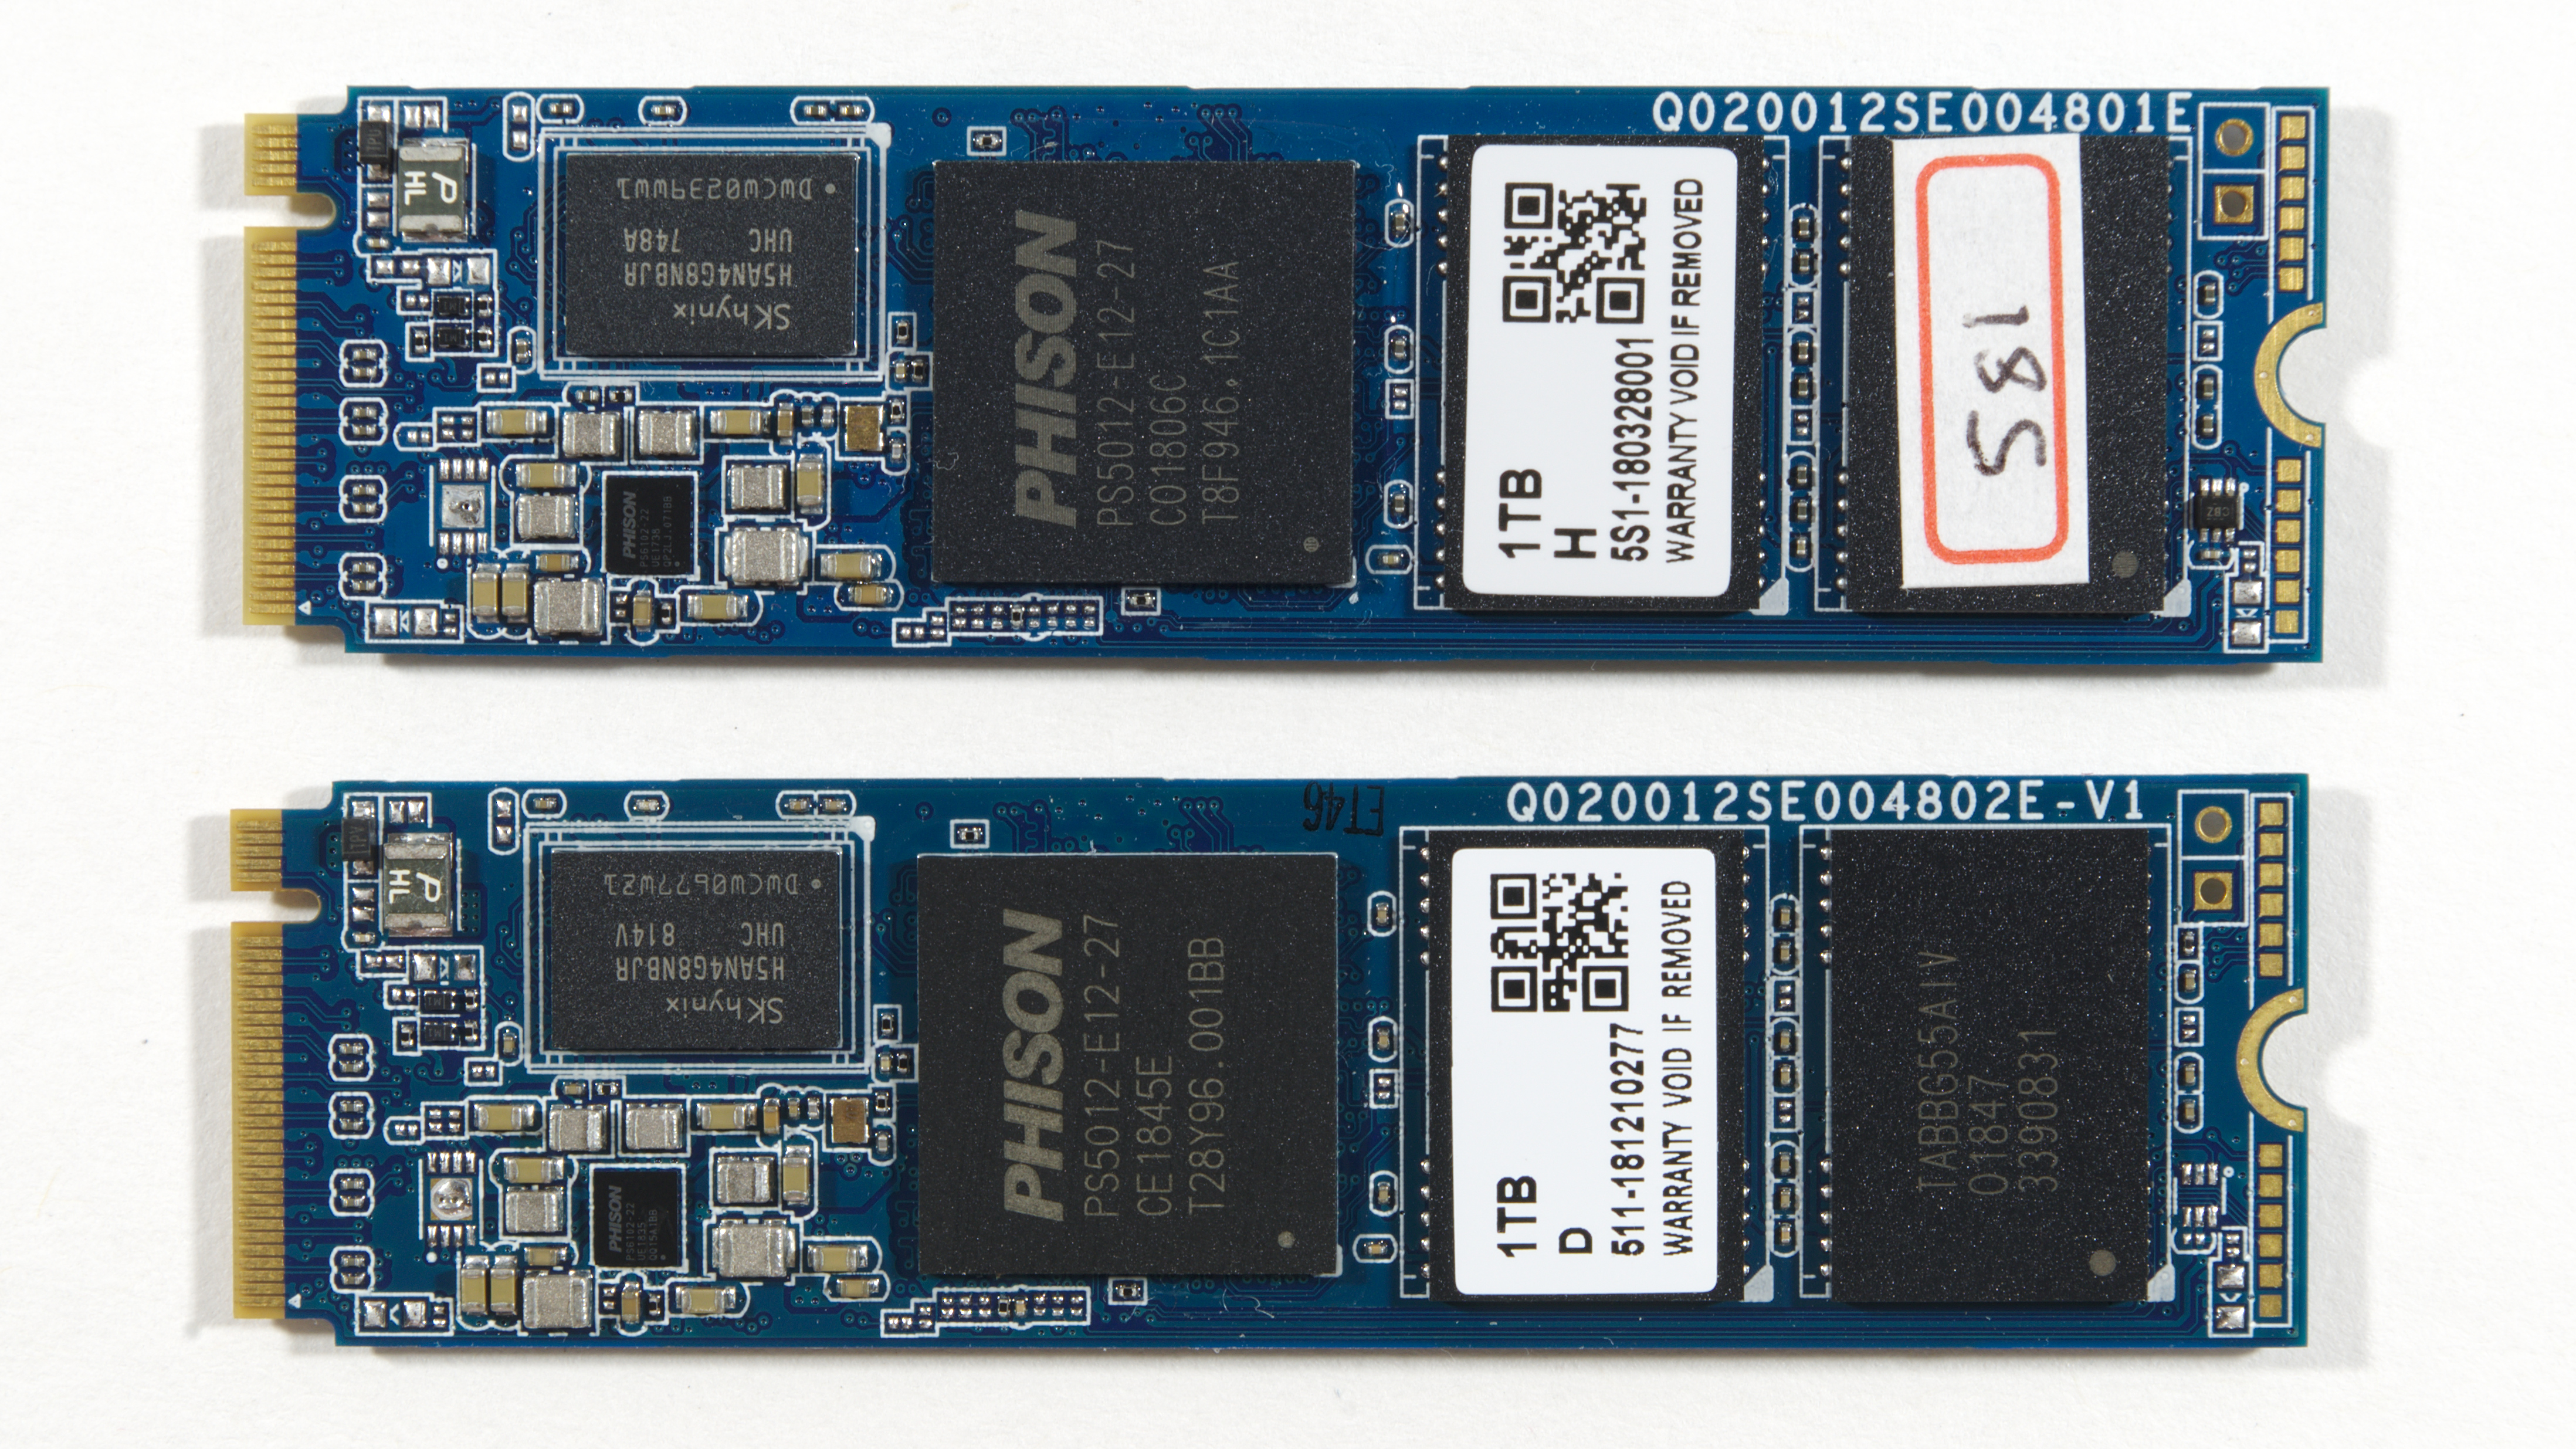
Top: Phison E12 Engineering Sample
Bottom: Silicon Power P34A80
Turning to the drive itself, we find no surprises under the sticker. The Toshiba 64L 3D TLC is by now very familiar, and the PCB layout is only slightly revised from the first Phison E12 reference design we tested. The drive is double-sided even at lower capacities due to the presence of some passive components on the back of the card in addition to DRAM and NAND.


The Competition
The closest point of comparison for the Silicon Power P34A80 is the Corsair Force Series MP510, with identical hardware but older firmware and configured for a lower usable. Other drives in this review that use the same Toshiba/SanDisk 3D TLC but different controllers include:
- Kingston A1000, based on the Phison E8 entry-level NVMe controller
- WD Black SN750, based on Western Digital's own in-house controller
- Plextor M9Pe, based on the Marvell 88SS1093 controller
The Patriot Hellfire shows what the obsolete Phison E7 first-generation NVMe controller platform offered, with 15nm planar MLC NAND; its performance can only compete against the entry-level NVMe drives in today's market.
| AnandTech 2018 Consumer SSD Testbed | |
| CPU | Intel Xeon E3 1240 v5 |
| Motherboard | ASRock Fatal1ty E3V5 Performance Gaming/OC |
| Chipset | Intel C232 |
| Memory | 4x 8GB G.SKILL Ripjaws DDR4-2400 CL15 |
| Graphics | AMD Radeon HD 5450, 1920x1200@60Hz |
| Software | Windows 10 x64, version 1709 |
| Linux kernel version 4.14, fio version 3.6 | |
| Spectre/Meltdown microcode and OS patches current as of May 2018 | |
- Thanks to Intel for the Xeon E3 1240 v5 CPU
- Thanks to ASRock for the E3V5 Performance Gaming/OC
- Thanks to G.SKILL for the Ripjaws DDR4-2400 RAM
- Thanks to Corsair for the RM750 power supply, Carbide 200R case, and Hydro H60 CPU cooler
- Thanks to Quarch for the XLC Programmable Power Module and accessories
- Thanks to StarTech for providing a RK2236BKF 22U rack cabinet.
Whole-Drive Fill
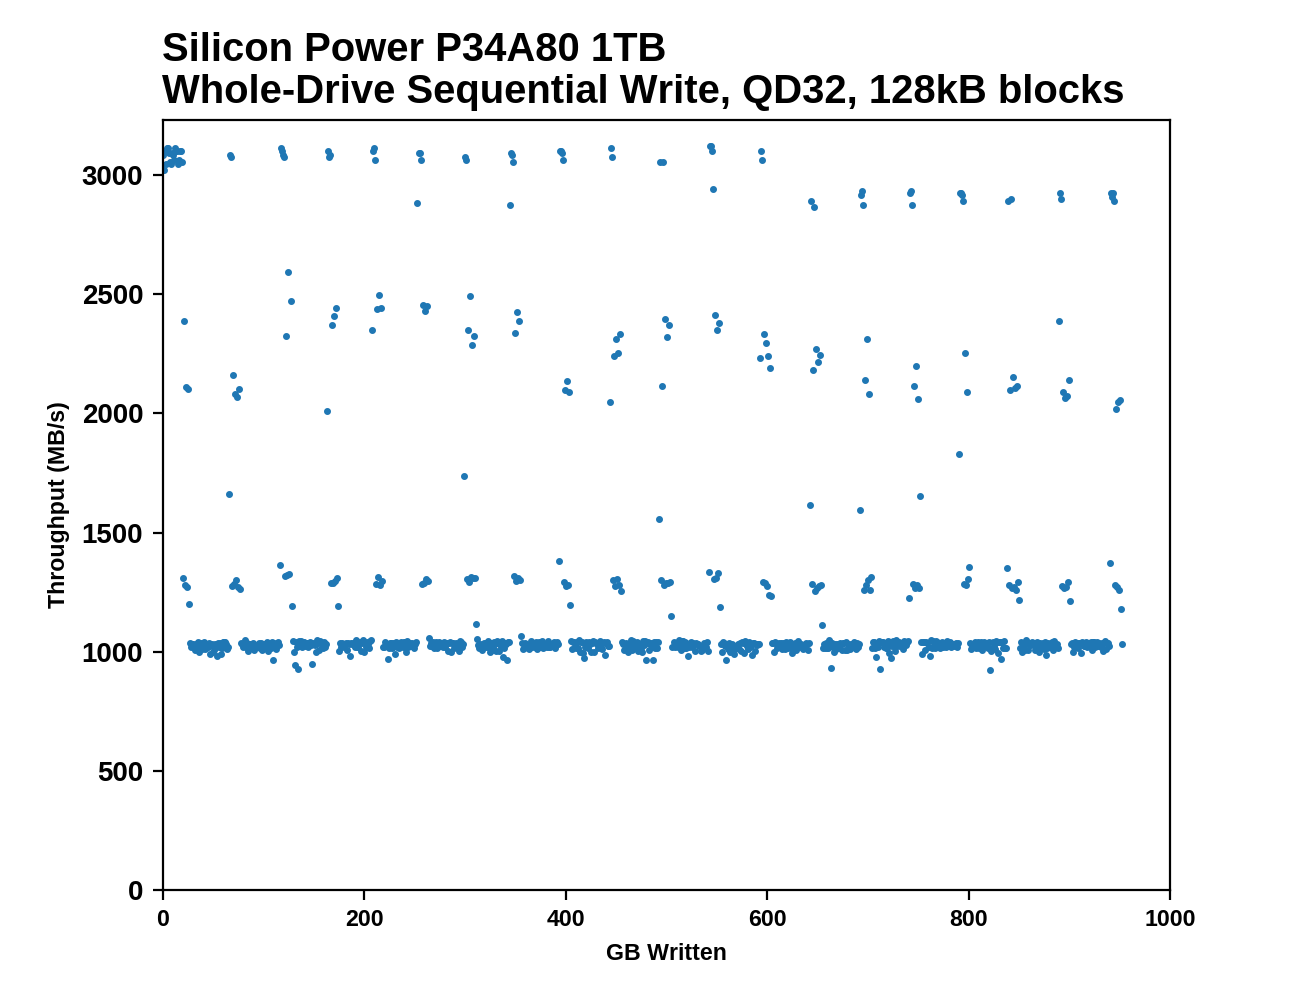
This test starts with a freshly-erased drive and fills it with 128kB sequential writes at queue depth 32, recording the write speed for each 1GB segment. This test is not representative of any ordinary client/consumer usage pattern, but it does allow us to observe transitions in the drive's behavior as it fills up. This can allow us to estimate the size of any SLC write cache, and get a sense for how much performance remains on the rare occasions where real-world usage keeps writing data after filling the cache.
 |
|||||||||
Like the Corsair MP510, the Silicon Power P34A80 only maintains SLC write speeds for only a short while before performance drops, and the baseline speed for both is around 1GB/s. The new firmware on the P34A80 differs markedly by showing much greater regularity in the garbage collection cycles and the associated spikes back up to SLC write speed.
 |
|||||||||
| Average Throughput for last 16 GB | Overall Average Throughput | ||||||||
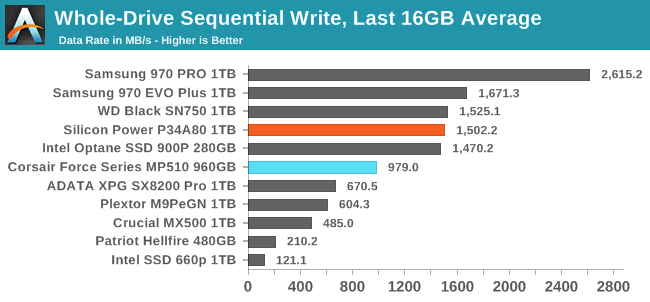
The P34A80 shows a much higher throughput at the end of the fill process than the Corsair MP510, because the new firmware happens to be in the midst of one of its short bursts of high-speed writes. The overall average throughput for the whole drive fill process is only slightly faster for the P34A80 than the Corsair MP510 with earlier firmware. Both Phison E12 products are still substantially slower on this test than the top TLC drives from WD and Samsung.
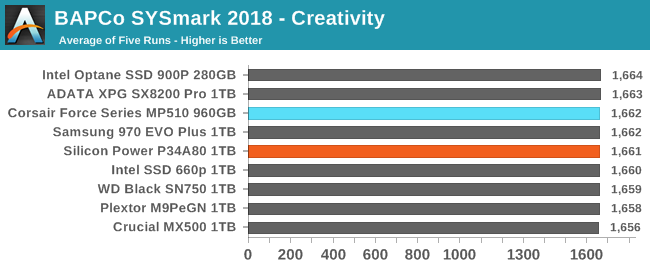
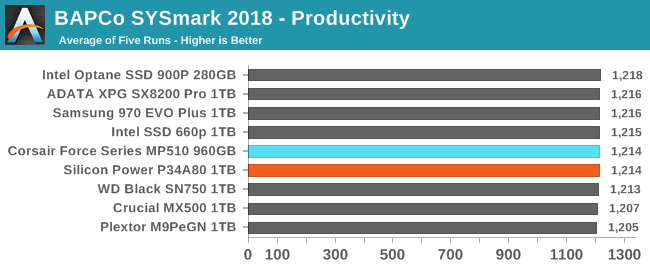
BAPCo SYSmark 2018
BAPCo's SYSmark 2018 is an application-based benchmark that uses real-world applications to replay usage patterns of business users, with subscores for productivity, creativity and responsiveness. Scores represnt overall system performance and are calibrated against a reference system that is defined to score 1000 in each of the scenarios. A score of, say, 2000, would imply that the system under test is twice as fast as the reference system.
SYSmark scores are based on total application response time as seen by the user, including not only storage latency but time spent by the processor. This means there's a limit to how much a storage improvement could possibly increase scores, because the SSD is only in use for a small fraction of the total test duration. This is a significant difference from our ATSB tests where only the storage portion of the workload is replicated and disk idle times are cut short to a maximum of 25ms.
| AnandTech SYSmark SSD Testbed | |
| CPU | Intel Core i5-7400 |
| Motherboard | ASUS PRIME Z270-A |
| Chipset | Intel Z270 |
| Memory | 2x 8GB Corsair Vengeance DDR4-2400 CL17 |
| Case | In Win C583 |
| Power Supply | Cooler Master G550M |
| OS | Windows 10 64-bit, version 1803 |
Our SSD testing with SYSmark uses a different test system than the rest of our SSD tests. This machine is set up to measure total system power consumption rather than just the drive's power.
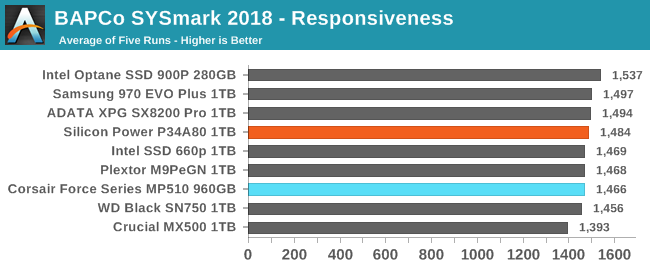
The Silicon Power P34A80 picks up several points on the Responsiveness test compared to the older Phison E12 firmware, but the difference is still extremely small and neither firmware version stands out from the rest of the NVMe competition.
Energy Usage
The SYSmark energy usage scores measure total system power consumption, excluding the display. Our SYSmark test system idles at around 26 W and peaks at over 60 W measured at the wall during the benchmark run. SATA SSDs seldom exceed 5 W and idle at a fraction of a watt, and the SSDs spend most of the test idle. This means the energy usage scores will inevitably be very close. A typical notebook system will tend to be better optimized for power efficiency than this desktop system, so the SSD would account for a much larger portion of the total and the score difference between SSDs would be more noticeable.
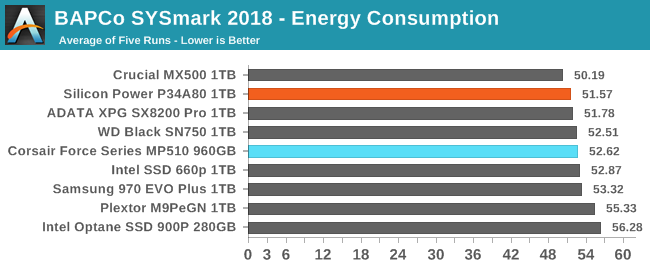
The P34A80 shaves about 2% off the energy used by the Corsair MP510 with earlier firmware. This is a small improvement, but enough to move the Phison E12 from the middle of the pack to being in the lead among NVMe drives for power efficiency on SYSmark 2018.
AnandTech Storage Bench - The Destroyer
The Destroyer is an extremely long test replicating the access patterns of very IO-intensive desktop usage. A detailed breakdown can be found in this article. Like real-world usage, the drives do get the occasional break that allows for some background garbage collection and flushing caches, but those idle times are limited to 25ms so that it doesn't take all week to run the test. These AnandTech Storage Bench (ATSB) tests do not involve running the actual applications that generated the workloads, so the scores are relatively insensitive to changes in CPU performance and RAM from our new testbed, but the jump to a newer version of Windows and the newer storage drivers can have an impact.
We quantify performance on this test by reporting the drive's average data throughput, the average latency of the I/O operations, and the total energy used by the drive over the course of the test.
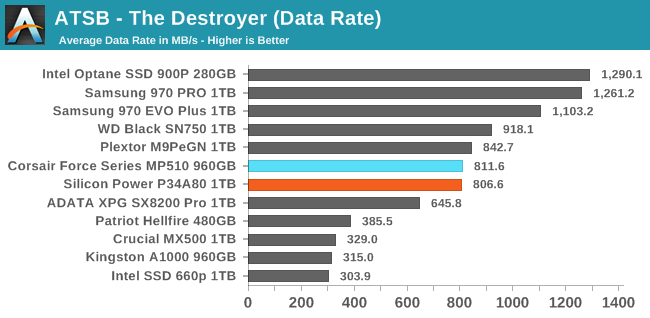
The Silicon Power P34A80 is insignificantly slower on The Destroyer than the earlier Phison E12-based drive. Both still rank as slightly slower than other high-end drives that use the same Toshiba/SanDisk 3D TLC, and significantly slower than the fastest TLC-based drives. However, the Phison E12 handles The Destroyer better than the Silicon Motion SM2262EN and offers more than twice the overall performance of the entry-level NVMe drives or Phison's first attempt at a high-end NVMe controller.
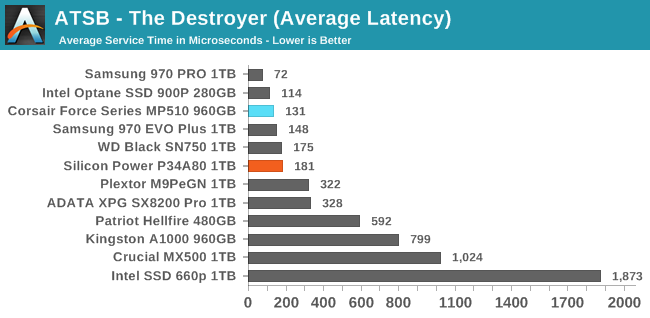
Average and 99th percentile latencies on The Destroyer have both regressed slightly with the newer Phison E12 firmware used by the P34A80, but it is still clearly delivering performance that places it in the top tier of high-end NVMe drives.
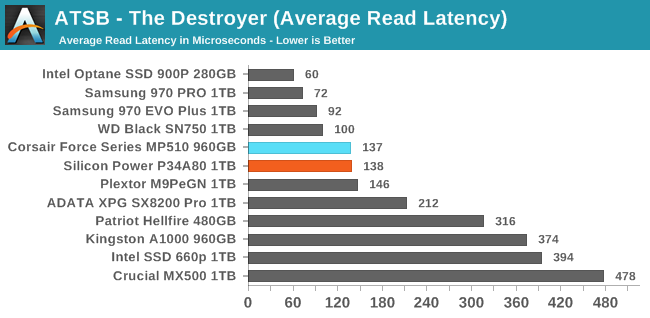
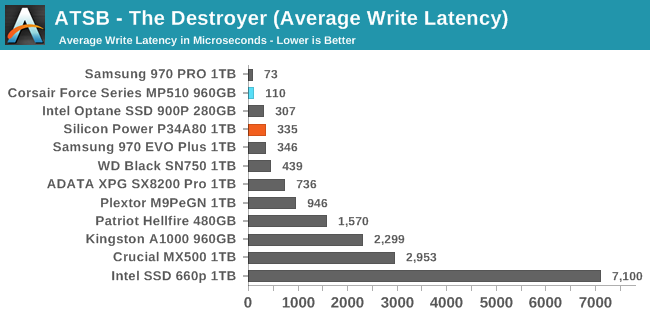
The average read latency on The Destroyer is unchanged by the new Phison E12 firmware, but the average write latency is no longer a stand-out winner. Instead, the P34A80's average write latency is merely on par with the other top NVMe drives on the market.
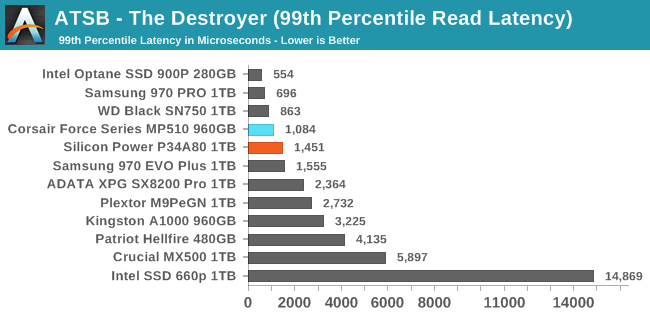
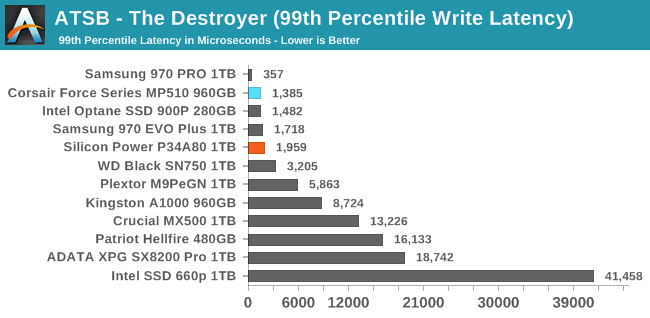
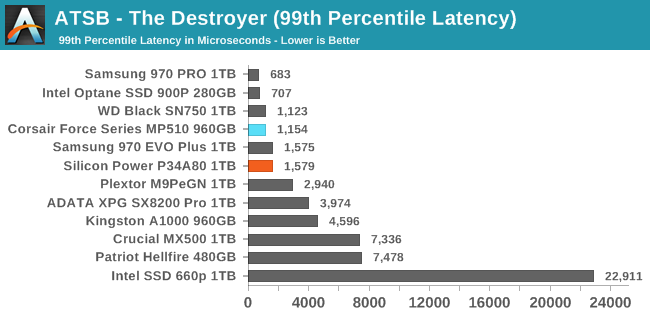
The 99th percentile read and write latency scores for the P34A80 are both worse than those from the Corsair MP510, but not by enough to knock the P34A80 out of the top tier of drives.
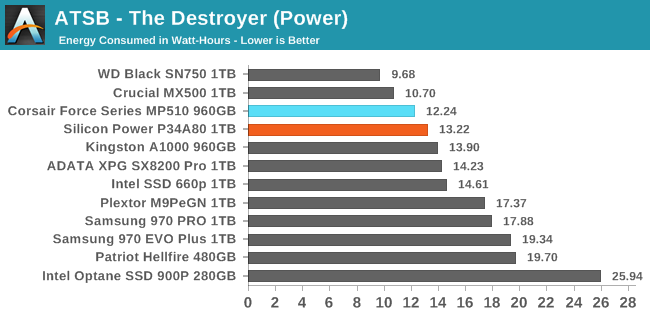
The energy consumed by the P34A80 over the course of The Destroyer is slightly more than that used by the Corsair MP510, but both are more efficient than most NVMe SSDs.
AnandTech Storage Bench - Heavy
Our Heavy storage benchmark is proportionally more write-heavy than The Destroyer, but much shorter overall. The total writes in the Heavy test aren't enough to fill the drive, so performance never drops down to steady state. This test is far more representative of a power user's day to day usage, and is heavily influenced by the drive's peak performance. The Heavy workload test details can be found here. This test is run twice, once on a freshly erased drive and once after filling the drive with sequential writes.
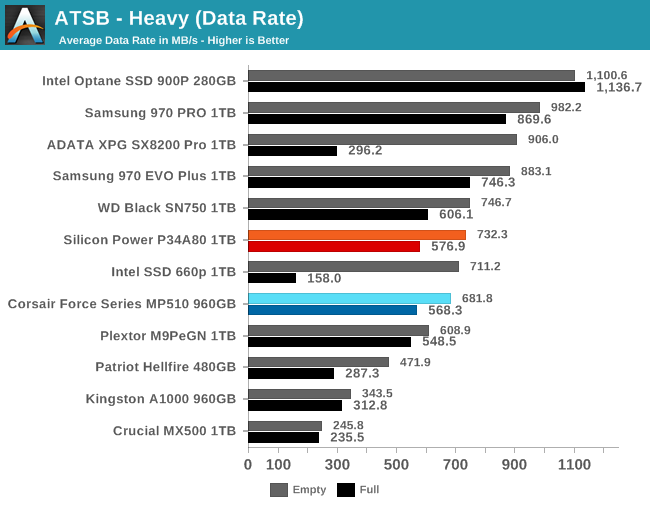
The Silicon Power P34A80 is slightly faster overall than the Corsair MP510 with the older Phison E12 firmware, both when the Heavy test is run on an empty drive and a full drive. The improvement in full-drive performance is smaller but more significant given that the P34A80 has a larger usable capacity and thus smaller spare area to work with.
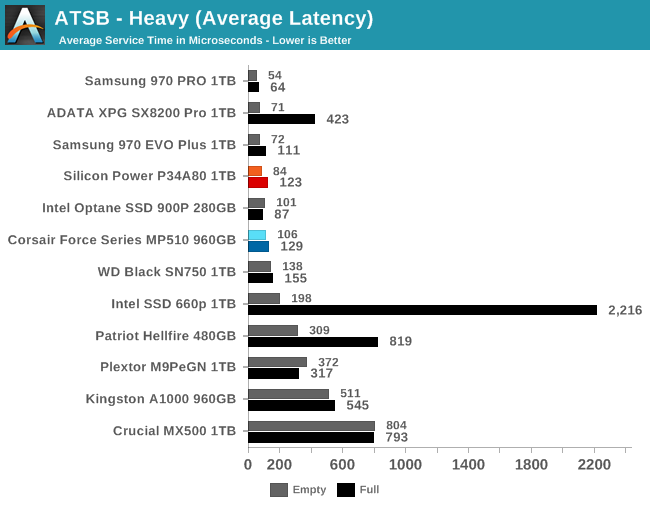
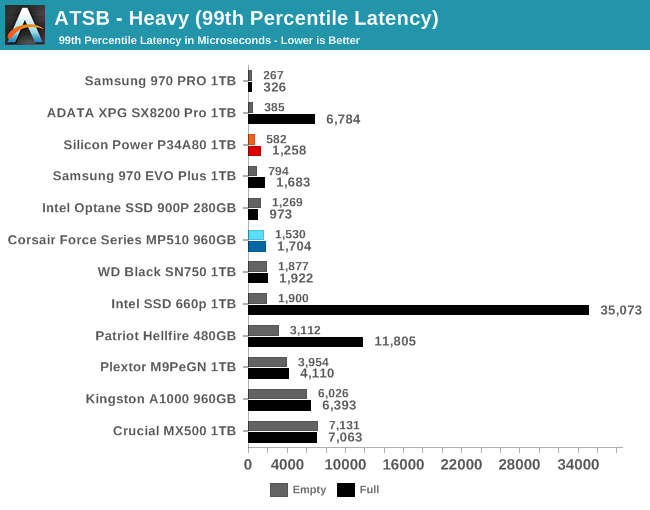
The average and 99th percentile latency scores for the P34A80 are better than the Corsair MP510 and competitive with the fastest TLC-based SSDs.
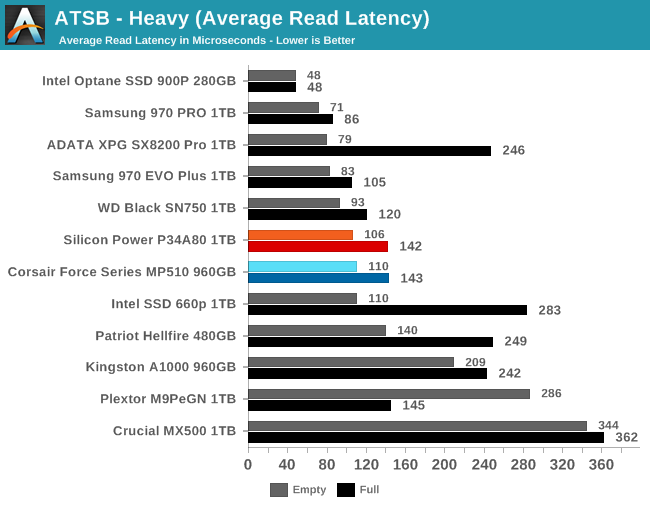
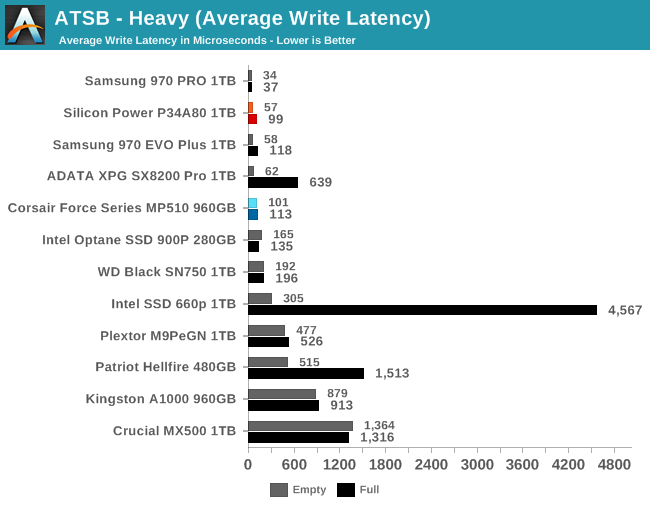
The average read latency from the P34A80 is about the same as from the Corsair MP510, and slightly slower than the fastest TLC-based SSDs. The average write latency is better for the P34A80 than any other TLC SSD.
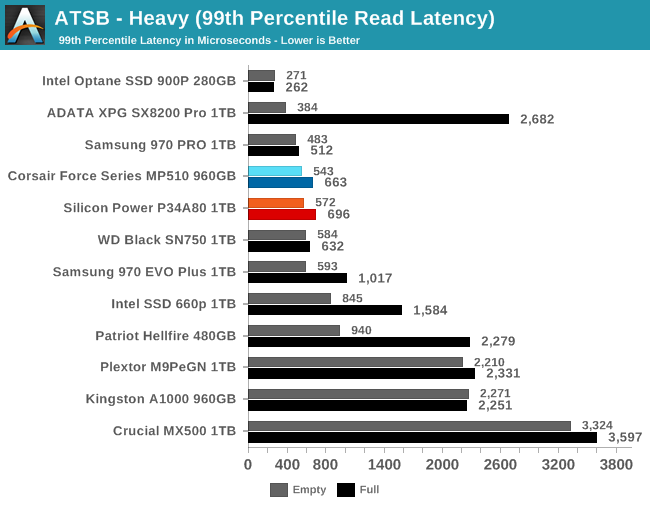
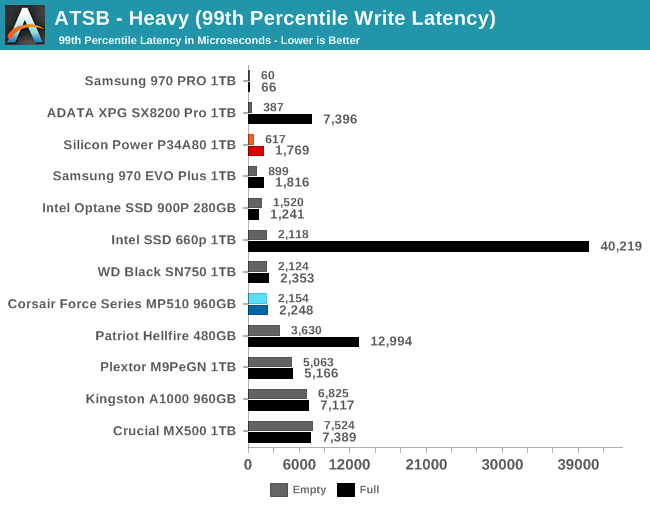
The 99th percentile read and write latency scores for the P34A80 are very similar to the average latency scores: read performance is essentially unchanged from the older firmware, but write latency is better, especially when the test is run on an empty drive.
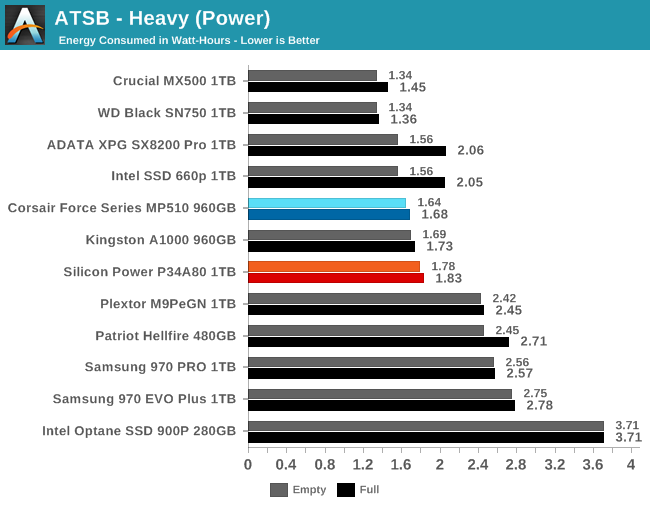
The P34A80 is again a bit less efficient than the Corsair MP510 with slightly higher energy consumption over the course of the Heavy test, but the P34A80 is still clearly in the more efficient tier of drives.
AnandTech Storage Bench - Light
Our Light storage test has relatively more sequential accesses and lower queue depths than The Destroyer or the Heavy test, and it's by far the shortest test overall. It's based largely on applications that aren't highly dependent on storage performance, so this is a test more of application launch times and file load times. This test can be seen as the sum of all the little delays in daily usage, but with the idle times trimmed to 25ms it takes less than half an hour to run. Details of the Light test can be found here. As with the ATSB Heavy test, this test is run with the drive both freshly erased and empty, and after filling the drive with sequential writes.
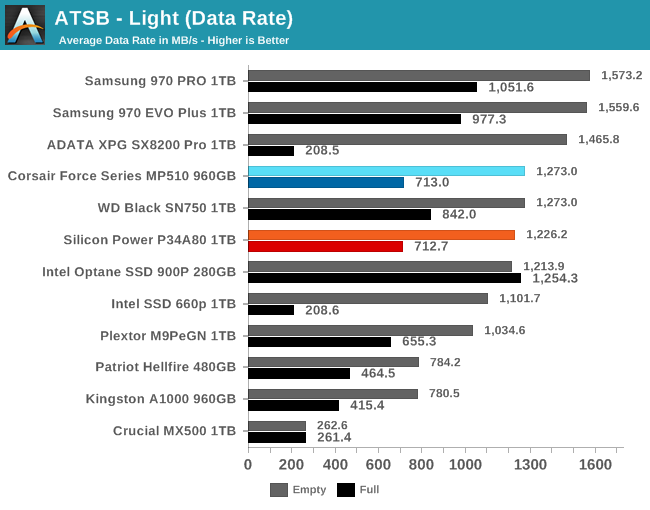
The Silicon Power P34A80's newer firmware brings a slight performance regression on the Light test compared to the older Phison E12 firmware present on the Corsair MP510, but both drives are still in the second tier of performance. The performance when running the Light test on a full drive is lower than for most other high-end NVMe SSDs, but not crippled as for the ADATA SX8200 Pro and other SM2262EN drives.
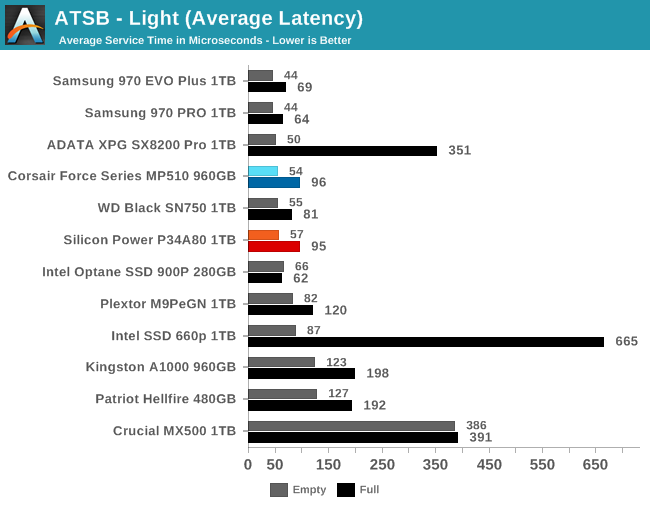
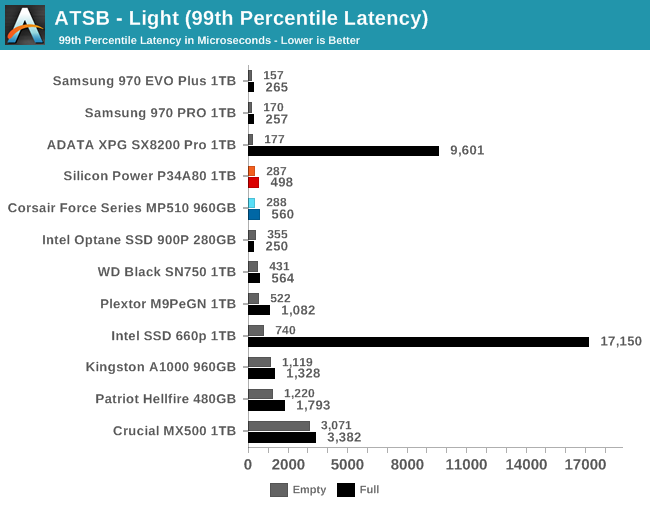
The average and 99th percentile latency scores from the P34A80 on the Light test are excellent, with slightly larger disparities between full and empty drive performance than the top drives show, but no evidence of noticeable performance problems.
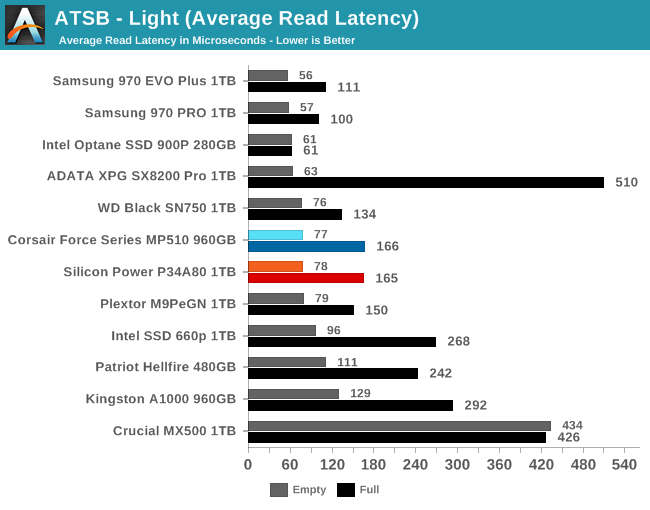
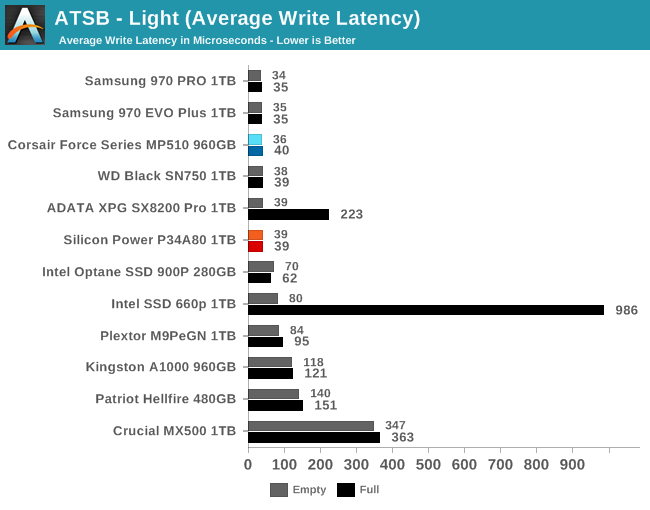
The average write latencies for the P34A80 are a few microseconds slower than for the fastest drives, but it still appears that almost all writes during the Light test land in the SLC cache and are unhindered by other operations in the drive's queue. The average read latencies are slightly slower than the top drives like the Samsung 970 EVO Plus, but the difference is imperceptible.
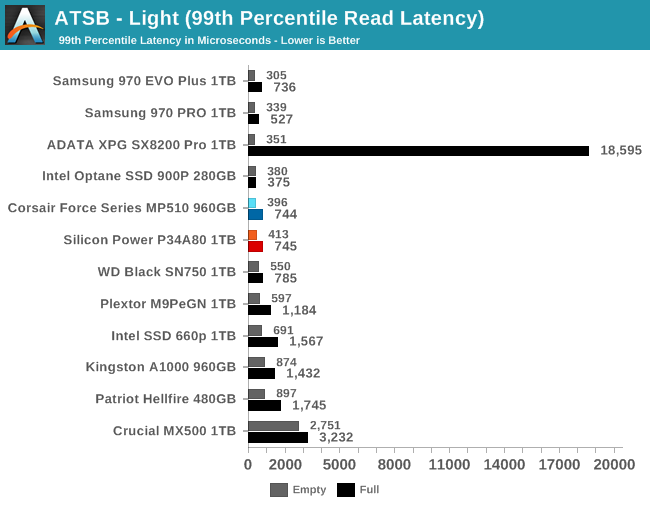
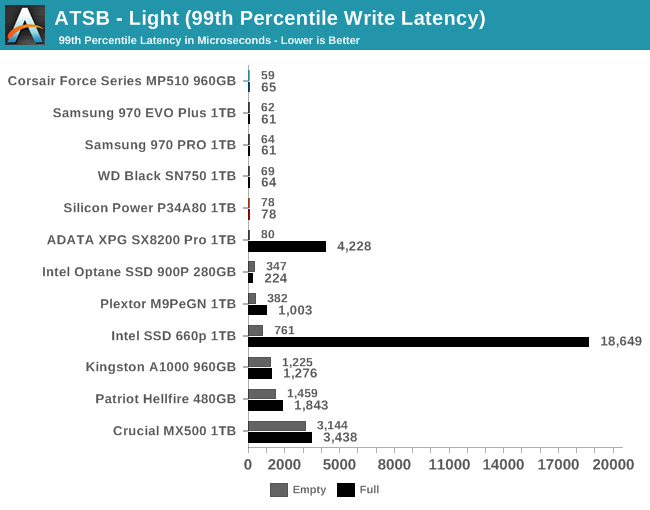
The 99th percentile read and write latencies for the P34A80 on the Light test are excellent. A few of the scores are numerically worse than the Corsair MP510 scored, but the differences are small enough to be insignificant.
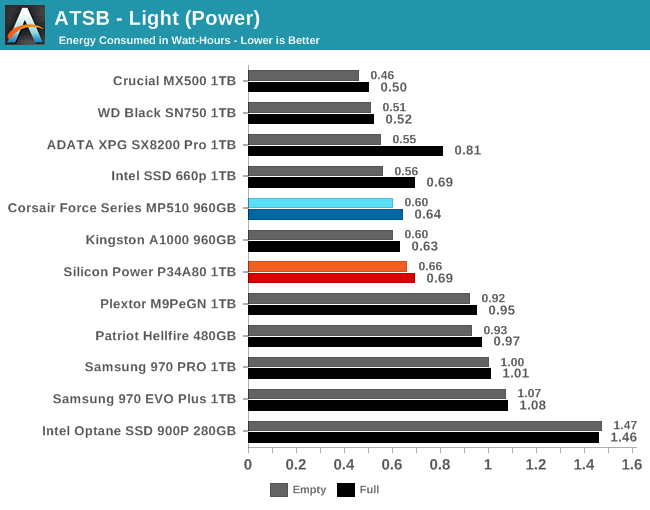
The P34A80 once again requires a bit more energy than the Corsair MP510, but both Phison E12 drives are clearly more efficient under load than Samsung's drives or the older Phison E7 drive.
Random Read Performance
Our first test of random read performance uses very short bursts of operations issued one at a time with no queuing. The drives are given enough idle time between bursts to yield an overall duty cycle of 20%, so thermal throttling is impossible. Each burst consists of a total of 32MB of 4kB random reads, from a 16GB span of the disk. The total data read is 1GB.
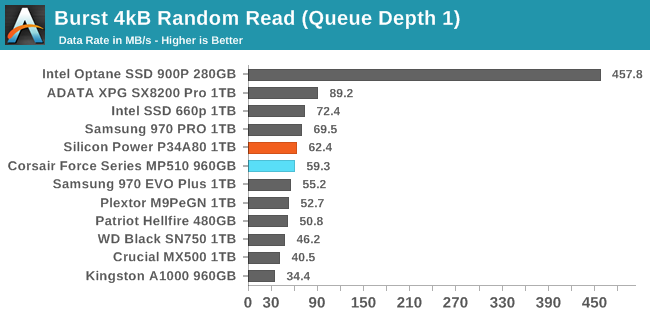
The QD1 burst random read performance of the Silicon Power P34A80 is slightly faster than the Corsair MP510 with older firmware. This is a new record for Toshiba/SanDisk 3D NAND, but it still falls well short of the random read performance we've been seeing lately from the combination of Intel/Micron NAND and Silicon Motion NVMe controllers.
Our sustained random read performance is similar to the random read test from our 2015 test suite: queue depths from 1 to 32 are tested, and the average performance and power efficiency across QD1, QD2 and QD4 are reported as the primary scores. Each queue depth is tested for one minute or 32GB of data transferred, whichever is shorter. After each queue depth is tested, the drive is given up to one minute to cool off so that the higher queue depths are unlikely to be affected by accumulated heat build-up. The individual read operations are again 4kB, and cover a 64GB span of the drive.
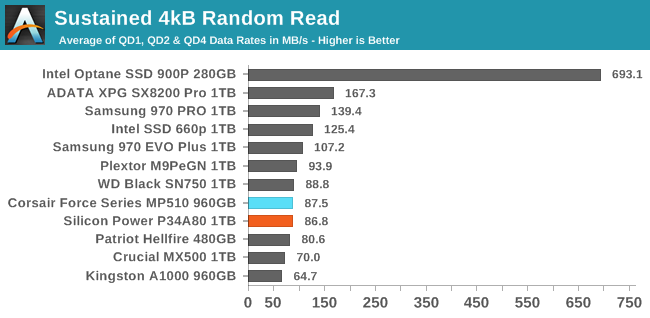
Adding in some higher queue depths doesn't help the P34A80 much: like the Corsair MP510 with older firmware, it ends up being one of the slowest high-end NVMe drives for random reads, only slightly faster than the Phison E7-based Patriot Hellfire.
 |
|||||||||
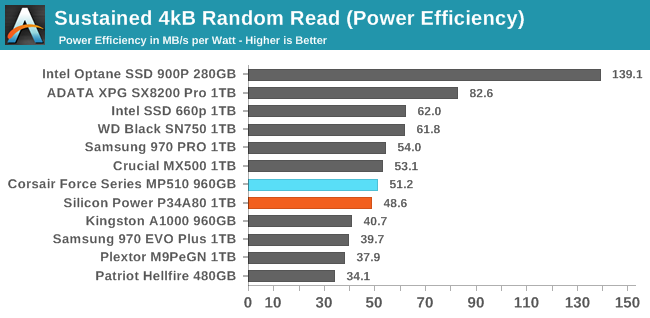
| Power Efficiency in MB/s/W | Average Power in W | ||||||||
The P34A80 uses slightly more power than the Corsair MP510 on the random read test, so it ends up with a lower efficiency score that is still reasonable and better than several other high-end NVMe drives.
 |
|||||||||
At mid to high queue depths, the WD Black SN 750 takes a clear lead among drives using the same Toshiba/SanDisk 3D NAND as the P34A80, and the WD Black's lower power consumption across the board emphasizes that there's room for improvement over the Phison E12, and that firmware tweaks aren't enough to close the gap.
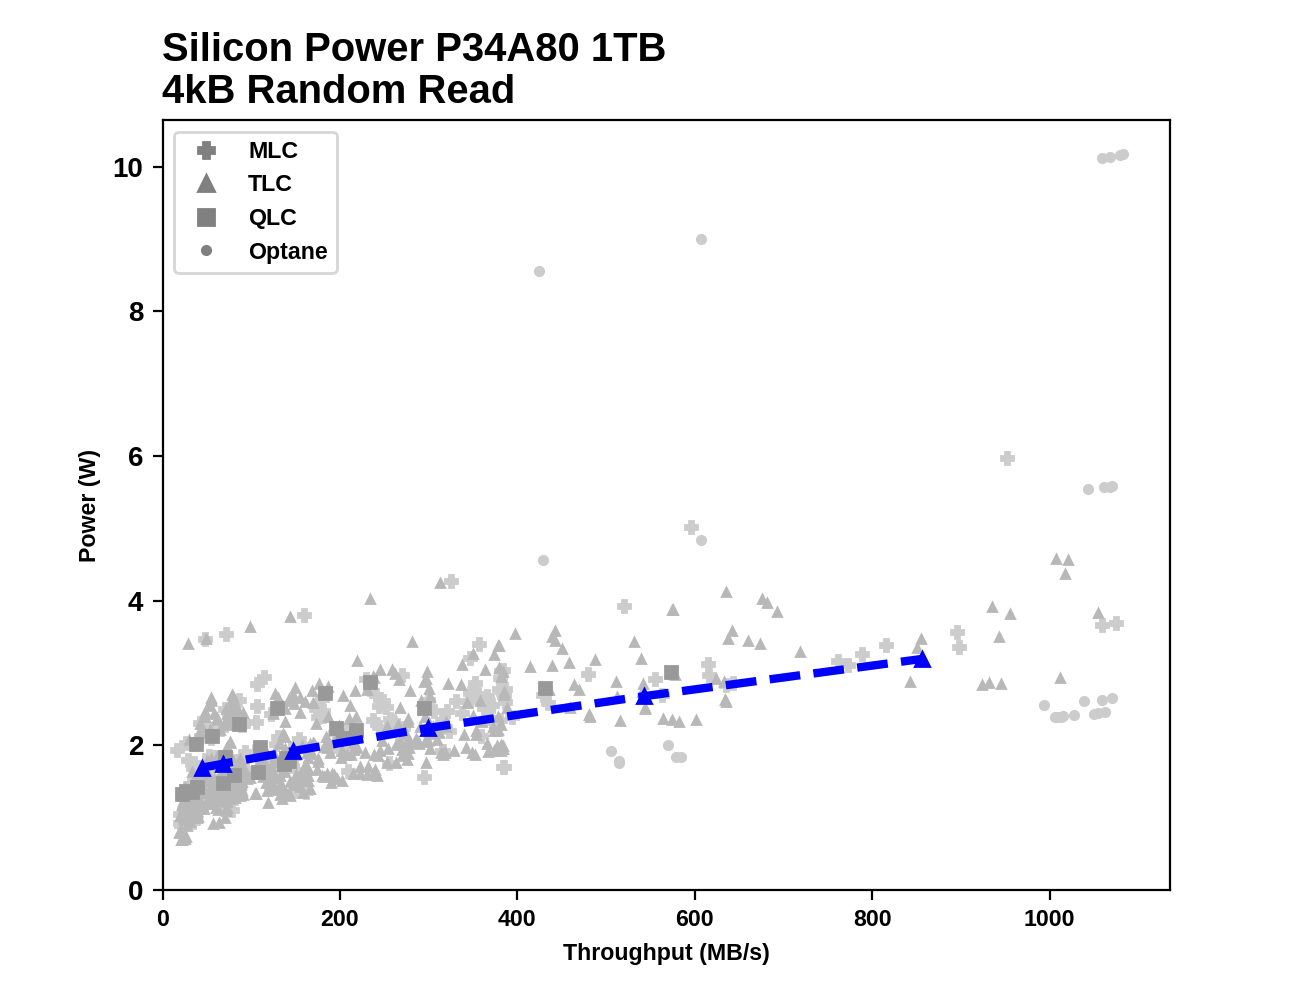
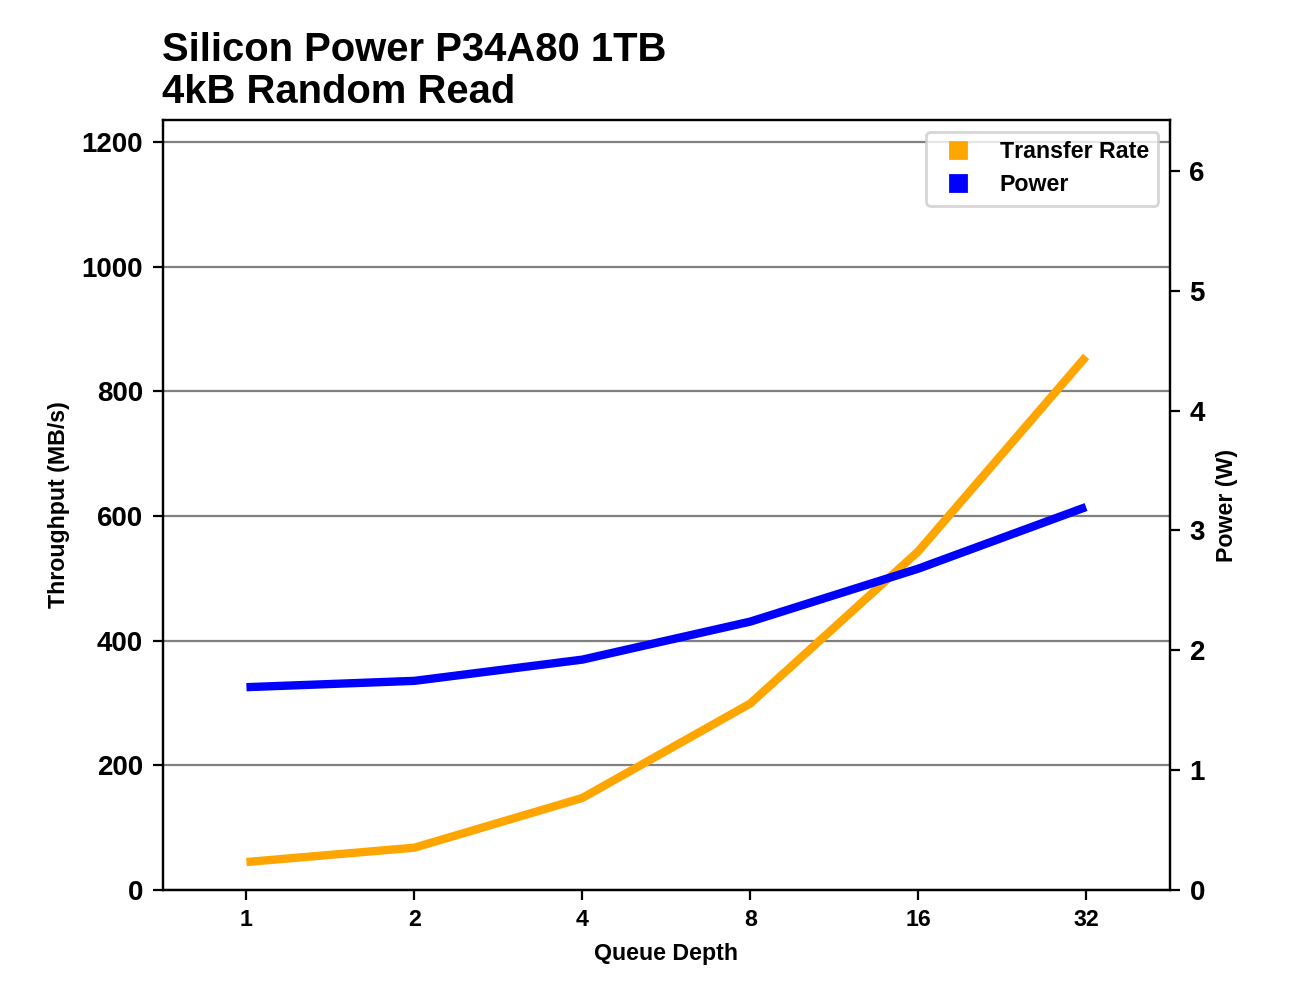
Comparing the P34A80 against the rest of the consumer SSDs that have completed this test, the power efficiency during random reads is fairly middle of the road across the entire range of queue depths, and it is clear that there are quite a few options providing higher peak performance even from TLC NAND.
Random Write Performance
Our test of random write burst performance is structured similarly to the random read burst test, but each burst is only 4MB and the total test length is 128MB. The 4kB random write operations are distributed over a 16GB span of the drive, and the operations are issued one at a time with no queuing.
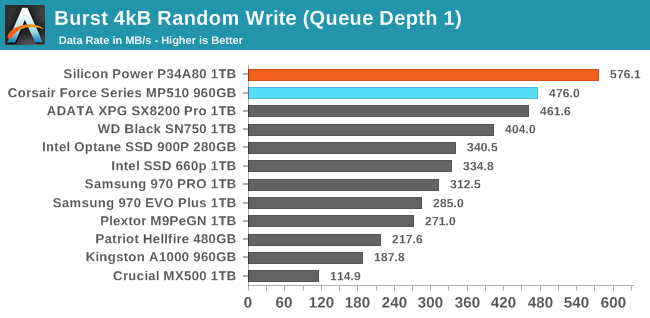
The Silicon Power P34A80 delivers a substantial 21% improvement in QD1 burst random write performance, which the Phison E12 already held the record for. With this new firmware, Phison now clearly has the fastest SLC write cache.
As with the sustained random read test, our sustained 4kB random write test runs for up to one minute or 32GB per queue depth, covering a 64GB span of the drive and giving the drive up to 1 minute of idle time between queue depths to allow for write caches to be flushed and for the drive to cool down.
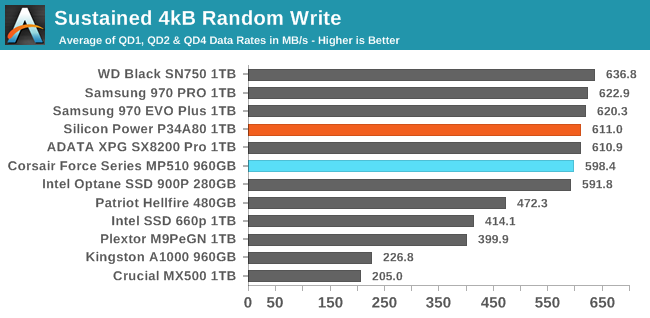
When higher queue depths and longer test durations are thrown in, the competition is much closer among top tier drives. The P34A80 is still faster than the Corsair MP510 with older firmware, but both are outperformed by drives from Samsung and WD.
 |
|||||||||
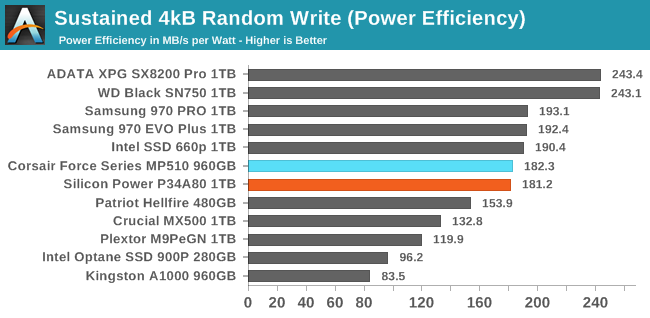
| Power Efficiency in MB/s/W | Average Power in W | ||||||||
By a narrow margin, the P34A80 has the highest power draw among the flash-based SSDs in this batch, so its efficiency score on this test is a bit lower than most other high-end NVMe SSDs. The WD Black SN750 and ADATA SX8200 Pro stand out with considerably better efficiency, while the Samsung drives only score slightly better than the Phison E12 drives.
 |
|||||||||
The random write performance of the P34A80 starts out with excellent performance for QD1, then peaks at QD4 and drops slightly thereafter, but is generally steady and remains fast through the rest of the test.
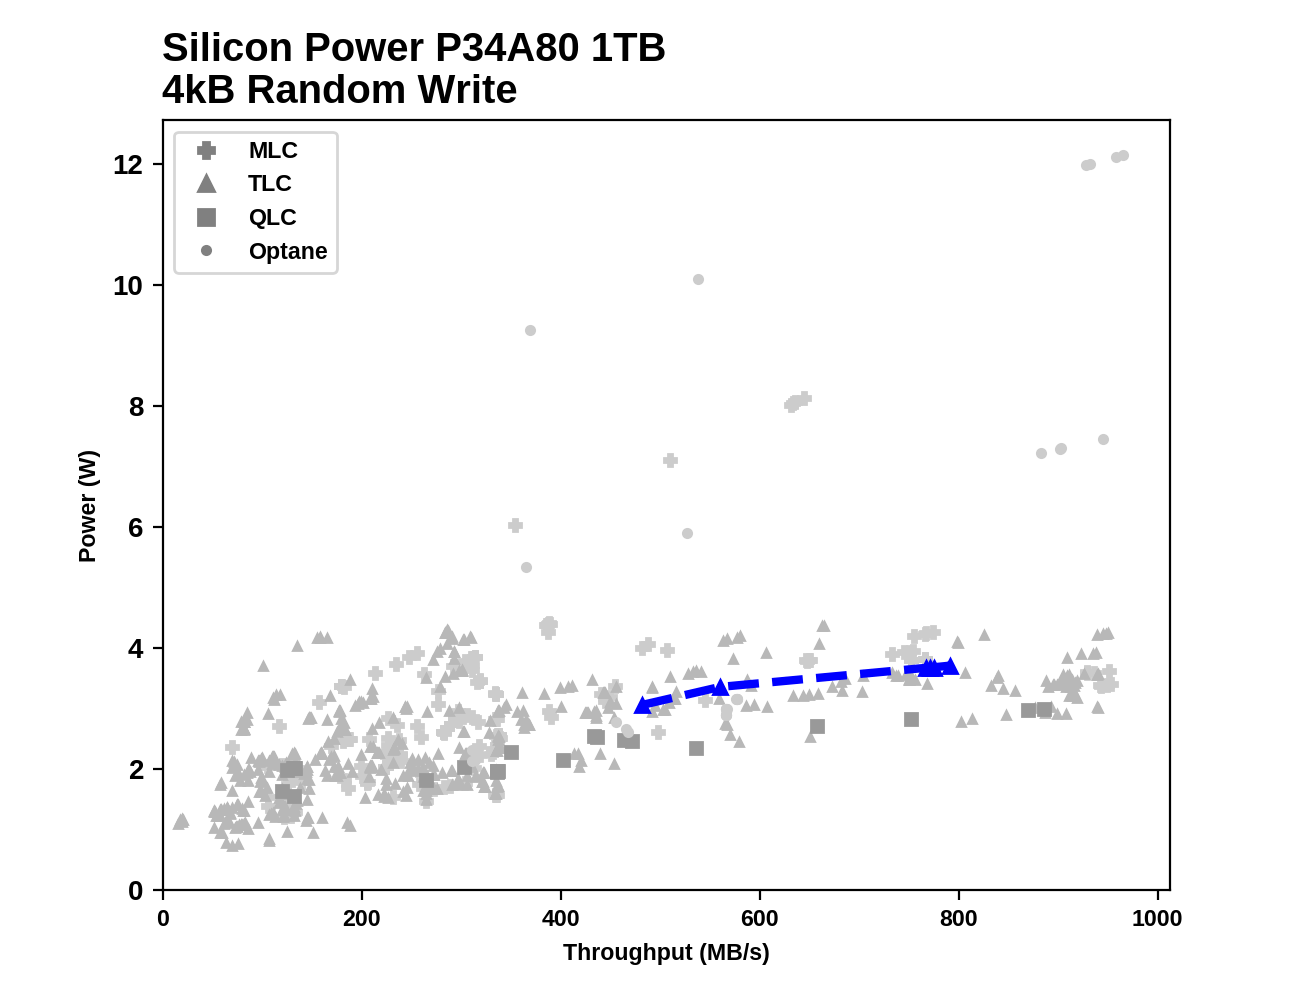
When viewed against the results for all the drives that have completed this test, the performance of the P34A80 at high queue depths is substantially slower than most high-end drives, and the power draw is higher as well.
Sequential Read Performance
Our first test of sequential read performance uses short bursts of 128MB, issued as 128kB operations with no queuing. The test averages performance across eight bursts for a total of 1GB of data transferred from a drive containing 16GB of data. Between each burst the drive is given enough idle time to keep the overall duty cycle at 20%.
(burst)
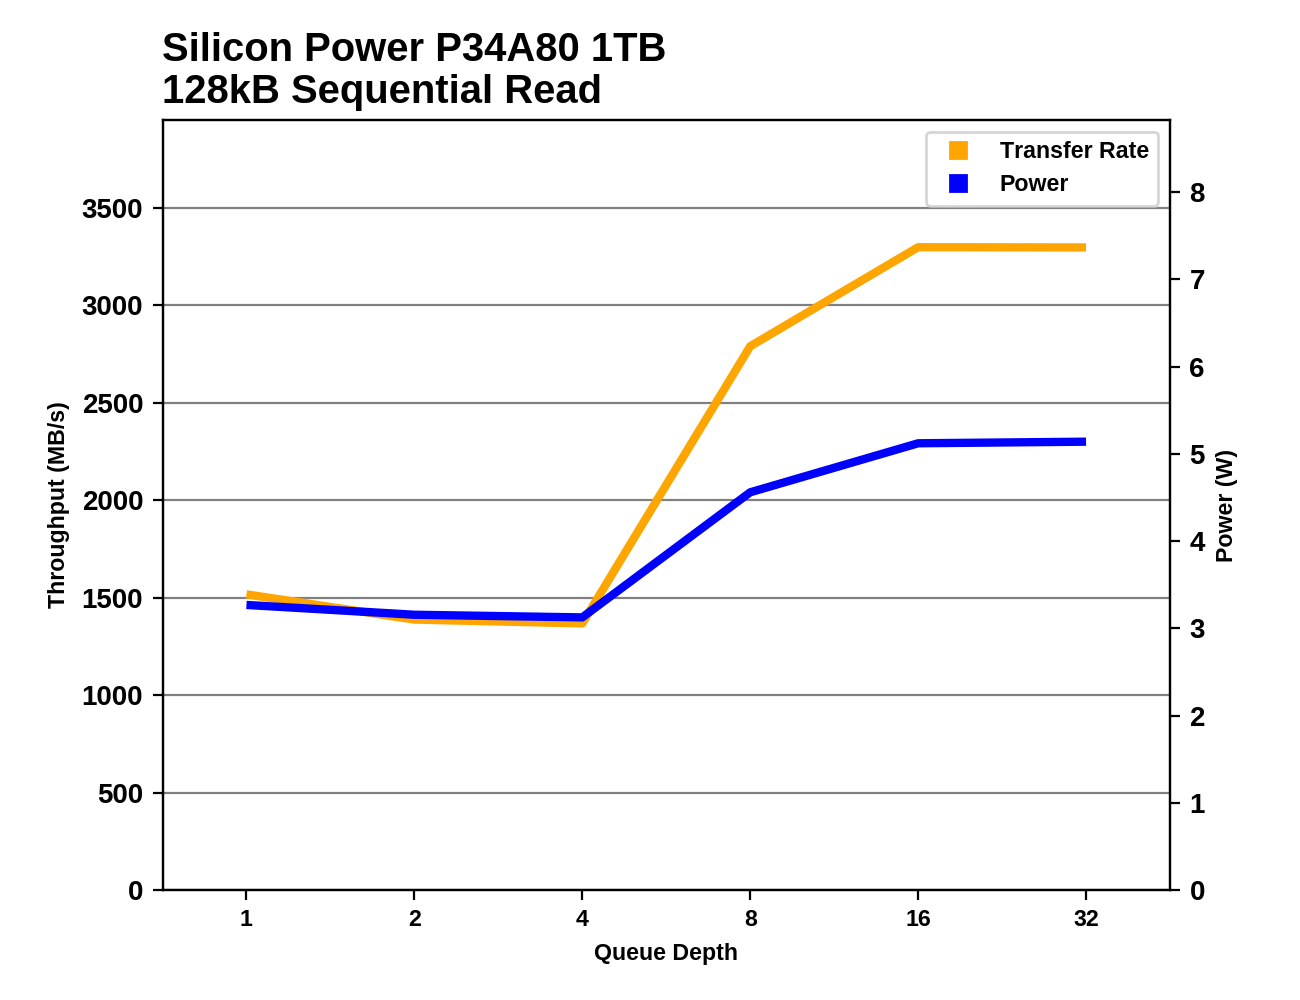
Our test of sustained sequential reads uses queue depths from 1 to 32, with the performance and power scores computed as the average of QD1, QD2 and QD4. Each queue depth is tested for up to one minute or 32GB transferred, from a drive containing 64GB of data. This test is run twice: once with the drive prepared by sequentially writing the test data, and again after the random write test has mixed things up, causing fragmentation inside the SSD that isn't visible to the OS. These two scores represent the two extremes of how the drive would perform under real-world usage, where wear leveling and modifications to some existing data will create some internal fragmentation that degrades performance, but usually not to the extent shown here.
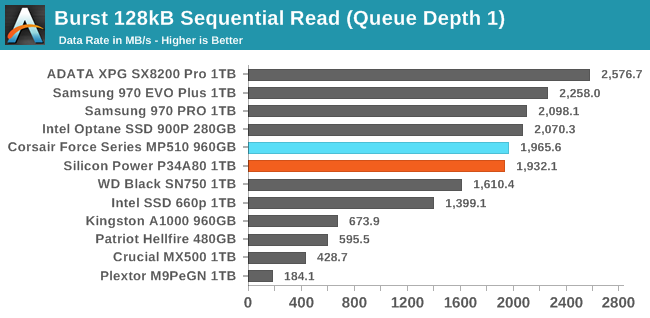
The Silicon Power P34A80 is very slightly slower than the Corsair MP510 on the burst sequential read test, but still performs adequately for a high-end NVMe drive with just shy of 2GB/s at QD1.
 |
|||||||||
| Power Efficiency in MB/s/W | Average Power in W | ||||||||
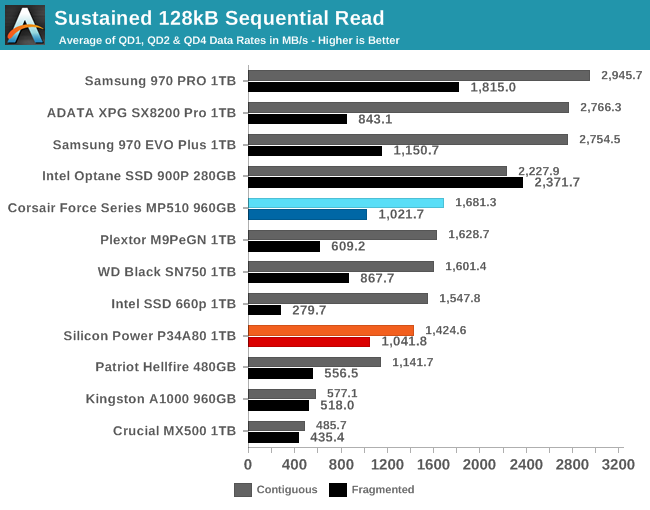
On the longer sequential read test that brings in some higher queue depths, the P34A80's regression relative to the Corsair MP510 with older firmware is a bit larger, and some entry-level NVMe drives like the QLC-based Intel 660p are able to offer similar performance. But the Phison E12 drives still offer quite good performance for sequential reads of data that was not written sequentially and may be fragmented within the SSD itself.
 |
|||||||||
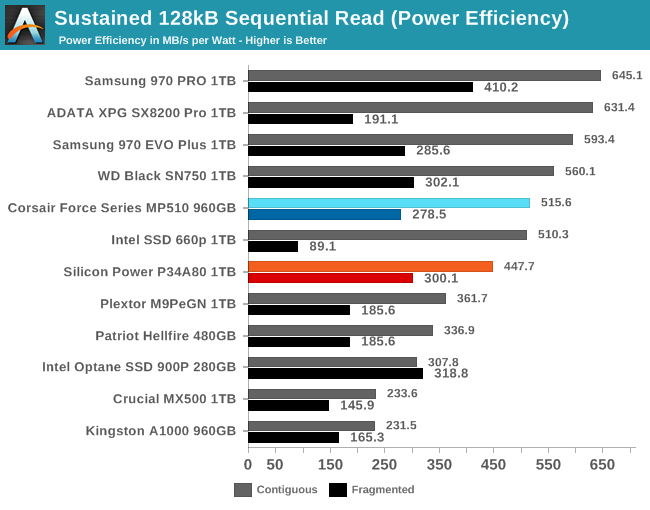
The power efficiency of the P34A80 during the sequential read test is a step down from what the Corsair MP510 offers, but is still as good or better than a typical SATA drive.
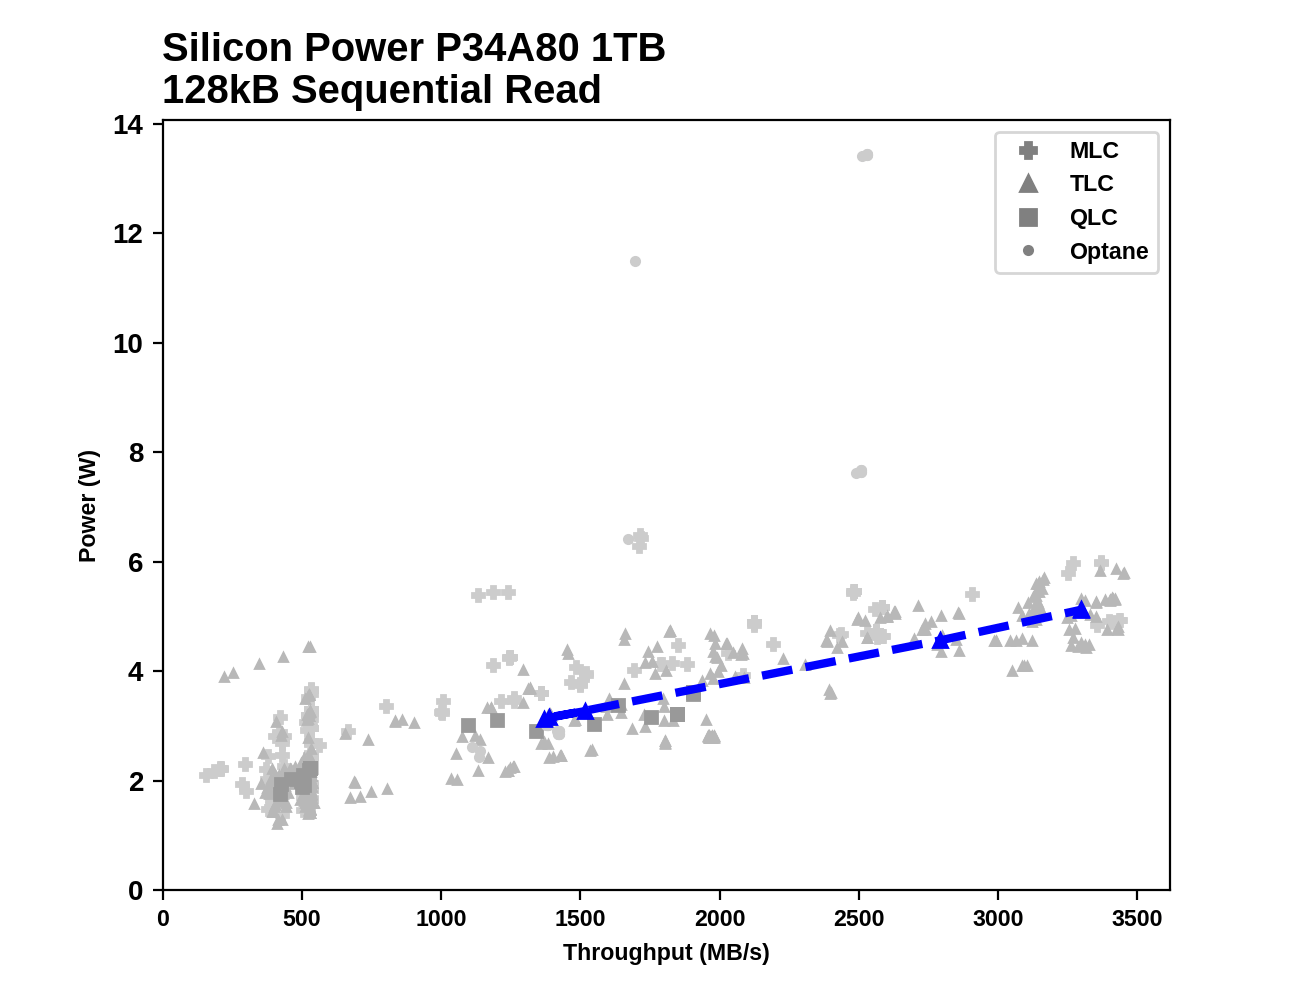
The performance and power consumption of the P34A80 on the sequential read test don't set it apart from the crowd: at high queue depths it offers similar performance to many other competitors with average power consumption, and at lower queue depths its efficiency is also fairly typical.
Sequential Write Performance
Our test of sequential write burst performance is structured identically to the sequential read burst performance test save for the direction of the data transfer. Each burst writes 128MB as 128kB operations issued at QD1, for a total of 1GB of data written to a drive containing 16GB of data.
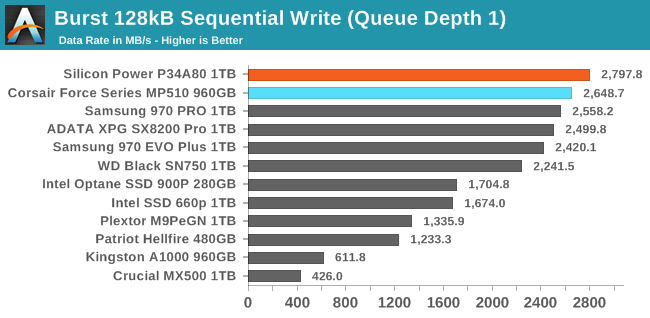
The Silicon Power P34A80 slightly improves on the already excellent burst sequential write performance that the Phison E12 offered in the Corsair MP510. As with random writes, it appears that the E12 controller has the fastest SLC write cache currently available.
Our test of sustained sequential writes is structured identically to our sustained sequential read test, save for the direction of the data transfers. Queue depths range from 1 to 32 and each queue depth is tested for up to one minute or 32GB, followed by up to one minute of idle time for the drive to cool off and perform garbage collection. The test is confined to a 64GB span of the drive.
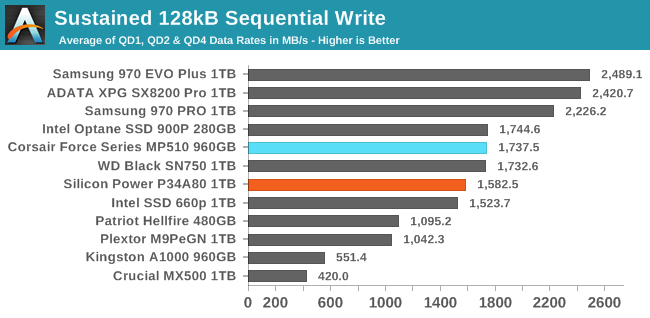
When some higher queue depths and longer test durations are considered, the P34A80 no longer impresses, and is actually slightly slower than the Corsair MP510, while the top tier is comprised of Samsung and Silicon Motion-based drives.
 |
|||||||||
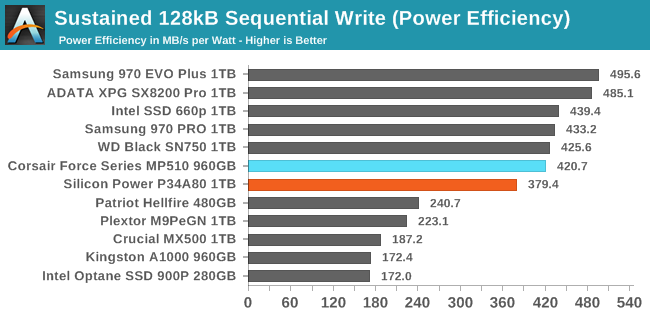
| Power Efficiency in MB/s/W | Average Power in W | ||||||||
The power efficiency of the P34A80 is also a bit worse than the Corsair MP510, but still pretty close to the current standard for high-end NVMe SSDs and significantly better than SATA drives or many entry-level NVMe drives.
 |
|||||||||
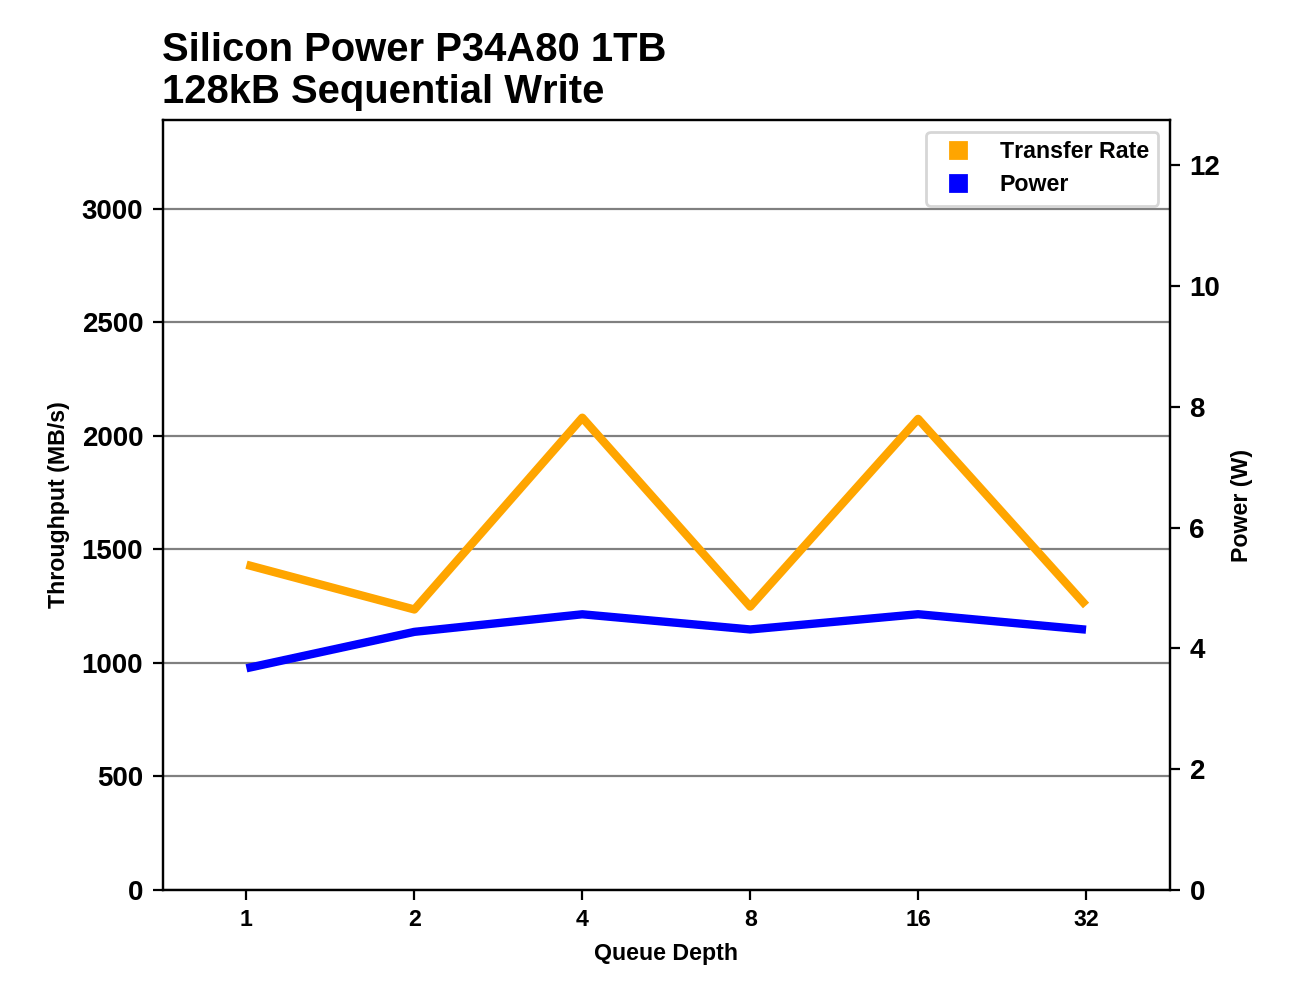
The Silicon Power P34A80's performance oscillates over the course of the sequential write test, as the SLC cache is inadequately sized to handle the 32GB per queue depth this test writes. The Corsair MP510 behaves similarly, while the rest of the drives in this batch have more consistent performance even when they are a bit slower than the Phison E12 drives.
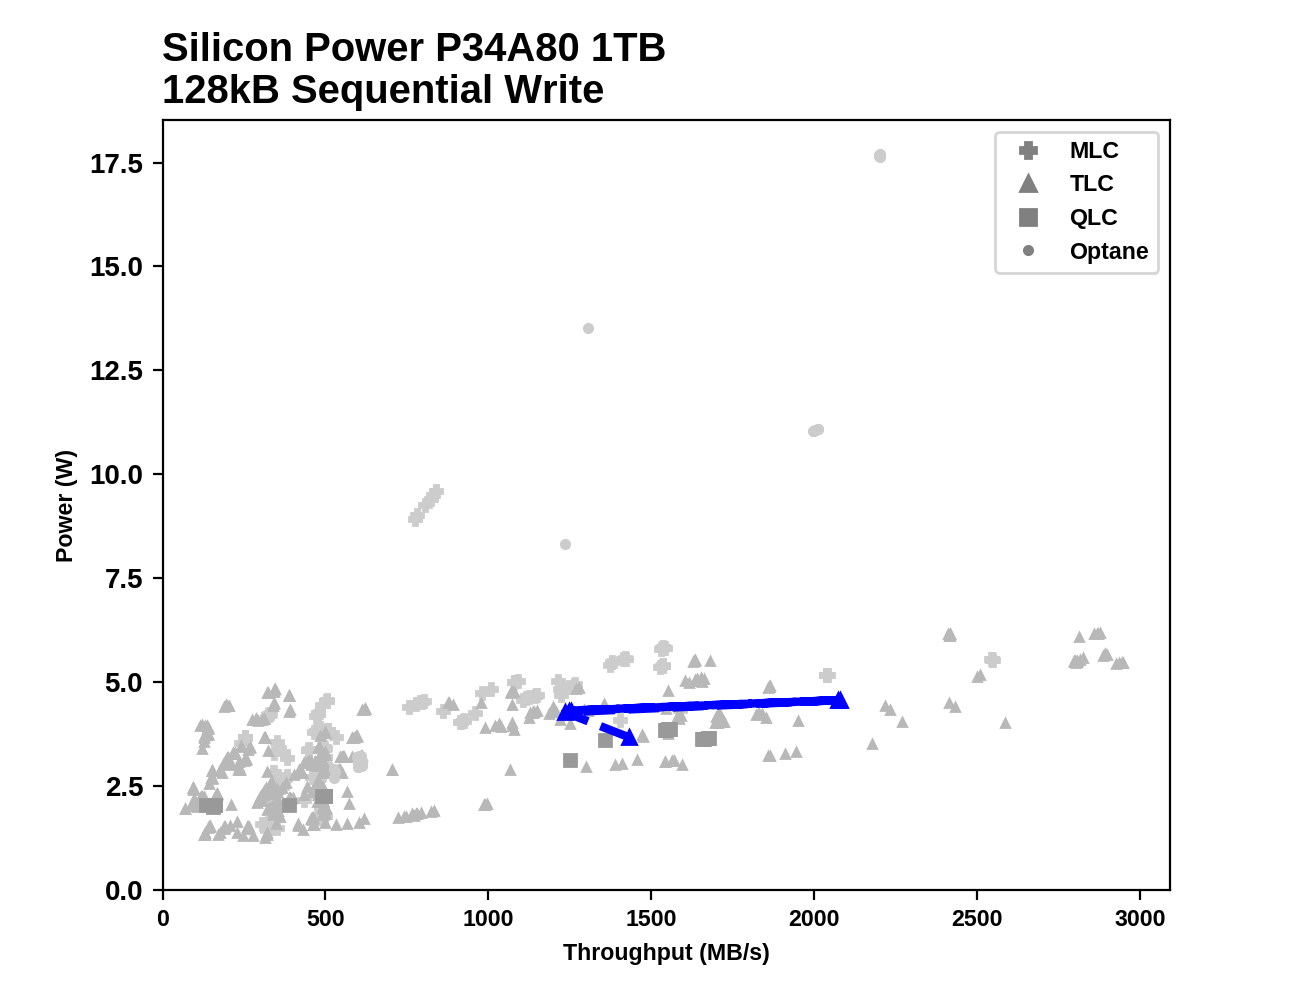
The P34A80 never hits particularly high sequential write speeds during this test, but at least the performance hit of filling its SLC cache doesn't hurt power efficiency much. It's certainly not the most efficient NVMe drive for sequential writes, but its power consumption isn't atypically high.
Mixed Random Performance
Our test of mixed random reads and writes covers mixes varying from pure reads to pure writes at 10% increments. Each mix is tested for up to 1 minute or 32GB of data transferred. The test is conducted with a queue depth of 4, and is limited to a 64GB span of the drive. In between each mix, the drive is given idle time of up to one minute so that the overall duty cycle is 50%.
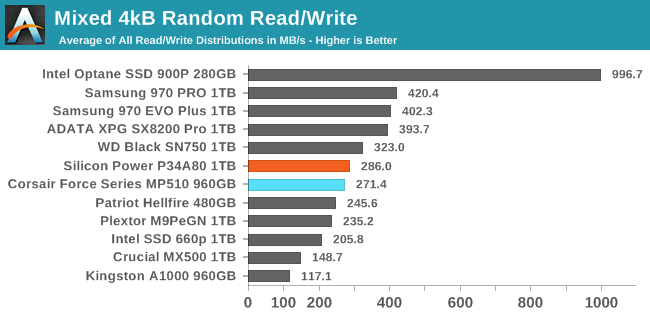
The Silicon Power P34A80 has slightly better performance on the mixed random IO test than the Corsair MP510 with earlier firmware, but the overall standing for the Phison E12 drives hasn't changed: they're still slower than most of the other high-end NVMe drives, but clearly outperform the entry-level NVMe drives and SATA drives.
 |
|||||||||
| Power Efficiency in MB/s/W | Average Power in W | ||||||||
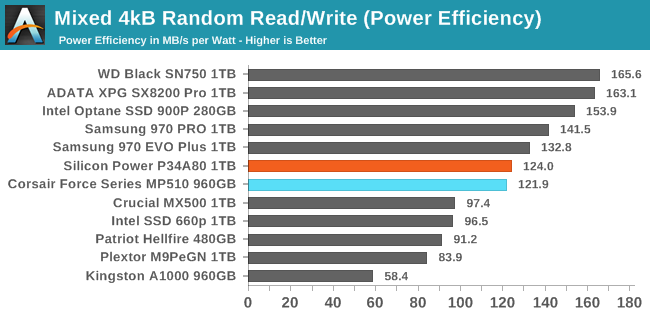
Power efficiency has changed little with the new firmware. The P34A80 and Corsair MP510 are both significantly more efficient on this test than the entry-level NVMe drives, but they fall far short of what the WD Black SN750 delivers with the same 3D TLC NAND.
 |
|||||||||
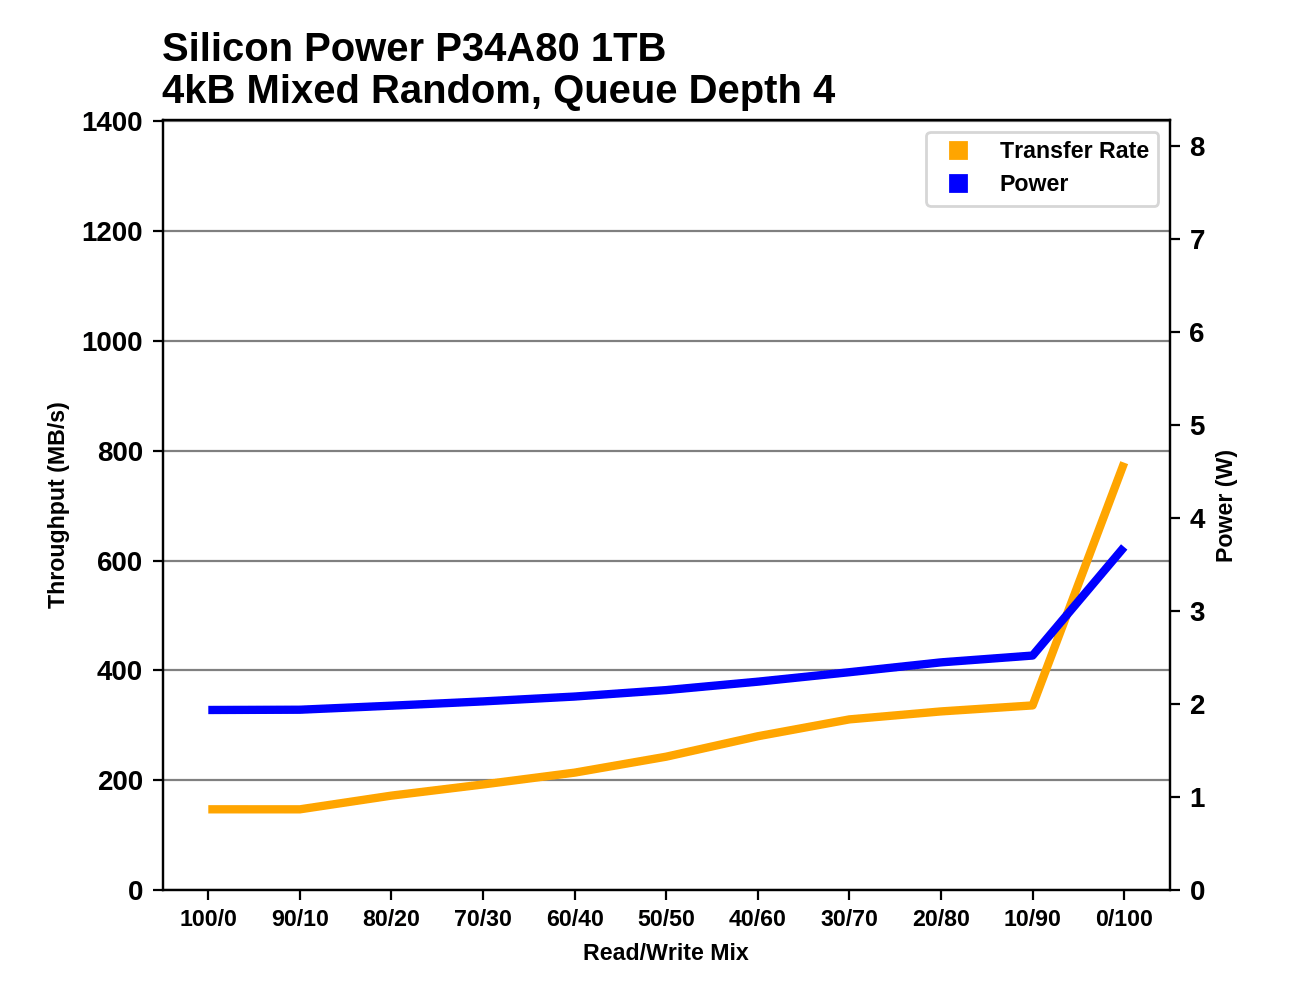
Compared to the Corsair MP510, the Silicon Power P34A80 improves performance on a few of the more write-heavy mixes but otherwise behaves identically. The WD Black offers the same performance on the read-heavy and balanced mixes, but pulls ahead as the workload becomes more write-heavy. The Samsung and ADATA drives are able to outperform the P34A80 across the entire range of mixes.
Mixed Sequential Performance
Our test of mixed sequential reads and writes differs from the mixed random I/O test by performing 128kB sequential accesses rather than 4kB accesses at random locations, and the sequential test is conducted at queue depth 1. The range of mixes tested is the same, and the timing and limits on data transfers are also the same as above.
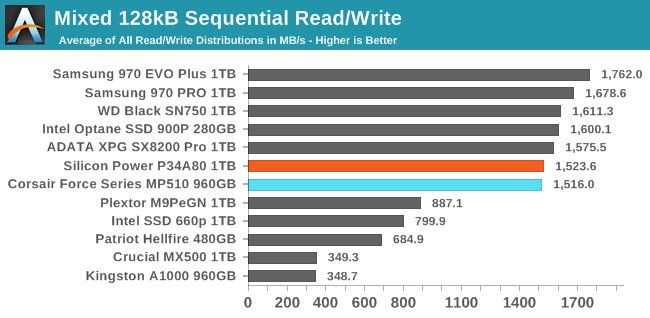
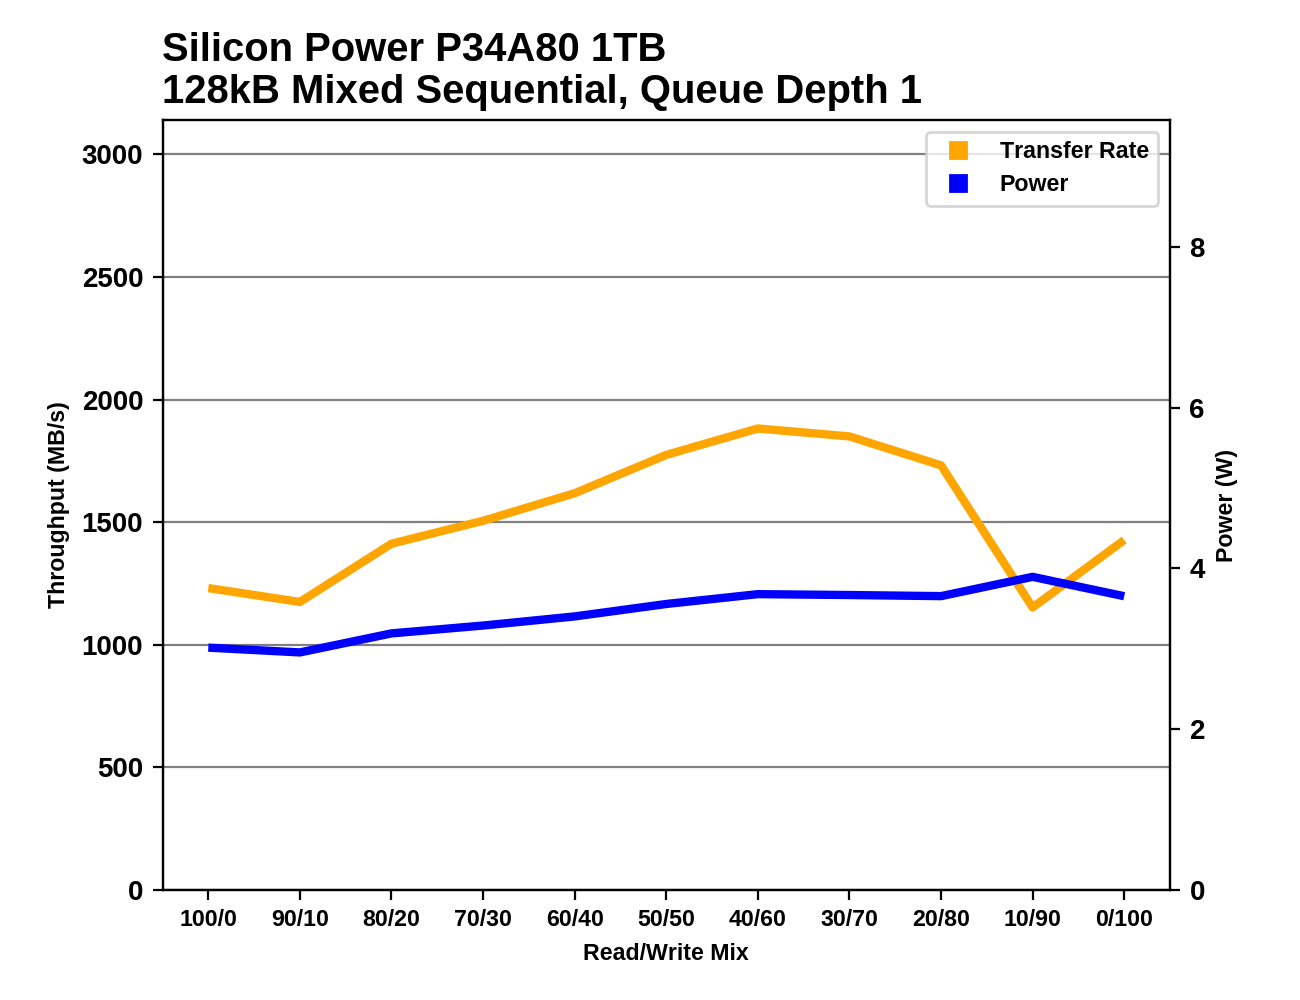
The Silicon Power P34A80 performs about the same as the Corsair MP510 on the mixed sequential IO test. That leaves the two drives in the top performance tier, but they're the slowest drives within that tier: the fastest drive is about 15% faster than the P34A80.
 |
|||||||||
| Power Efficiency in MB/s/W | Average Power in W | ||||||||
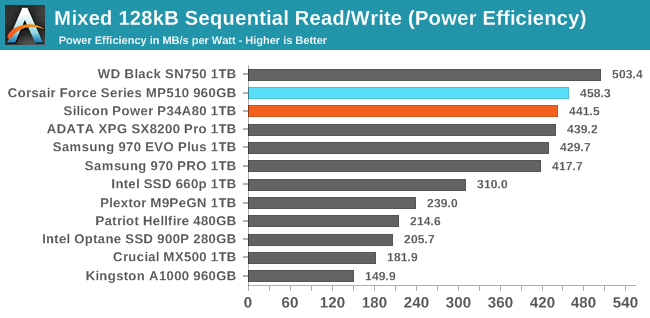
The Phison E12 drives have great power efficiency on the mixed sequential IO test, second only to the WD Black SN750. However, the P34A80 again uses a bit more power than the Corsair MP510 and thus has the lower efficiency score of the two.
 |
|||||||||
The P34A80's performance over the course of the mixed sequential IO test closely matches that of the Corsair MP510 with the earlier firmware. This pattern continues to be quite unusual, with performance peaking on the write-heavy mixes where most drives are at their worst, and sub-par performance on the most read-heavy mixes where other high-end NVMe drives are far faster.
Power Management Features
Real-world client storage workloads leave SSDs idle most of the time, so the active power measurements presented earlier in this review only account for a small part of what determines a drive's suitability for battery-powered use. Especially under light use, the power efficiency of a SSD is determined mostly be how well it can save power when idle.
For many NVMe SSDs, the closely related matter of thermal management can also be important. M.2 SSDs can concentrate a lot of power in a very small space. They may also be used in locations with high ambient temperatures and poor cooling, such as tucked under a GPU on a desktop motherboard, or in a poorly-ventilated notebook.
| Silicon Power P34A80 NVMe Power and Thermal Management Features |
|||
| Controller | Phison PS5012-E12 | ||
| Firmware | ECFM12.1 | ||
| NVMe Version |
Feature | Status | |
| 1.0 | Number of operational (active) power states | 3 | |
| 1.1 | Number of non-operational (idle) power states | 2 | |
| Autonomous Power State Transition (APST) | Supported | ||
| 1.2 | Warning Temperature | 70 °C | |
| Critical Temperature | 90 °C | ||
| 1.3 | Host Controlled Thermal Management | Supported | |
| Non-Operational Power State Permissive Mode | Not Supported | ||
The supported power features on the Silicon Power P34A80 are the same as on the earlier 11.0 firmware. The maximum power figures for the active power states are the same relatively high limits found on the Corsair Force MP510, rather than the lower values seen on our earlier reference design engineering sample from Phison.
| Silicon Power P34A80 NVMe Power States |
|||||
| Controller | Phison PS5012-E12 | ||||
| Firmware | ECFM12.1 | ||||
| Power State |
Maximum Power |
Active/Idle | Entry Latency |
Exit Latency |
|
| PS 0 | 10.73 W | Active | - | - | |
| PS 1 | 7.69 W | Active | - | - | |
| PS 2 | 6.18 W | Active | - | - | |
| PS 3 | 49 mW | Idle | 2 ms | 2 ms | |
| PS 4 | 1.8 mW | Idle | 25 ms | 25 ms | |
Note that the above tables reflect only the information provided by the drive to the OS. The power and latency numbers are often very conservative estimates, but they are what the OS uses to determine which idle states to use and how long to wait before dropping to a deeper idle state.
Idle Power Measurement
SATA SSDs are tested with SATA link power management disabled to measure their active idle power draw, and with it enabled for the deeper idle power consumption score and the idle wake-up latency test. Our testbed, like any ordinary desktop system, cannot trigger the deepest DevSleep idle state.
Idle power management for NVMe SSDs is far more complicated than for SATA SSDs. NVMe SSDs can support several different idle power states, and through the Autonomous Power State Transition (APST) feature the operating system can set a drive's policy for when to drop down to a lower power state. There is typically a tradeoff in that lower-power states take longer to enter and wake up from, so the choice about what power states to use may differ for desktop and notebooks.
We report two idle power measurements. Active idle is representative of a typical desktop, where none of the advanced PCIe link or NVMe power saving features are enabled and the drive is immediately ready to process new commands. The idle power consumption metric is measured with PCIe Active State Power Management L1.2 state enabled and NVMe APST enabled if supported.
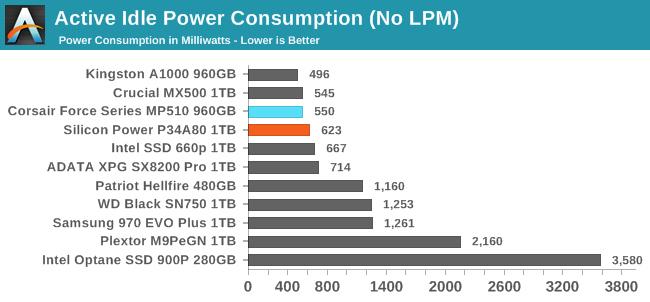
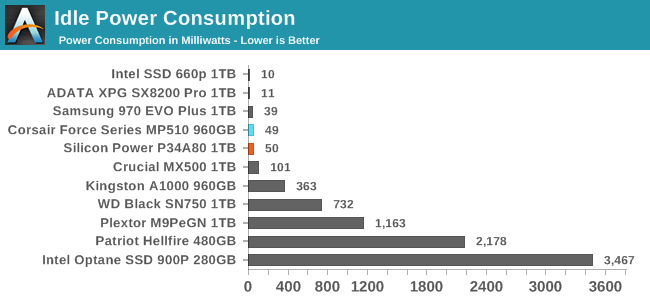
The P34A80 has slightly higher active idle power consumption than the Corsair MP510, but still lower than any high-end NVMe drive using a competing controller. The idle power consumption is unchanged, leaving the Phison E12 with good power management but not quite the best achievable on our desktop testbed.
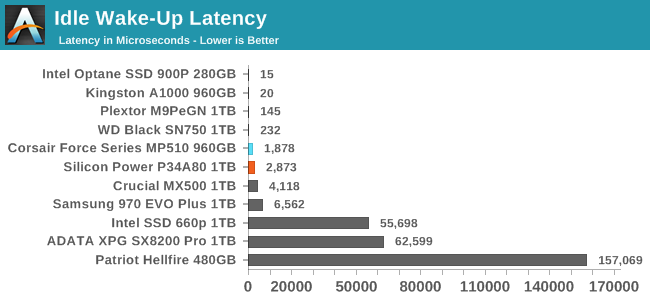
The P34A80 is slightly slower to wake up from idle than the Corsair MP510, but at under 3ms it's still plenty fast, and otherwise is only really beat by drives that are unable to reach a deep idle state on our desktop testbed.
Conclusion
The Silicon Power P34A80 shows that Phison's updated firmware for the E12 controller is generally an improvement, but the changes are not drastic. There are a few minor performance regressions, but they are balanced by plenty of minor performance gains, and a few larger performance gains that set new records on some of our synthetic benchmarks. With newer firmware, the Phison E12 is still a capable high-end contender, but firmware tweaks alone are not enough to close the gap where the E12 is lagging behind the competition.
There's no significant shift in strategy, unlike what we've seen with the Silicon Motion SM2262EN compared to the original SM2262, where peak performance is now much more heavily emphasized at the expense of sustained performance and full-drive performance. Phison's new firmware isn't trying to make radically different tradeoffs, just trying to refine performance in general.
The most important lesson from the P34A80 stems from the fact that it offers comparable performance to the Corsair MP510 while providing a usable capacity of 1024GB instead of 960GB. Clearly, the higher overprovisioning ratio of the MP510 is not necessary for the Phison E12 controller to perform well, even on the tests that completely fill the drive. The difference in usable capacity may be just under 7%, but that kind of difference still gives a drive a leg up when comparing price-per-gigabyte.
Extra overprovisioning may help with write endurance, but there's no indication that this is needed. Silicon Power doesn't give an explicit TBW or drive writes per day rating to the P34A80, but the five year warranty period is the same that other high-end SSDs come with. Other vendors that use Toshiba's 64L TLC NAND have had no trouble offering competitive endurance ratings on drives with the same overprovisioning ratio as the P34A80, and the Phison E12's error correction is competitive with what other current NVMe controllers use.
The Silicon Power P34A80 does consistently use slightly more power than the Corsair Force Series MP510 did, which hurts efficiency on many tests where there aren't significant performance gains from the new firmware. But this efficiency hit doesn't change the rankings much, and the Phison E12 was never one of our top choices for power-efficient NVMe drives.
It would be nice to see more vendors have infrastructure for delivering firmware updates; Silicon Power's firmware updater is easy to find, though there aren't any updates from the past year. MyDigitalSSD has already delivered the 12.1 update for their E12 drive that originally shipped with 11.0. Corsair seemingly hasn't provided a firmware update for one of their SSDs since they were using SandForce controllers years ago. Other Phison partners are likewise all over the place with their post-sale product maintenance. (It's worth mentioning that it is often possible to use one brand's firmware update tool on another brand's SSD, when both are using reference Phison firmware, but no vendor should put their customers in the position of needing to try this.)
The Silicon Power P34A80 is currently difficult to find in stock, though it appears that Newegg had the 1TB model for a while, and the 512GB drive is listed on Amazon for a very attractive $74.99. The Phison E8-based P32A80 is also quite scarce, so it appears that Silicon Power is still just testing the waters of the NVMe market while focusing primarily on their SATA products. For now, our recommendation for a Phison E12 product is the MyDigitalSSD BPX Pro, which has slightly lower usable capacities than the Silicon Power drive but does offer the newer firmware that Corsair hasn't offered for download.


