Original Link: https://www.anandtech.com/show/13760/the-western-digital-wd-black-sn750-ssd-review
The Western Digital WD Black SN750 SSD Review: Why Fix What Isn't Broken?
by Billy Tallis on January 18, 2019 8:01 AM EST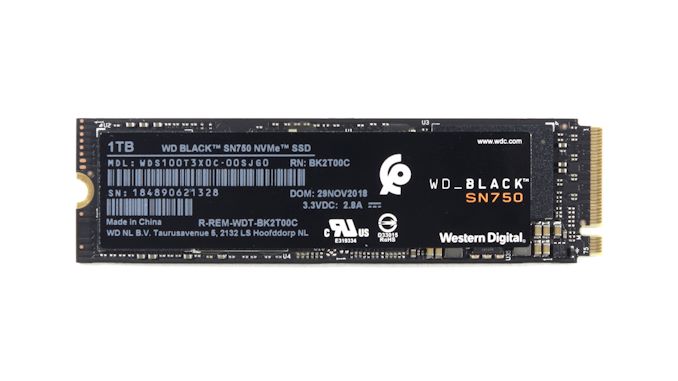
Last year Western Digital overhauled their WD Black NVMe SSD with an upgrade to 3D NAND and a new in-house SSD controller, transforming the product line from one of the slowest NVMe drives to one of the top high-end competitors. Now the third generation WD Black SSD is here, with the model number SN750 to avoid confusion with its predecessors. (Internally, last year's model was known as the SN700, and the OEM version was the SN720.) The new WD Black SN750 is an incremental update over last year's model, keeping the same basic controller and 64L 3D NAND combination but refining the firmware and adding a 2TB option. Western Digital is also shifting their marketing efforts more toward gamers with the addition of SKUs featuring a large heatsink.
The second-generation WD Black launched last year delivered performance that is generally competitive with other top NVMe SSDs like the Samsung 970 EVO, while usually operating with far better power efficiency. The only other high-end NVMe SSDs that have similar efficiency are the Toshiba XG5 and XG6, but the controller they use puts them clearly in a lower performance class than the WD Black. However, last year's model was still the first release of a new controller architecture, so it is no surprise that Western Digital has some firmware improvements to deliver. It is a bit disappointing that those improvements aren't being distributed as free firmware updates to owners of last year's model, but Western Digital is not the only company that's taken this approach.
| Western Digital WD Black SN750 Specifications | ||||||
| Capacity | 250 GB | 500 GB | 1 TB | 2 TB | ||
| Form Factor | M.2 2280 single-sided optional heatsink (except 250GB) |
|||||
| Interface | PCIe 3 x4 NVMe 1.3 | |||||
| Controller | Western Digital in-house | |||||
| NAND Flash | SanDisk 64-layer 3D TLC | |||||
| Sequential Read | 3100 MB/s | 3470 MB/s | 3470 MB/s | 3400 MB/s | ||
| Sequential Write | 1600 MB/s | 2600 MB/s | 3000 MB/s | 2900 MB/s | ||
| Random Read | 220k IOPS | 420k IOPS | 515k IOPS | 480k IOPS | ||
| Random Write | 180k IOPS | 380k IOPS | 560k IOPS | 550k IOPS | ||
| Power | Peak | 9.24 W | 9.24 W | 9.24 W | 9.24 W | |
| PS3 Idle | 70 mW | 70 mW | 100 mW | 100 mW | ||
| PS4 Idle | 2.5 mW | 2.5 mW | 2.5 mW | 2.5 mW | ||
| Warranty | 5 years | |||||
| Write Endurance | 200 TB 0.4 DWPD |
300 TB 0.3 DWPD |
600 TB 0.3 DWPD |
1200 TB 0.3 DWPD |
||
| MSRP (No heatsink) |
$79.99 | $129.99 | $249.99 | $499.99 | ||
Aside from the addition of the 2TB option, the most noticeable changes to the specs table are the vastly lower MSRPs: the 2TB will debut for only $50 more than the 1TB model was at introduction last year, and the smallest price drop is the 33% cut to the 250GB model's price tag.
Performance has been improved slightly across most of the major metrics, but none of the improvements are anything huge. The 2TB model will actually be slightly slower than the 1TB, due in part to using 512Gb NAND dies instead of 256Gb dies so that the 2TB model can still be a single-sided M.2 card.
The 2TB model and the SKUs equipped with heatsinks will be arriving this spring, but the plain 250GB through 1TB models ship this month. Western Digital has not provided MSRPs for the models with heatsinks, but we expect them to carry a bit of a premium when they arrive.
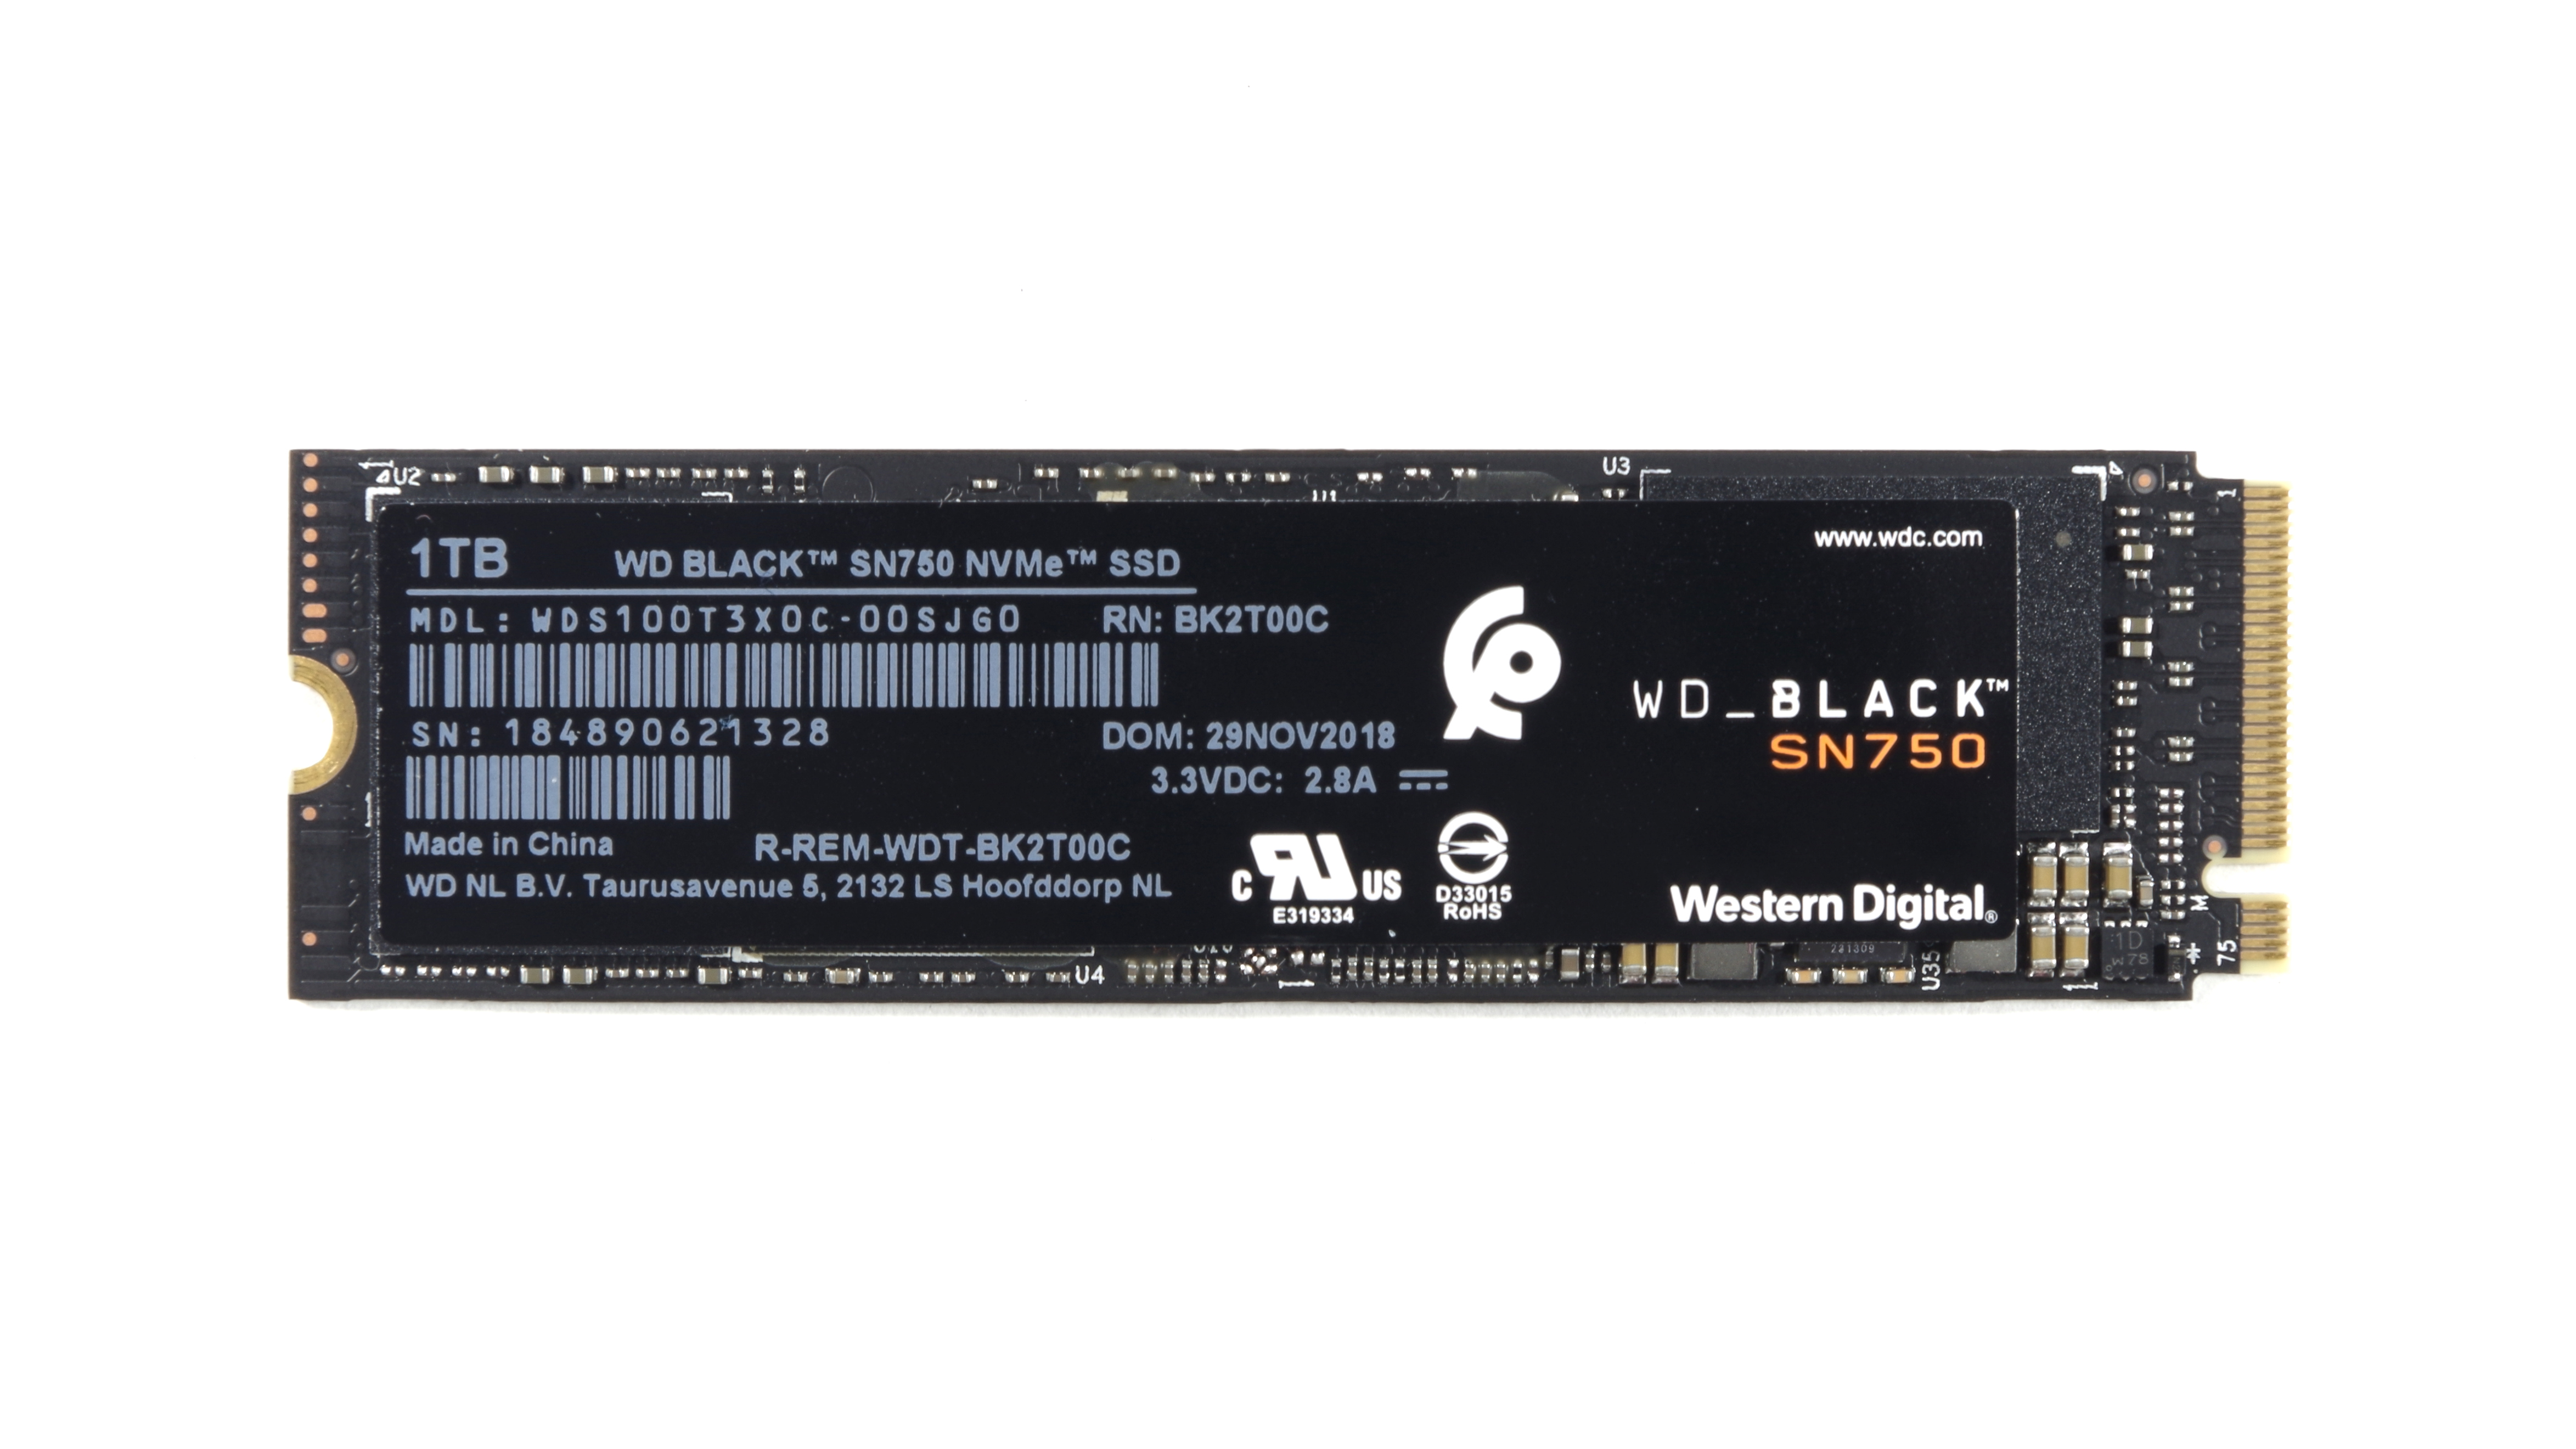
Peeking under the label, we find essentially the same PCB as last year's model, though it appears we've gone from revision A to revision D. The WD Black SN750 is equipped with the same controller and NAND parts as last year's WD Black and SanDisk Extreme Pro, and the only differences in chip markings appear to be date codes or lot numbers.
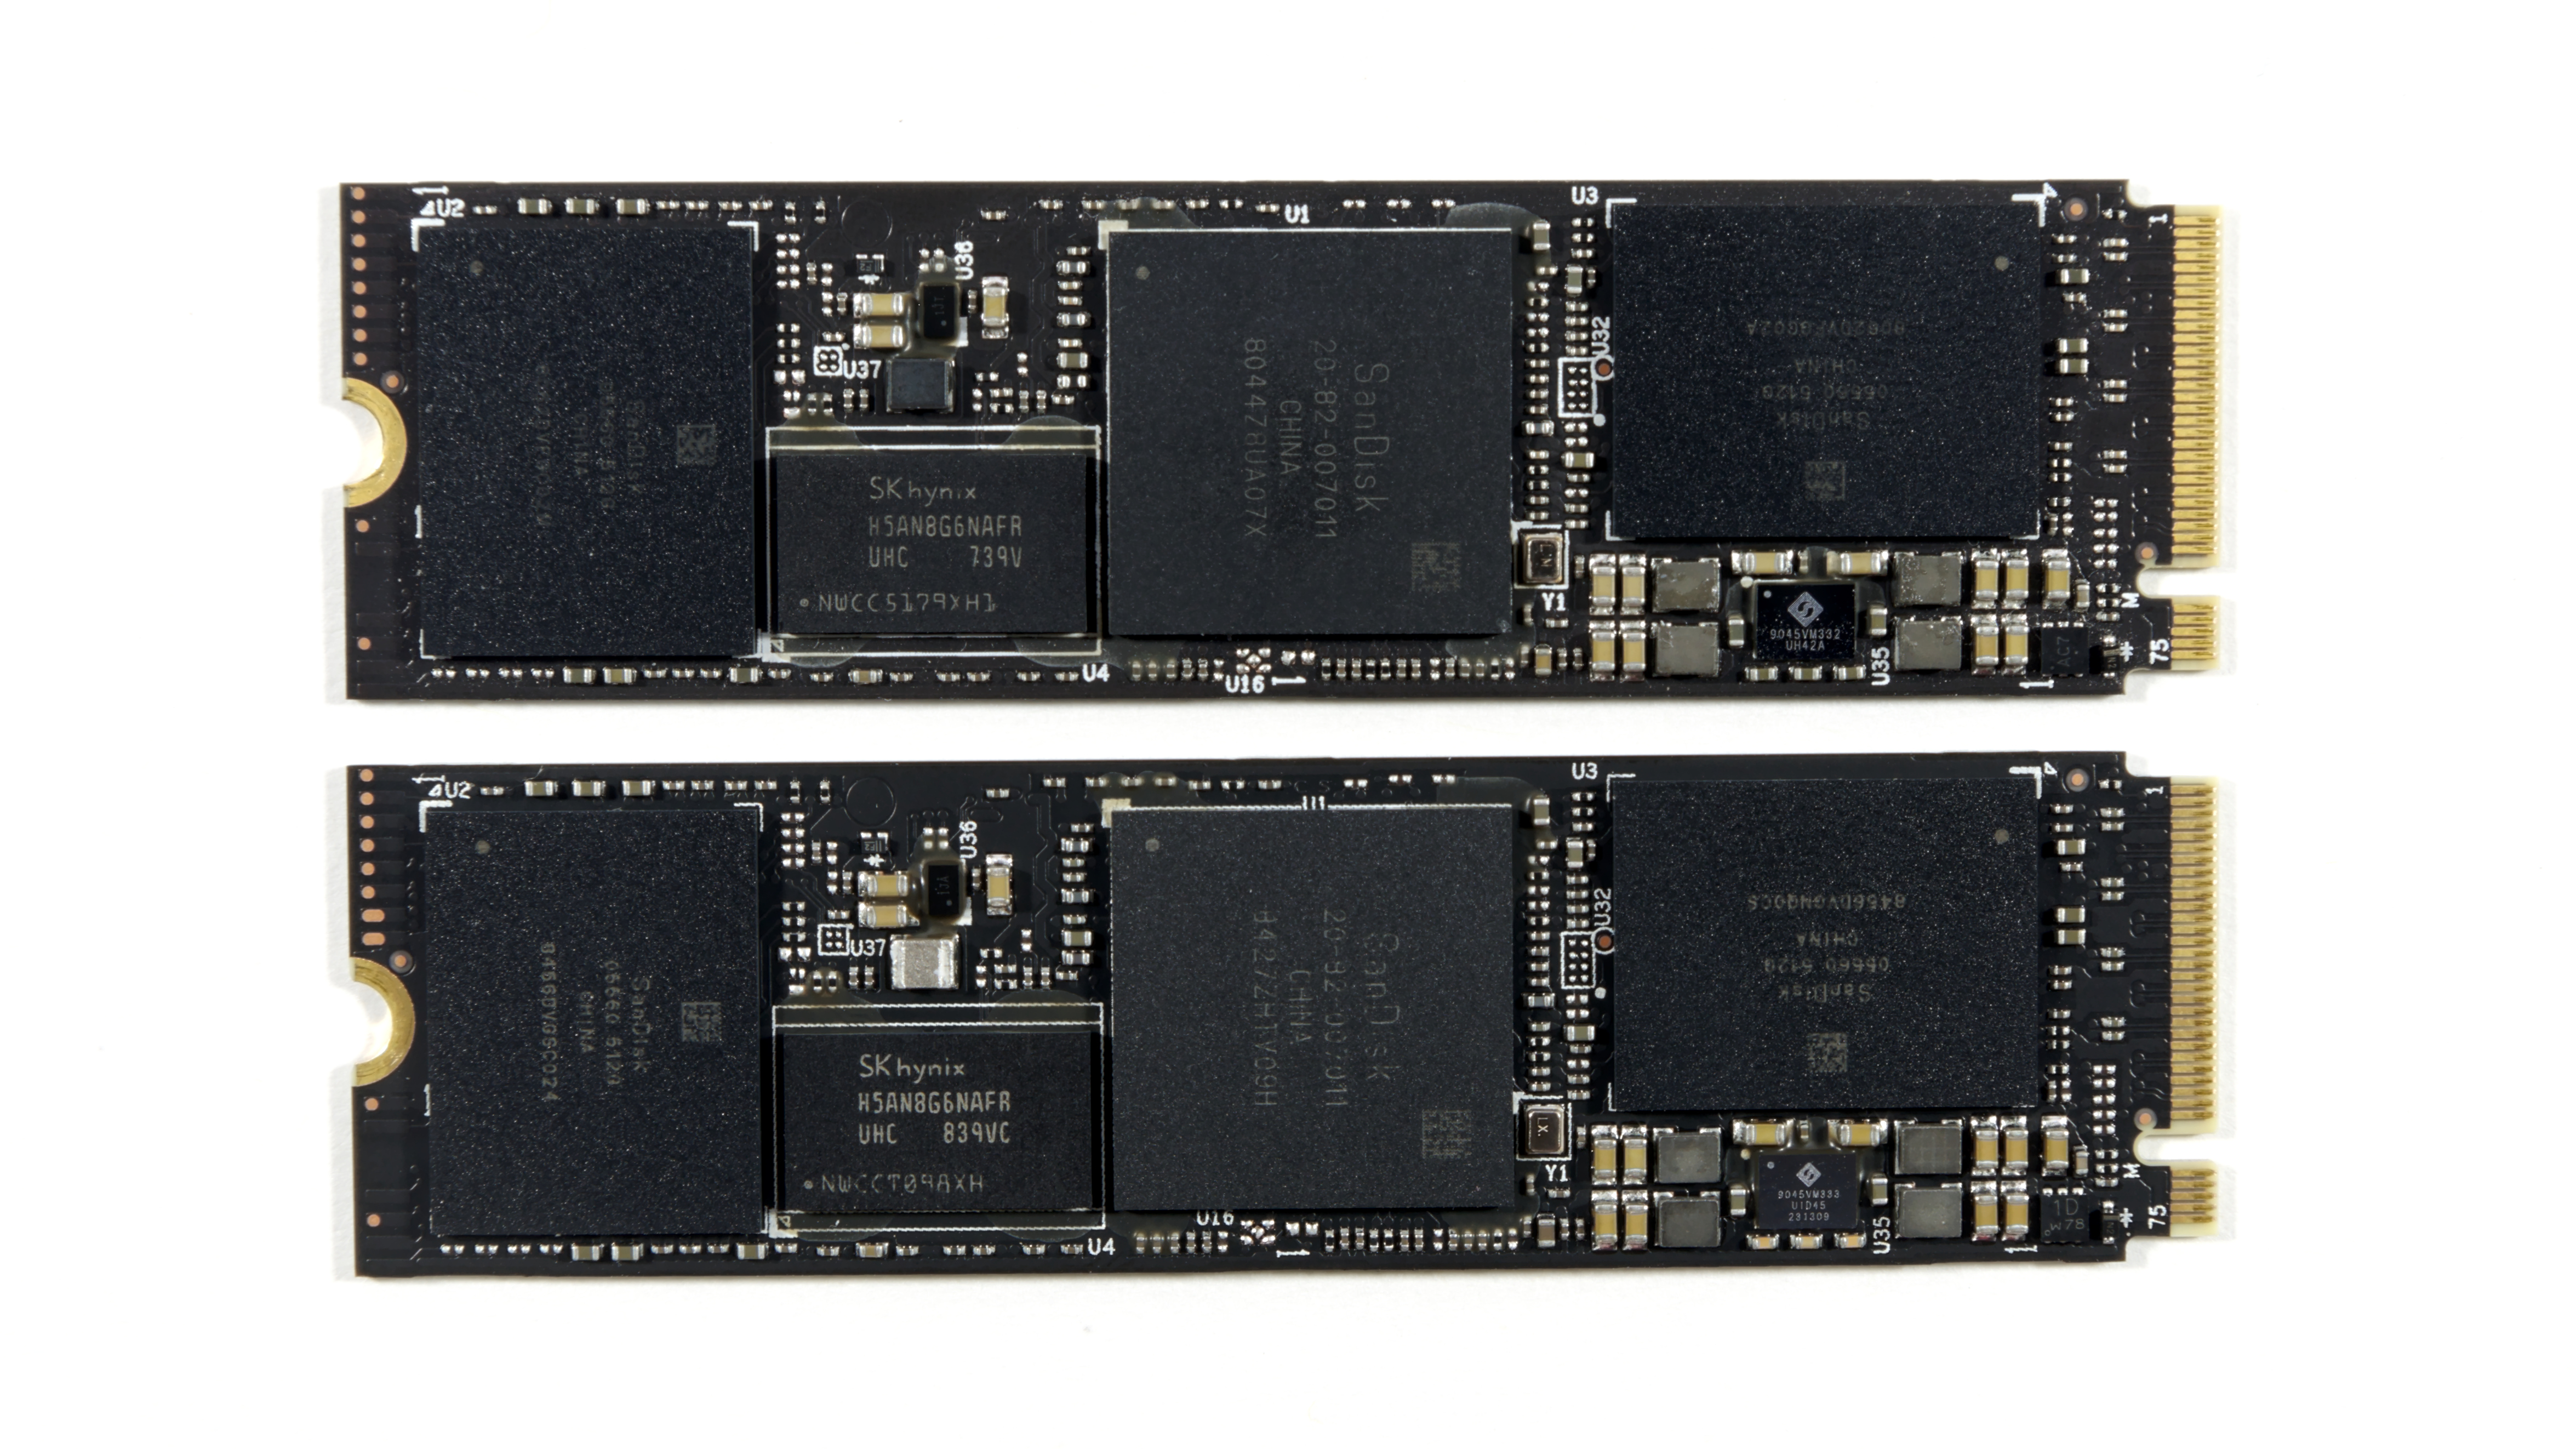
Top: 2nd Gen WD Black (SN700)
Bottom: 3rd Gen WD Black SN750


Unlike last year's model, the new WD Black SN750 does not have a sibling product under the SanDisk brand; the SanDisk Extreme Pro NVMe SSD is now strictly speaking an outdated product, though it is still very similar to the new WD Black.
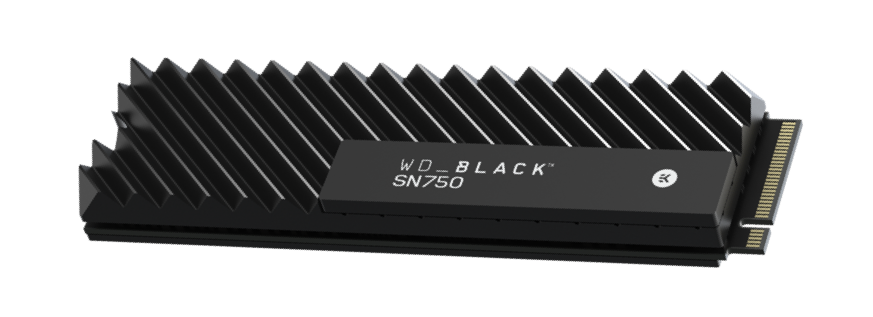
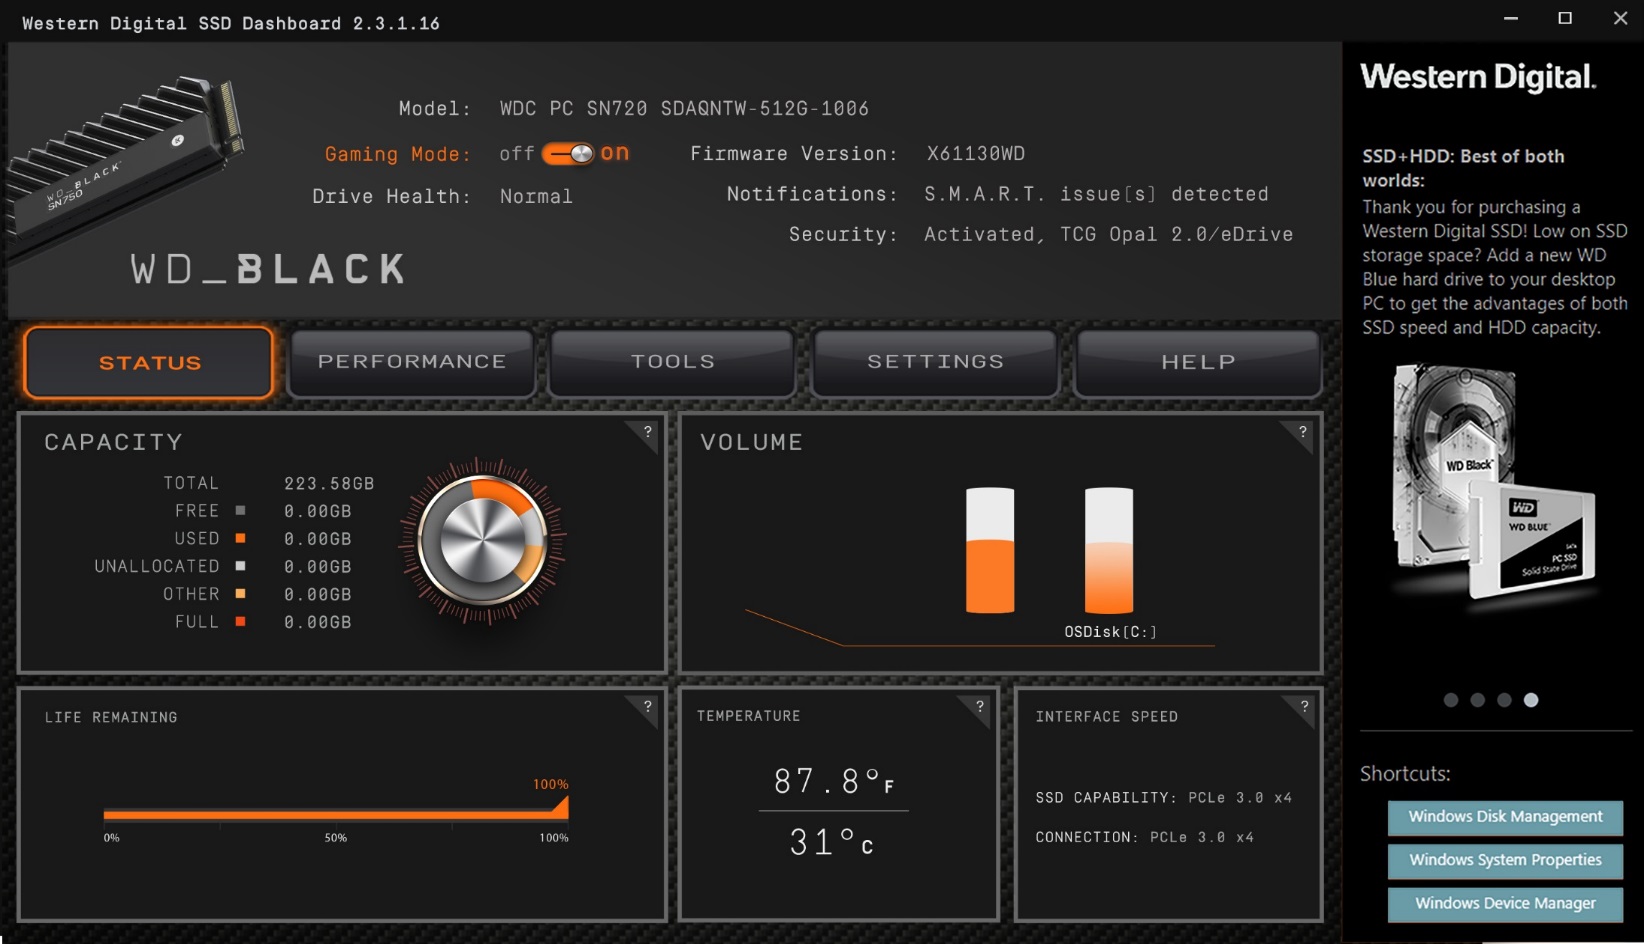
Western Digital has made a few superficial changes to the WD Black to make it more gamer-oriented. The product packaging and labeling has been restyled, and all but the smallest model will soon be available in versions with a custom aluminum heatsink from EKWB. Additionally, there's a new version of Western Digital's new SSD Dashboard software for Windows that adds a "Gaming Mode" which re-configures the NVMe driver to not enable Autonomous Power State Transitions. When this gaming mode is enabled, the drive won't make use of its low-power idle states, which avoids the extra latency of waking the drive up after it has been idle for a few seconds. However, in our experience few gaming desktops are configured to use the deepest idle states, and the WD Black wakes up very quickly from its intermediate idle, so this feature will be inconsequential for most users.
Our Linux-based synthetic performance tests are already conducted with APST off so that idle wake-up latency doesn't distort those results. Our Windows-based ATSB trace tests leave APST enabled, but the trace playback cuts idle times short enough that most NVMe drives won't be entering low-power states during those tests, either. The SYSmark 2018 test gives SSDs plenty of idle time to make use of their deepest idle states, but overall the workload it presents is not storage-intensive enough for WD's Gaming Mode to have a noticeable effect.
It may seem odd that Western Digital is sticking with their 64-layer 3D NAND even months after their partner Toshiba started shipping 96L 3D NAND with the XG6, but the transition to 96L NAND will look very different from the transition to 64L NAND. The 64L generation leveled the playing field as Toshiba and Western Digital delivered their first 3D NAND worth mass producing, and Intel and Micron made significant performance improvements over their previous 32L NAND. As most of the major manufacturers largely caught up to Samsung and ramped up production, prices crashed. That's been great news for consumers, but has prompted the manufacturers to slow their investments into 96L production to avoid worsening the oversupply. Thus, we expect the 96L transition to proceed more slowly, taking all of 2019 and probably into 2020 before every 64L product line gets upgraded. The 96L upgrade has the potential to bring some significant performance and power improvements, but will in most cases require a new generation of controllers that can take advantage of higher controller-to-NAND interface speeds or lower operating voltages.
Since last year's WD Black launched, the most important new competitors to hit the scene have been drives based on Intel/Micron NAND with the SM2262 controller, and drives using the same Toshiba/SanDisk NAND with the Phison E12 controller. The SM2262 drives (represented in this review by the HP EX920) are now being phased out in favor of the upgraded SM2262EN controller, which we previewed last year. Representing the Phison E12 family, we have the Corsair Force MP510 960GB.
| AnandTech 2018 Consumer SSD Testbed | |
| CPU | Intel Xeon E3 1240 v5 |
| Motherboard | ASRock Fatal1ty E3V5 Performance Gaming/OC |
| Chipset | Intel C232 |
| Memory | 4x 8GB G.SKILL Ripjaws DDR4-2400 CL15 |
| Graphics | AMD Radeon HD 5450, 1920x1200@60Hz |
| Software | Windows 10 x64, version 1709 |
| Linux kernel version 4.14, fio version 3.6 | |
| Spectre/Meltdown microcode and OS patches current as of May 2018 | |
- Thanks to Intel for the Xeon E3 1240 v5 CPU
- Thanks to ASRock for the E3V5 Performance Gaming/OC
- Thanks to G.SKILL for the Ripjaws DDR4-2400 RAM
- Thanks to Corsair for the RM750 power supply, Carbide 200R case, and Hydro H60 CPU cooler
- Thanks to Quarch for the XLC Programmable Power Module and accessories
- Thanks to StarTech for providing a RK2236BKF 22U rack cabinet.
Whole-Drive Fill
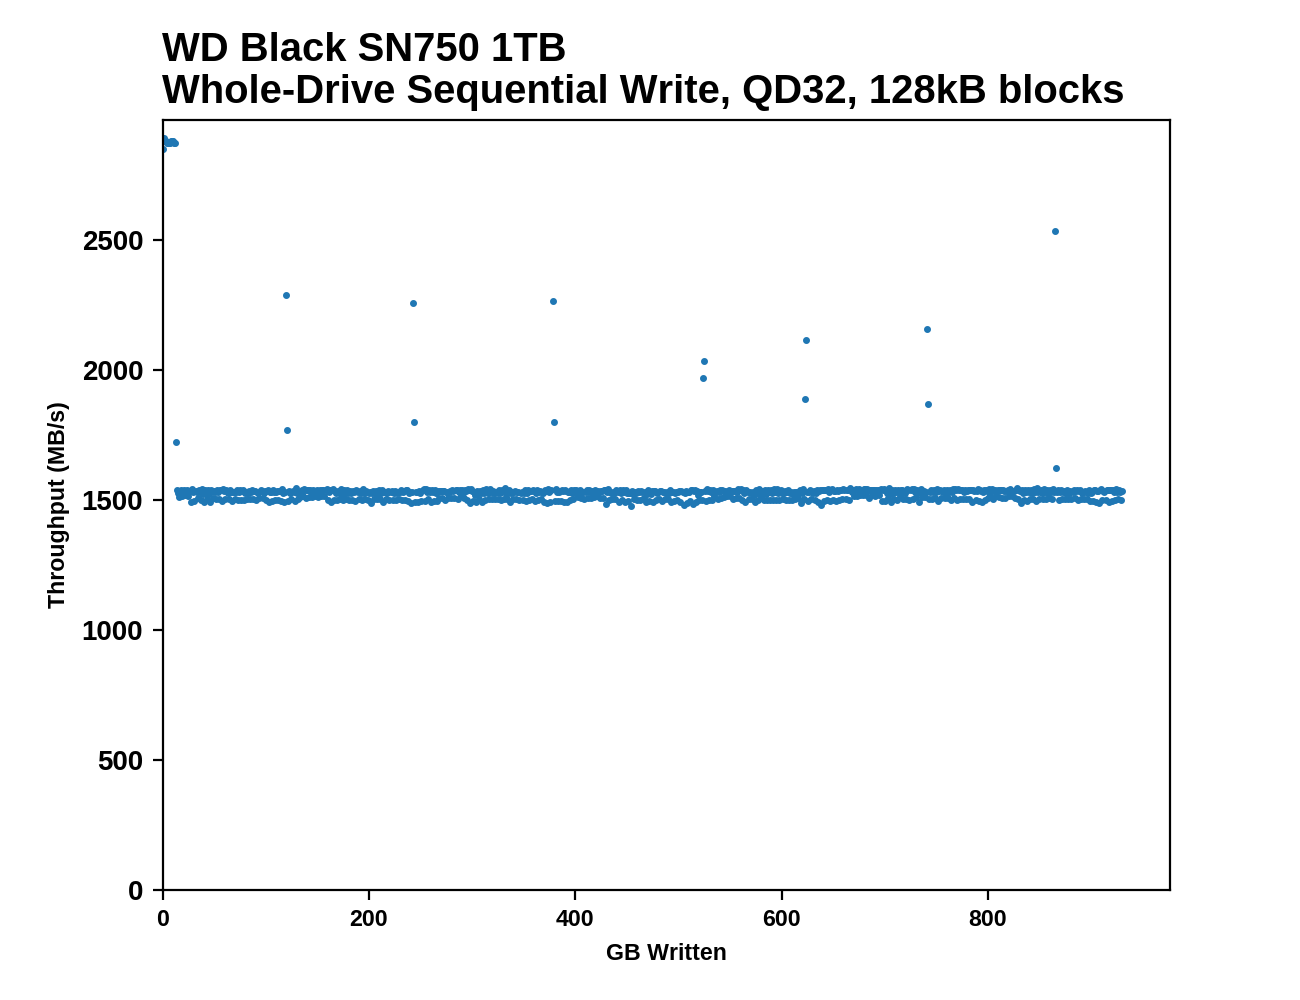
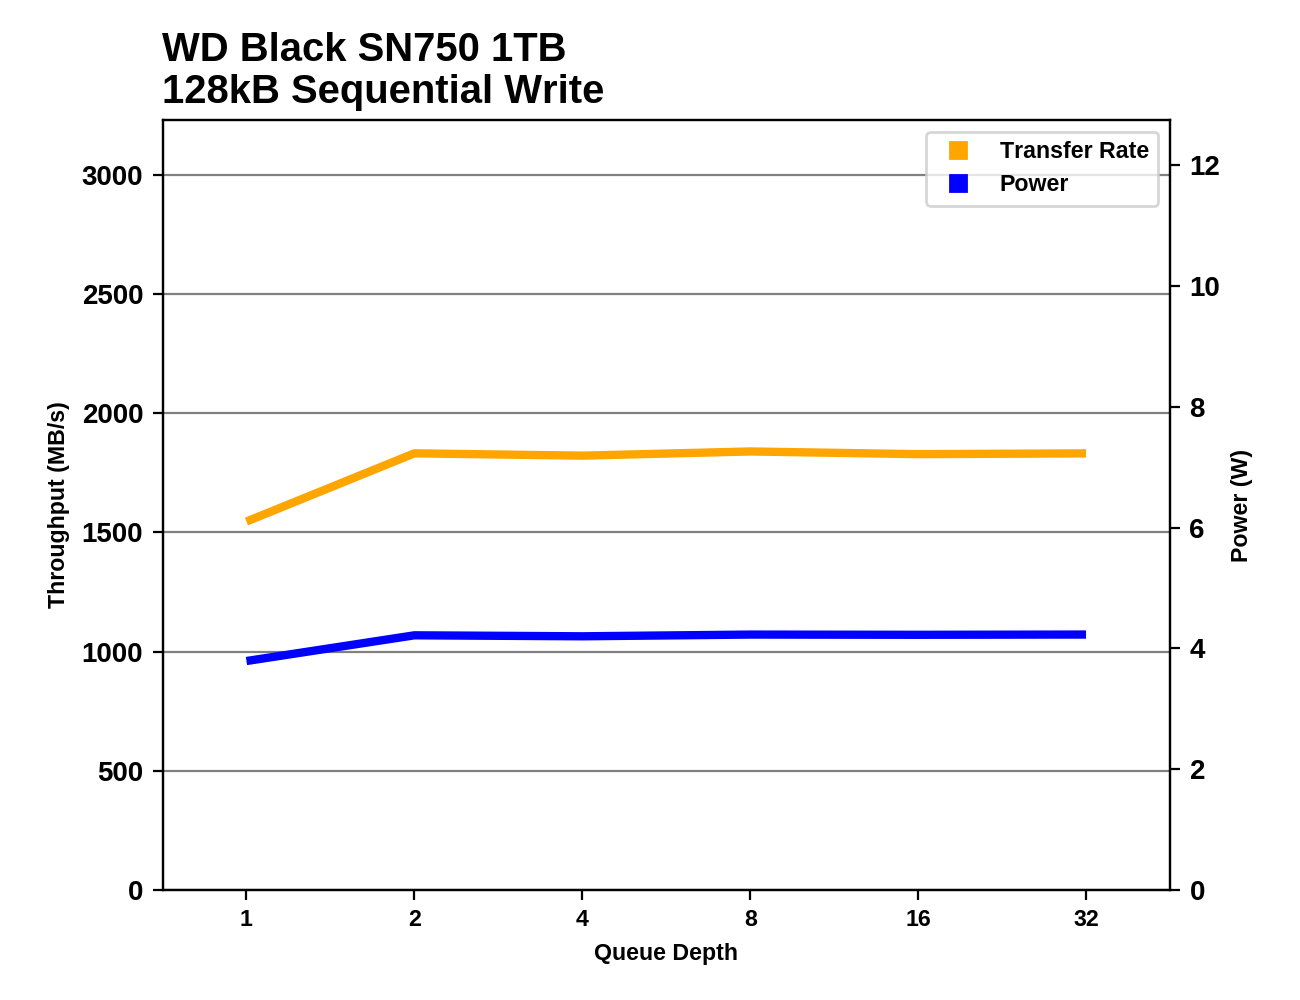
This test starts with a freshly-erased drive and fills it with 128kB sequential writes at queue depth 32, recording the write speed for each 1GB segment. This test is not representative of any ordinary client/consumer usage pattern, but it does allow us to observe transitions in the drive's behavior as it fills up. This can allow us to estimate the size of any SLC write cache, and get a sense for how much performance remains on the rare occasions where real-world usage keeps writing data after filling the cache.
 |
|||||||||
The WD Black SN750's behavior during a full drive write is quite similar to that of its predecessor, albeit with a 5% improvement in write speed after the SLC cache fills up. The cache fills after about 12GB of writes, but since performance after the drop is steady at around 1.5GB/s the small cache isn't really a problem.
 |
|||||||||
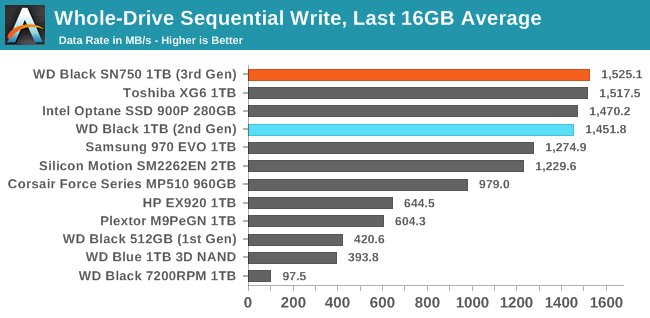
| Average Throughput for last 16 GB | Overall Average Throughput | ||||||||
The WD Black SN750 offers best in class performance for long-duration sequential writes. After the SLC cache is full, the SN750 is about 5% faster than its predecessor for filling the rest of the drive. When looking at the total time to fill the drive, the SN750's advantage is slightly higher because its write speed to the SLC cache is also a bit faster.
BAPCo SYSmark 2018
BAPCo's SYSmark 2018 is an application-based benchmark that uses real-world applications to replay usage patterns of business users, with subscores for productivity, creativity and responsiveness. Scores represnt overall system performance and are calibrated against a reference system that is defined to score 1000 in each of the scenarios. A score of, say, 2000, would imply that the system under test is twice as fast as the reference system.
SYSmark scores are based on total application response time as seen by the user, including not only storage latency but time spent by the processor. This means there's a limit to how much a storage improvement could possibly increase scores, because the SSD is only in use for a small fraction of the total test duration. This is a significant difference from our ATSB tests where only the storage portion of the workload is replicated and disk idle times are cut short to a maximum of 25ms.
| AnandTech SYSmark SSD Testbed | |
| CPU | Intel Core i5-7400 |
| Motherboard | ASUS PRIME Z270-A |
| Chipset | Intel Z270 |
| Memory | 2x 8GB Corsair Vengeance DDR4-2400 CL17 |
| Case | In Win C583 |
| Power Supply | Cooler Master G550M |
| OS | Windows 10 64-bit, version 1803 |
Our SSD testing with SYSmark uses a different test system than the rest of our SSD tests. This machine is set up to measure total system power consumption rather than just the drive's power.
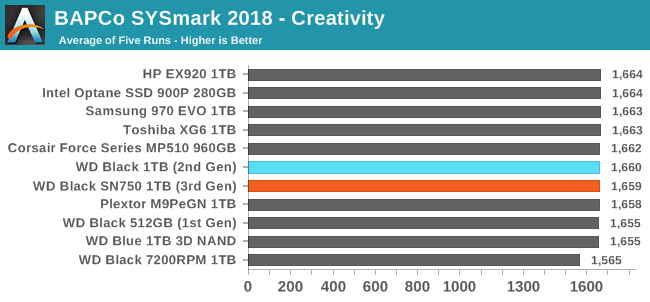
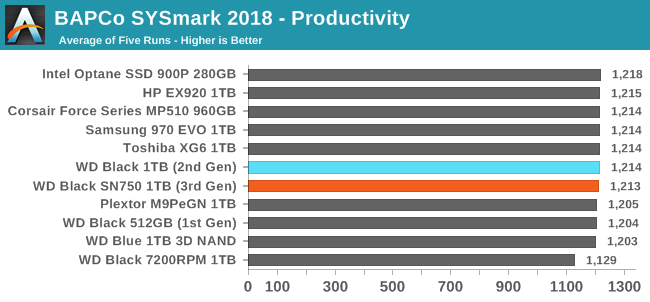
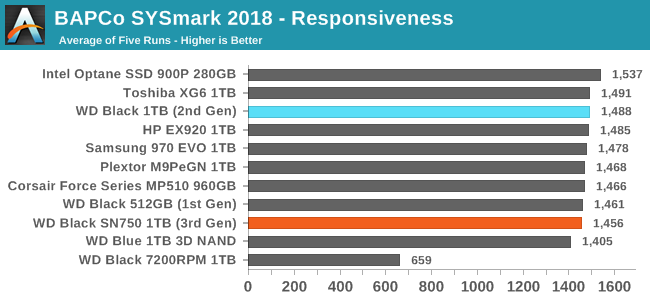
The new WD Black SN750 regresses slightly in performance on SYSmark 2018, primarily on the responsiveness test, which is the subscore that's most sensitive to storage performance. The SN750 still clearly outperforms the WD Blue SATA SSD but even managed to fall behind the first-generation WD Black that used planar TLC and a third-party controller.
Energy Usage
The SYSmark energy usage scores measure total system power consumption, excluding the display. Our SYSmark test system idles at around 26 W and peaks at over 60 W measured at the wall during the benchmark run. SATA SSDs seldom exceed 5 W and idle at a fraction of a watt, and the SSDs spend most of the test idle. This means the energy usage scores will inevitably be very close. A typical notebook system will tend to be better optimized for power efficiency than this desktop system, so the SSD would account for a much larger portion of the total and the score difference between SSDs would be more noticeable.
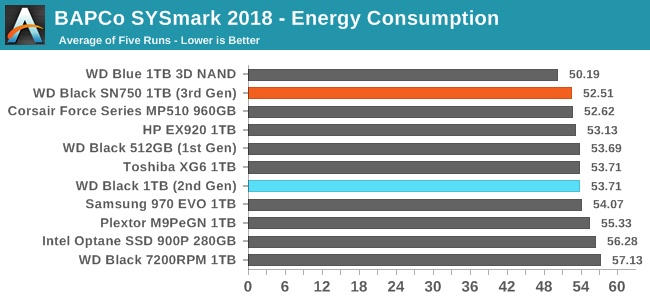
The WD Black SN750 turns in an excellent energy consumption score, lower than any drive in this bunch save for the WD Blue SATA SSD.
AnandTech Storage Bench - The Destroyer
The Destroyer is an extremely long test replicating the access patterns of very IO-intensive desktop usage. A detailed breakdown can be found in this article. Like real-world usage, the drives do get the occasional break that allows for some background garbage collection and flushing caches, but those idle times are limited to 25ms so that it doesn't take all week to run the test. These AnandTech Storage Bench (ATSB) tests do not involve running the actual applications that generated the workloads, so the scores are relatively insensitive to changes in CPU performance and RAM from our new testbed, but the jump to a newer version of Windows and the newer storage drivers can have an impact.
We quantify performance on this test by reporting the drive's average data throughput, the average latency of the I/O operations, and the total energy used by the drive over the course of the test.
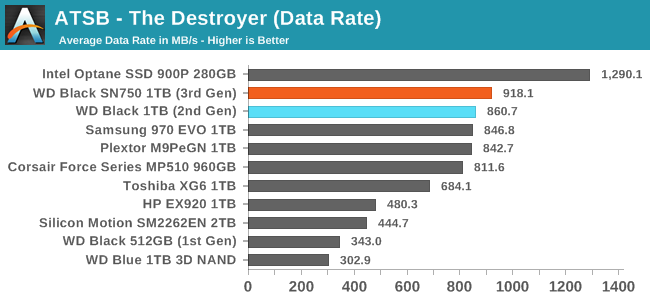
The WD Black SN750 improves slightly over its predecessor on The Destroyer, setting a new record for the highest average data rate from a TLC-based SSD.
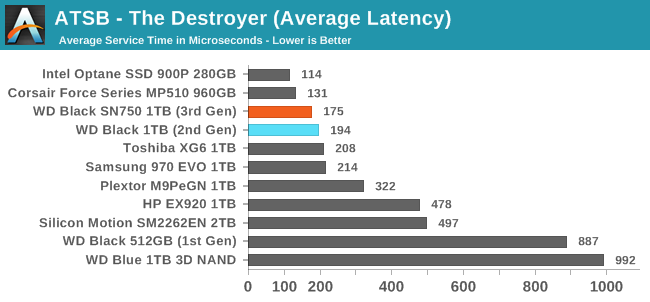
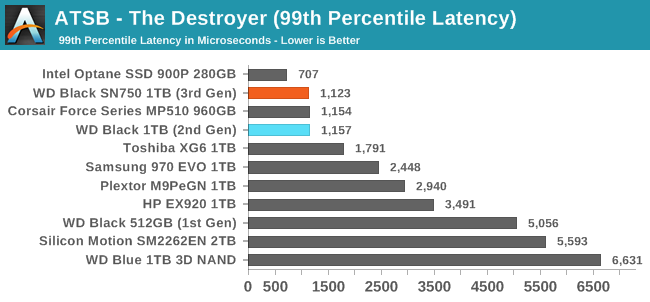
The SN750 has slightly lower average latency on The Destroyer than its predecessor, but the Phison E12-based Corsair MP510 is in the lead among flash-based SSDs. The MP510 and both the current and previous WD Black are essentially tied for 99th percentile latency.
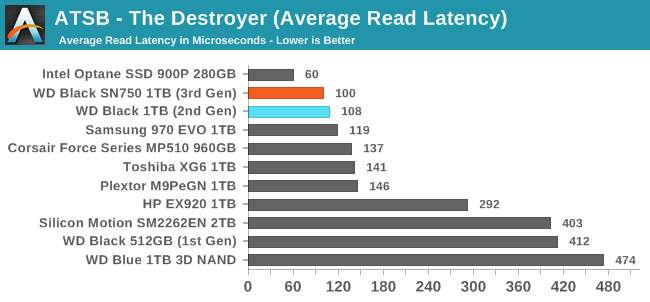
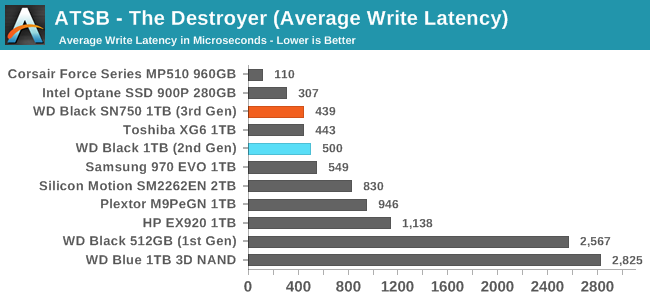
The SN750 improves on both average read and write latency scores, but the Corsair MP510 has a much better average write latency on The Destroyer than the WD Black or even the Intel Optane 900P.
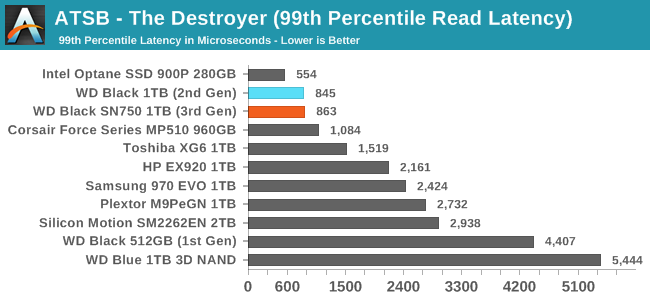
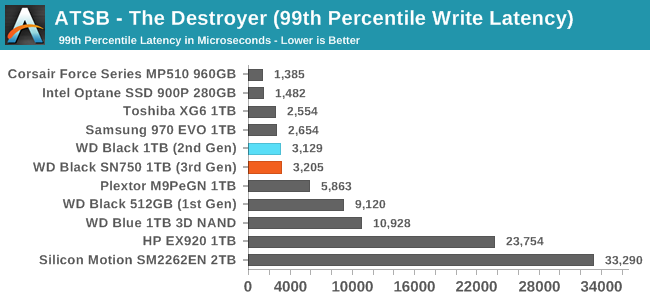
The 99th percentile read and write latency scores for the SN750 are essentially unchanged from the previous WD Black, leaving it with one of the best QoS scores for reads but a score for writes that is worse than several of last year's TLC-based competitors.
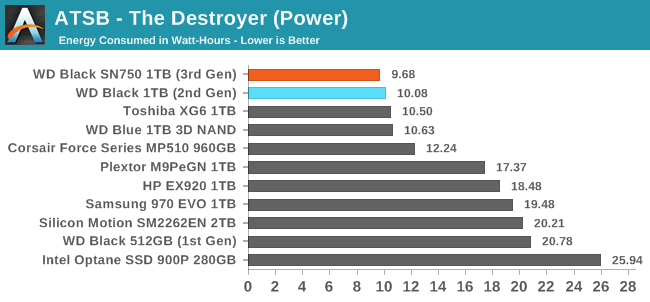
The total energy consumption of the new WD Black over the course of The Destroyer is about 4% lower than its predecessor, further increasing WD's lead in NVMe power efficiency.
AnandTech Storage Bench - Heavy
Our Heavy storage benchmark is proportionally more write-heavy than The Destroyer, but much shorter overall. The total writes in the Heavy test aren't enough to fill the drive, so performance never drops down to steady state. This test is far more representative of a power user's day to day usage, and is heavily influenced by the drive's peak performance. The Heavy workload test details can be found here. This test is run twice, once on a freshly erased drive and once after filling the drive with sequential writes.
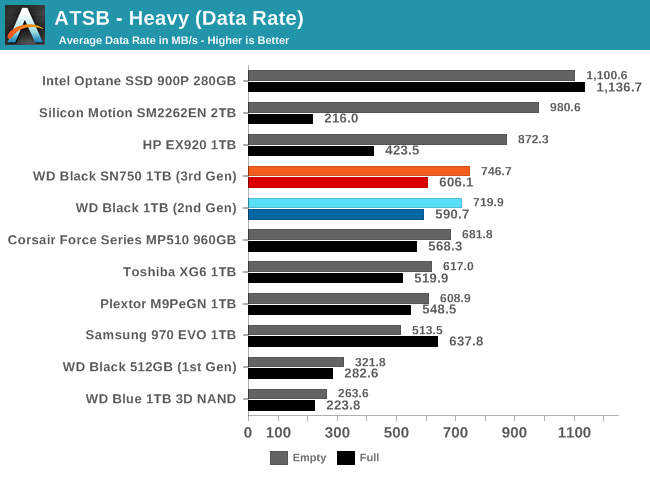
The WD Black SN750 provides only minor overall improvements over last year's model on the Heavy test. This leaves it with an average data rate that falls well short of the latest Silicon Motion-based drives when the test is run on an empty drive, but the full-drive performance of the WD Black is still excellent.
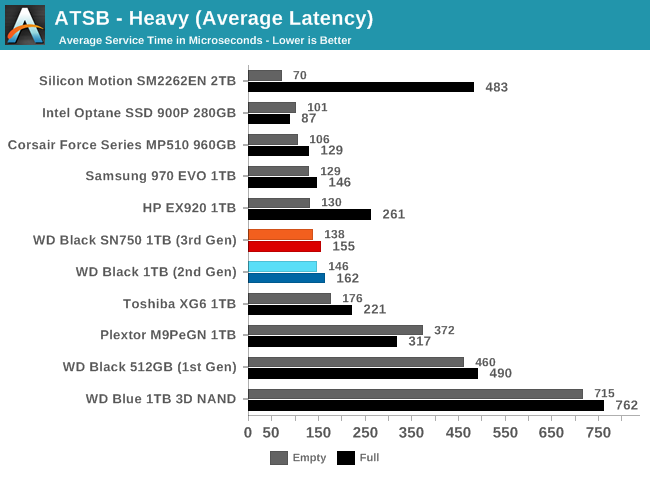
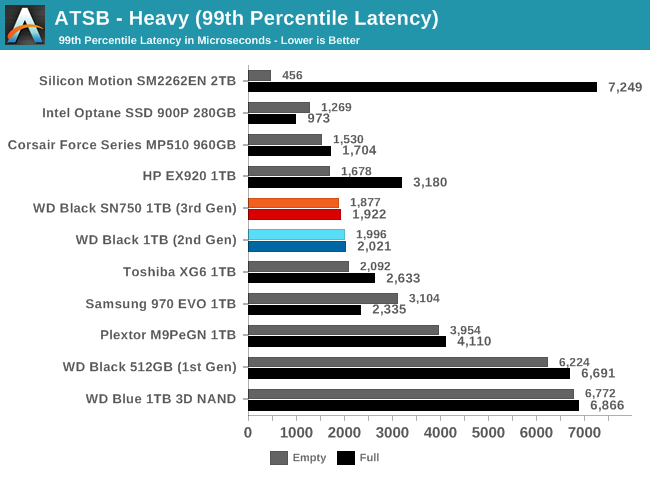
The average and 99th percentile latencies from the new WD Black are not significantly different from last year's model. The Corsair MP510 provides slightly better latency scores using the same flash, and the Silicon Motion SM2262EN-based drives are even faster when the test is run on an empty drive.
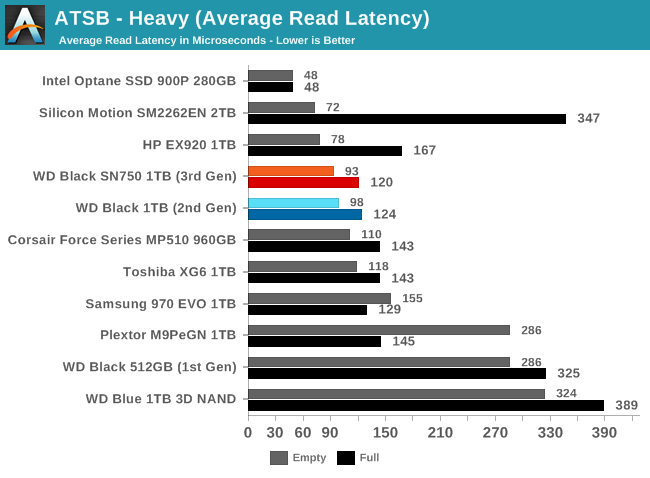
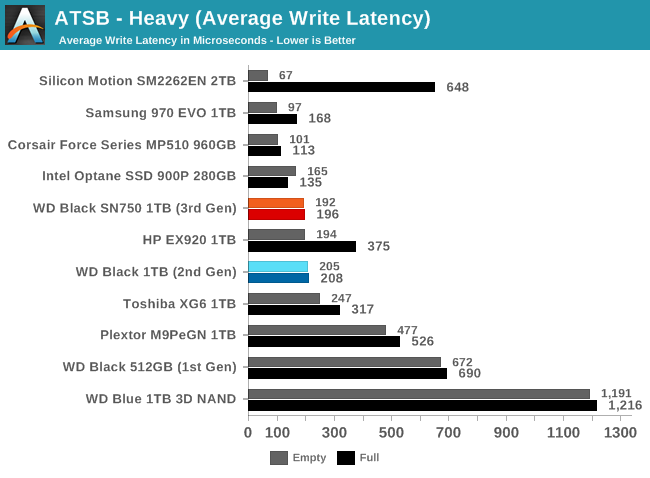
The average read and write latencies from the WD Black SN750 are a tiny bit better than the previous generation, but not enough to change the rankings significantly. The SN750 has one of the best average read latency scores for a full-drive test run, and its empty-drive read latency score comes closer to the best drives than either of its average write latency scores.
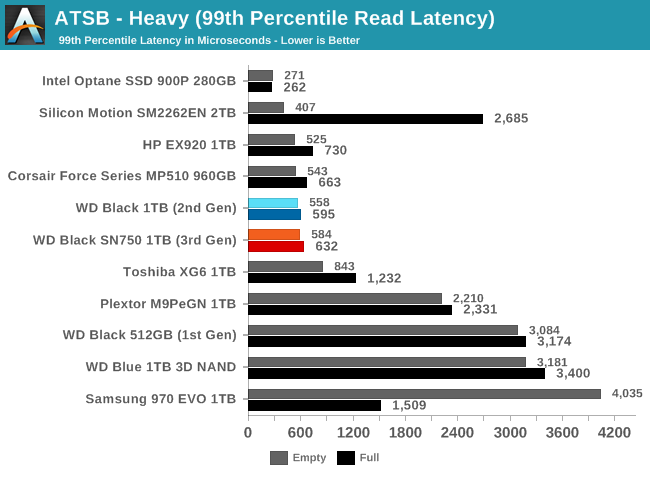
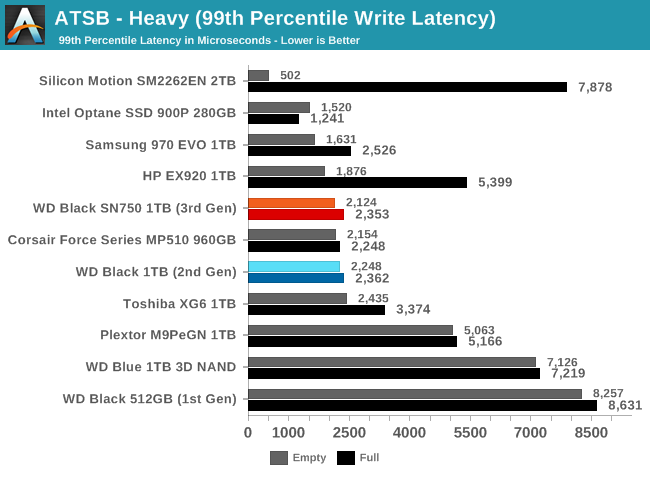
The WD Black SN750 and its predecessor show very little full-drive penalty to 99th percentile read or write latencies, and consequently they have some of the best full-drive QoS scores on the Heavy test. But when the test is run on an empty drive, several other drives score a bit better.
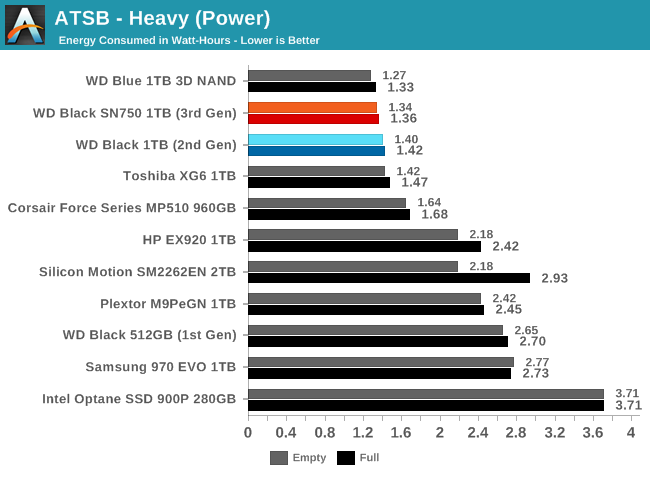
The SN750 is slightly more power efficient than its predecessor, bringing it very close to matching the WD Blue SATA SSD for efficiency while delivering almost three times the overall performance.
AnandTech Storage Bench - Light
Our Light storage test has relatively more sequential accesses and lower queue depths than The Destroyer or the Heavy test, and it's by far the shortest test overall. It's based largely on applications that aren't highly dependent on storage performance, so this is a test more of application launch times and file load times. This test can be seen as the sum of all the little delays in daily usage, but with the idle times trimmed to 25ms it takes less than half an hour to run. Details of the Light test can be found here. As with the ATSB Heavy test, this test is run with the drive both freshly erased and empty, and after filling the drive with sequential writes.
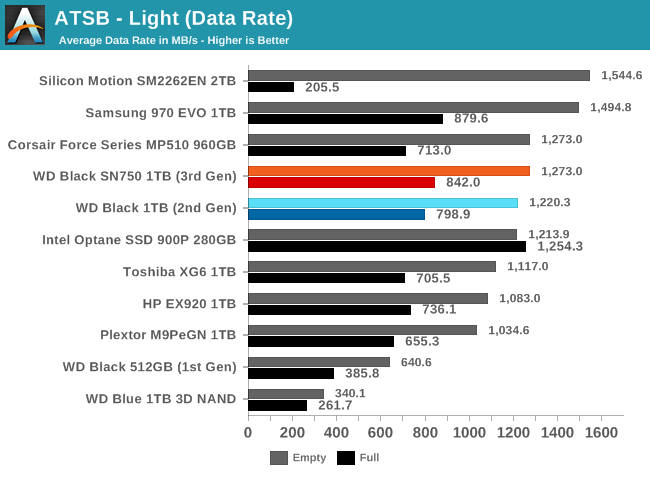
The WD Black SN750 is a few percent faster overall than last year's model, allowing it to tie with the Phison E12-based Corsair MP510 on the Light test. But the Samsung 970 EVO and Silicon Motion SM2262EN-based drives are still substantially faster, at least when the test is run on an empty drive.
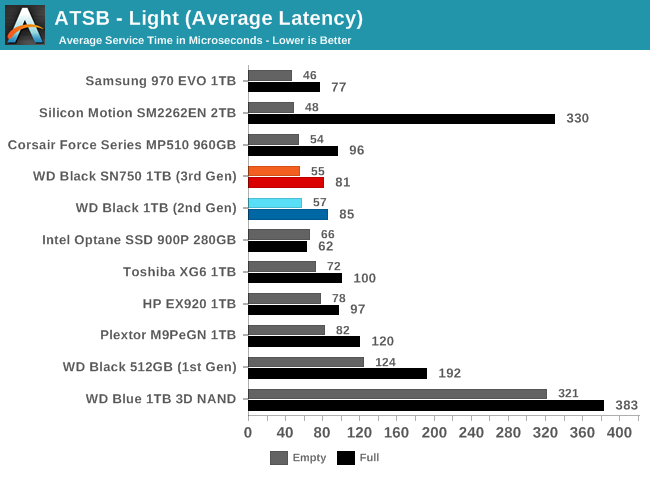
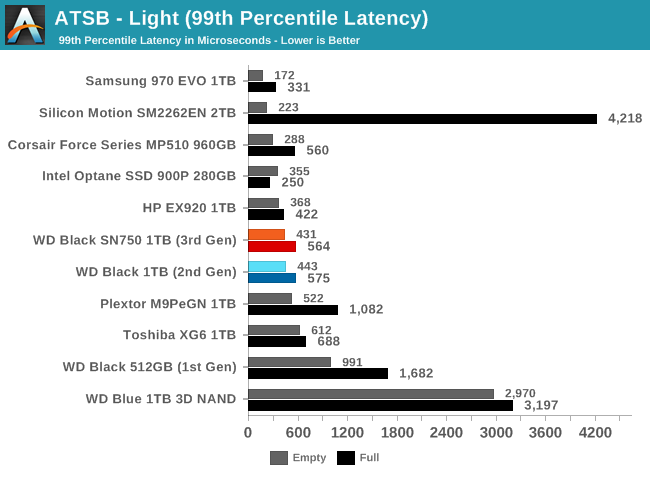
The average and 99th percentile latency scores for the SN750 are a few microseconds faster than its predecessor, which doesn't change the drive's rankings. The average latency scores are pretty close to the fastest drives, but the 99th percentile latency scores are merely average for this product segment.
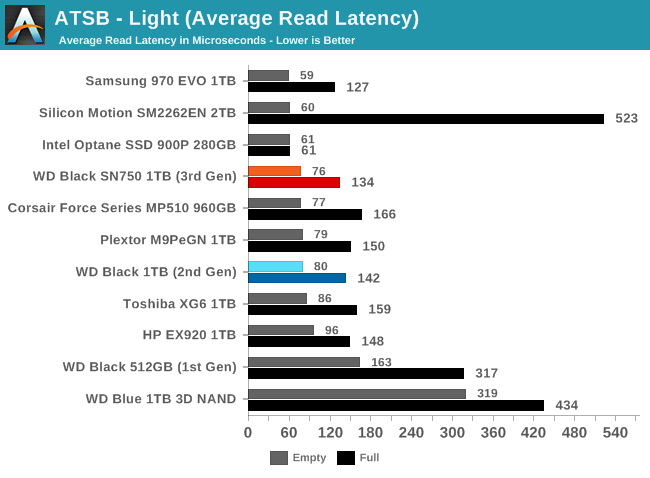
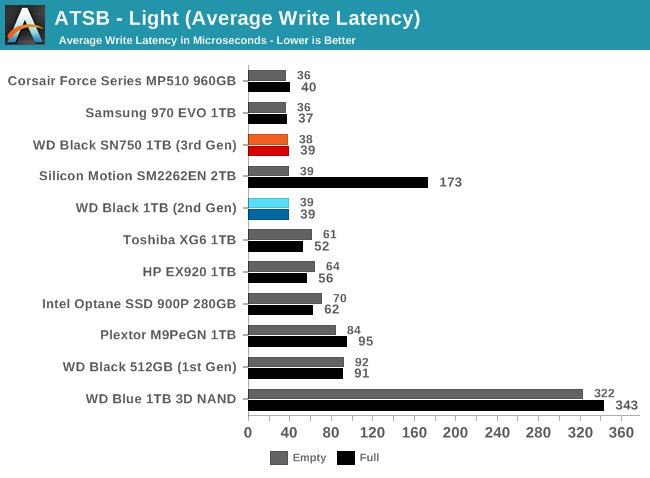
The average write latency scores from the SN750 are virtually tied with the fastest drives, and the average read latency scores are imperceptibly slower than the Samsung 970 EVO.
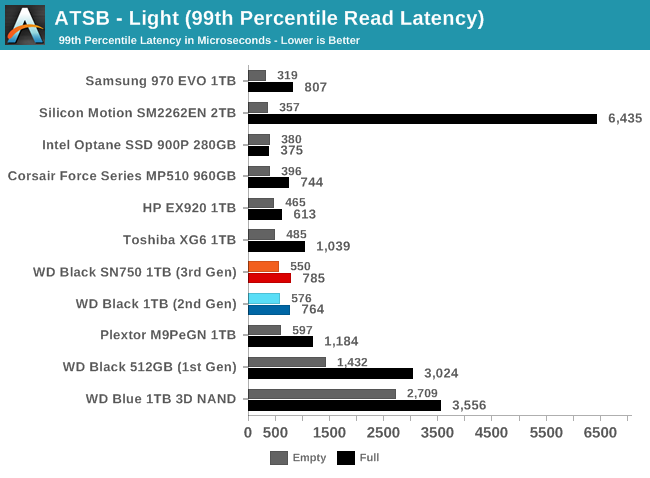
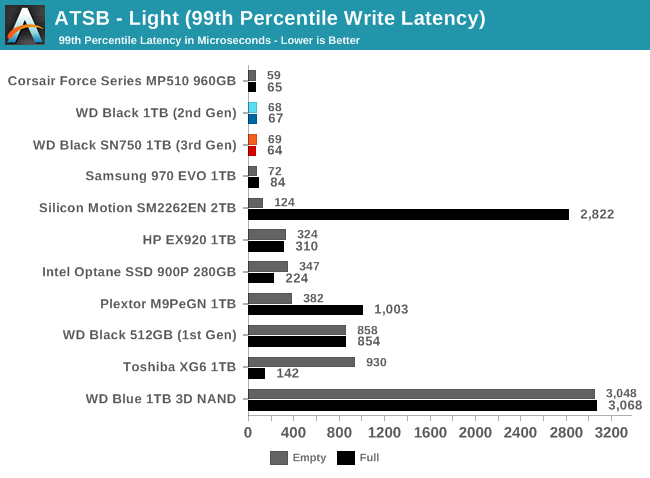
As with average write latency, 99th percentile write latency for the SN750 is basically tied with the fastest drives—every write lands in the SLC cache with minimal delay, even when the test is run on a full drive. The 99th percentile read latencies do not rank as highly, but are still comfortably below 1ms even for the full-drive test run.
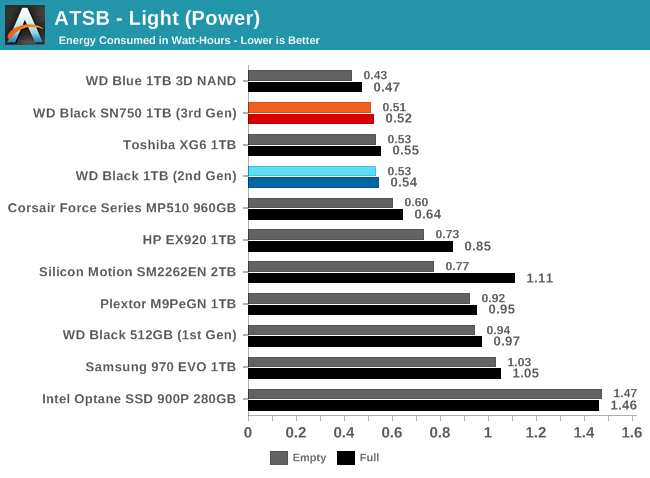
As with the Heavy test, the new WD Black leapfrogs the Toshiba XG6 to retake our record for most energy efficient NVMe SSD on the Light test. There's still a bit of catching up to be done before it matches the WD Blue SATA SSD, but it's still quite an accomplishment for the SN750 to use half the energy required by the Samsung 970 EVO.
Random Read Performance
Our first test of random read performance uses very short bursts of operations issued one at a time with no queuing. The drives are given enough idle time between bursts to yield an overall duty cycle of 20%, so thermal throttling is impossible. Each burst consists of a total of 32MB of 4kB random reads, from a 16GB span of the disk. The total data read is 1GB.
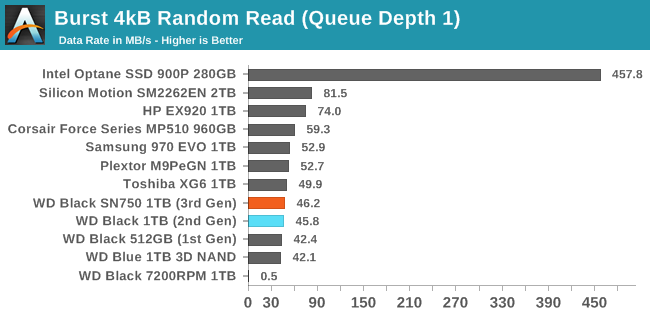
The Toshiba/SanDisk 3D NAND has consistently shown worse burst random read performance than its competition, and the WD Black SN750 does nothing to change that pattern. The SN750 is insignificantly faster than last year's model, but both the Plextor M9Pe and Corsair MP510 get better read latency out of this NAND by pairing it with different controllers.
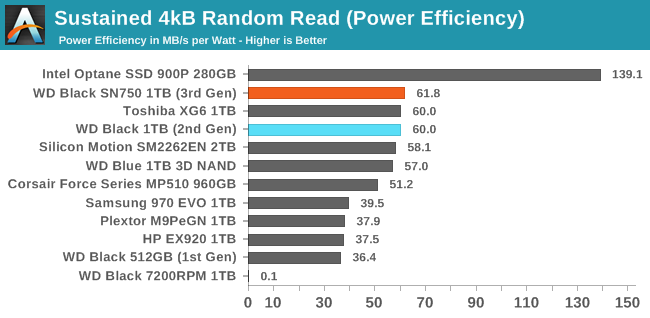
Our sustained random read performance is similar to the random read test from our 2015 test suite: queue depths from 1 to 32 are tested, and the average performance and power efficiency across QD1, QD2 and QD4 are reported as the primary scores. Each queue depth is tested for one minute or 32GB of data transferred, whichever is shorter. After each queue depth is tested, the drive is given up to one minute to cool off so that the higher queue depths are unlikely to be affected by accumulated heat build-up. The individual read operations are again 4kB, and cover a 64GB span of the drive.
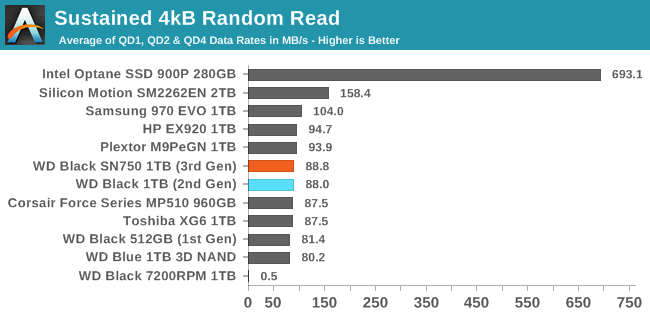
On the longer random read test that also brings in some higher queue depths, the WD Black SN750 is still quite a bit slower than the best combinations of Silicon Motion controller and Micron NAND, but at least this time the drives that use the same Toshiba/SanDisk BiCS3 NAND with different controllers aren't so far ahead of the WD Black.
 |
|||||||||
| Power Efficiency in MB/s/W | Average Power in W | ||||||||
The WD Black SN750 is just a touch more efficient than its predecessor on the random read test, allowing it to retake a small lead among TLC-based drives here rather than being in a tie with the Toshiba XG6.
 |
|||||||||
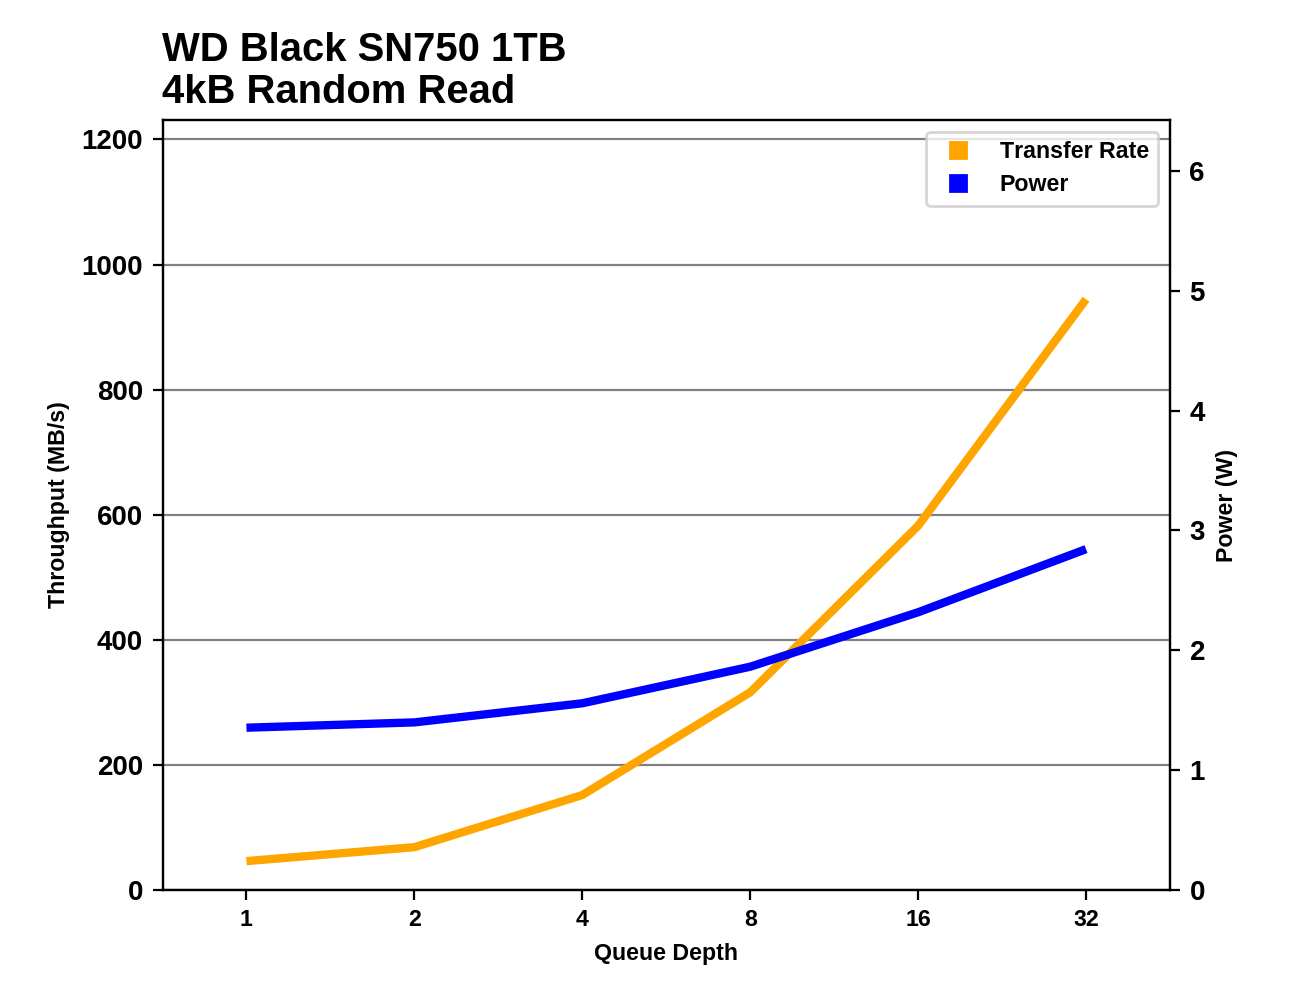
When the WD Black SN750 is pitted against most of last year's competition, it does at least catch up if not pull ahead in random read performance at higher queue depths, while never requiring as much power. But the Silicon Motion SM2262EN drives are faster at all queue depths, though not in proportion to how much more power they require.
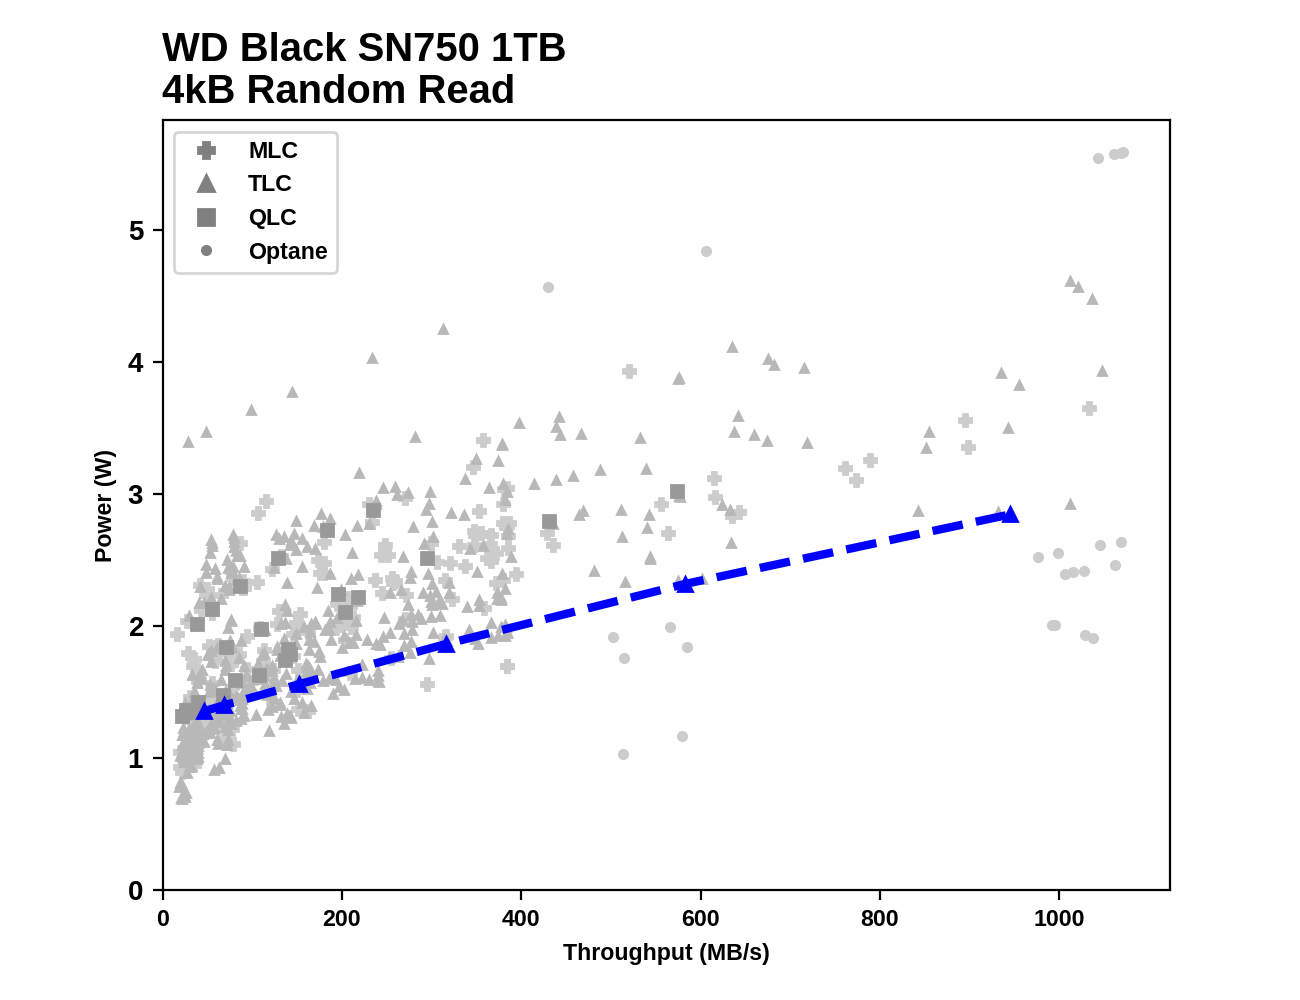
At low queue depths the random read performance of the WD Black SN750 is down in SATA performance territory where some drives can beat it on performance and power consumption. But at higher queue depths, it is obviously the most efficient NAND-based SSD we've tested for random reads.
Random Write Performance
Our test of random write burst performance is structured similarly to the random read burst test, but each burst is only 4MB and the total test length is 128MB. The 4kB random write operations are distributed over a 16GB span of the drive, and the operations are issued one at a time with no queuing.
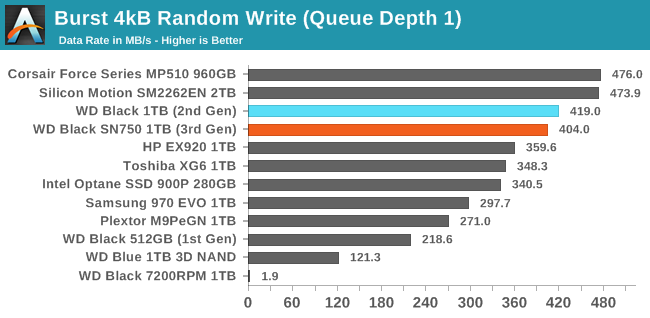
The WD Black SN750 shows a small regression in burst random write performance compared to last year's model. The Corsair MP510 and Silicon Motion SM2262EN engineering sample are nearly tied for first place, with the WD Blacks about 15% slower.
As with the sustained random read test, our sustained 4kB random write test runs for up to one minute or 32GB per queue depth, covering a 64GB span of the drive and giving the drive up to 1 minute of idle time between queue depths to allow for write caches to be flushed and for the drive to cool down.
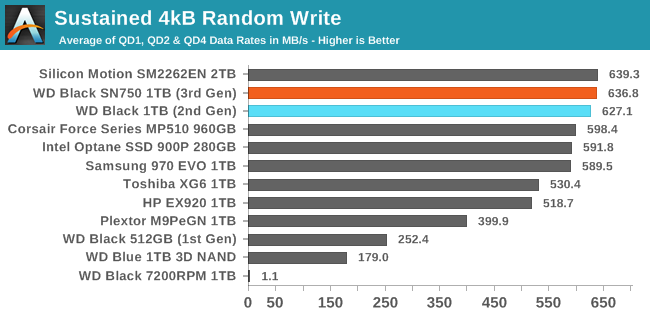
On the longer random write test that brings in higher queue depths, the WD Black SN750 is roughly tied with the SM2262EN sample for first place and is a few percent faster than competitors like the Samsung 970 EVO and Corsair MP510.
 |
|||||||||
| Power Efficiency in MB/s/W | Average Power in W | ||||||||
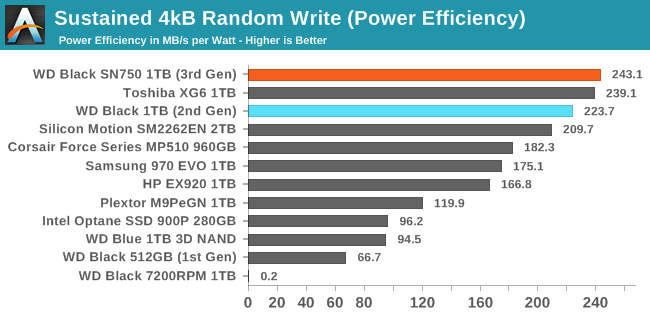
The SN750 is the most power efficient NVMe drive on our random write test, pulling slightly ahead of the Toshiba XG6 and the older WD Black, and maintaining a substantial lead over most other high-end NVMe drives.
 |
|||||||||
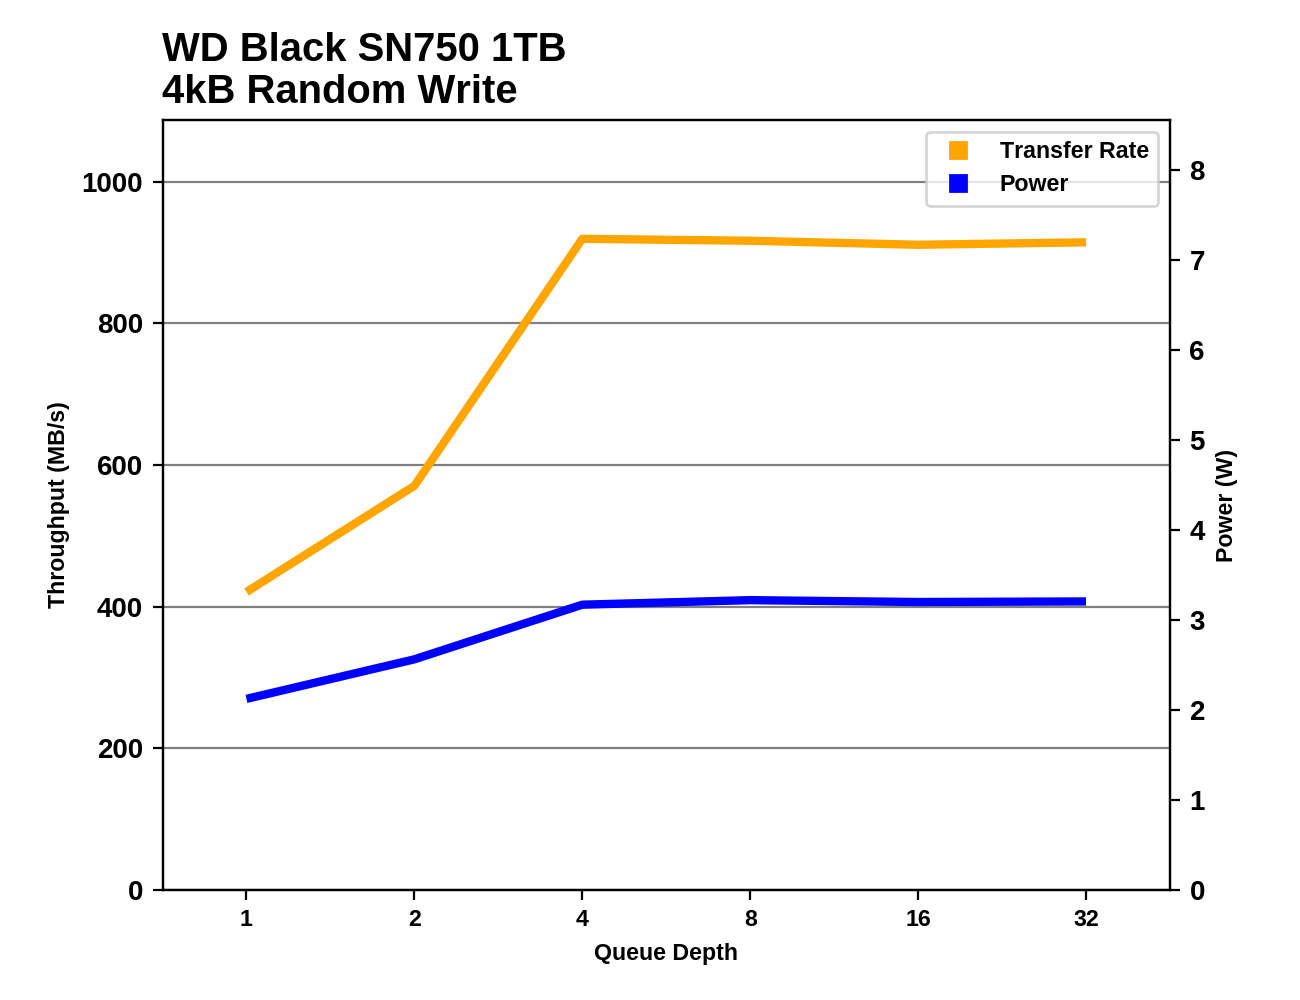
The WD Black SN750 hits full speed for random writes with a queue depth of 4 or higher, and maintains steady performance for the rest of the test while drawing just over 3 W.
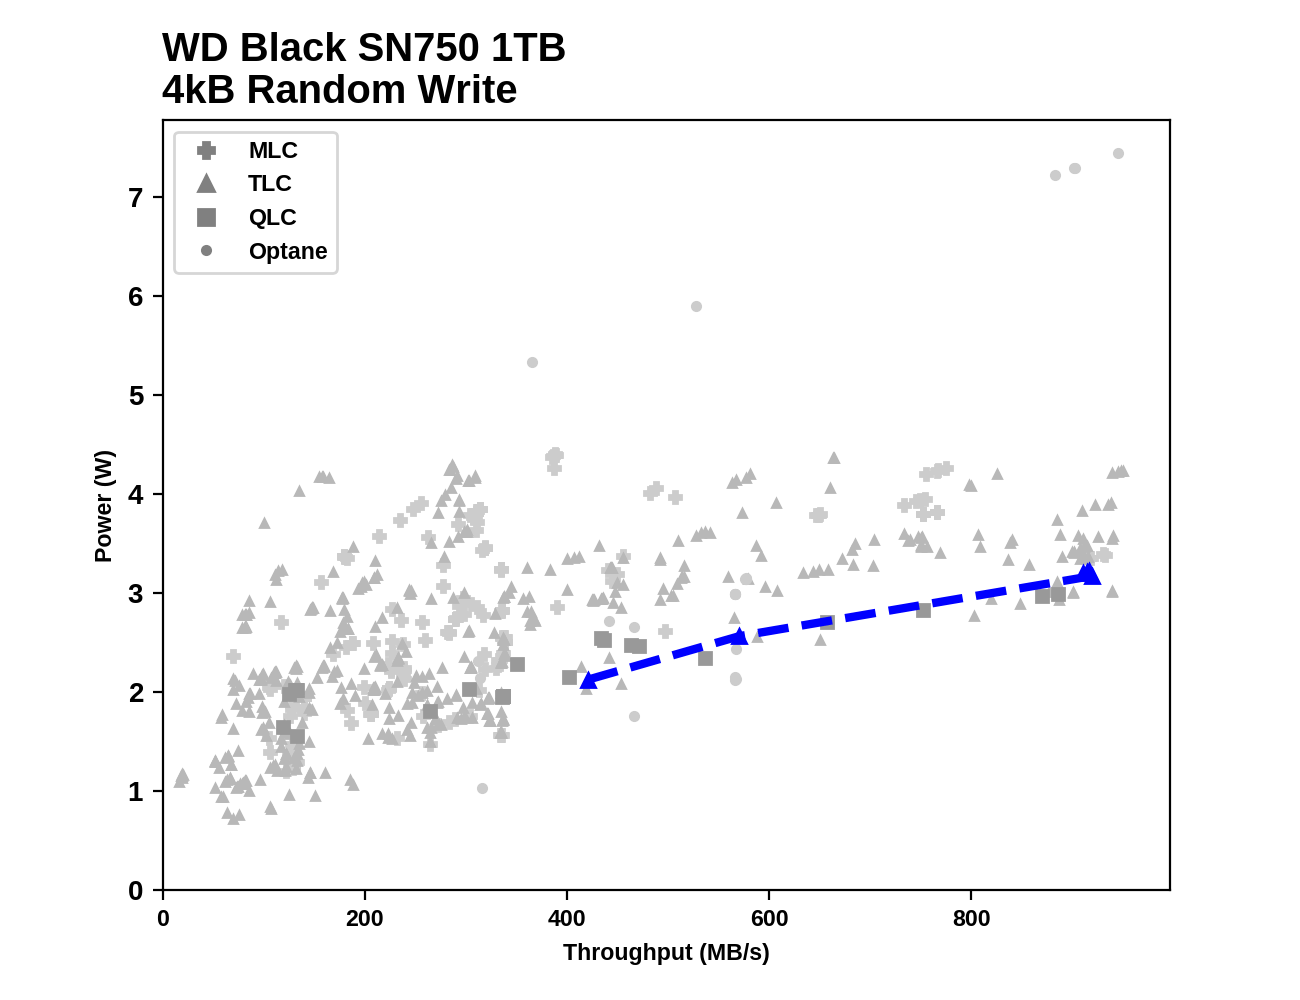
The WD Black SN750 is very close to the being the most efficient flash-based SSD for random writes that we've ever tested, but there are a few data points in the archive that are slightly faster at similar power levels.
Sequential Read Performance
Our first test of sequential read performance uses short bursts of 128MB, issued as 128kB operations with no queuing. The test averages performance across eight bursts for a total of 1GB of data transferred from a drive containing 16GB of data. Between each burst the drive is given enough idle time to keep the overall duty cycle at 20%.
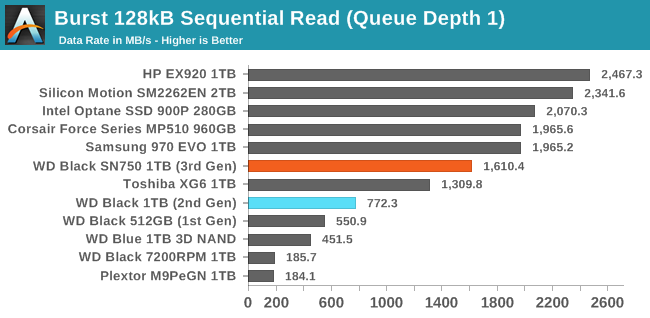
The queue depth 1 burst sequential read performance of the WD Black SN750 is faster than its predecessor, but there's still a lot of room for improvement relative to the fastest TLC SSDs and even the Corsair MP510 that relies on the same BiCS3 NAND as the SN750.
Our test of sustained sequential reads uses queue depths from 1 to 32, with the performance and power scores computed as the average of QD1, QD2 and QD4. Each queue depth is tested for up to one minute or 32GB transferred, from a drive containing 64GB of data. This test is run twice: once with the drive prepared by sequentially writing the test data, and again after the random write test has mixed things up, causing fragmentation inside the SSD that isn't visible to the OS. These two scores represent the two extremes of how the drive would perform under real-world usage, where wear leveling and modifications to some existing data will create some internal fragmentation that degrades performance, but usually not to the extent shown here.
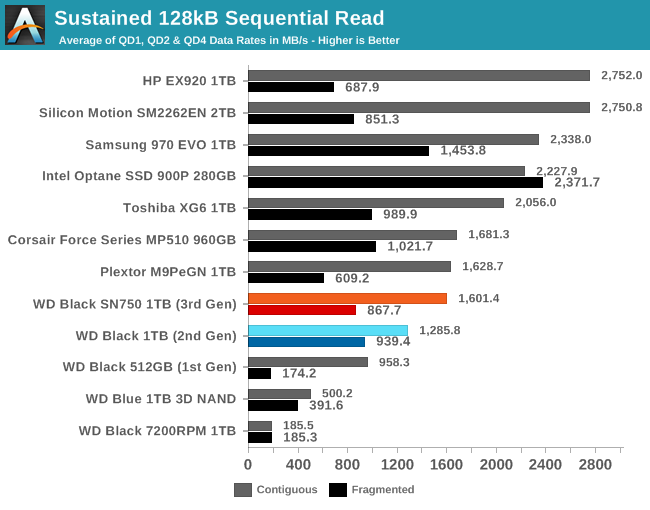
The performance of the WD Black SN750 on the longer sequential read test is a bit better than the previous model and more in line with other drives that use the same NAND, but still much slower than the top NVMe drives on this test. The performance when reading data that was not written to the drive sequentially has regressed slightly but is still decent for this class of drive.
 |
|||||||||
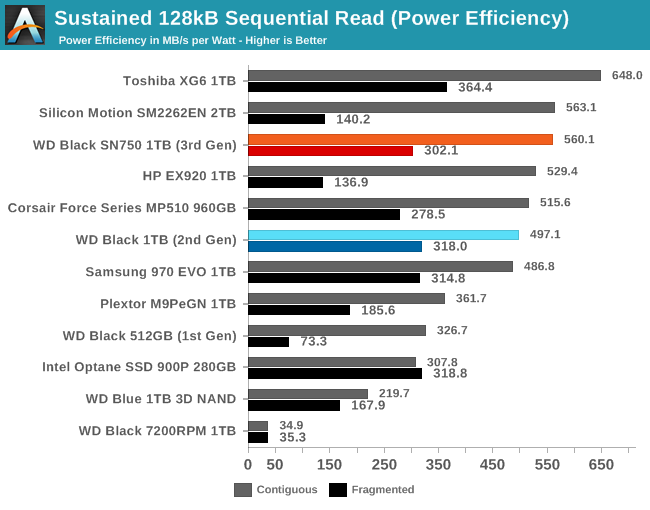
| Power Efficiency in MB/s/W | Average Power in W | ||||||||
Despite relatively low performance, the SN750 still manages to be tied for second place in the power efficiency ranking, scoring about 13% lower than the Toshiba XG6.
 |
|||||||||
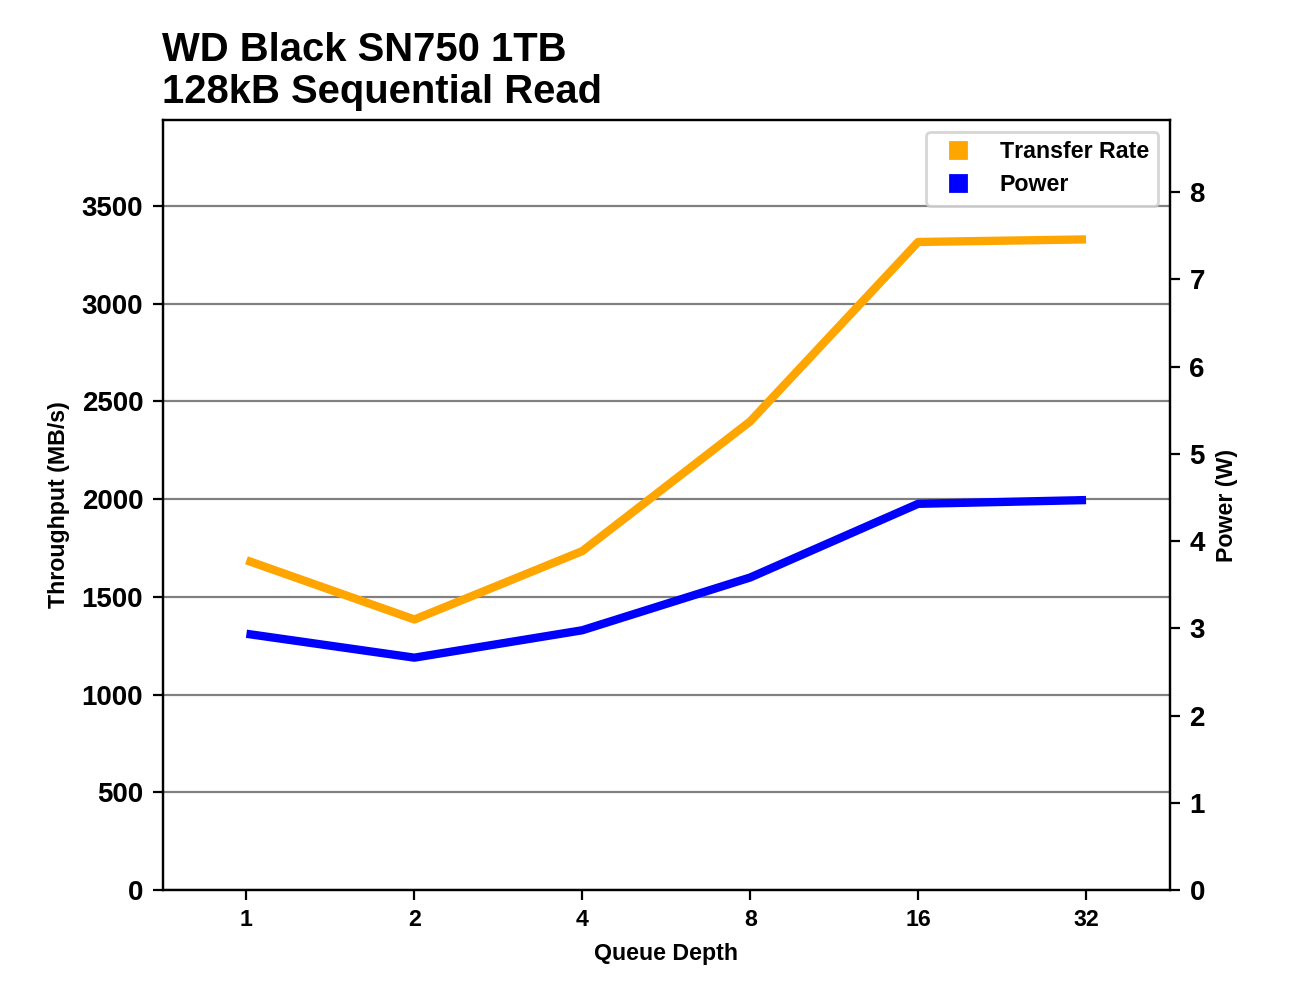
The WD Black SN750 suffers during the early stages of the sequential read test and doesn't hit its full read speed until the queue depth reaches about 16. The performance profile is very similar to last year's model save for a significant improvement at QD1. Several other drives also require fairly high queue depths to reach full speed, but most of the relevant competition has better low-QD performance than the WD Black.
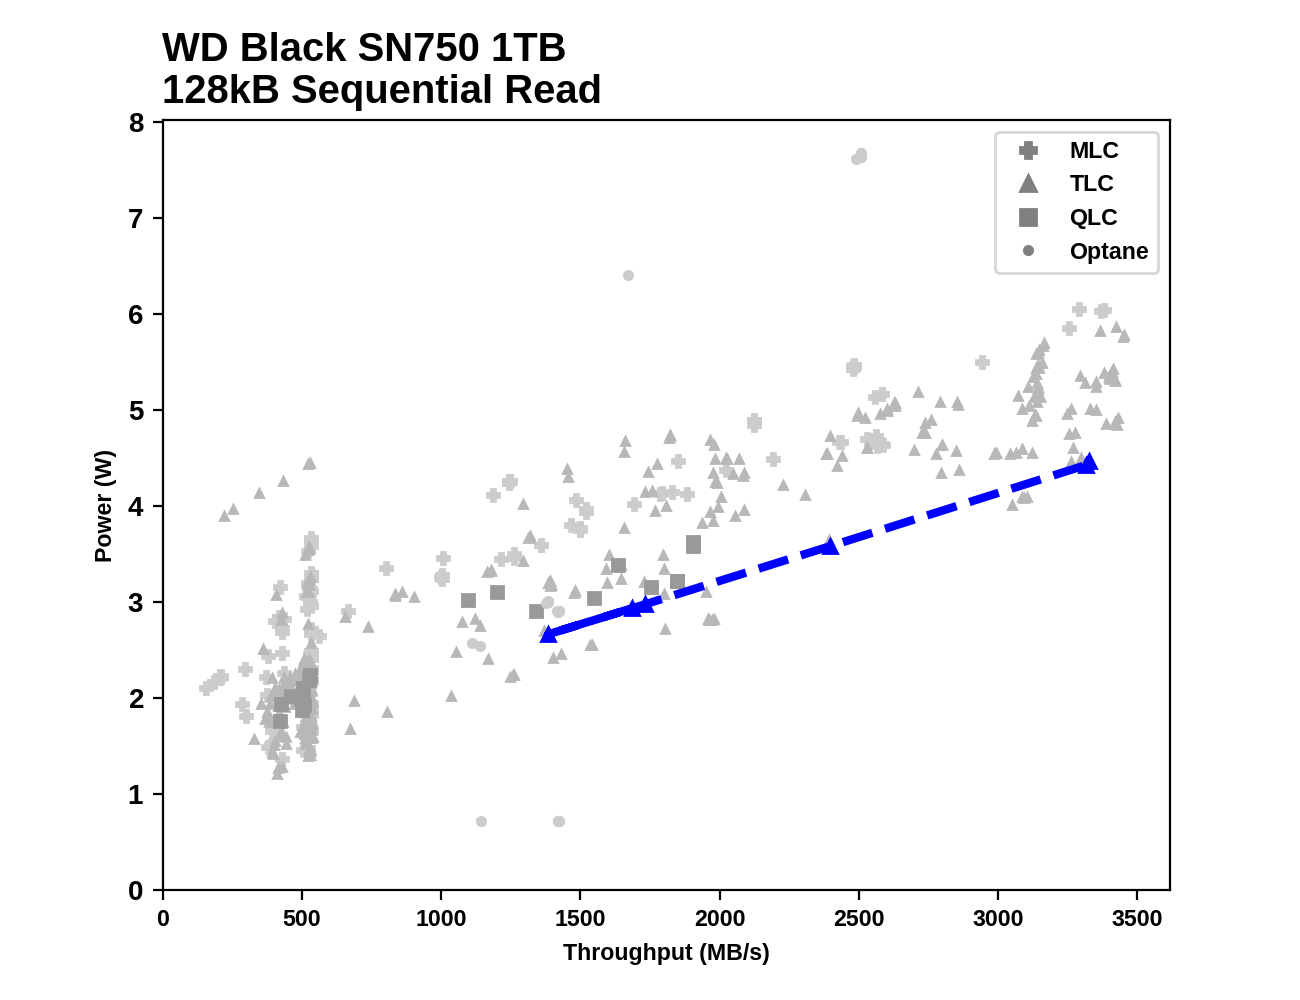
Even though the WD Black starts off slow, it still is fairly power efficient throughout the sequential read test and there are only few drives that offer better performance per Watt at any speed.
Sequential Write Performance
Our test of sequential write burst performance is structured identically to the sequential read burst performance test save for the direction of the data transfer. Each burst writes 128MB as 128kB operations issued at QD1, for a total of 1GB of data written to a drive containing 16GB of data.
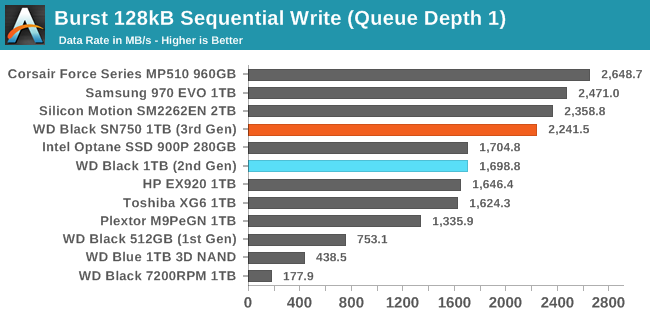
As with sequential reads, the QD1 burst sequential write performance of the WD Black SN750 is significantly improved over the previous model, and this time it gets relatively close to the top tier of drives.
Our test of sustained sequential writes is structured identically to our sustained sequential read test, save for the direction of the data transfers. Queue depths range from 1 to 32 and each queue depth is tested for up to one minute or 32GB, followed by up to one minute of idle time for the drive to cool off and perform garbage collection. The test is confined to a 64GB span of the drive.
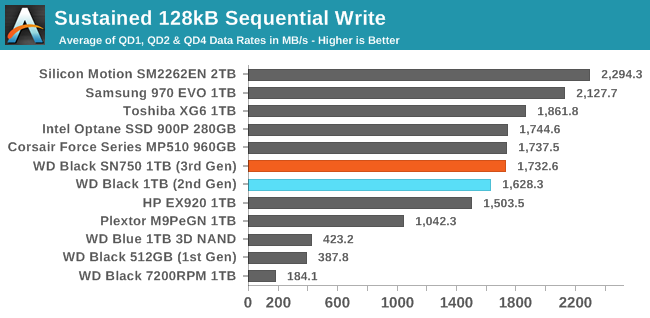
The SN750 also improves slightly on the longer sequential write test that adds in some higher queue depths, bringing it up to the level of the Corsair MP510 but still a bit behind the Toshiba XG6 and well behind the fastest TLC-based competition.
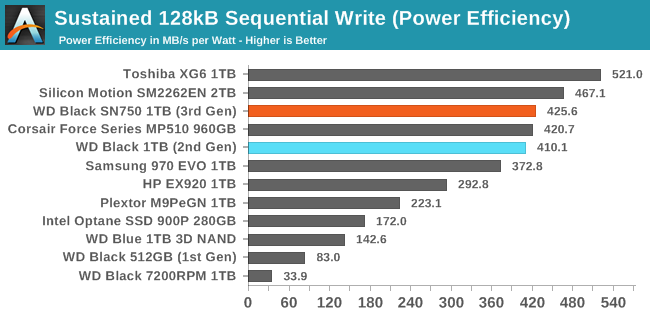 |
|||||||||
| Power Efficiency in MB/s/W | Average Power in W | ||||||||
The SN750 can't claim another efficiency win due to its performance that is merely average for this product segment, but the efficiency score is still pretty good.
 |
|||||||||
The SN750's sequential write performance increases slightly from QD1 to QD2 and remains steady for the rest of the test. The top-performing SM2262EN sample doesn't hit full speed until QD4, at which point it is faster than the SN750 by almost 1GB/s.
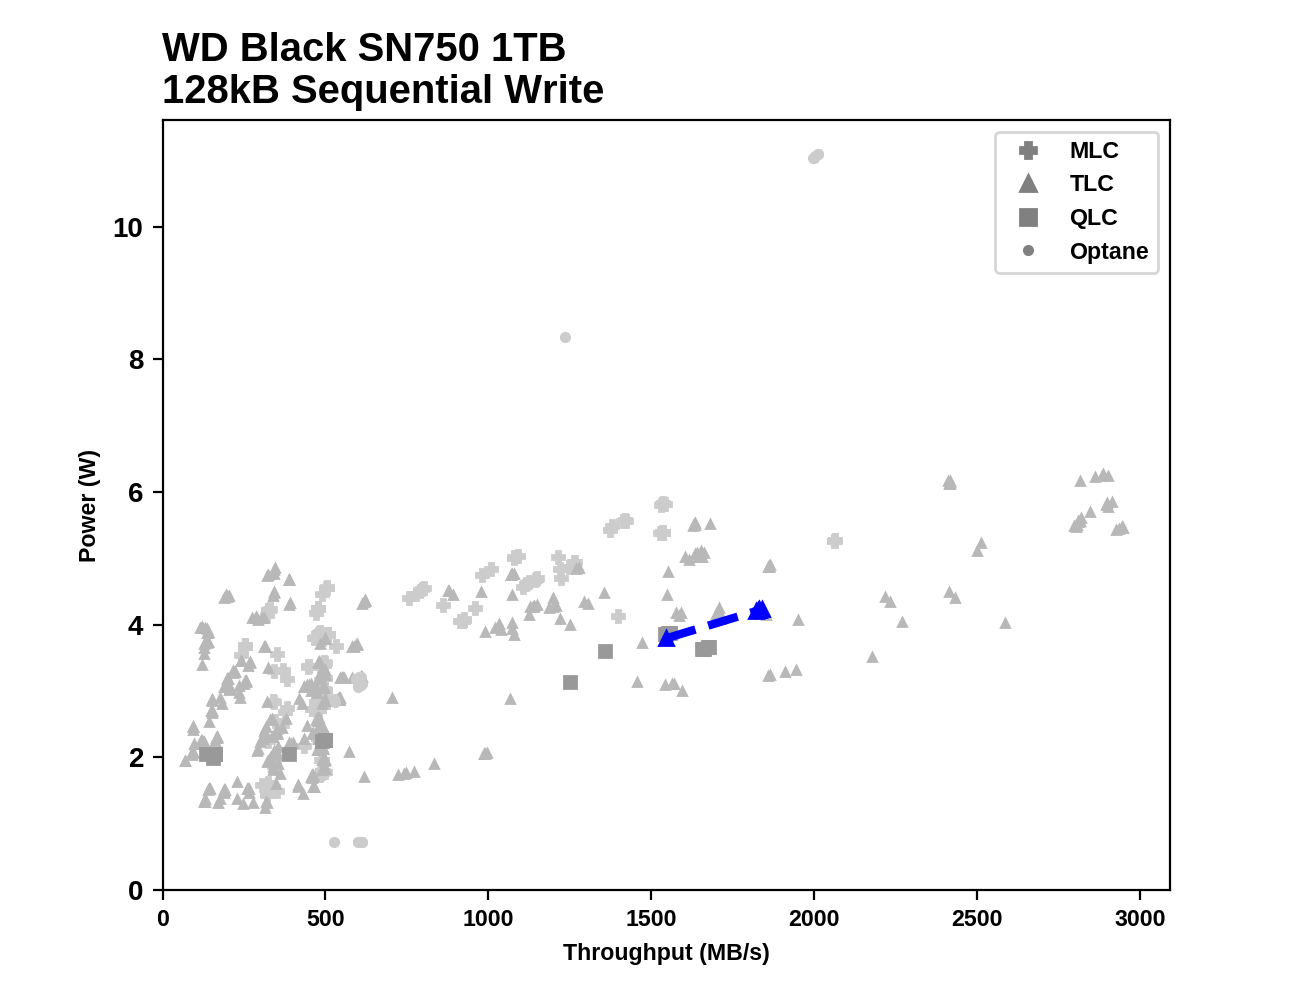
Among all the drives that have run through this test, the performance and power consumption of the SN750 both appear fairly middle of the road by NVMe standards; there are some drives that save almost 1W at the same speed, and a few that are far faster at similar power levels.
Mixed Random Performance
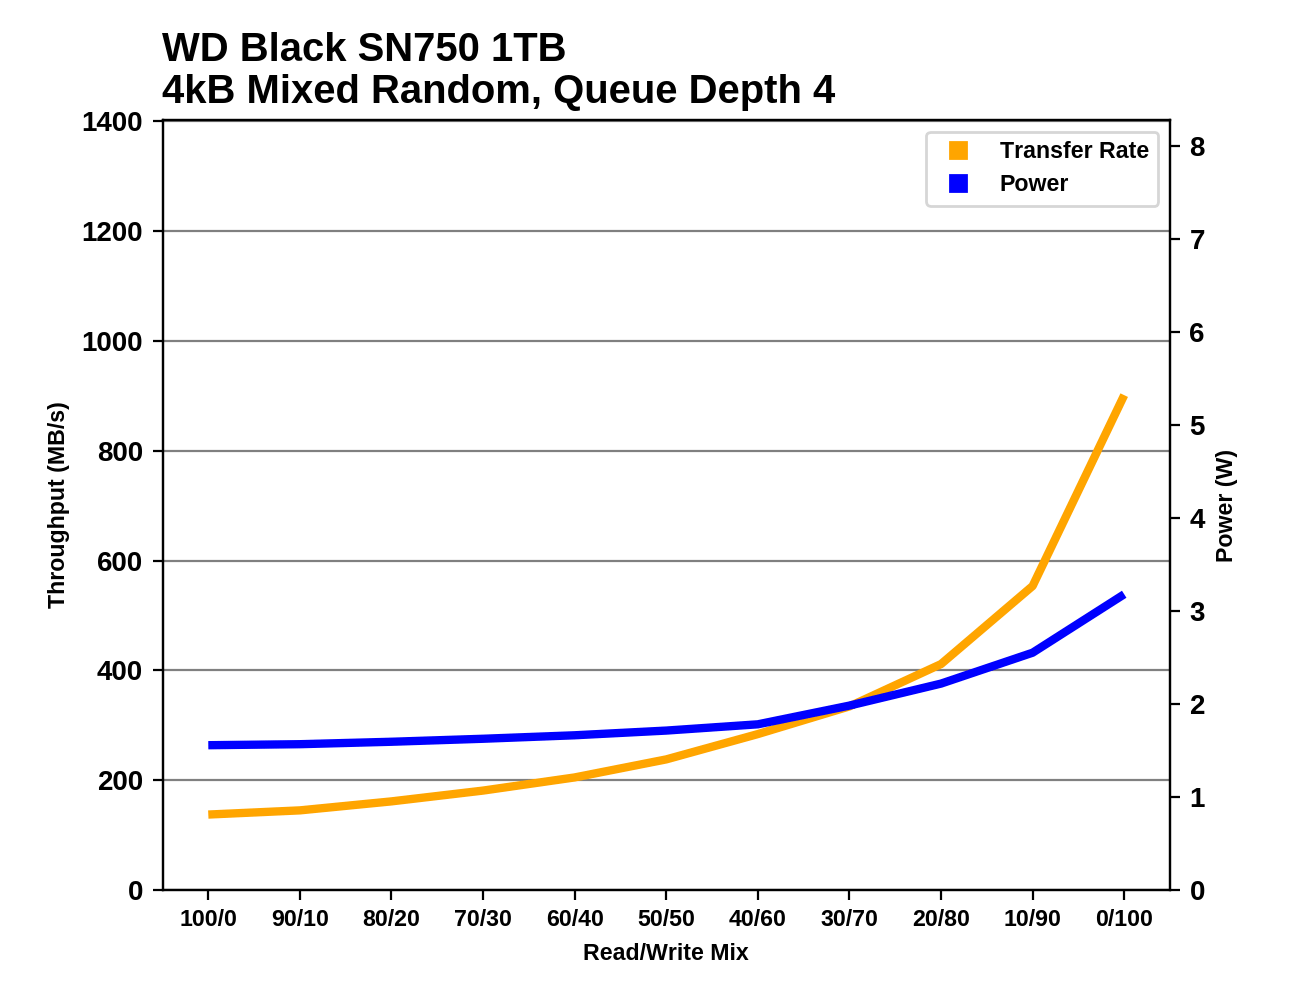
Our test of mixed random reads and writes covers mixes varying from pure reads to pure writes at 10% increments. Each mix is tested for up to 1 minute or 32GB of data transferred. The test is conducted with a queue depth of 4, and is limited to a 64GB span of the drive. In between each mix, the drive is given idle time of up to one minute so that the overall duty cycle is 50%.
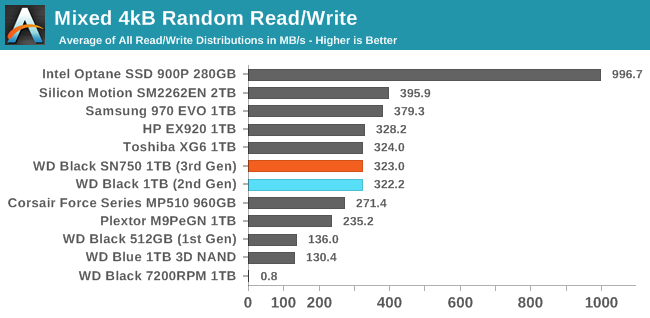
The overall mixed random IO performance of the Western Digital WD Black SN750 is about the same as the previous version, as well as the Toshiba XG6 and HP EX920. These are the second-tier drives that are a bit slower than the SM2262EN and the Samsung 970 EVO.
 |
|||||||||
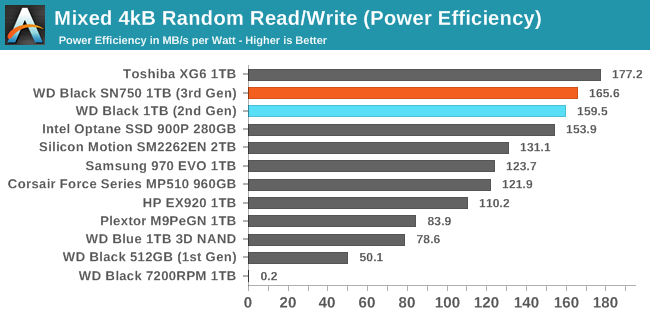
| Power Efficiency in MB/s/W | Average Power in W | ||||||||
The SN750 and the Toshiba XG6 have almost exactly the same overall performance on this test, but the XG6 has 7% better performance per Watt. The second place score of the SN750 is still well above average—ignoring the outgoing WD Black, the SN750's performance per Watt is about 26% better than the next best TLC drive.
 |
|||||||||
The two flash-based drives that substantially outperform the SN750 on the mixed random IO test are faster through almost all of the test's phases, while the drives that are roughly tied with the SN750 tend to be a bit faster through the more read-heavy parts of the test and fall behind when the workload becomes very write-heavy.
Mixed Sequential Performance
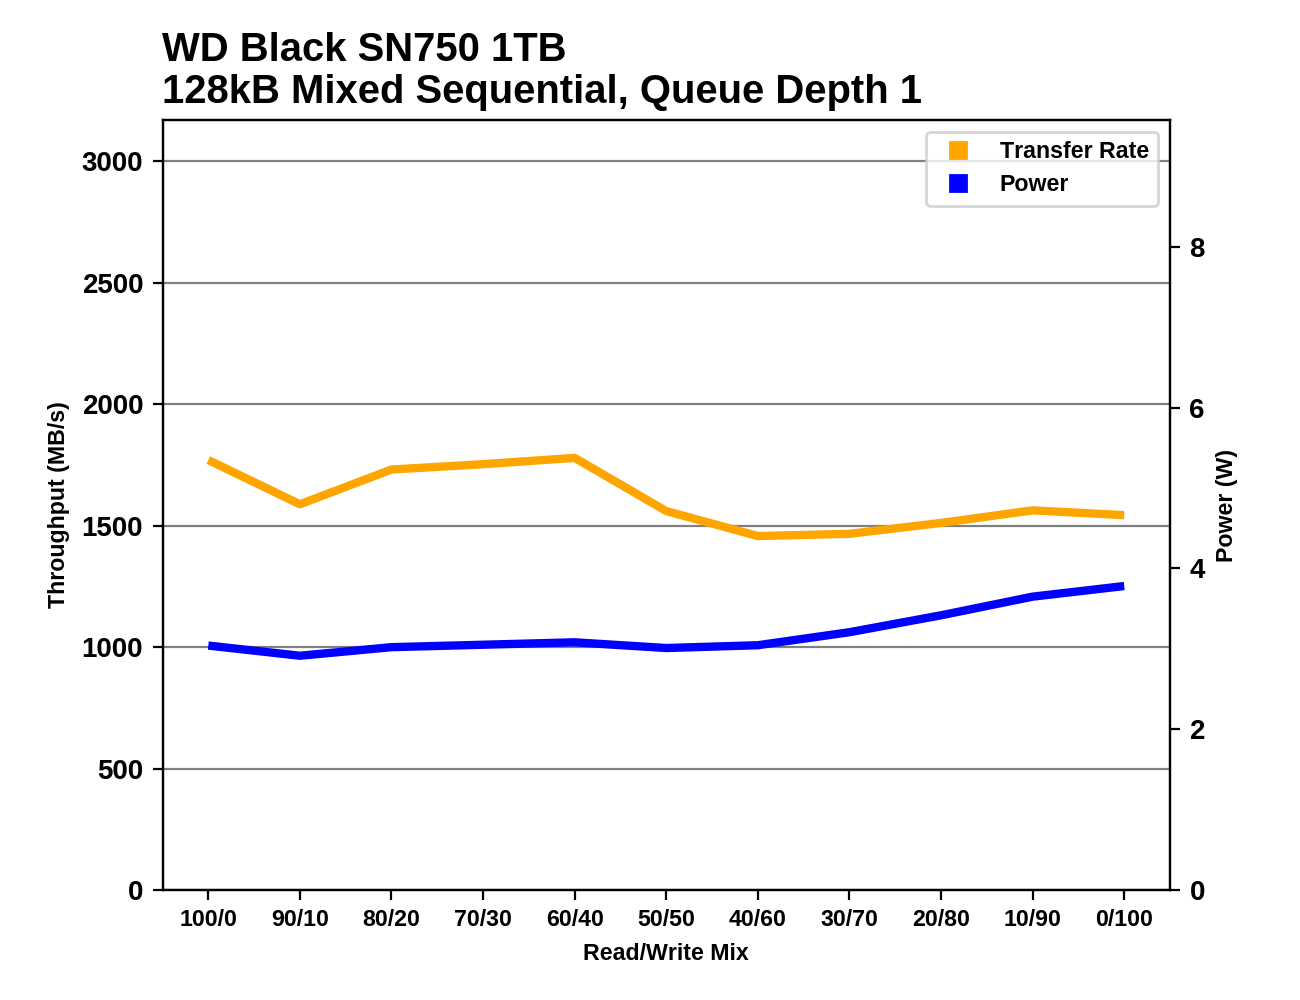
Our test of mixed sequential reads and writes differs from the mixed random I/O test by performing 128kB sequential accesses rather than 4kB accesses at random locations, and the sequential test is conducted at queue depth 1. The range of mixes tested is the same, and the timing and limits on data transfers are also the same as above.
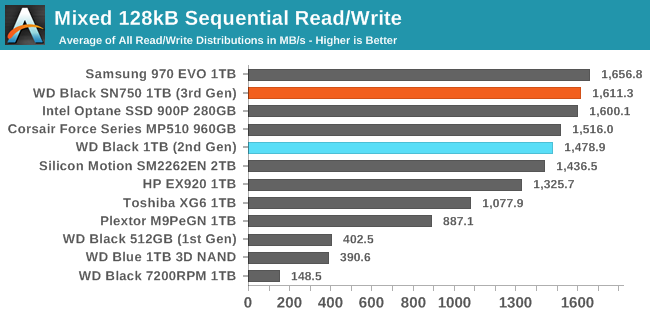
The WD Black SN750 improves upon its predecessor's performance on the mixed sequential IO test, but not quit enough to take the top spot on the performance ranking. The Samsung 970 EVO is a few percent faster overall.
 |
|||||||||
| Power Efficiency in MB/s/W | Average Power in W | ||||||||
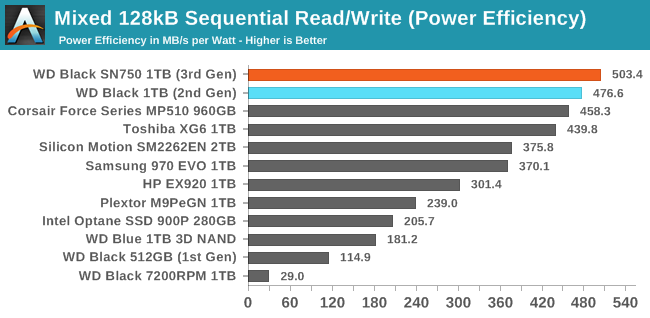
The SN750 has a clear lead in the efficiency scores, improving upon the previous record set by last year's model that remained largely unchallenged, though the Toshiba XG6 and Corsair MP510 did come close. The average power consumption of the SN750 is slightly higher than the previous WD Black but that is more than offset by the higher average performance.
 |
|||||||||
The WD Black SN750 only barely drops below 1.5GB/s at its worst during the mixed sequential IO test, and it performs a bit better during the more read-heavy half of the test. The other drives all have worst-case performance that's slower than the SN750 by at least a few hundred MB/s, but many of those drives also have significantly better peak performance, most often at the read-heavy end of the test.
Power Management Features
Real-world client storage workloads leave SSDs idle most of the time, so the active power measurements presented earlier in this review only account for a small part of what determines a drive's suitability for battery-powered use. Especially under light use, the power efficiency of a SSD is determined mostly be how well it can save power when idle.
For many NVMe SSDs, the closely related matter of thermal management can also be important. M.2 SSDs can concentrate a lot of power in a very small space. They may also be used in locations with high ambient temperatures and poor cooling, such as tucked under a GPU on a desktop motherboard, or in a poorly-ventilated notebook.
| WD Black SN750 NVMe Power and Thermal Management Features |
|||
| Controller | SanDisk 20-82-007011 | ||
| Firmware | 102000WD | ||
| NVMe Version |
Feature | Status | |
| 1.0 | Number of operational (active) power states | 3 | |
| 1.1 | Number of non-operational (idle) power states | 2 | |
| Autonomous Power State Transition (APST) | Supported | ||
| 1.2 | Warning Temperature | 80 °C | |
| Critical Temperature | 85 °C | ||
| 1.3 | Host Controlled Thermal Management | Supported | |
| Non-Operational Power State Permissive Mode | Not Supported | ||
The WD Black SN750 supports the typical power and thermal management features we expect from recent drives, including a reasonably high warning temperature of 80 degrees. The idle power states declare fairly quick transition times, especially for the PS3 intermediate idle.
| WD Black SN750 NVMe Power States |
|||||
| Controller | SanDisk 20-82-007011 | ||||
| Firmware | 102000WD | ||||
| Power State |
Maximum Power |
Active/Idle | Entry Latency |
Exit Latency |
|
| PS 0 | 6 W | Active | - | - | |
| PS 1 | 3.5 W | Active | - | - | |
| PS 2 | 3 W | Active | - | - | |
| PS 3 | 100 mW | Idle | 4 ms | 10 ms | |
| PS 4 | 2.5 mW | Idle | 4 ms | 45 ms | |
Note that the above tables reflect only the information provided by the drive to the OS. The power and latency numbers are often very conservative estimates, but they are what the OS uses to determine which idle states to use and how long to wait before dropping to a deeper idle state.
Idle Power Measurement
SATA SSDs are tested with SATA link power management disabled to measure their active idle power draw, and with it enabled for the deeper idle power consumption score and the idle wake-up latency test. Our testbed, like any ordinary desktop system, cannot trigger the deepest DevSleep idle state.
Idle power management for NVMe SSDs is far more complicated than for SATA SSDs. NVMe SSDs can support several different idle power states, and through the Autonomous Power State Transition (APST) feature the operating system can set a drive's policy for when to drop down to a lower power state. There is typically a tradeoff in that lower-power states take longer to enter and wake up from, so the choice about what power states to use may differ for desktop and notebooks.
We report two idle power measurements. Active idle is representative of a typical desktop, where none of the advanced PCIe link or NVMe power saving features are enabled and the drive is immediately ready to process new commands. The idle power consumption metric is measured with PCIe Active State Power Management L1.2 state enabled and NVMe APST enabled if supported.
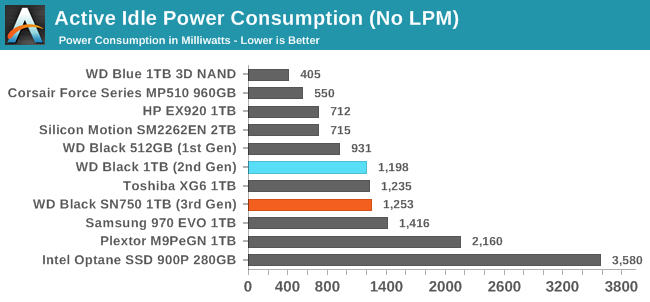
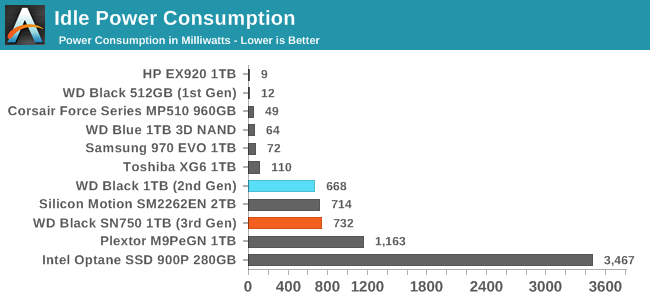
The WD Black SN750 has slightly higher idle power consumption than its predecessor, both with idle states enabled and with them disabled. The SN750 is one of a few NVMe drives that cannot even come close to a reasonably deep sleep state on our desktop testbed, a problem that seems to be hard for the industry to eliminate for good.
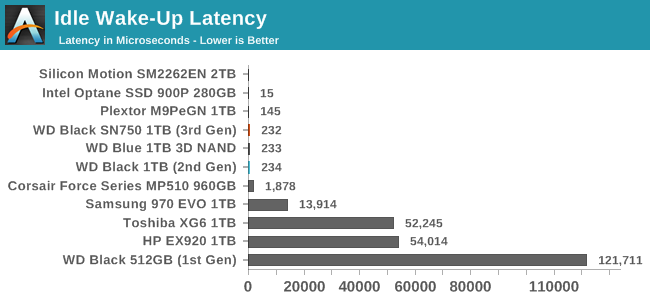
Given the relatively poor idle power savings achieved with our desktop testbed, it's good to see the SN750's wake-up latency is so low, at under a quarter of a millisecond.
Conclusion
The new WD Black SN750 changes little from last year's model. Since it uses the same controller and NAND flash memory as the previous WD Black, the SN750 had little room for improvement. With optimized firmware for WD's still relatively new in-house NVMe controller architecture, the SN750 manages to mostly avoid performance regressions and deliver fairly consistent performance and efficiency improvements of a few percent. For all practical purposes, the new WD Black SN750 can be regarded as more or less identical to its predecessor, except that the SN750 is launching at far better prices, and will soon be adding a 2TB model.
By 2018 standards, the new WD Black is still a very competitive high-end NVMe SSD, and probably the best overall SSD using Toshiba/SanDisk 3D NAND. But the WD Black SN750 is hardly the only new competitor in this space that we'll see in 2019. Drives using Silicon Motion's SM2262EN controller and Micron 64-layer 3D NAND started to hit the market by the end of 2018, and we'll have reviews of two of them soon (the ADATA SX8200 Pro and HP EX950). Some companies will also be introducing 96-layer 3D NAND—Samsung announced last fall that the 970 EVO would be replaced by a 970 EVO Plus that updates the NAND but keeps the same controller, and Plextor's M10Pe should land in the second half of the year.
Western Digital may come to regret their decision to make the SN750 such a minimal update over last year's model, because it doesn't appear that their competition will be sitting still. PCIe 4.0 will hit the consumer market later this year and Phison at least will be ready with a new controller. The transition to 96L 3D NAND will also be driving demand for a new generation of controllers, because the next-generation NAND supports higher IO speeds than many current controllers. We probably won't hear of any specific product announcements until Computex at the earliest, but by the end of 2019 there's a good chance we'll see several new SSDs that make all the major upgrades Western Digital avoided this time around.
Overall, WD's first in-house NVMe controller looks good to go for another year, but Western Digital will need a significant controller update for 2020 and they'll need to move to 96L by then. They were well positioned to get by with such a minor update to the WD Black, but now they are vulnerable to falling behind should any of their competitors execute well on a significant hardware upgrade sometime this year. The SN750 may not stay at the top for long.
| 240-280GB | 480-512GB | 960GB-1TB | 2TB | |
| Western Digital WD Black SN750 (MSRP) | $79.99 (32¢/GB) | $129.99 (26¢/GB) | $249.99 (25¢/GB) | $499.99 (25¢/GB) |
| Western Digital WD Black (2018) | $79.99 (32¢/GB) | $119.99 (24¢/GB) | $226.99 (23¢/GB) | |
| ADATA XPG SX8200 Pro | $74.99 (29¢/GB) | $114.99 (22¢/GB) | $199.95 (20¢/GB) | |
| HP EX920 | $57.99 (23¢/GB) | $89.99 (18¢/GB) | $174.99 (17¢/GB) | |
| Mushkin Pilot | $59.99 (24¢/GB) | $99.99 (20¢/GB) | $189.99 (19¢/GB) | $399.99 (20¢/GB) |
| MyDigitalSSD BPX Pro | $54.99 (23¢/GB) | $99.99 (21¢/GB) | ||
| Corsair Force MP510 | $74.19 (31¢/GB) | $113.99 (24¢/GB) | $209.99 (22¢/GB) | $386.99 (20¢/GB) |
| Samsung 970 EVO | $77.99 (31¢/GB) | $127.93 (26¢/GB) | $247.99 (25¢/GB) | $497.99 (25¢/GB) |
The initial MSRPs for the new WD Black are slightly higher than the current street prices for last year's model, but once the SN750 has been in stock for a little while it should get down to match those retail prices. That will still leave it at a premium relative to Silicon Motion based drives, even the ADATA SX8200 Pro that uses the SM2262EN controller compared to the older SM2262 used by the HP EX920 and Mushkin Pilot. The Phison E12-based MyDigitalSSD BPX Pro is very well-priced for the capacities that are actually in stock at the moment, and the similar Corsair MP510 has pretty good pricing on the larger models.
The WD Black SN750 will be hitting the market most closely priced to the Samsung 970 EVO. In those conditions, the SN750 will be the obvious choice for laptop usage due to its great power efficiency. For desktop usage, the Samsung 970 EVO may be the slightly better performer overall, but the smart pick would usually be one of the cheaper SM2262(EN) drives. Their performance pitfalls are a bit more severe than the corner cases of the 970 EVO or the WD Black, but those scenarios are seldom encountered during real-world usage.


