Original Link: https://www.anandtech.com/show/13591/the-intel-core-i9-9900k-at-95w-fixing-the-power-for-sff
The Intel Core i9-9900K at 95W: Fixing The Power for SFF
by Ian Cutress on November 29, 2018 8:00 AM EST
There is a lot of discussion about processor power recently. A lot of the issues stem around what exactly that TDP rating means on the box, and if it relates to anything in the real world. A summary of Intel’s official declaration boils down to TDP as the sustained processor power at long periods, however almost zero motherboards follow that guideline. As a result users will usually see much higher sustained power, although with much higher performance. Some small form factor systems rely on setting these limits, so we tested a Core i9-9900K with a 95W limit to see what would happen.
Intel and TDP
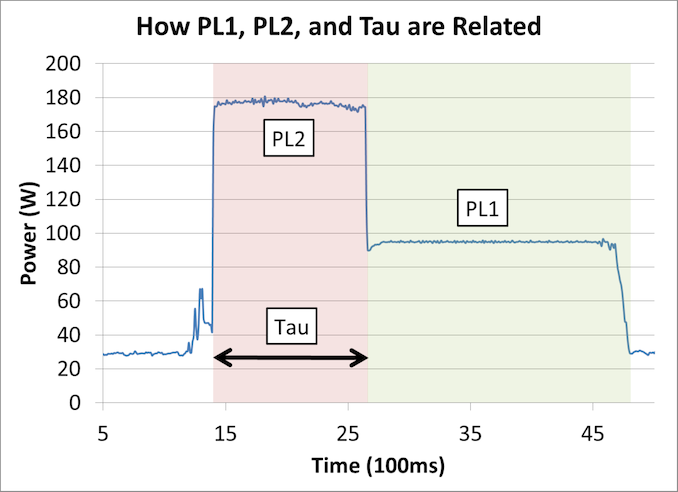
We recently published a sizeable analysis on what Intel officially means by TDP, and the associated values of PL1, PL2, and Tau. You can read it all here, although what it boils down to is this diagram:
When a processor is initially loaded, it should enter a state where PL2 describes the maximum power for a time of Tau seconds. When in this PL2 state, the CPU follows Intel’s per-core Turbo table rules, which reduces the frequency based on the number of cores loaded.
After Tau seconds, the CPU should drop down to a PL1 maximum sustained power value, which is usually identical to TDP. Depending on the CPU, this may reduce the frequency to the base frequency, or well below the all-core turbo frequency.
Technically PL2 is obtained over a moving average window, Tau, such that any low power moments on the processor will 'give budget back' to the turbo mode, however the graph above is the easiest way to see the high turbo mode on a fully loaded processor.
So while Intel defines a value for PL1, PL2, and Tau, almost zero consumer motherboard manufacturers actually follow it. There are many reasons why, mostly relating to overengineering the motherboards and wanting users to have the best performance at all times. The only times where these values follow any form of Intel guidance is in small form factor PCs.
For example, I tested an MSI Vortex G3 small form factor desktop at an event last year. It was using a processor normally rated for 65W TDP, and in a normal desktop that processor would push over 100W because the motherboard manufacturer in that system did not put any limits on the power, allowing the power to fall within Intel’s per-core turbo values. However, in this Vortex system, because of the limited thermal capabilities, the BIOS was set to run at 65W the whole time. This made sense for this form factor, but it meant that anyone looking for benchmarks of the processor would be misled – the power profile set in the BIOS was in no-way related to how that CPU would run in a standard desktop.
A Core i9-9900K with a 95W Limit
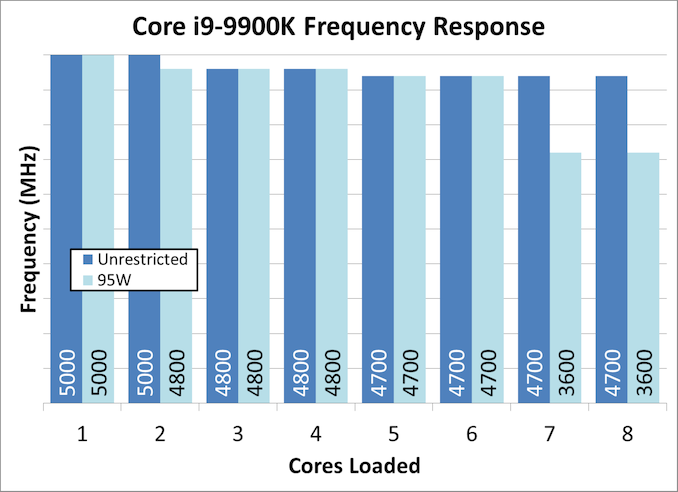
To put this into perspective, for this review we are using a Core i9-9900K which has a sustained TDP rating of 95W. When we compare the per-core frequencies of a 95W limited scenario and a normal ‘unrestricted scenario’, we get the following:
When a single core is loaded, the CPU is in 5.0 GHz mode as we are well under the power limit. There’s a slight decrease of 200 MHz in the 95W at two cores, but this disappears when 3-6 cores are loaded, with both setups being equal. The major difference happens however when we are at 7-8 cores loaded: because of the power consumption, the Core i9-9900K in 95W mode drops down to 3.6 GHz, which happens to be its base frequency.
This arguably means that we should see a correlation in most benchmarks between the two parts, but not if maximum load is ever required.
This Review
For this review, we’re putting the Core i9-9900K at a 95W power limit (as measured by the internal registers of the system) and running through our CPU test suite to see if how large the performance deficit is between the Core i9-9900K in a thermally unlimited scenario compared to a small form factor system deployment.
Pages In This Review
- Analysis and Competition
- Test Bed and Setup
- 2018 and 2019 Benchmark Suite: Spectre and Meltdown Hardened
- CPU Performance: System Tests
- CPU Performance: Rendering Tests
- CPU Performance: Office Tests
- CPU Performance: Encoding Tests
- CPU Performance: Legacy Tests
- Conclusions and Final Words
Test Bed and Setup
As per our processor testing policy, we take a premium category motherboard suitable for the socket, and equip the system with a suitable amount of memory running at the manufacturer's maximum supported frequency. This is also typically run at JEDEC subtimings where possible. It is noted that some users are not keen on this policy, stating that sometimes the maximum supported frequency is quite low, or faster memory is available at a similar price, or that the JEDEC speeds can be prohibitive for performance. While these comments make sense, ultimately very few users apply memory profiles (either XMP or other) as they require interaction with the BIOS, and most users will fall back on JEDEC supported speeds - this includes home users as well as industry who might want to shave off a cent or two from the cost or stay within the margins set by the manufacturer. Where possible, we will extend out testing to include faster memory modules either at the same time as the review or a later date.
| Test Setup | |||||
| Intel 9th Gen | i9-9900K i7-9700K i5-9600K |
ASRock Z370 Gaming i7** |
P1.70 | TRUE Copper |
Crucial Ballistix 4x8GB DDR4-2666 |
| Intel 8th Gen | i7-8086K i7-8700K i5-8600K |
ASRock Z370 Gaming i7 |
P1.70 | TRUE Copper |
Crucial Ballistix 4x8GB DDR4-2666 |
| Intel 7th Gen | i7-7700K i5-7600K |
GIGABYTE X170 ECC Extreme |
F21e | Silverstone* AR10-115XS |
G.Skill RipjawsV 2x16GB DDR4-2400 |
| Intel 6th Gen | i7-6700K i5-6600K |
GIGABYTE X170 ECC Extreme |
F21e | Silverstone* AR10-115XS |
G.Skill RipjawsV 2x16GB DDR4-2133 |
| Intel HEDT | i9-7900X i7-7820X i7-7800X |
ASRock X299 OC Formula |
P1.40 | TRUE Copper |
Crucial Ballistix 4x8GB DDR4-2666 |
| AMD 2000 | R7 2700X R5 2600X R5 2500X |
ASRock X370 Gaming K4 |
P4.80 | Wraith Max* | G.Skill SniperX 2x8 GB DDR4-2933 |
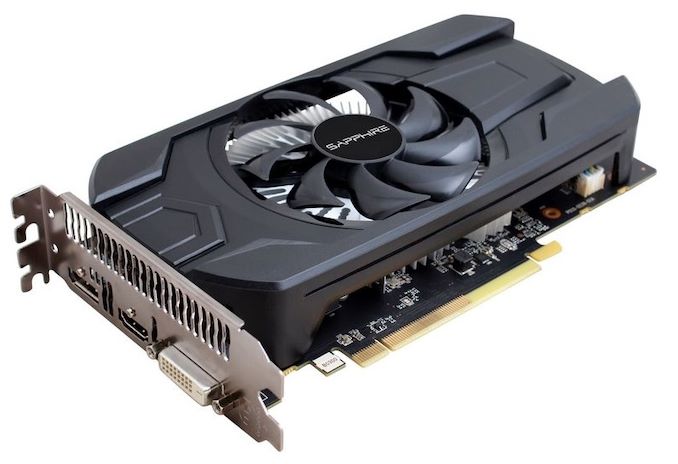
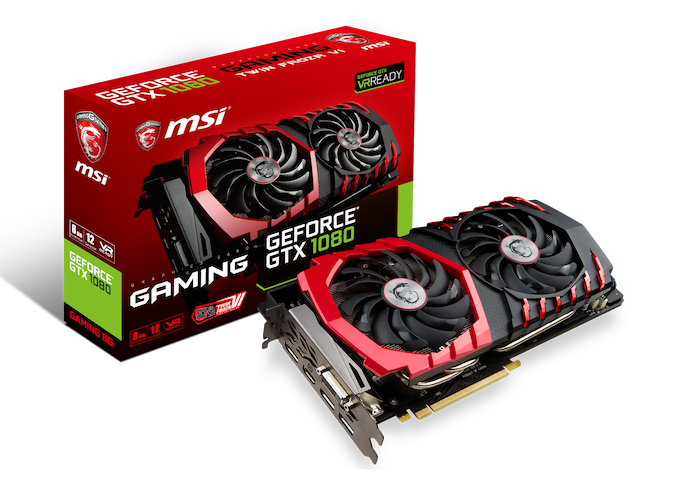
| GPU | Sapphire RX 460 2GB (CPU Tests) MSI GTX 1080 Gaming 8G (Gaming Tests) |
||||
| PSU | Corsair AX860i Corsair AX1200i |
||||
| SSD | Crucial MX200 1TB | ||||
| OS | Windows 10 x64 RS3 1709 Spectre and Meltdown Patched |
||||
| *VRM Supplimented with SST-FHP141-VF 173 CFM fans | |||||
We must thank the following companies for kindly providing hardware for our multiple test beds. Some of this hardware is not in this test bed specifically, but is used in other testing.
Our New Testing Suite for 2018 and 2019
Spectre and Meltdown Hardened
In order to keep up to date with our testing, we have to update our software every so often to stay relevant. In our updates we typically implement the latest operating system, the latest patches, the latest software revisions, the newest graphics drivers, as well as add new tests or remove old ones. As regular readers will know, our CPU testing revolves an automated test suite, and depending on how the newest software works, the suite either needs to change, be updated, have tests removed, or be rewritten completely. Last time we did a full re-write, it took the best part of a month, including regression testing (testing older processors).
One of the key elements of our testing update for 2018 (and 2019) is the fact that our scripts and systems are designed to be hardened for Spectre and Meltdown. This means making sure that all of our BIOSes are updated with the latest microcode, and all the steps are in place with our operating system with updates. In this case we are using Windows 10 x64 Enterprise 1709 with April security updates which enforces Smeltdown (our combined name) mitigations. Uses might ask why we are not running Windows 10 x64 RS4, the latest major update – this is due to some new features which are giving uneven results. Rather than spend a few weeks learning to disable them, we’re going ahead with RS3 which has been widely used.
Our previous benchmark suite was split into several segments depending on how the test is usually perceived. Our new test suite follows similar lines, and we run the tests based on:
- Power
- Memory
- Office
- System
- Render
- Encoding
- Web
- Legacy
- Integrated Gaming
- CPU Gaming
Depending on the focus of the review, the order of these benchmarks might change, or some left out of the main review. All of our data will reside in our benchmark database, Bench, for which there is a new ‘CPU 2019’ section for all of our new tests.
Within each section, we will have the following tests:
Power
Our power tests consist of running a substantial workload for every thread in the system, and then probing the power registers on the chip to find out details such as core power, package power, DRAM power, IO power, and per-core power. This all depends on how much information is given by the manufacturer of the chip: sometimes a lot, sometimes not at all.
We are currently running POV-Ray as our main test for Power, as it seems to hit deep into the system and is very consistent. In order to limit the number of cores for power, we use an affinity mask driven from the command line.
Memory
These tests involve disabling all turbo modes in the system, forcing it to run at base frequency, and them implementing both a memory latency checker (Intel’s Memory Latency Checker works equally well for both platforms) and AIDA64 to probe cache bandwidth.
Office
- Chromium Compile: Windows VC++ Compile of Chrome 56 (same as 2017)
- PCMark10: Primary data will be the overview results – subtest results will be in Bench
- 3DMark Physics: We test every physics sub-test for Bench, and report the major ones (new)
- GeekBench4: By request (new)
- SYSmark 2018: Recently released by BAPCo, currently automating it into our suite (new, when feasible)
System
- Application Load: Time to load GIMP 2.10.4 (new)
- FCAT: Time to process a 90 second ROTR 1440p recording (same as 2017)
- 3D Particle Movement: Particle distribution test (same as 2017) – we also have AVX2 and AVX512 versions of this, which may be added later
- Dolphin 5.0: Console emulation test (same as 2017)
- DigiCortex: Sea Slug Brain simulation (same as 2017)
- y-Cruncher v0.7.6: Pi calculation with optimized instruction sets for new CPUs (new)
- Agisoft Photoscan 1.3.3: 2D image to 3D modelling tool (updated)
Render
- Corona 1.3: Performance renderer for 3dsMax, Cinema4D (same as 2017)
- Blender 2.79b: Render of bmw27 on CPU (updated to 2.79b)
- LuxMark v3.1 C++ and OpenCL: Test of different rendering code paths (same as 2017)
- POV-Ray 3.7.1: Built-in benchmark (updated)
- CineBench R15: Older Cinema4D test, will likely remain in Bench (same as 2017)
Encoding
- 7-zip 1805: Built-in benchmark (updated to v1805)
- WinRAR 5.60b3: Compression test of directory with video and web files (updated to 5.60b3)
- AES Encryption: In-memory AES performance. Slightly older test. (same as 2017)
- Handbrake 1.1.0: Logitech C920 1080p60 input file, transcoded into three formats for streaming/storage:
- 720p60, x264, 6000 kbps CBR, Fast, High Profile
- 1080p60, x264, 3500 kbps CBR, Faster, Main Profile
- 1080p60, HEVC, 3500 kbps VBR, Fast, 2-Pass Main Profile
Web
- WebXPRT3: The latest WebXPRT test (updated)
- WebXPRT15: Similar to 3, but slightly older. (same as 2017)
- Speedometer2: Javascript Framework test (new)
- Google Octane 2.0: Depreciated but popular web test (same as 2017)
- Mozilla Kraken 1.1: Depreciated but popular web test (same as 2017)
Legacy (same as 2017)
- 3DPM v1: Older version of 3DPM, very naïve code
- x264 HD 3.0: Older transcode benchmark
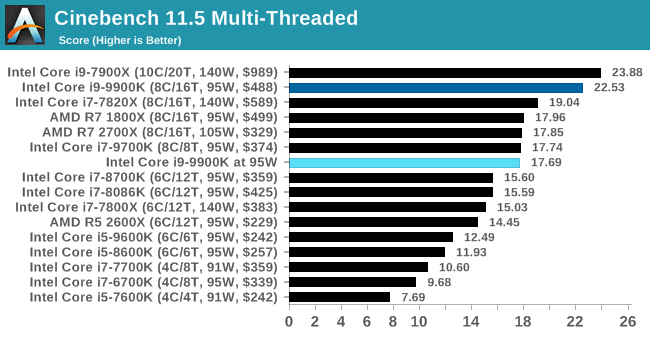
- Cinebench R11.5 and R10: Representative of different coding methodologies
Scale Up vs Scale Out: Benefits of Automation
One comment we get every now and again is that automation isn’t the best way of testing – there’s a higher barrier to entry, and it limits the tests that can be done. From our perspective, despite taking a little while to program properly (and get it right), automation means we can do several things:
- Guarantee consistent breaks between tests for cooldown to occur, rather than variable cooldown times based on ‘if I’m looking at the screen’
- It allows us to simultaneously test several systems at once. I currently run five systems in my office (limited by the number of 4K monitors, and space) which means we can process more hardware at the same time
- We can leave tests to run overnight, very useful for a deadline
- With a good enough script, tests can be added very easily
Our benchmark suite collates all the results and spits out data as the tests are running to a central storage platform, which I can probe mid-run to update data as it comes through. This also acts as a mental check in case any of the data might be abnormal.
We do have one major limitation, and that rests on the side of our gaming tests. We are running multiple tests through one Steam account, some of which (like GTA) are online only. As Steam only lets one system play on an account at once, our gaming script probes Steam’s own APIs to determine if we are ‘online’ or not, and to run offline tests until the account is free to be logged in on that system. Depending on the number of games we test that absolutely require online mode, it can be a bit of a bottleneck.
Benchmark Suite Updates
As always, we do take requests. It helps us understand the workloads that everyone is running and plan accordingly.
A side note on software packages: we have had requests for tests on software such as ANSYS, or other professional grade software. The downside of testing this software is licensing and scale. Most of these companies do not particularly care about us running tests, and state it’s not part of their goals. Others, like Agisoft, are more than willing to help. If you are involved in these software packages, the best way to see us benchmark them is to reach out. We have special versions of software for some of our tests, and if we can get something that works, and relevant to the audience, then we shouldn’t have too much difficulty adding it to the suite.
CPU Performance: System Tests
Our System Test section focuses significantly on real-world testing, user experience, with a slight nod to throughput. In this section we cover application loading time, image processing, simple scientific physics, emulation, neural simulation, optimized compute, and 3D model development, with a combination of readily available and custom software. For some of these tests, the bigger suites such as PCMark do cover them (we publish those values in our office section), although multiple perspectives is always beneficial. In all our tests we will explain in-depth what is being tested, and how we are testing.
All of our benchmark results can also be found in our benchmark engine, Bench.
Application Load: GIMP 2.10.4
One of the most important aspects about user experience and workflow is how fast does a system respond. A good test of this is to see how long it takes for an application to load. Most applications these days, when on an SSD, load fairly instantly, however some office tools require asset pre-loading before being available. Most operating systems employ caching as well, so when certain software is loaded repeatedly (web browser, office tools), then can be initialized much quicker.
In our last suite, we tested how long it took to load a large PDF in Adobe Acrobat. Unfortunately this test was a nightmare to program for, and didn’t transfer over to Win10 RS3 easily. In the meantime we discovered an application that can automate this test, and we put it up against GIMP, a popular free open-source online photo editing tool, and the major alternative to Adobe Photoshop. We set it to load a large 50MB design template, and perform the load 10 times with 10 seconds in-between each. Due to caching, the first 3-5 results are often slower than the rest, and time to cache can be inconsistent, we take the average of the last five results to show CPU processing on cached loading.
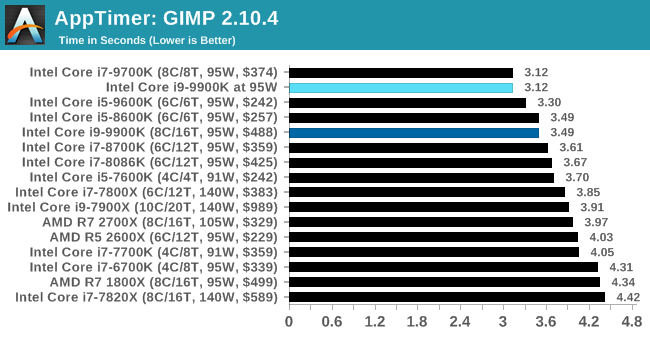
One of the interesting things in these benchmarks is that when in 95W mode, especially in shorter tests, the 9900K actually performs better than the full grunt settings. This could be because the system doesn't have to consider current limits of the power delivery, as 95W is the guaranteed limit no matter the loading.
FCAT: Image Processing
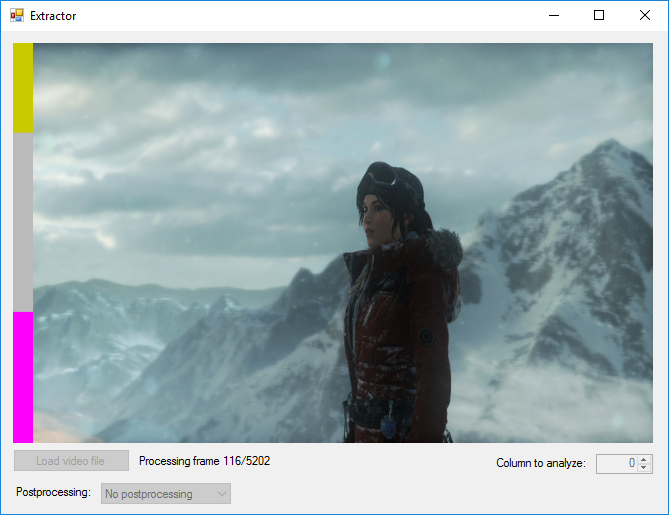
The FCAT software was developed to help detect microstuttering, dropped frames, and run frames in graphics benchmarks when two accelerators were paired together to render a scene. Due to game engines and graphics drivers, not all GPU combinations performed ideally, which led to this software fixing colors to each rendered frame and dynamic raw recording of the data using a video capture device.
The FCAT software takes that recorded video, which in our case is 90 seconds of a 1440p run of Rise of the Tomb Raider, and processes that color data into frame time data so the system can plot an ‘observed’ frame rate, and correlate that to the power consumption of the accelerators. This test, by virtue of how quickly it was put together, is single threaded. We run the process and report the time to completion.
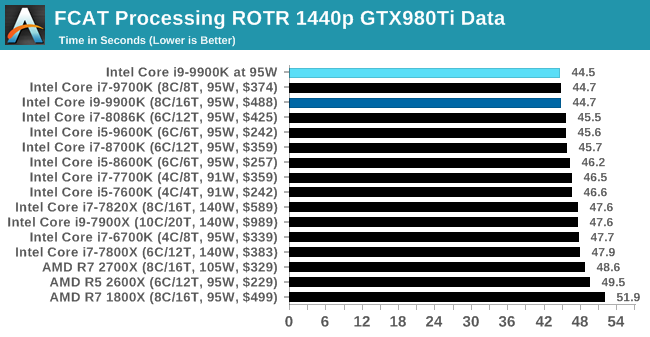
In a slightly longer test, the 9900K @ 95W eeks out the tiniest win.
3D Particle Movement v2.1: Brownian Motion
Our 3DPM test is a custom built benchmark designed to simulate six different particle movement algorithms of points in a 3D space. The algorithms were developed as part of my PhD., and while ultimately perform best on a GPU, provide a good idea on how instruction streams are interpreted by different microarchitectures.
A key part of the algorithms is the random number generation – we use relatively fast generation which ends up implementing dependency chains in the code. The upgrade over the naïve first version of this code solved for false sharing in the caches, a major bottleneck. We are also looking at AVX2 and AVX512 versions of this benchmark for future reviews.
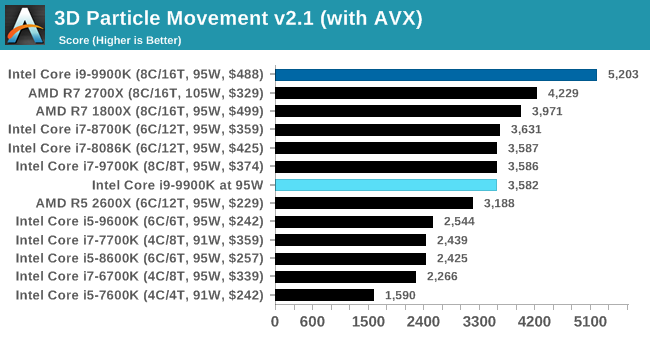
For this test, we run a stock particle set over the six algorithms for 20 seconds apiece, with 10 second pauses, and report the total rate of particle movement, in millions of operations (movements) per second. We have a non-AVX version and an AVX version, with the latter implementing AVX512 and AVX2 where possible.
3DPM v2.1 can be downloaded from our server: 3DPMv2.1.rar (13.0 MB)
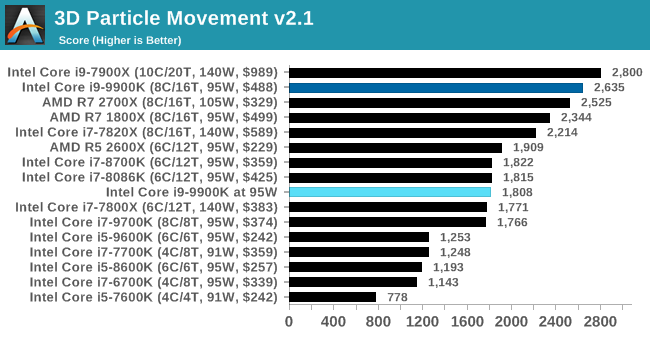
As we move onto something more substantial with all the threads, the 95W setting means that the result scores a heavy loss in 3DPM.
Dolphin 5.0: Console Emulation
One of the popular requested tests in our suite is to do with console emulation. Being able to pick up a game from an older system and run it as expected depends on the overhead of the emulator: it takes a significantly more powerful x86 system to be able to accurately emulate an older non-x86 console, especially if code for that console was made to abuse certain physical bugs in the hardware.
For our test, we use the popular Dolphin emulation software, and run a compute project through it to determine how close to a standard console system our processors can emulate. In this test, a Nintendo Wii would take around 1050 seconds.
The latest version of Dolphin can be downloaded from https://dolphin-emu.org/
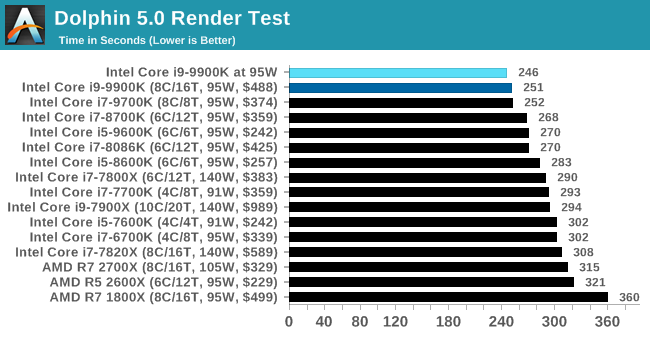
Dolphin is again a single threaded test, and the 9900K at 95W eeks out another small win.
DigiCortex 1.20: Sea Slug Brain Simulation
This benchmark was originally designed for simulation and visualization of neuron and synapse activity, as is commonly found in the brain. The software comes with a variety of benchmark modes, and we take the small benchmark which runs a 32k neuron / 1.8B synapse simulation, equivalent to a Sea Slug.
Example of a 2.1B neuron simulation
We report the results as the ability to simulate the data as a fraction of real-time, so anything above a ‘one’ is suitable for real-time work. Out of the two modes, a ‘non-firing’ mode which is DRAM heavy and a ‘firing’ mode which has CPU work, we choose the latter. Despite this, the benchmark is still affected by DRAM speed a fair amount.
DigiCortex can be downloaded from http://www.digicortex.net/
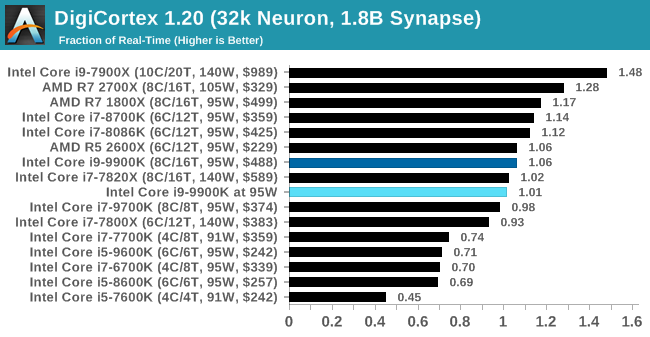
When it comes to a mixed benchmark like DigiCortex, the reduced power CPU actually performs around the same, given the same DRAM speed on both setups.
y-Cruncher v0.7.6: Microarchitecture Optimized Compute
I’ve known about y-Cruncher for a while, as a tool to help compute various mathematical constants, but it wasn’t until I began talking with its developer, Alex Yee, a researcher from NWU and now software optimization developer, that I realized that he has optimized the software like crazy to get the best performance. Naturally, any simulation that can take 20+ days can benefit from a 1% performance increase! Alex started y-cruncher as a high-school project, but it is now at a state where Alex is keeping it up to date to take advantage of the latest instruction sets before they are even made available in hardware.
For our test we run y-cruncher v0.7.6 through all the different optimized variants of the binary, single threaded and multi-threaded, including the AVX-512 optimized binaries. The test is to calculate 250m digits of Pi, and we use the single threaded and multi-threaded versions of this test.
Users can download y-cruncher from Alex’s website: http://www.numberworld.org/y-cruncher/
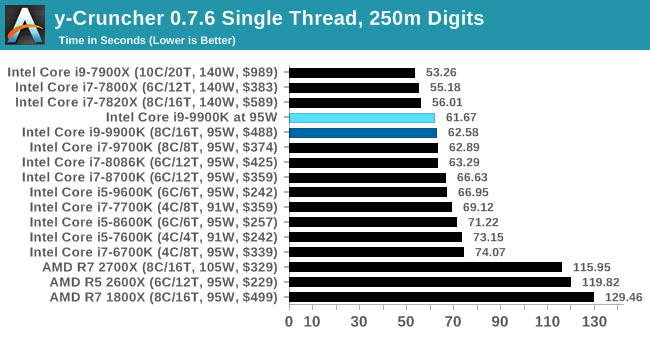
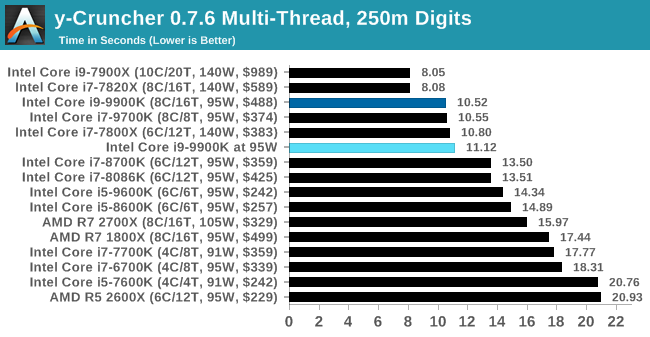
yCruncher shows another small win for the 9900K at 95W in single threaded mode, although this turns into a loss when all the threads are primed with AVX2 code.
Agisoft Photoscan 1.3.3: 2D Image to 3D Model Conversion
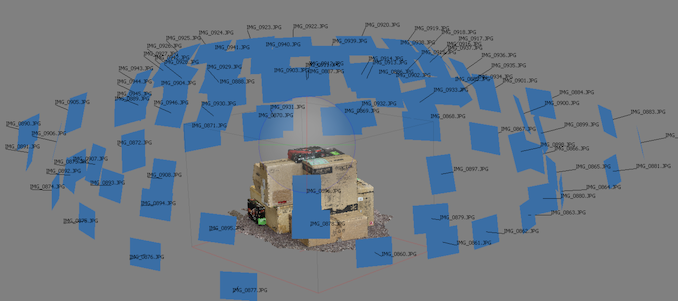
One of the ISVs that we have worked with for a number of years is Agisoft, who develop software called PhotoScan that transforms a number of 2D images into a 3D model. This is an important tool in model development and archiving, and relies on a number of single threaded and multi-threaded algorithms to go from one side of the computation to the other.
In our test, we take v1.3.3 of the software with a good sized data set of 84 x 18 megapixel photos and push it through a reasonably fast variant of the algorithms, but is still more stringent than our 2017 test. We report the total time to complete the process.
Agisoft’s Photoscan website can be found here: http://www.agisoft.com/
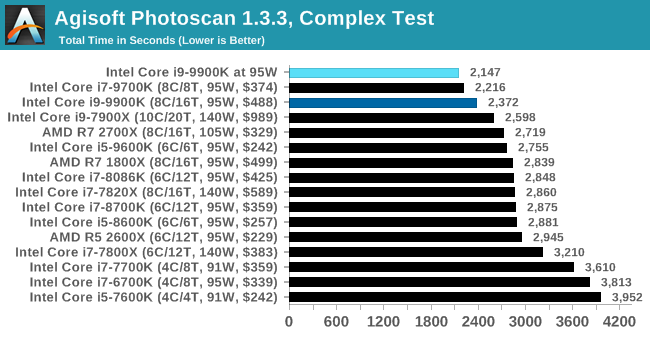
Photoscan is a mixed workload test, with certain portions being purely singe threaded and others being multithreaded. The 9900K at 95W wins by a good amount here.
CPU Performance: Rendering Tests
Rendering is often a key target for processor workloads, lending itself to a professional environment. It comes in different formats as well, from 3D rendering through rasterization, such as games, or by ray tracing, and invokes the ability of the software to manage meshes, textures, collisions, aliasing, physics (in animations), and discarding unnecessary work. Most renderers offer CPU code paths, while a few use GPUs and select environments use FPGAs or dedicated ASICs. For big studios however, CPUs are still the hardware of choice.
All of our benchmark results can also be found in our benchmark engine, Bench.
Corona 1.3: Performance Render
An advanced performance based renderer for software such as 3ds Max and Cinema 4D, the Corona benchmark renders a generated scene as a standard under its 1.3 software version. Normally the GUI implementation of the benchmark shows the scene being built, and allows the user to upload the result as a ‘time to complete’.
We got in contact with the developer who gave us a command line version of the benchmark that does a direct output of results. Rather than reporting time, we report the average number of rays per second across six runs, as the performance scaling of a result per unit time is typically visually easier to understand.
The Corona benchmark website can be found at https://corona-renderer.com/benchmark
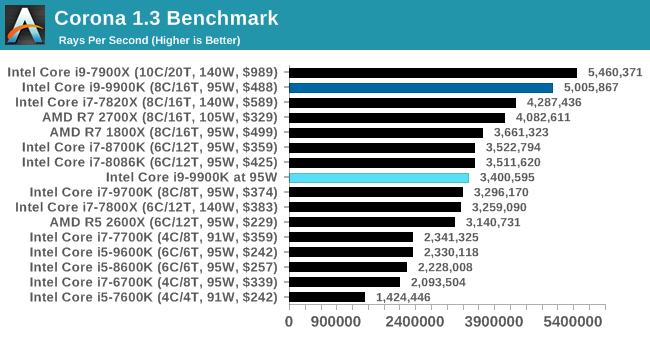
When we apply a full-fat rendering test, the 9900K at 95W scores around the i7-9700K which is a similar CPU with no hyperthreading.
Blender 2.79b: 3D Creation Suite
A high profile rendering tool, Blender is open-source allowing for massive amounts of configurability, and is used by a number of high-profile animation studios worldwide. The organization recently released a Blender benchmark package, a couple of weeks after we had narrowed our Blender test for our new suite, however their test can take over an hour. For our results, we run one of the sub-tests in that suite through the command line - a standard ‘bmw27’ scene in CPU only mode, and measure the time to complete the render.
Blender can be downloaded at https://www.blender.org/download/
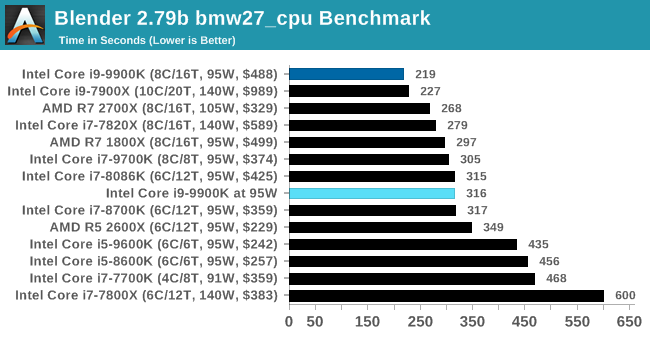
Similar scenes with Blender, where the 9900K at 95W is actually 50% slower, and performs around the mark of the 9700K.
LuxMark v3.1: LuxRender via Different Code Paths
As stated at the top, there are many different ways to process rendering data: CPU, GPU, Accelerator, and others. On top of that, there are many frameworks and APIs in which to program, depending on how the software will be used. LuxMark, a benchmark developed using the LuxRender engine, offers several different scenes and APIs.
In our test, we run the simple ‘Ball’ scene on both the C++ and OpenCL code paths, but in CPU mode. This scene starts with a rough render and slowly improves the quality over two minutes, giving a final result in what is essentially an average ‘kilorays per second’.
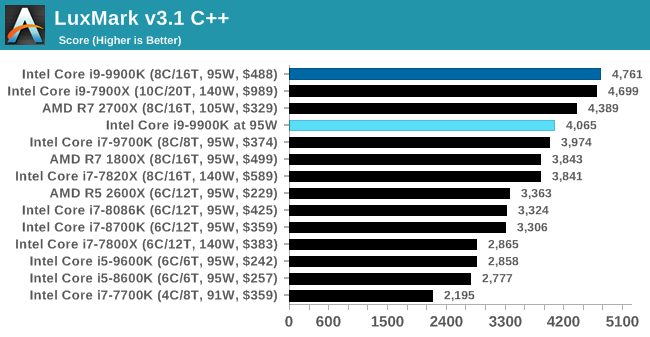
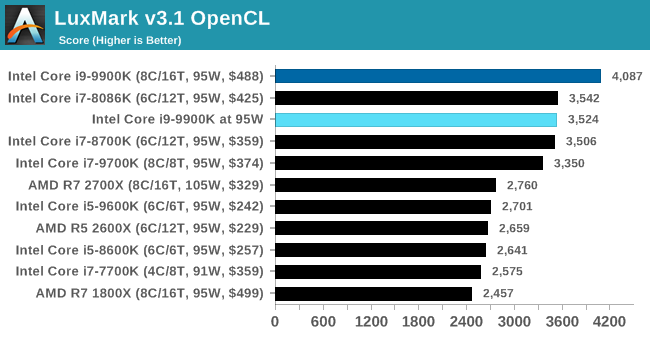
The drop in our Luxmark test isn't as severe as what we see in blender, but the 95W mode causes the 9900K to be again around the level of a 9700K.
POV-Ray 3.7.1: Ray Tracing
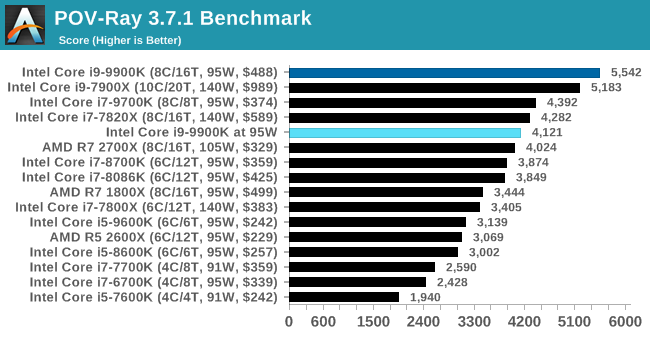
The Persistence of Vision ray tracing engine is another well-known benchmarking tool, which was in a state of relative hibernation until AMD released its Zen processors, to which suddenly both Intel and AMD were submitting code to the main branch of the open source project. For our test, we use the built-in benchmark for all-cores, called from the command line.
POV-Ray can be downloaded from http://www.povray.org/
CPU Performance: Office Tests
The Office test suite is designed to focus around more industry standard tests that focus on office workflows, system meetings, some synthetics, but we also bundle compiler performance in with this section. For users that have to evaluate hardware in general, these are usually the benchmarks that most consider.
All of our benchmark results can also be found in our benchmark engine, Bench.
PCMark 10: Industry Standard System Profiler
Futuremark, now known as UL, has developed benchmarks that have become industry standards for around two decades. The latest complete system test suite is PCMark 10, upgrading over PCMark 8 with updated tests and more OpenCL invested into use cases such as video streaming.
PCMark splits its scores into about 14 different areas, including application startup, web, spreadsheets, photo editing, rendering, video conferencing, and physics. We post all of these numbers in our benchmark database, Bench, however the key metric for the review is the overall score.
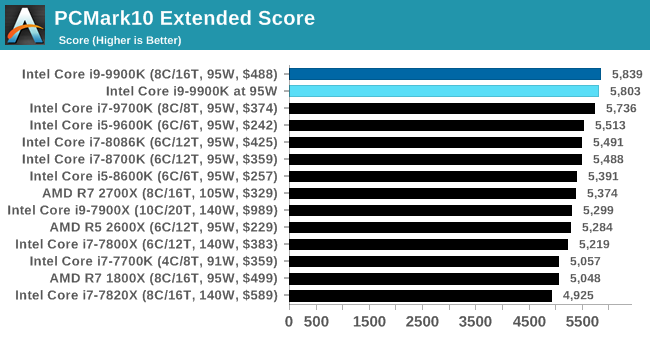
PCMark10 is more forgiving, as it has lots of pauses and only a few full-on power tests, emphasising single core speed. There isn't much lost when in 95W mode here.
Chromium Compile: Windows VC++ Compile of Chrome 56
A large number of AnandTech readers are software engineers, looking at how the hardware they use performs. While compiling a Linux kernel is ‘standard’ for the reviewers who often compile, our test is a little more varied – we are using the windows instructions to compile Chrome, specifically a Chrome 56 build from March 2017, as that was when we built the test. Google quite handily gives instructions on how to compile with Windows, along with a 400k file download for the repo.
In our test, using Google’s instructions, we use the MSVC compiler and ninja developer tools to manage the compile. As you may expect, the benchmark is variably threaded, with a mix of DRAM requirements that benefit from faster caches. Data procured in our test is the time taken for the compile, which we convert into compiles per day.
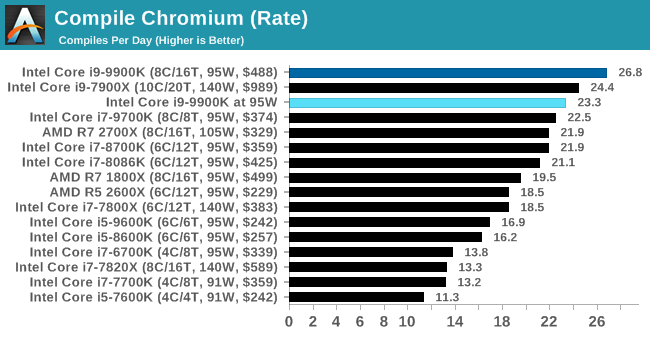
The 95W mode causes a small decrease in performance in our compile test, again moving it within a small margin to the Core i7-9700K.
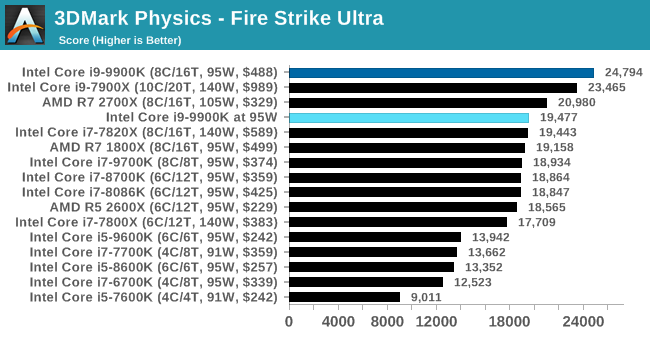
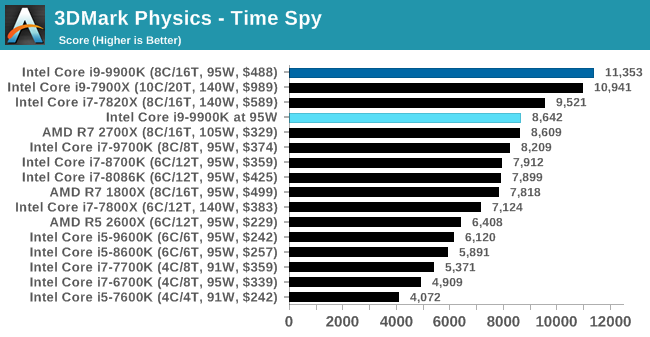
3DMark Physics: In-Game Physics Compute
Alongside PCMark is 3DMark, Futuremark’s (UL’s) gaming test suite. Each gaming tests consists of one or two GPU heavy scenes, along with a physics test that is indicative of when the test was written and the platform it is aimed at. The main overriding tests, in order of complexity, are Ice Storm, Cloud Gate, Sky Diver, Fire Strike, and Time Spy.
Some of the subtests offer variants, such as Ice Storm Unlimited, which is aimed at mobile platforms with an off-screen rendering, or Fire Strike Ultra which is aimed at high-end 4K systems with lots of the added features turned on. Time Spy also currently has an AVX-512 mode (which we may be using in the future).
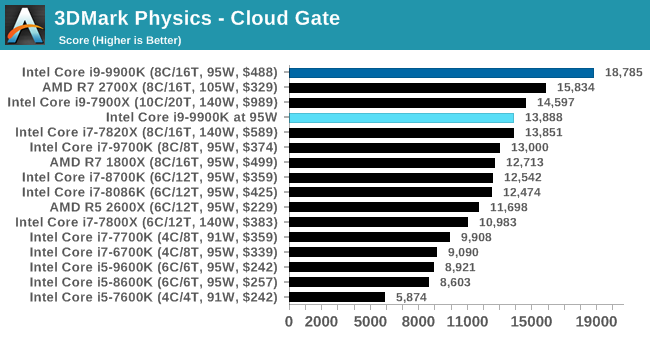
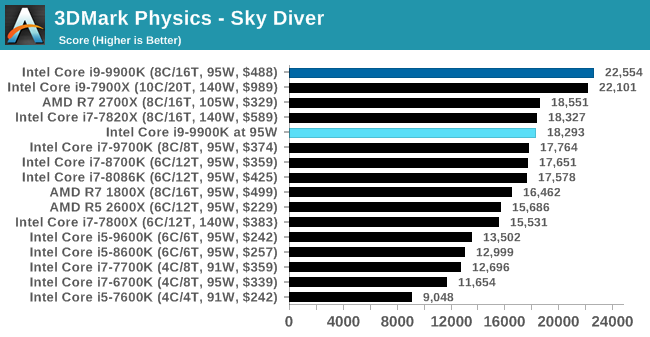
For our tests, we report in Bench the results from every physics test, but for the sake of the review we keep it to the most demanding of each scene: Cloud Gate, Sky Diver, Fire Strike Ultra, and Time Spy.
GeekBench4: Synthetics
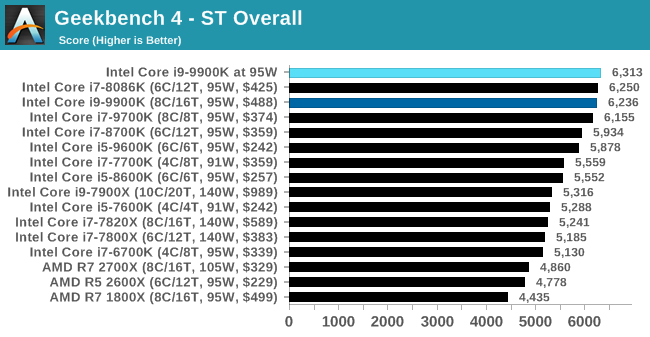
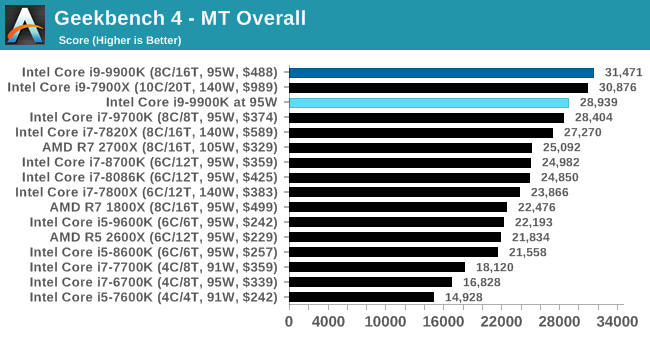
A common tool for cross-platform testing between mobile, PC, and Mac, GeekBench 4 is an ultimate exercise in synthetic testing across a range of algorithms looking for peak throughput. Tests include encryption, compression, fast Fourier transform, memory operations, n-body physics, matrix operations, histogram manipulation, and HTML parsing.
I’m including this test due to popular demand, although the results do come across as overly synthetic, and a lot of users often put a lot of weight behind the test due to the fact that it is compiled across different platforms (although with different compilers).
We record the main subtest scores (Crypto, Integer, Floating Point, Memory) in our benchmark database, but for the review we post the overall single and multi-threaded results.
CPU Performance: Encoding Tests
With the rise of streaming, vlogs, and video content as a whole, encoding and transcoding tests are becoming ever more important. Not only are more home users and gamers needing to convert video files into something more manageable, for streaming or archival purposes, but the servers that manage the output also manage around data and log files with compression and decompression. Our encoding tasks are focused around these important scenarios, with input from the community for the best implementation of real-world testing.
All of our benchmark results can also be found in our benchmark engine, Bench.
Handbrake 1.1.0: Streaming and Archival Video Transcoding
A popular open source tool, Handbrake is the anything-to-anything video conversion software that a number of people use as a reference point. The danger is always on version numbers and optimization, for example the latest versions of the software can take advantage of AVX-512 and OpenCL to accelerate certain types of transcoding and algorithms. The version we use here is a pure CPU play, with common transcoding variations.
We have split Handbrake up into several tests, using a Logitech C920 1080p60 native webcam recording (essentially a streamer recording), and convert them into two types of streaming formats and one for archival. The output settings used are:
- 720p60 at 6000 kbps constant bit rate, fast setting, high profile
- 1080p60 at 3500 kbps constant bit rate, faster setting, main profile
- 1080p60 HEVC at 3500 kbps variable bit rate, fast setting, main profile
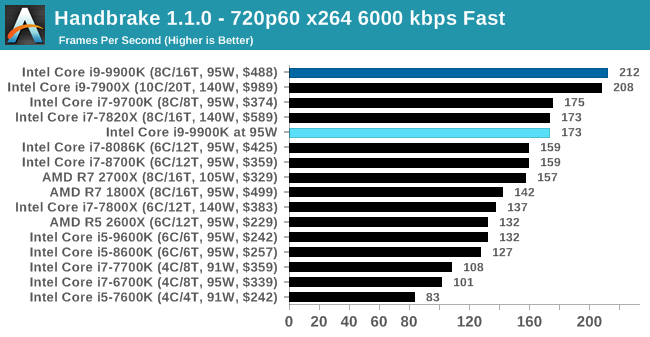
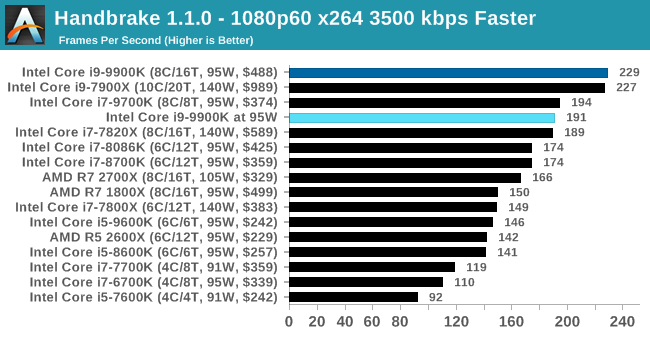
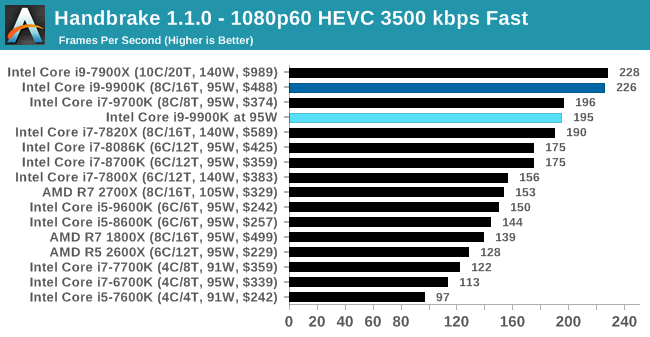
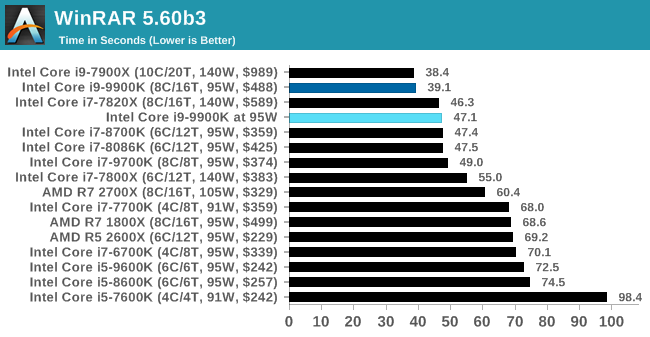
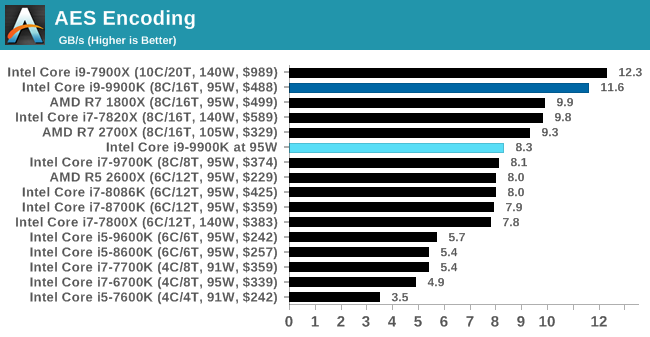
Encoding is a good example where the performance decreases by a noticable margin (10%+), although perhaps not as much as you might think. In all of our tests however, the 95W mode again pulls the 9900K down to the level of a 9700K. This pattern goes through all of our encoding tests.
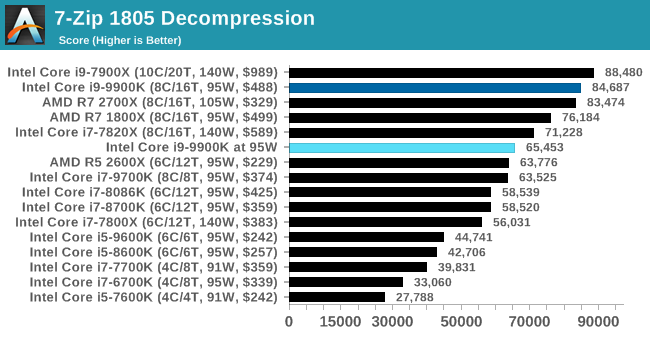
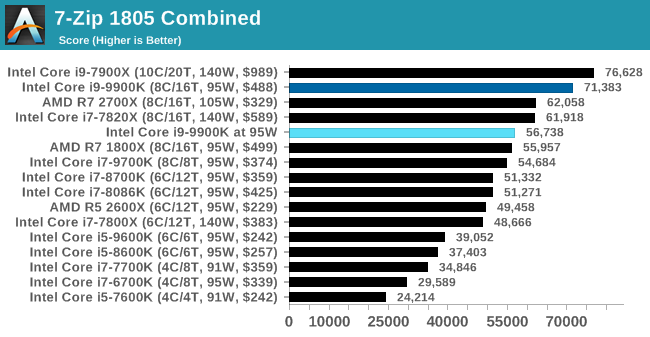
7-zip v1805: Popular Open-Source Encoding Engine
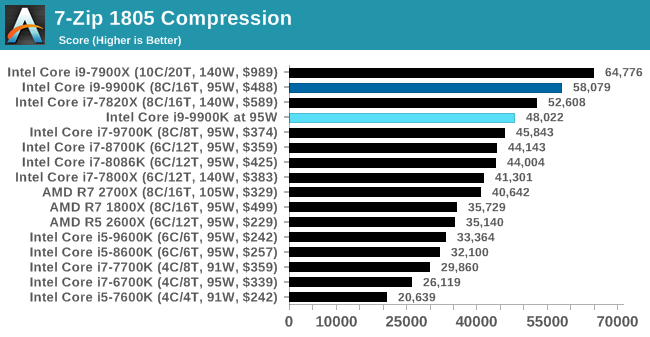
Out of our compression/decompression tool tests, 7-zip is the most requested and comes with a built-in benchmark. For our test suite, we’ve pulled the latest version of the software and we run the benchmark from the command line, reporting the compression, decompression, and a combined score.
It is noted in this benchmark that the latest multi-die processors have very bi-modal performance between compression and decompression, performing well in one and badly in the other. There are also discussions around how the Windows Scheduler is implementing every thread. As we get more results, it will be interesting to see how this plays out.
Please note, if you plan to share out the Compression graph, please include the Decompression one. Otherwise you’re only presenting half a picture.
WinRAR 5.60b3: Archiving Tool
My compression tool of choice is often WinRAR, having been one of the first tools a number of my generation used over two decades ago. The interface has not changed much, although the integration with Windows right click commands is always a plus. It has no in-built test, so we run a compression over a set directory containing over thirty 60-second video files and 2000 small web-based files at a normal compression rate.
WinRAR is variable threaded but also susceptible to caching, so in our test we run it 10 times and take the average of the last five, leaving the test purely for raw CPU compute performance.
AES Encryption: File Security
A number of platforms, particularly mobile devices, are now offering encryption by default with file systems in order to protect the contents. Windows based devices have these options as well, often applied by BitLocker or third-party software. In our AES encryption test, we used the discontinued TrueCrypt for its built-in benchmark, which tests several encryption algorithms directly in memory.
The data we take for this test is the combined AES encrypt/decrypt performance, measured in gigabytes per second. The software does use AES commands for processors that offer hardware selection, however not AVX-512.
CPU Performance: Legacy Tests
We have also included our legacy benchmarks, representing a stack of older code for popular benchmarks.
All of our benchmark results can also be found in our benchmark engine, Bench.
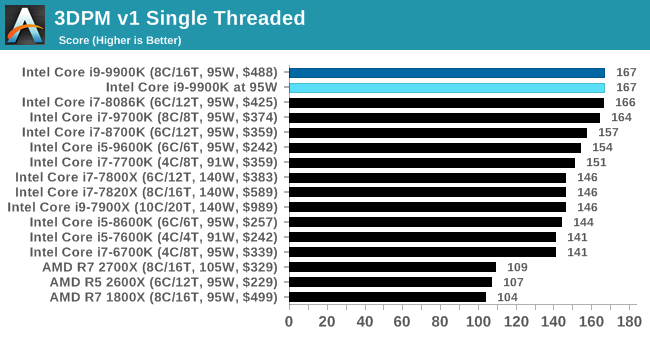
3DPM v1: Naïve Code Variant of 3DPM v2.1
The first legacy test in the suite is the first version of our 3DPM benchmark. This is the ultimate naïve version of the code, as if it was written by scientist with no knowledge of how computer hardware, compilers, or optimization works (which in fact, it was at the start). This represents a large body of scientific simulation out in the wild, where getting the answer is more important than it being fast (getting a result in 4 days is acceptable if it’s correct, rather than sending someone away for a year to learn to code and getting the result in 5 minutes).
In this version, the only real optimization was in the compiler flags (-O2, -fp:fast), compiling it in release mode, and enabling OpenMP in the main compute loops. The loops were not configured for function size, and one of the key slowdowns is false sharing in the cache. It also has long dependency chains based on the random number generation, which leads to relatively poor performance on specific compute microarchitectures.
3DPM v1 can be downloaded with our 3DPM v2 code here: 3DPMv2.1.rar (13.0 MB)
x264 HD 3.0: Older Transcode Test
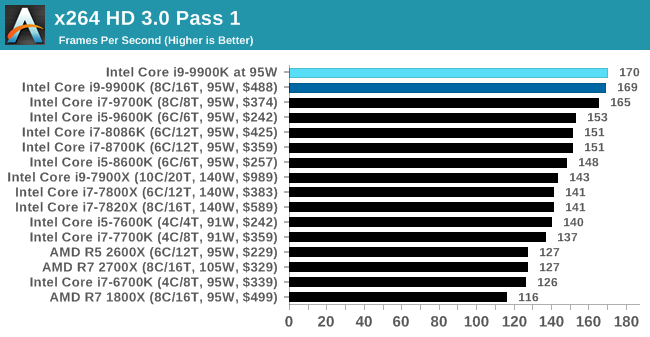
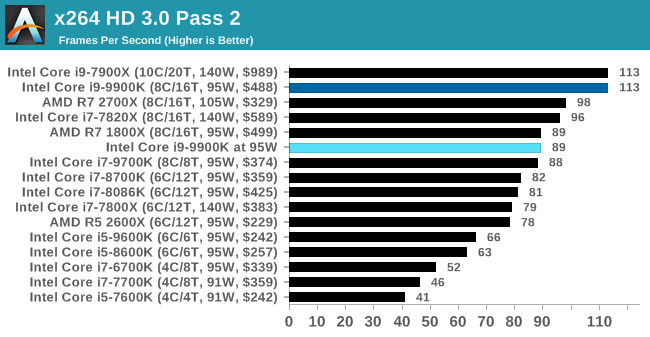
This transcoding test is super old, and was used by Anand back in the day of Pentium 4 and Athlon II processors. Here a standardized 720p video is transcoded with a two-pass conversion, with the benchmark showing the frames-per-second of each pass. This benchmark is single-threaded, and between some micro-architectures we seem to actually hit an instructions-per-clock wall.
Core i9-9900K in Small Form Factors
Even with all the hullabaloo surrounding how Intel defines TDP and what values the company should actually be advertising for the power consumption of its processors, the simple fact is that processors generate thermal energy when they run. Sometimes it’s a small amount, and sometimes it’s a lot, but in every case that thermal energy has to be managed, either by the box cooler, some super extreme water chiller loop, or by a super massive fanless heatsink. In order to maintain performance, the thermal solution also has to be suitable for the environment at hand.
Nothing proves more channeling than designing a system for something small, and still maintaining high levels of performance. There are tradeoffs – performance for noise, or silence for performance. One way to manage this is through configuring the turbo and power values of the system in the firmware, and it is this method that OEMs use for laptops and mini-PCs.
Some Performance Loss, But More Efficient
The performance that Intel guarantees is the one on the box: the base frequency at the sustained TDP. For system integrators or builders, this gives a simple comparison point, and when we set our power consumption limits for the Core i9-9900K, this is what we saw at full load: 95W gave 3.6 GHz at 7-8 core load.
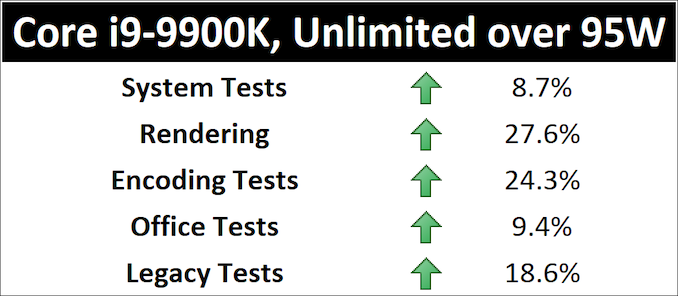
Losing almost half the power from standard operation caused the frequency to drop by 23% at the fast and furious end, which has a knock-on effect on performance. As was perhaps to be expected, for our throughput benchmarks, it was sizeable. For this data, we’re going to represent the performance uplift from 95W to the ‘unlimited power’ mode:
The system and office tests, which are a mix of latency and throughput tests, saw just under a 10% gain going from 95W to unlimited mode. For pure throughput however, that 23-24% difference in frequency gave an equivalent gain to the unlimited power mode. The only flipside is power: the extra performance pushes power consumption to 164-165W, which is a 74% power gain. If we were going for performance per watt, then the 95W wins that battle very easily. It all depends if the form factor the processor is in can provide sufficient cooling.
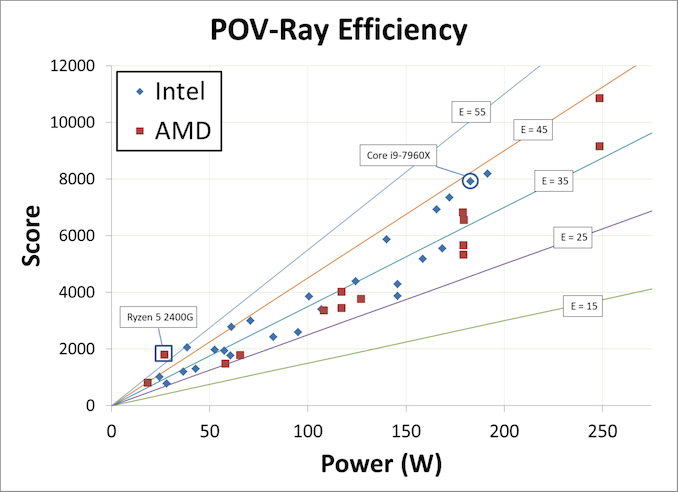
Doing these numbers gave me an idea for a metric for power efficiency. We currently run our power tests during a run of POV-Ray, and as a result, we can plot the power consumption during our POV-Ray test against the POV-Ray result score.
The highest performers are at the low end of the spectrum of what we’ve tested, with the Ryzen 5 2400G and Core i5-8305G (Kaby Lake-G) being the top performers, getting an efficiency rating (score/power) of 67 and 53 respectively. However Intel’s Skylake-X parts and the Threadripper 2990WX all scored highly on this metric too, around the 43 mark. This is likely because these high-power processors actually give less power per core, and each core is nearer to its peak efficiency for frequency/voltage.
The Intel Core i9-9900K, in normal operation, scores an efficiency rating of 32.9. This rises to 44.2 if the processor is fixed to 95W. This ultimately puts the 9900K in the limelight for an SFF system: when the power is limited to 95W, you get all the single core performance, most of the variable threaded performance, and around a 10-27% loss in throughput testing, most noticably in rendering. Overall, it acts like a 9900K in single thread mode, and like a 9700K in multi-thread mode.

