Original Link: https://www.anandtech.com/show/12408/the-samsung-860-evo-m2-2tb-ssd-review
The Latest High-Capacity M.2: The Samsung 860 EVO 2TB SSD, Reviewed
by Billy Tallis on February 14, 2018 1:40 PM EST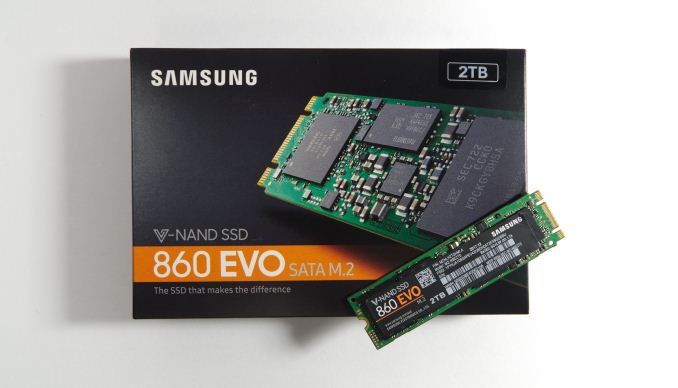
Last month, Samsung updated their retail SATA SSD lineup with a new generation of controllers and memory. The Samsung 860 PRO arrived on our test bench first and clearly outperformed its predecessor. However, its status as a premium-priced MLC-based SSD means those generational improvements were irrelevant to most consumers. The new Samsung 860 EVO is the mainstream counterpart with 3D TLC NAND and more competitive pricing.
M.2 Evolution: Samsung's Fourth Generation 3D-NAND, and MJX SATA Controller
The Samsung 860 EVO uses 512Gb TLC dies of Samsung's fourth-generation 3D NAND. Most of the competing 64L TLC SSDs in the consumer market are still using 256Gb dies for some or all models, in order to avoid the performance limitations that usually result when there are too few dies to access in parallel.
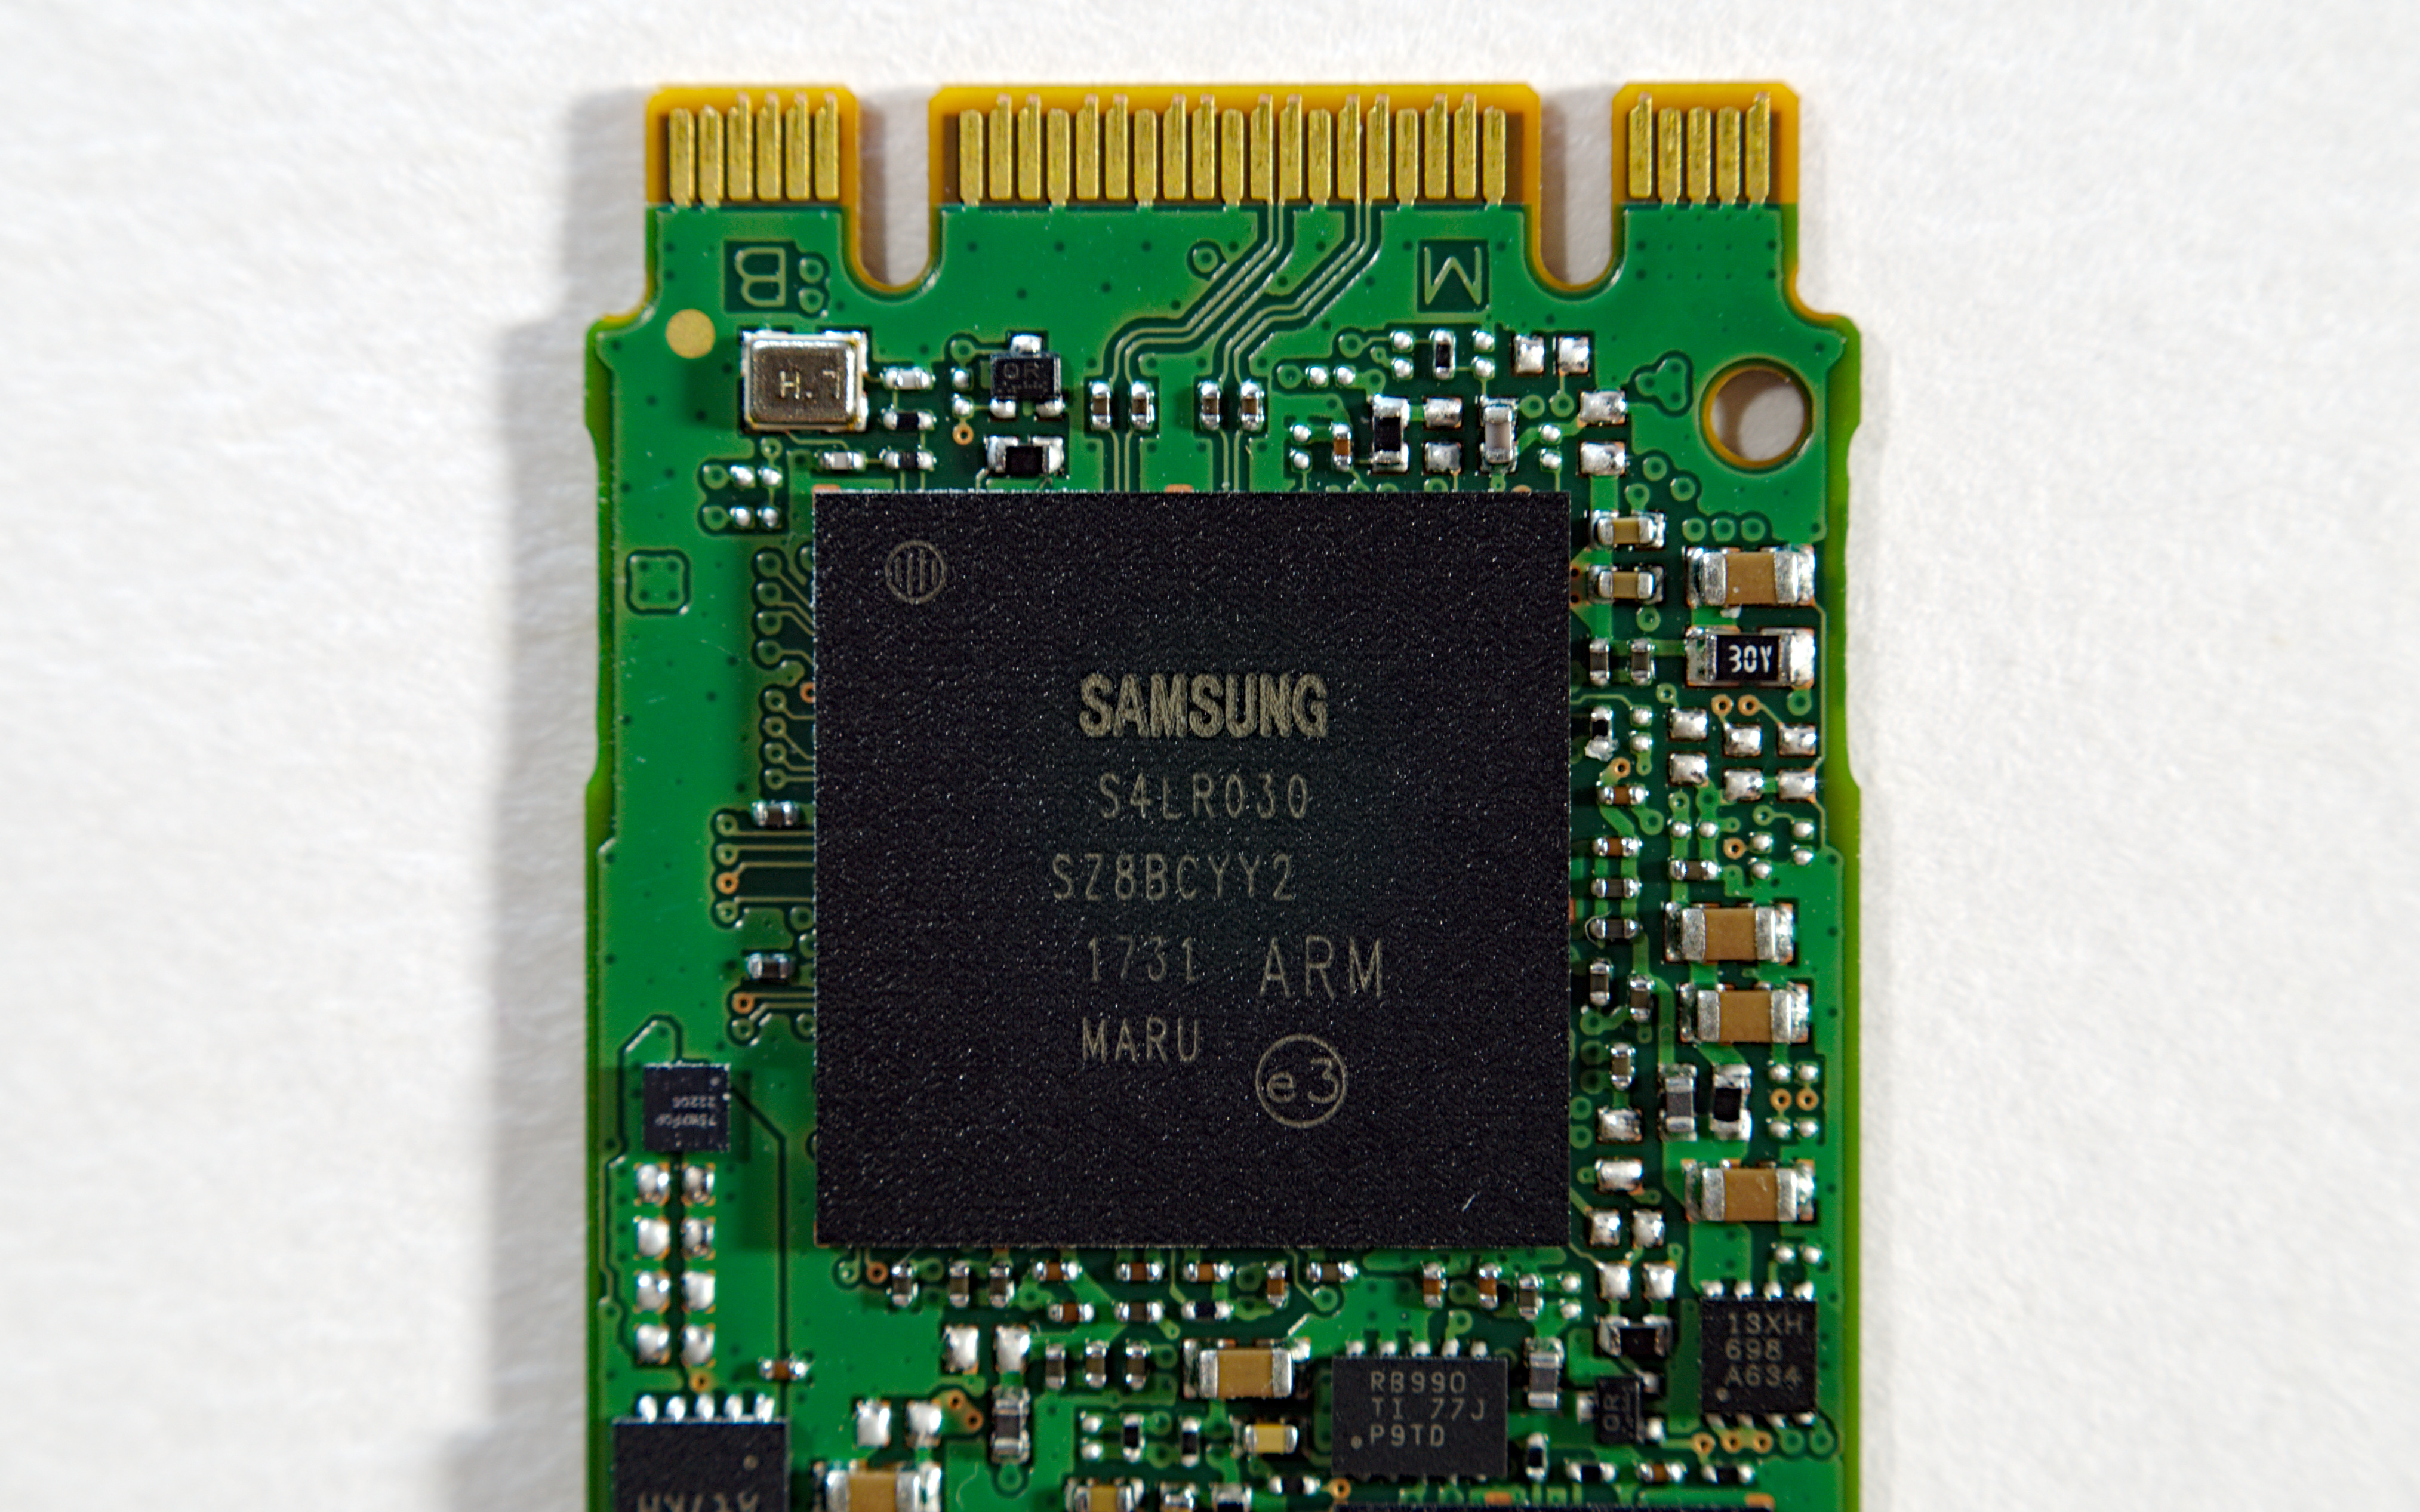
The controller on the 860 EVO and 860 PRO is the Samsung MJX, latest in a long line of successful SATA SSD controllers. Samsung hasn't provided much information about what this generation brings to the table, but one clear highlight is support for LPDDR4 DRAM. This is probably the primary source of the large power savings we've observed from the 860 series, and it is particularly welcome for the high-capacity models that includes multiple GB of DRAM.


_thumb.jpg)


Exploiting the Size, A Potential for High-Capacity Notebooks
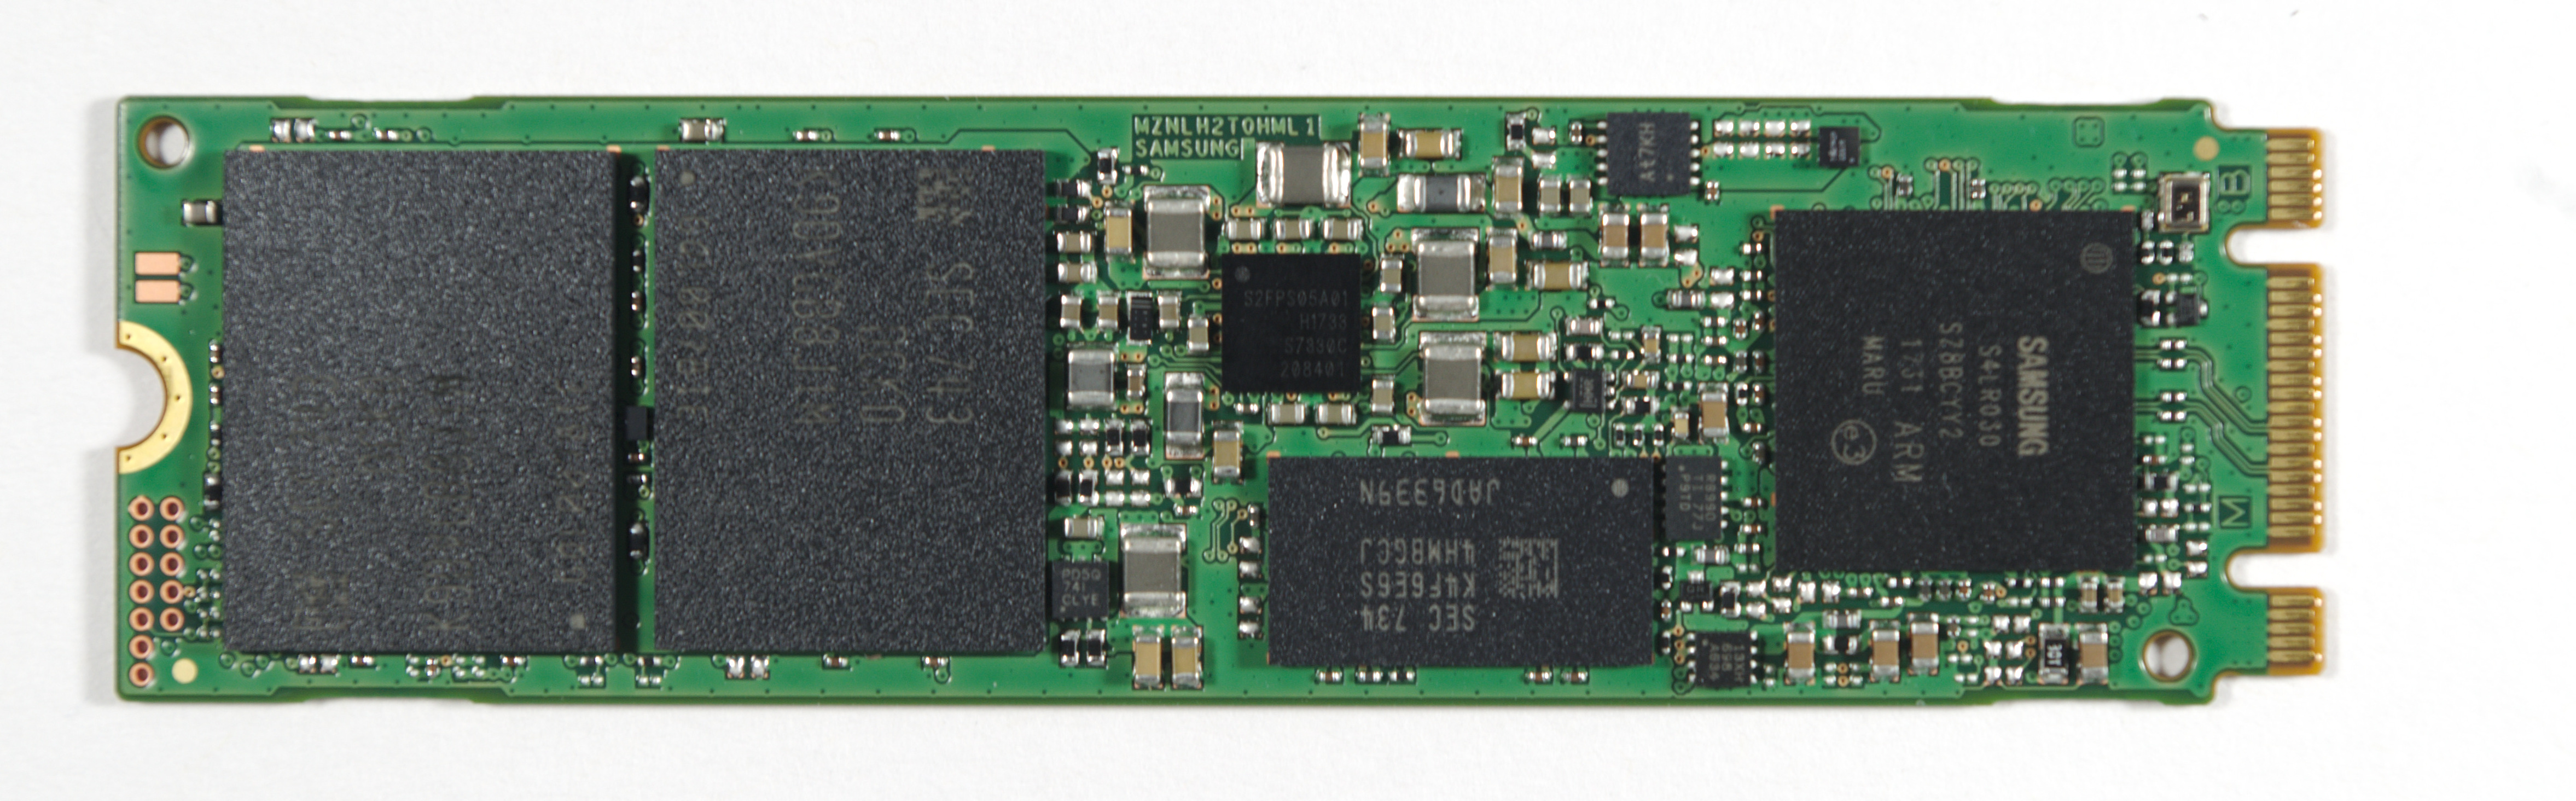
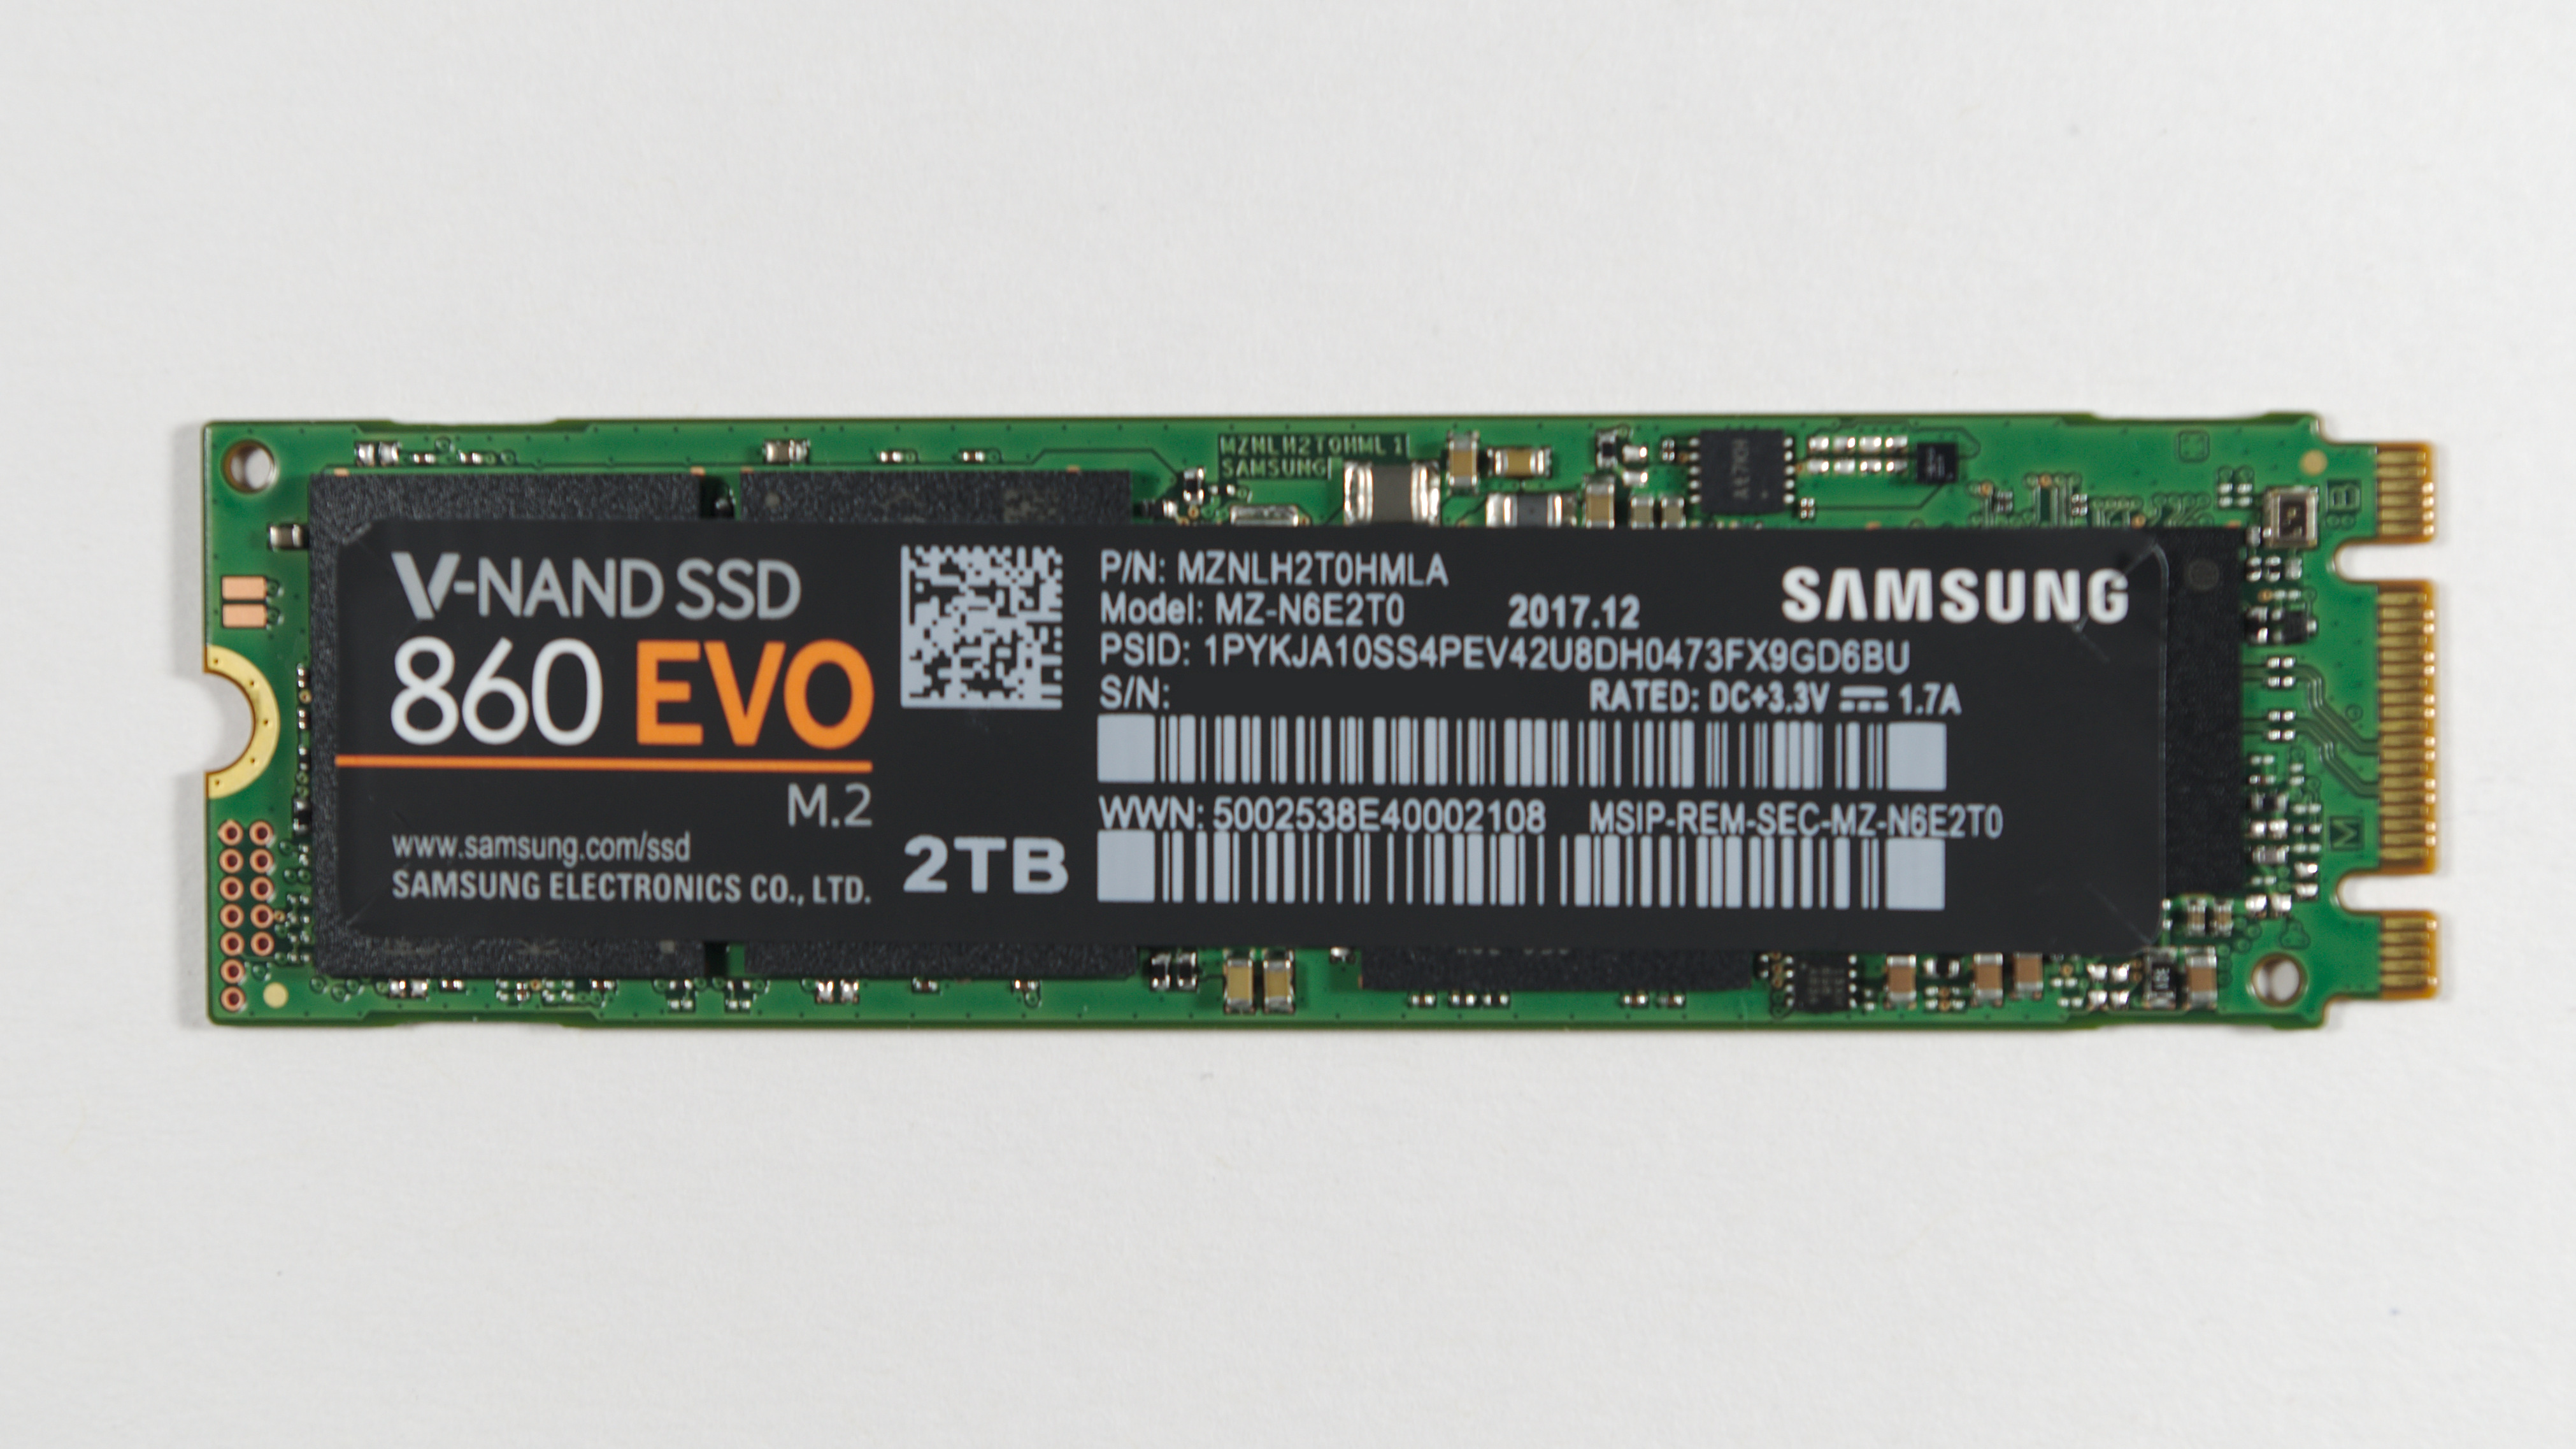
Our Samsung 860 EVO sample for today is the 2TB model in the M.2 SATA form factor. This is the largest M.2 capacity available, though the 2.5" models go up to 4TB. Samsung has managed to make this a single-sided M.2 drive, which is preferred for the broadest compatibility with thin ultrabooks. Thanks to the large per-die capacity and the small size of their SATA controller, Samsung had a much easier time squeezing 2TB onto this drive than they did with the MLC-based 960 PRO NVMe drive. For the 960 PRO product, Samsung had to package the the drive's DRAM stacked on top of the controller in order to have room for four NAND packages; the 2TB 860 EVO M.2 instead uses just two NAND packages, each containing 16 dies.
| Samsung 860 EVO Specifications | ||||||
| Capacity | 250 GB | 500 GB | 1 TB | 2 TB | 4 TB | |
| Interface | 6 Gbps SATA | |||||
| Form Factor | 2.5", mSATA, M.2 2280 | 2.5", M.2 | 2.5" | |||
| Controller | Samsung MJX | |||||
| NAND | Samsung 512Gb 64-layer 3D TLC V-NAND | |||||
| LPDDR4 DRAM | 512 MB | 1 GB | 2 GB | 4 GB | ||
| SLC Write Cache | 12 GB | 22 GB | 42 GB | 78 GB | 78 GB | |
| Sequential Read | up to 560 MB/s | |||||
| Sequential Write (SLC Cache) | up to 520 MB/s | |||||
| Sequential Write (TLC) | 300 MB/s | 300 MB/s | 500 MB/s | |||
| 4KB Random Read | up to 100k IOPS | |||||
| 4KB Random Write | up to 90k IOPS | |||||
| DevSleep Power | 2.5 mW – 7 mW | |||||
| Endurance | 150 TBW | 300 TBW | 600 TBW | 1200 TBW | 2400 TBW | |
| Warranty | 5 years | |||||
| MSRP | $94.99 (38¢/GB) | $169.99 (34¢/GB) | $329.99 (33¢/GB) | $649.99 (32¢/GB) | $1399.99 (35¢/GB) | |
For this review we must point out that it is unusual for us to receive review samples of a M.2 SATA SSD, instead of the larger 2.5" version. The smaller form factor offers the same performance and features, but required us to take a slightly different approach to power measurements. For this review, a 2.5" SATA to M.2 converter board was used. This board's main task is to step the 5V power supply down to the 3.3V used for M.2 SSDs. Some power is wasted in this conversion, so the 860 EVO has a slight handicap in our power and efficiency measurements.
2TB is still quite large for a consumer SSD, and many product lines do not include models this large. 64-layer 3D NAND is also still almost exclusive to the vertically integrated brands that manufacture NAND. These factors mean the 2TB 860 EVO has very few direct competitors. The Crucial MX500 and the WD Blue 3D NAND aka SanDisk Ultra 3D are the only other mainstream 64L TLC SATA drives. We haven't tested the 2TB models from either of those product lines, so this review includes results from the 1TB models. Generally speaking, larger SSDs are faster, but we've seen several cases where multi-TB drives are a bit slower than their 1TB counterparts, so the 1TB models included in this review are not at a clear disadvantage due to their capacity.
The High-Performance SATA SSD Market
For several generations, the SATA SSD market has only been able to offer small incremental performance improvements. Faster NAND and better controllers can't get around the 6Gbps SATA speed limit, so drives have to differentiate themselves with performance at low queue depths, and with power efficiency. The Samsung 860 PRO set several performance records, but for the most part those don't translate into a noticeable difference for most consumer workloads. However, the 860 PRO did greatly improve power efficiency, and it no longer appears to be necessary to sacrifice efficiency to reach the highest levels of performance possible from a SATA SSD.
The new Samsung 860 EVO drives, like the one in this review, get the same controller and DRAM updates as the 860 PRO, but historically TLC-based drives tend to be less power efficient than MLC-based drives. With stiffer competition from Crucial and WD/SanDisk, the 860 EVO will have a tough time standing out as a faster TLC option than anything else—a position that the 850 EVO held securely for most of its time on the market. The 860 EVO needs to match the 860 PRO's power efficiency improvements and deliver at least some performance improvement in order to attain the same unrivaled best-in-class status that the 850 EVO enjoyed.
Most of the industry is using 64-layer 3D NAND flash memory this year—the first time since Samsung's introduction of 3D NAND that they've faced competition that is so close on paper. For most of its long life in the market, the Samsung 850 EVO was unchallenged as the best TLC-based SATA SSD. At times it was able to command a substantial price premium over any other TLC drive and over many MLC drives. That started to change last year, when Intel, Micron, Toshiba and WD/SanDisk beat Samsung to market with 64-layer 3D NAND. Most of Samsung's competitors now have mature high-quality 3D NAND shipping in volume, so Samsung is competing on a fairly level playing field with this generation.
The AnandTech 2017/2018 Testbed
| AnandTech 2017/2018 SSD Testbed | |
| CPU | Intel Xeon E3 1240 v5 |
| Motherboard | ASRock Fatal1ty E3V5 Performance Gaming/OC |
| Chipset | Intel C232 |
| Memory | 4x 8GB G.SKILL Ripjaws DDR4-2400 CL15 |
| Graphics | AMD Radeon HD 5450, 1920x1200@60Hz |
| Software | Windows 10 x64, version 1709 |
| Linux kernel version 4.14, fio version 3.1 | |
- Thanks to Intel for the Xeon E3 1240 v5 CPU
- Thanks to ASRock for the E3V5 Performance Gaming/OC
- Thanks to G.SKILL for the Ripjaws DDR4-2400 RAM
- Thanks to Corsair for the RM750 power supply, Carbide 200R case, and Hydro H60 CPU cooler
- Thanks to Quarch for the XLC Programmable Power Module and accessories
AnandTech Storage Bench - The Destroyer
The Destroyer is an extremely long test replicating the access patterns of very IO-intensive desktop usage. A detailed breakdown can be found in this article. Like real-world usage, the drives do get the occasional break that allows for some background garbage collection and flushing caches, but those idle times are limited to 25ms so that it doesn't take all week to run the test. These AnandTech Storage Bench (ATSB) tests do not involve running the actual applications that generated the workloads, so the scores are relatively insensitive to changes in CPU performance and RAM from our new testbed, but the jump to a newer version of Windows and the newer storage drivers can have an impact.
We quantify performance on this test by reporting the drive's average data throughput, the average latency of the I/O operations, and the total energy used by the drive over the course of the test.
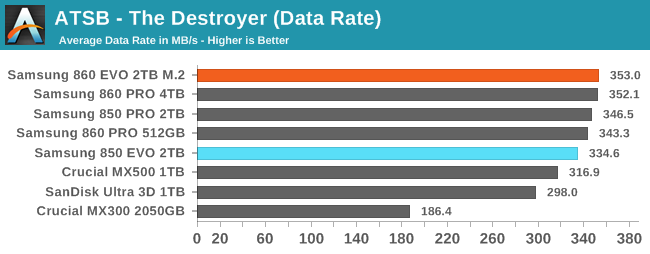
The Samsung 860 EVO 2TB matches the performance of the 4TB 860 PRO. Both of the new generation drives offer small improvements to the average data rate on The Destroyer—enough to secure Samsung's position at the top of the SATA SSD market, but not enough for 850 PRO or EVO owners to have reason to upgrade.
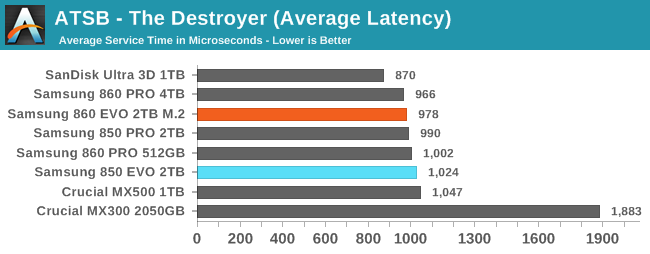
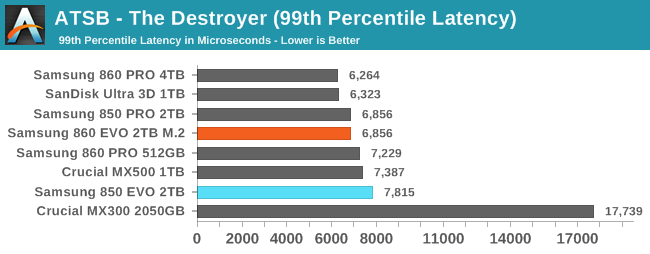
The 860 EVO provides small improvements to both average and 99th percentile latency. The SanDisk Ultra 3D keeps Samsung's drives from being the clear winners by this metric.
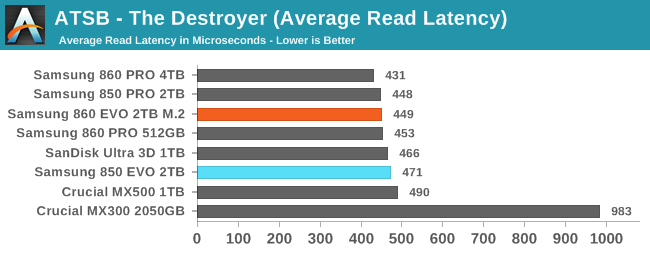
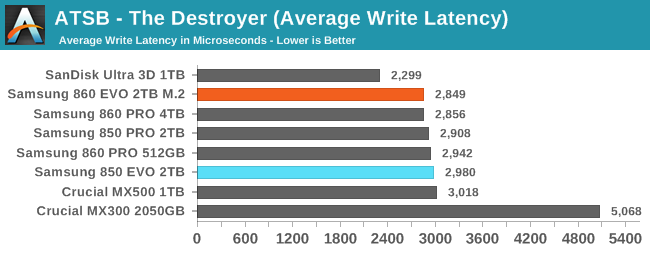
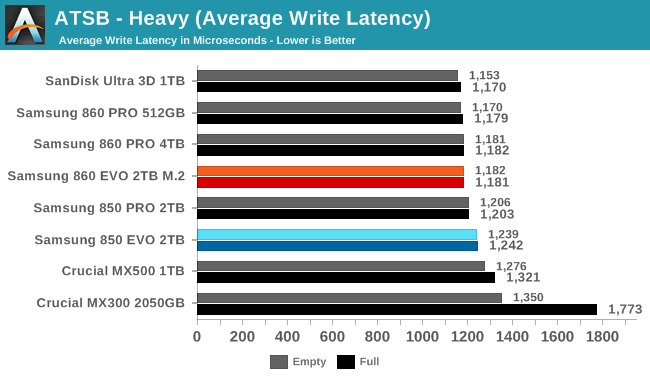
The generational improvements from the 860 EVO are similar for both average read and average write latency. The SanDisk Ultra 3D has a clear advantage for average write latency, but otherwise the current-generation drives with 64L 3D NAND have very similar latency.
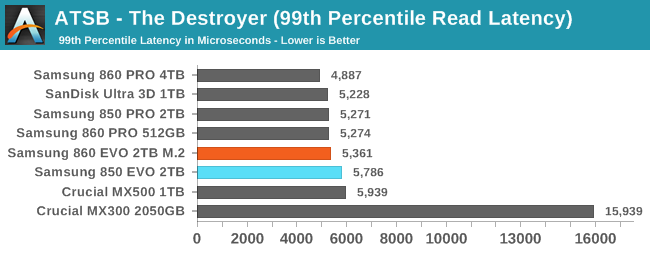
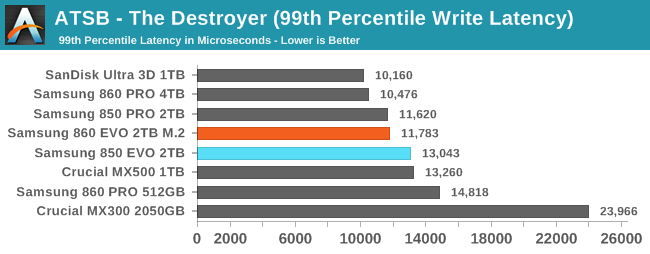
The 860 EVO improves both 99th percentile read and write latency, and by a larger amount than average latencies improved.
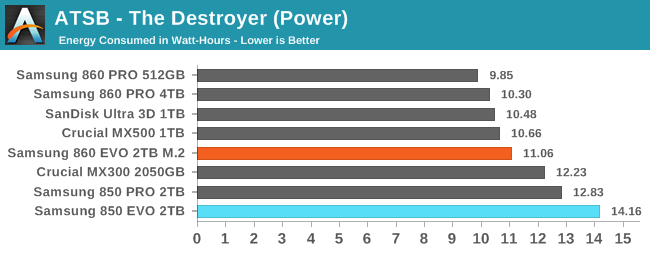
The power consumption of the 860 EVO is much lower than the 850 EVO and is competitive with the latest drives from Crucial and SanDisk, but isn't a match for the 860 PRO. (The 860 EVO's score here is handicapped by the voltage regulation of our SATA to M.2 converter, and the 1TB Crucial and SanDisk drives have less memory to be powering during the test.)
AnandTech Storage Bench - Heavy
Our Heavy storage benchmark is proportionally more write-heavy than The Destroyer, but much shorter overall. The total writes in the Heavy test aren't enough to fill the drive, so performance never drops down to steady state. This test is far more representative of a power user's day to day usage, and is heavily influenced by the drive's peak performance. The Heavy workload test details can be found here. This test is run twice, once on a freshly erased drive and once after filling the drive with sequential writes.
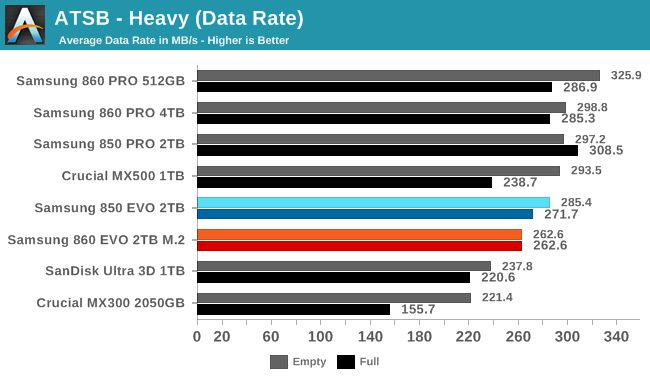
The Samsung 860 EVO's average data rates on the Heavy test are slightly below the 850 EVO, and the full drive and empty drive test runs produced the same average data rate. These regressions still leave the 860 EVO faster than most of its competition, though the Crucial MX500 is clearly faster when the test is run on an empty drive.
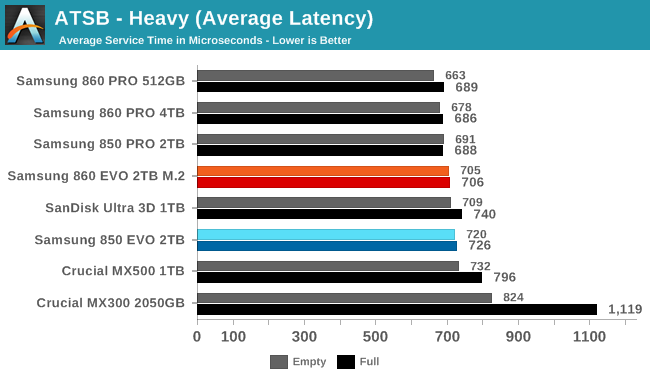
The average and 99th percentile latencies of these SATA drives are mostly quite similar. The Crucial MX300 had clear issues when full and the MX500 has slightly higher latency than its competitors, but otherwise the differences are minimal.
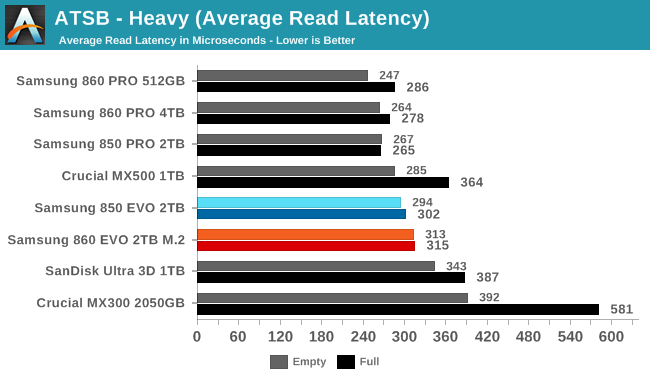
As compared with its predecessor, the Samsung 860 EVO shows slightly higher average read latency and slightly lower average write latency. The 860 EVO's scores are all still within the normal range for this product class.
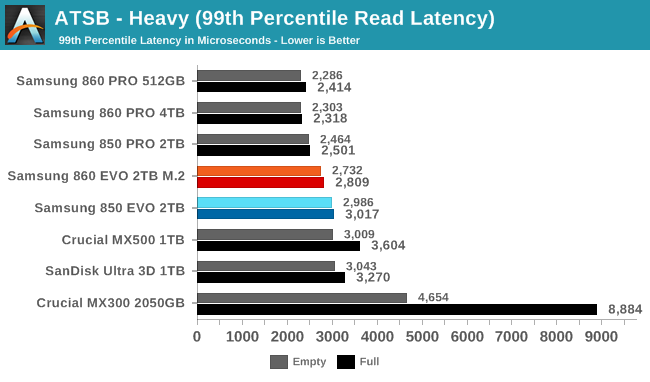
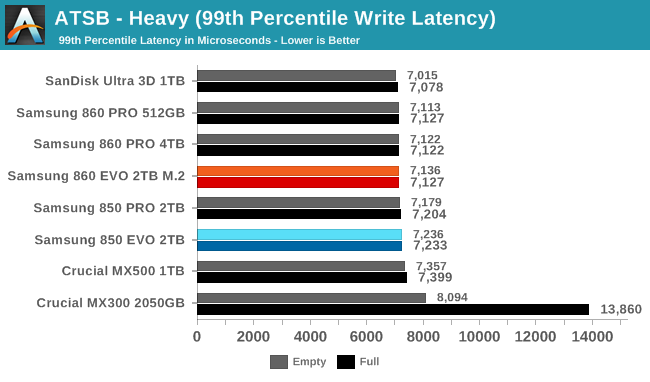
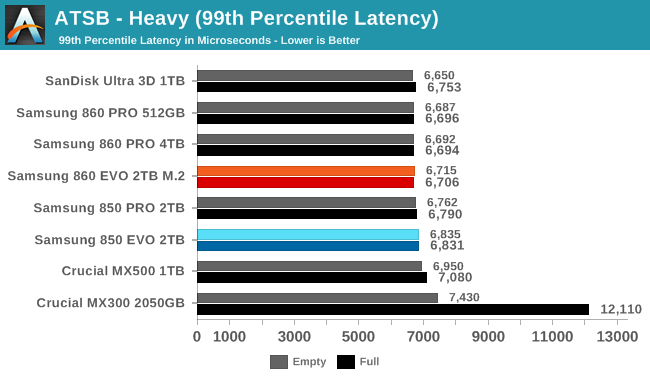
Aside from the Crucial MX300, the 99th percentile write latency scores are all essentially the same for this batch of drives. There's a bit more variation for the 99th percentile read latencies, where the 860 EVO is slightly faster than its predecessor but still not as fast as the current or previous generation MLC drives from Samsung.
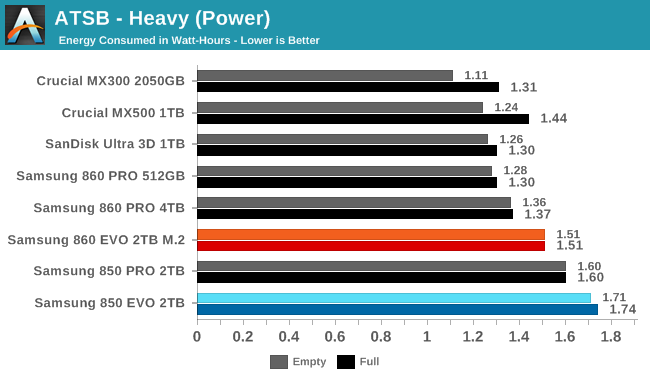
The 860 EVO uses less power during the Heavy test than its predecessor, but the improvement isn't enough to catch up to the Crucial and SanDisk drives, which match or beat the 860 PRO's efficiency.
AnandTech Storage Bench - Light
Our Light storage test has relatively more sequential accesses and lower queue depths than The Destroyer or the Heavy test, and it's by far the shortest test overall. It's based largely on applications that aren't highly dependent on storage performance, so this is a test more of application launch times and file load times. This test can be seen as the sum of all the little delays in daily usage, but with the idle times trimmed to 25ms it takes less than half an hour to run. Details of the Light test can be found here. As with the ATSB Heavy test, this test is run with the drive both freshly erased and empty, and after filling the drive with sequential writes.
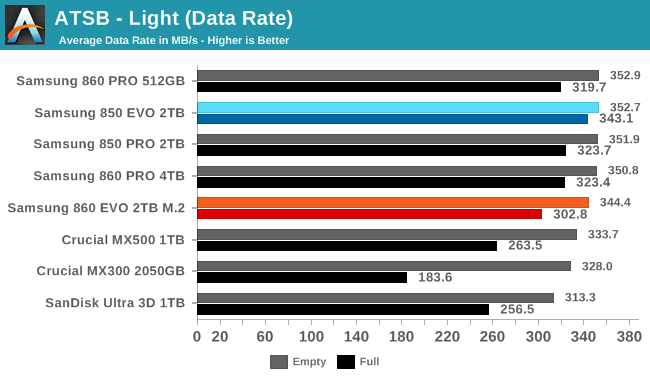
The average data rate of the Samsung 860 EVO on the Light test is slightly lower than the 850 EVO, but still definitely within the normal range for this class of drives.
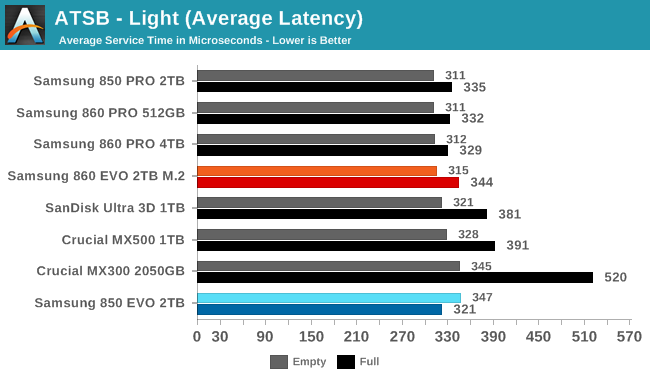
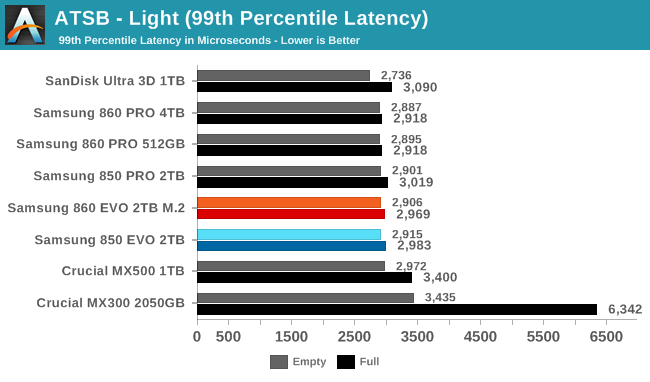
Average and 99th percentile latencies from the 860 EVO on the Light test are about the same as its predecessor and Samsung's other SATA SSDs. The competing SATA drives tend to show a bit higher average latency when the test is run on a full drive.
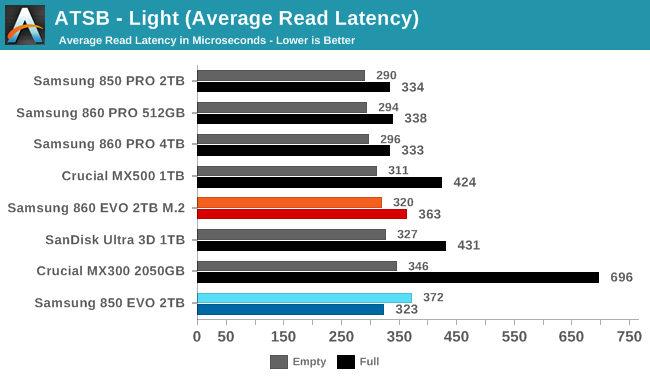
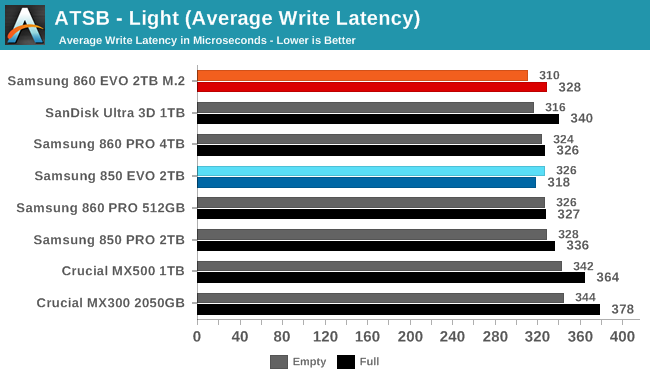
Average read and write latencies for the 860 EVO are within the normal range, for Samsung's drives. The competing drives from Crucial and SanDisk show larger increases to average read latency when the test is run on a full drive.
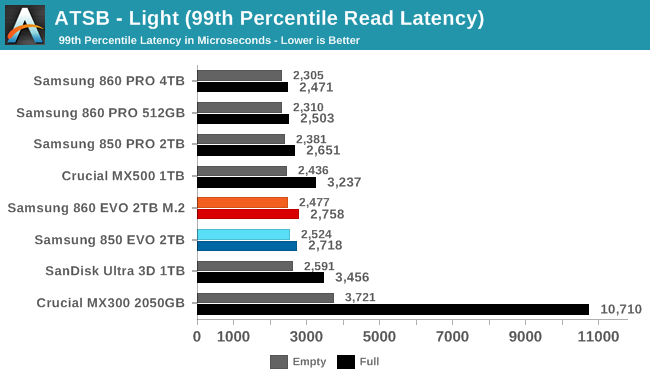
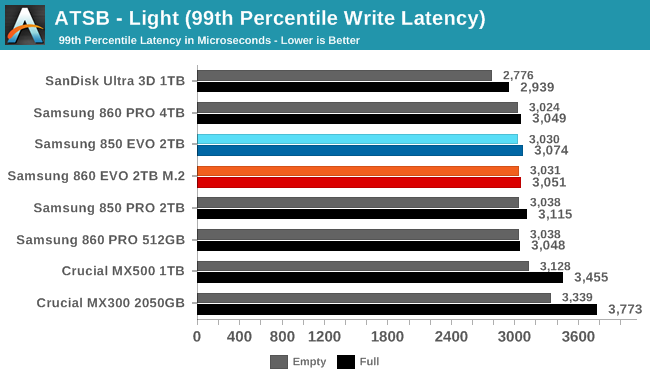
Looking at 99th percentile read and write latencies on the Light test, Samsung's drives are generally the least-affected by being full, and the 860 EVO doesn't break that pattern.The SanDisk Ultra 3D has a slightly better 99th percentile write latency than Samsung's SATA drives.
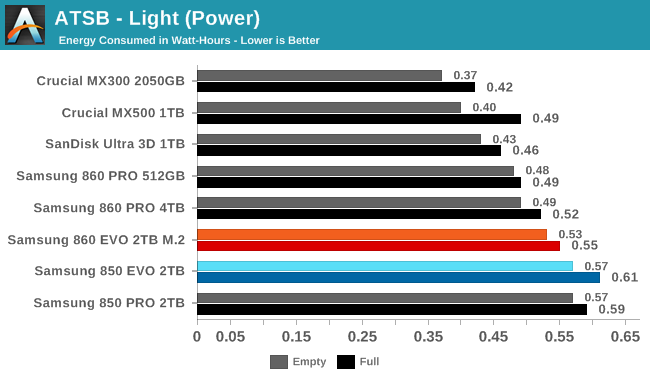
The Samsung 860 EVO shows clear improvement in power consumption over its predecessor, but the Crucial and SanDisk drives are still clearly in the lead over the Samsung drives.
Random Read Performance
Our first test of random read performance uses very short bursts of operations issued one at a time with no queuing. The drives are given enough idle time between bursts to yield an overall duty cycle of 20%, so thermal throttling is impossible. Each burst consists of a total of 32MB of 4kB random reads, from a 16GB span of the disk. The total data read is 1GB.
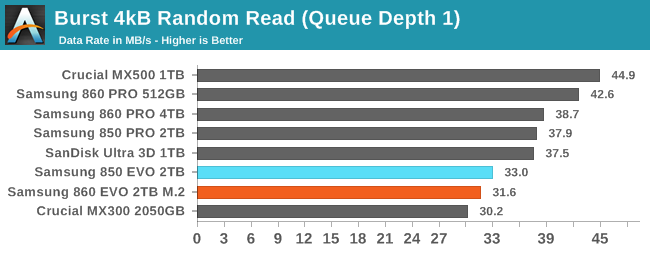
The Samsung 860 EVO's burst random read speed is a bit slower than that of the 850 EVO, and both drives are slower than the fastest competing 3D TLC drives.
Our sustained random read performance is similar to the random read test from our 2015 test suite: queue depths from 1 to 32 are tested, and the average performance and power efficiency across QD1, QD2 and QD4 are reported as the primary scores. Each queue depth is tested for one minute or 32GB of data transferred, whichever is shorter. After each queue depth is tested, the drive is given up to one minute to cool off so that the higher queue depths are unlikely to be affected by accumulated heat build-up. The individual read operations are again 4kB, and cover a 64GB span of the drive.
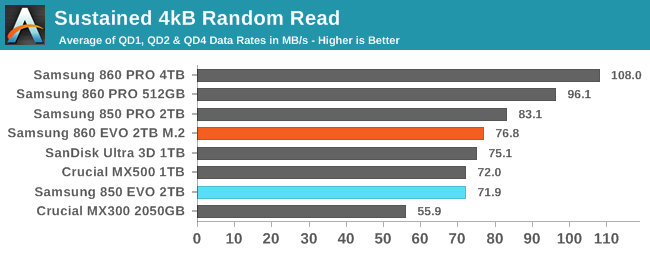
On the longer random read test with some higher queue depths, Samsung retakes their position of having the fastest TLC drive, though not by a significant margin. The MLC-based 850 PRO and 860 PRO have a substantial advantage.
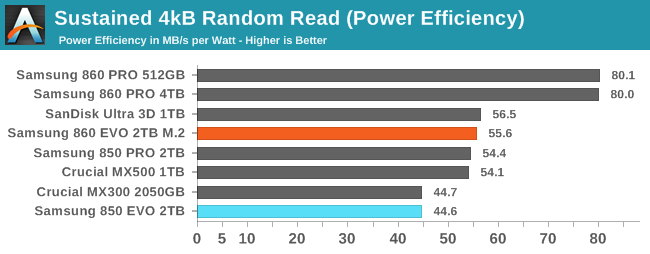
The power efficiency of the 860 EVO is much better than the 850 EVO, but it's only enough to bring it in line with its current competition. The improvement doesn't even come close to the 860 PRO's impressive boost in efficiency.
 |
|||||||||
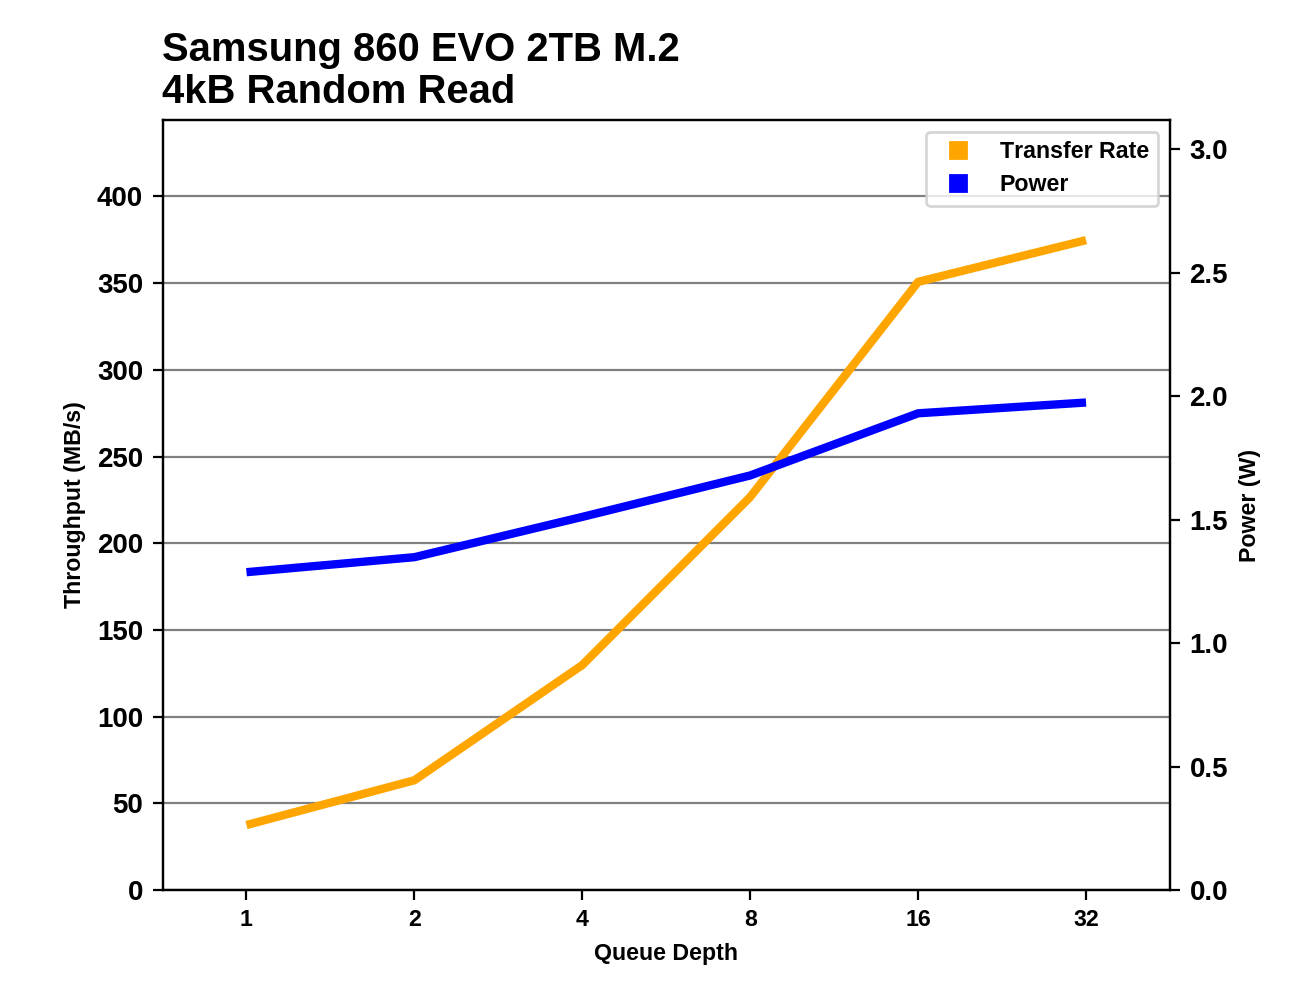
The 3D TLC drives in this bunch (with the exception of the outgoing Crucial MX300) all show very similar random read performance scaling as queue depths increase. The Crucial MX500 lags a bit at high queue depths, but all of the current-generation drives top out at about the same speed. The 860 PRO is significantly faster across the entire test while using about the same amount of power.
Random Write Performance
Our test of random write burst performance is structured similarly to the random read burst test, but each burst is only 4MB and the total test length is 128MB. The 4kB random write operations are distributed over a 16GB span of the drive, and the operations are issued one at a time with no queuing.
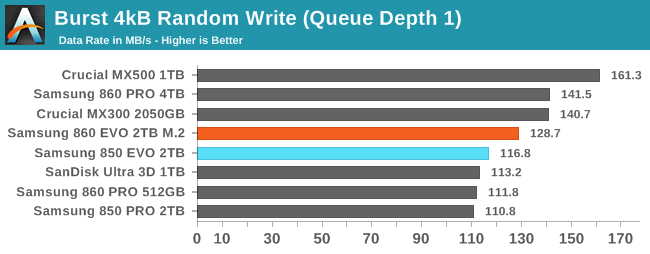
The burst random write speed of the 860 EVO is improved significantly over the 850 EVO, but Crucial's SLC write caches on the MX300 and MX500 are still faster.
As with the sustained random read test, our sustained 4kB random write test runs for up to one minute or 32GB per queue depth, covering a 64GB span of the drive and giving the drive up to 1 minute of idle time between queue depths to allow for write caches to be flushed and for the drive to cool down.
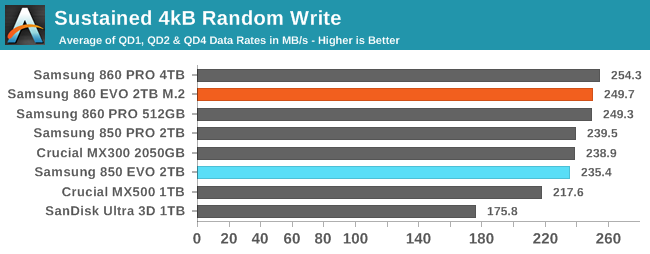
The sustained random write performance of the Samsung 860 EVO is about the same as the 860 PRO, and is a bit ahead of the competing TLC drives. This is one test where the 1TB models from Crucial and SanDisk appear to be at a disadvantage due to their lower capacities, so a fairer test against the 2TB models of those products would probably show a substantially smaller lead for the 860 EVO.
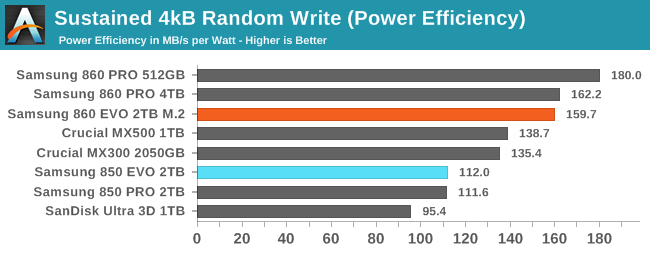
The 860 EVO's jump in power efficiency is almost as large as the 860 PRO's improvement. This puts the 860 EVO well ahead of the competing TLC SSDs.
 |
|||||||||
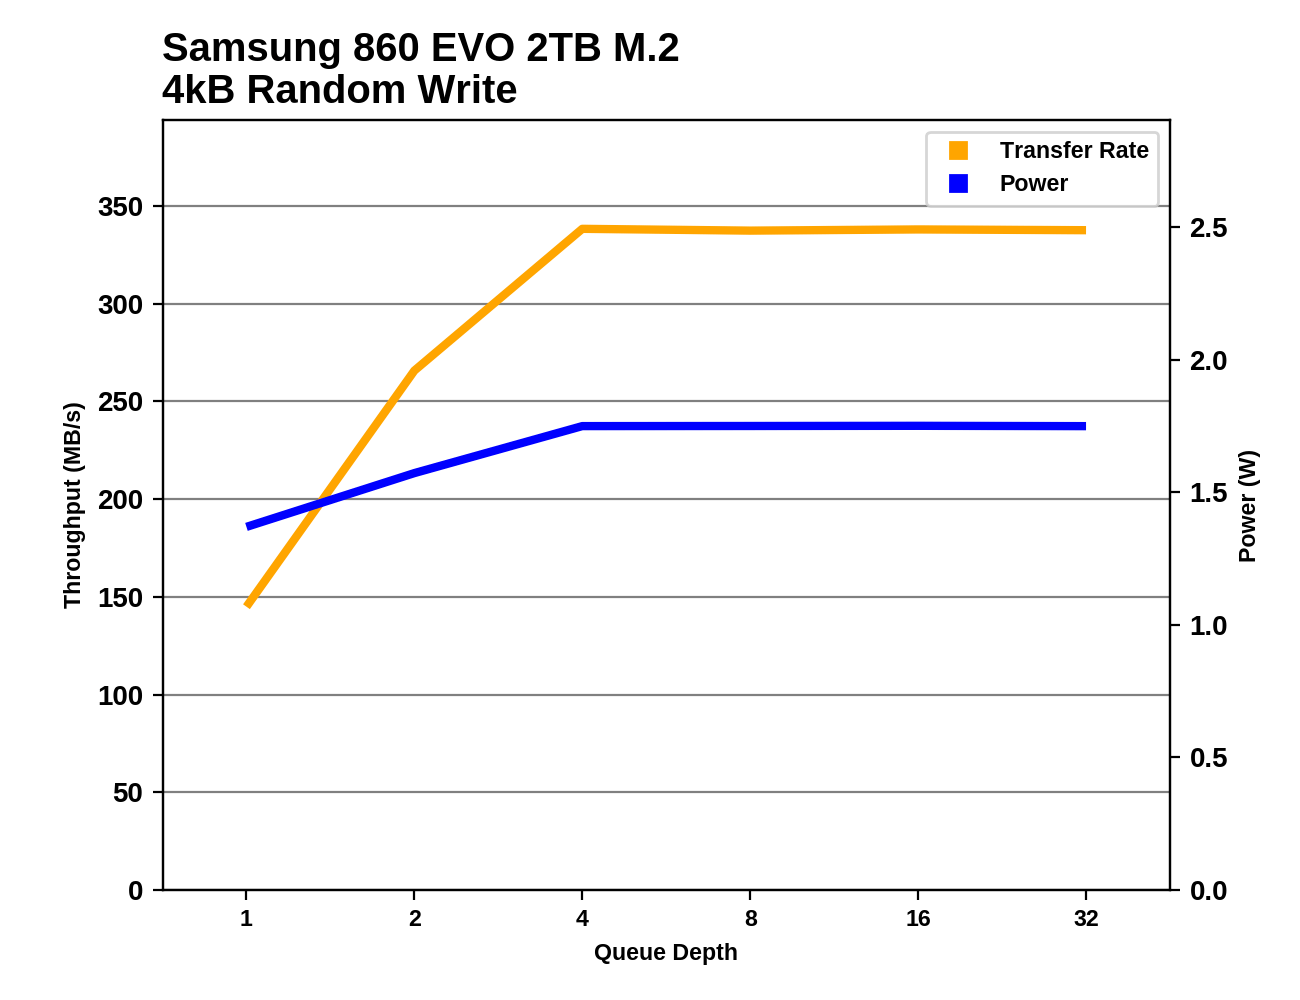
Most of these SSDs reach full random write speed at QD4. The 1TB Crucial MX500 is the noticeable outlier with much slower performance growth that doesn't reach full speed until QD16. The 1TB SanDisk Ultra 3D saturates at QD4, but with throughput that is far below the Samsung drives. Even the remarkably power-efficient (for its time) Crucial MX300 uses more power than the 860 EVO, while delivering slightly lower performance.
Sequential Read Performance
Our first test of sequential read performance uses short bursts of 128MB, issued as 128kB operations with no queuing. The test averages performance across eight bursts for a total of 1GB of data transferred from a drive containing 16GB of data. Between each burst the drive is given enough idle time to keep the overall duty cycle at 20%.
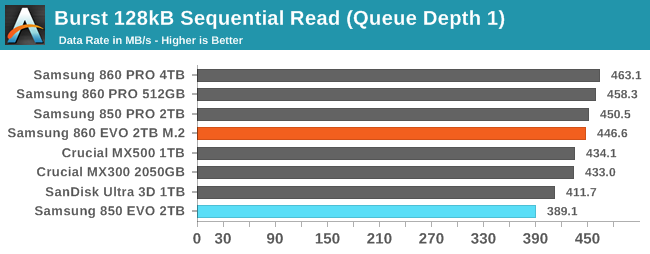
The burst sequential read performance of the 850 EVO was no longer up to par, but the 860 EVO fixes that and puts Samsung back on top among TLC drives.
Our test of sustained sequential reads uses queue depths from 1 to 32, with the performance and power scores computed as the average of QD1, QD2 and QD4. Each queue depth is tested for up to one minute or 32GB transferred, from a drive containing 64GB of data.
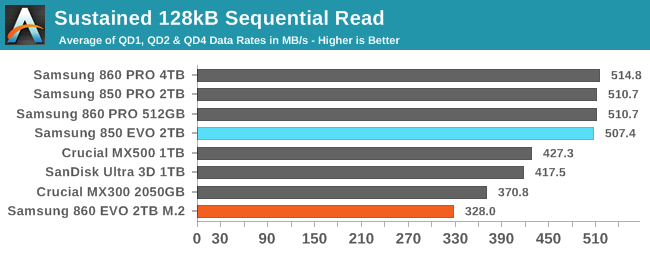
The sustained sequential read performance of the 860 EVO takes a surprising step backward, falling behind the Crucial and SanDisk drives. This test runs on a data set that has been fragmented by some random writes, and the performance regression is may be due to an increase in NAND page sizes with Samsung's 512Gb 64L TLC, making more work for the drive to unravel its internal fragmentation.
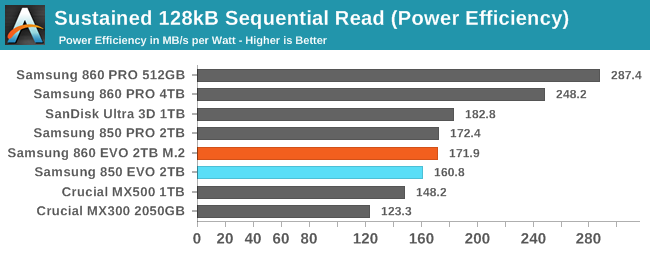
In spite of the performance regression, the 860 EVO still manages to slightly improve power efficiency on the sequential read test, bringing it close to the SanDisk Ultra 3D.
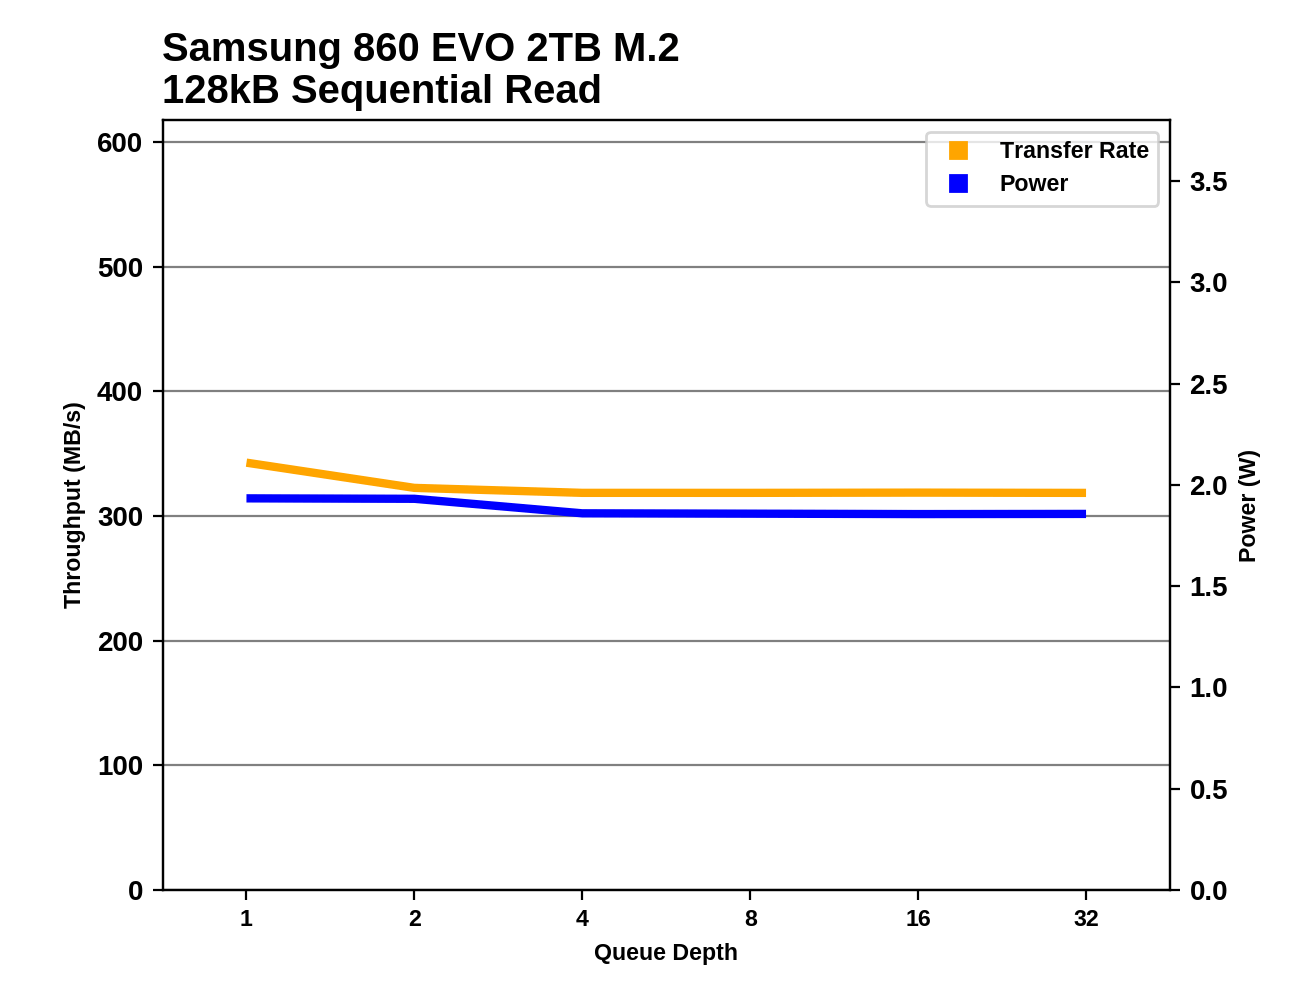 |
|||||||||
The Samsung 860 EVO shows very little dependence on queue depth for either performance or power consumption. Its power consumption is just under 2W at this speed, while the 860 PRO draws just over 2W when saturating the SATA link.
Sequential Write Performance
Our test of sequential write burst performance is structured identically to the sequential read burst performance test save for the direction of the data transfer. Each burst writes 128MB as 128kB operations issued at QD1, for a total of 1GB of data written to a drive containing 16GB of data.
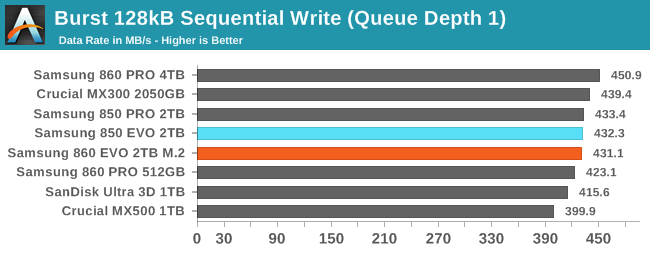
The burst sequential write speed of the 860 EVO is the same as the 850 EVO and 850 PRO. The Crucial MX300 and 4TB 860 PRO are slightly faster, but overall there isn't much variation on this test.
Our test of sustained sequential writes is structured identically to our sustained sequential read test, save for the direction of the data transfers. Queue depths range from 1 to 32 and each queue depth is tested for up to one minute or 32GB, followed by up to one minute of idle time for the drive to cool off and perform garbage collection. The test is confined to a 64GB span of the drive.
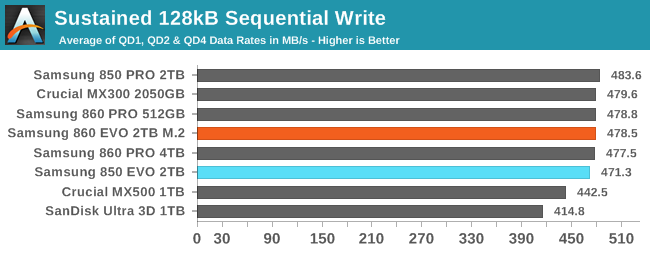
The 860 EVO saturates the SATA bus on the longer sequential write test that hits higher queue depths. Performance is a few MB/s faster than the 850 EVO, but that is an insignificant difference.
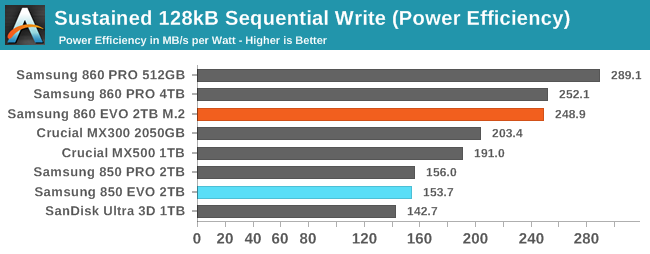
Almost all of these SSDs offer near identical performance on this test, but their power efficiency varies greatly. The 860 EVO is almost on par with the 860 PRO, and both are far more efficient than their predecessors and their current competition.
 |
|||||||||
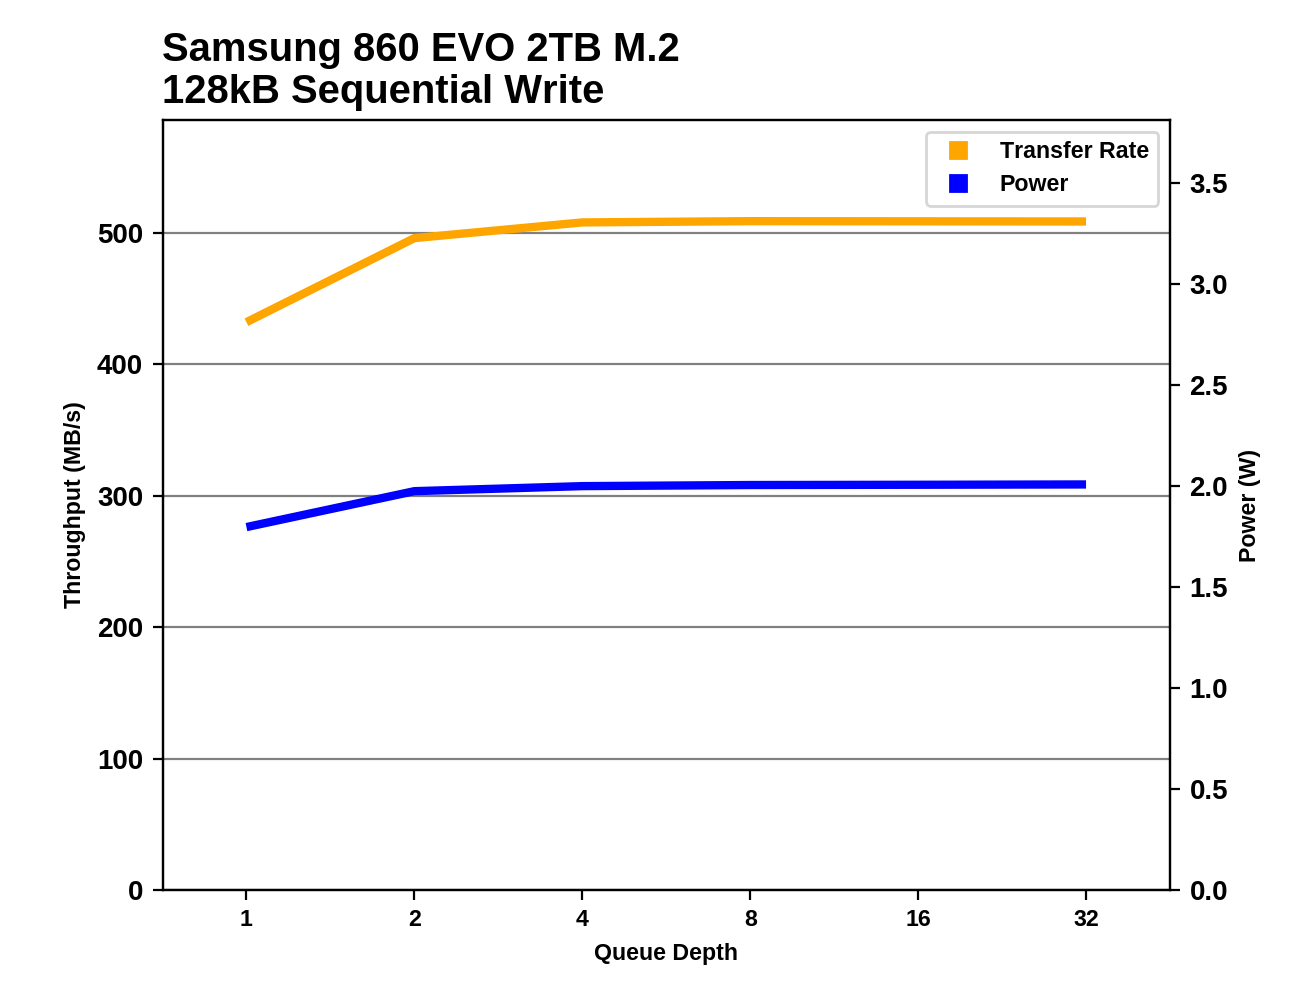
As with random writes, the sequential write performance of most of these drives saturates around QD4. The Samsung 860 EVO draws almost exactly 2W, lower than anything else except the 860 PRO.
Mixed Random Performance
Our test of mixed random reads and writes covers mixes varying from pure reads to pure writes at 10% increments. Each mix is tested for up to 1 minute or 32GB of data transferred. The test is conducted with a queue depth of 4, and is limited to a 64GB span of the drive. In between each mix, the drive is given idle time of up to one minute so that the overall duty cycle is 50%.
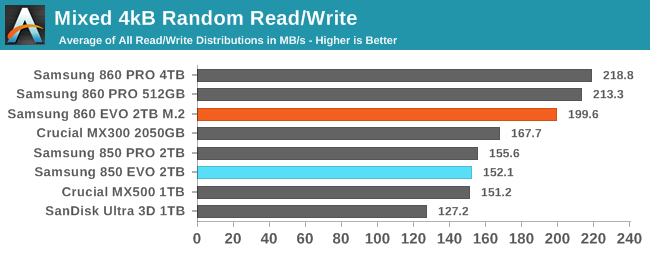
The performance of the Samsung 850 EVO on the mixed random I/O test was still adequate in the face of today's competition, so the large jump in performance the 860 EVO brings gives Samsung a substantial lead over other TLC SATA SSDs
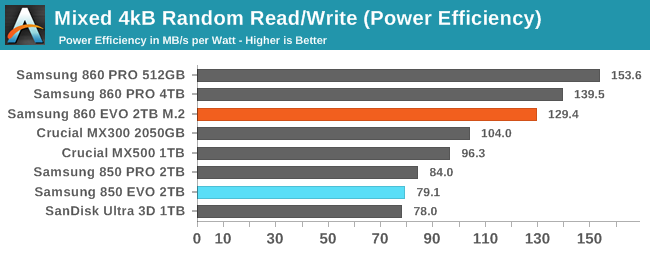
The power efficiency gains of the 860 EVO are even larger than the performance gains; the 860 EVO delivers 33% higher performance per Watt than the next best 64L 3D TLC drive.
 |
|||||||||
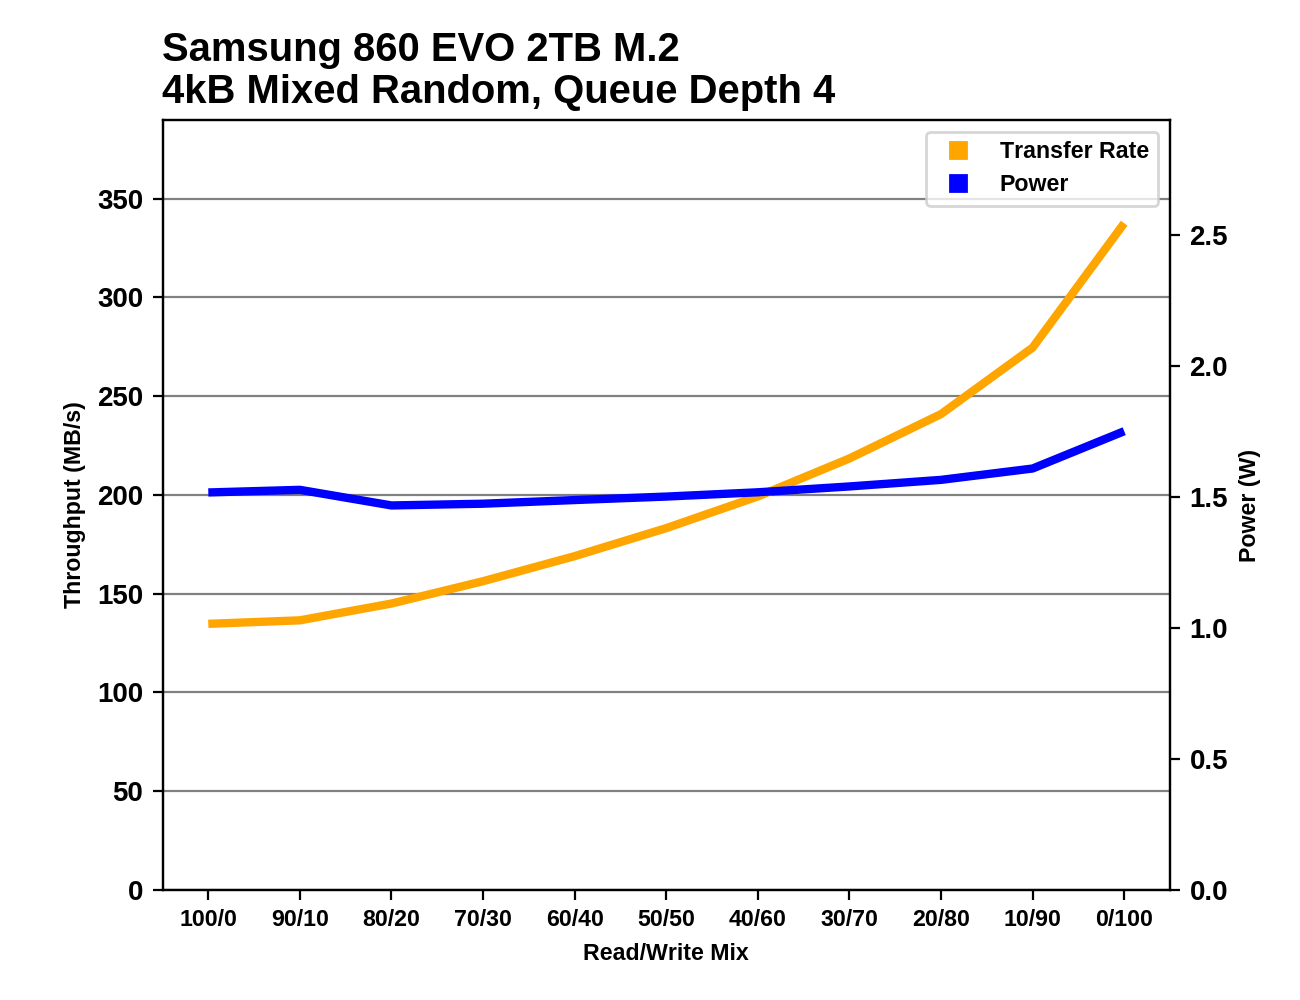
The performance of the 860 EVO climbs steadily as the proportion of writes in the test workload increases. The 850 EVO's performance was mostly flat through the first half of the test, and the competition's drives tend to lose a bit of performance somewhere along the way before recovering near the end of the test.
Mixed Sequential Performance
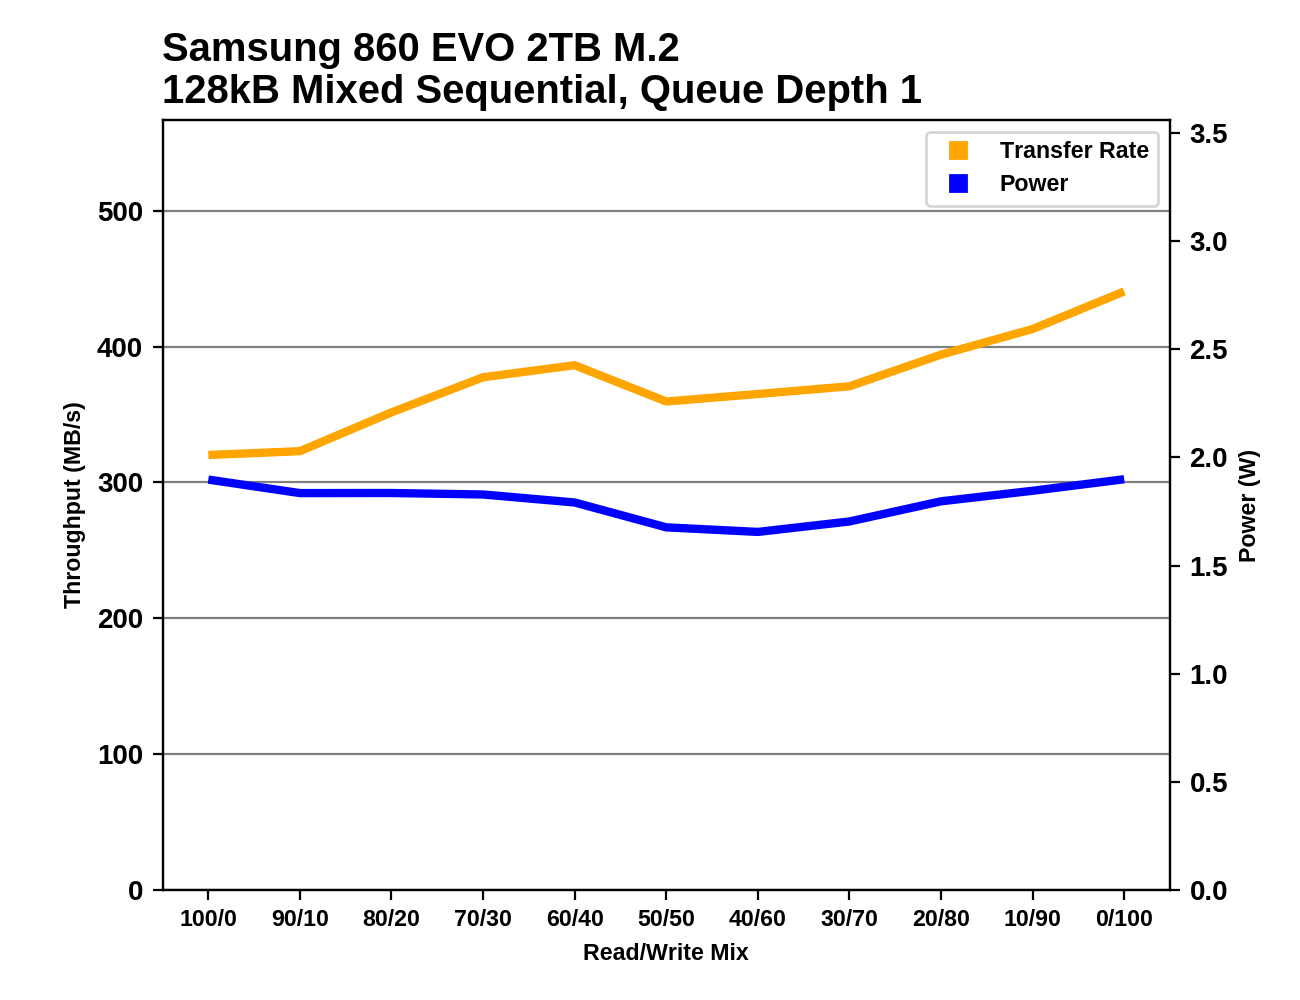
Our test of mixed sequential reads and writes differs from the mixed random I/O test by performing 128kB sequential accesses rather than 4kB accesses at random locations, and the sequential test is conducted at queue depth 1. The range of mixes tested is the same, and the timing and limits on data transfers are also the same as above.
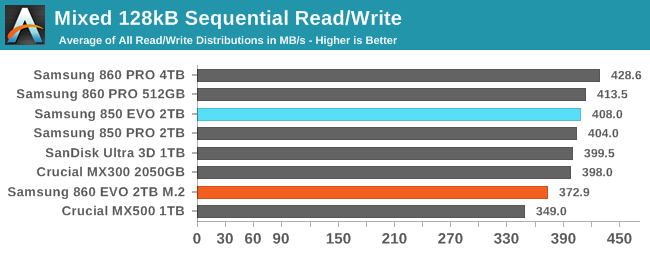
The mixed sequential I/O test shows a bit of a performance regression for the 860 EVO, dropping it slightly below the normal range for good SATA drives. The Crucial MX500 is a bit more of an outlier on the low side.
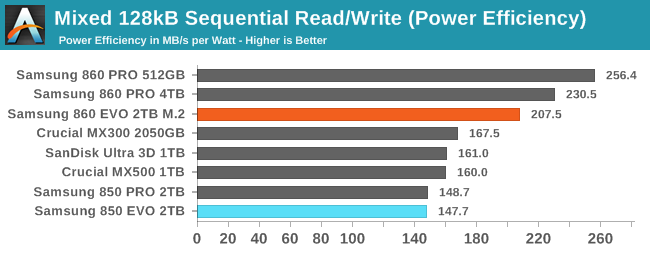
If it weren't for the 860 PRO, the power efficiency improvement of the 860 EVO over its predecessor would be very impressive. Even overshadowed by its MLC counterpart, the 860 EVO's efficiency is great and well ahead of the competing mainstream SATA SSDs.
 |
|||||||||
Most of Samsung's SATA drives exhibit a bathtub curve for performance, hitting a minimum early in the second half of the test. The 860 EVO gets off to a poor start and actually increases performance through most of the first half of the test as it catches up to the typical Samsung performance curve.
Power Management
Real-world client storage workloads leave SSDs idle most of the time, so the active power measurements presented earlier in this review only account for a small part of what determines a drive's suitability for battery-powered use. Especially under light use, the power efficiency of a SSD is determined mostly be how well it can save power when idle.
SATA SSDs are tested with SATA link power management disabled to measure their active idle power draw, and with it enabled for the deeper idle power consumption score and the idle wake-up latency test. Our testbed, like any ordinary desktop system, cannot trigger the deepest DevSleep idle state.
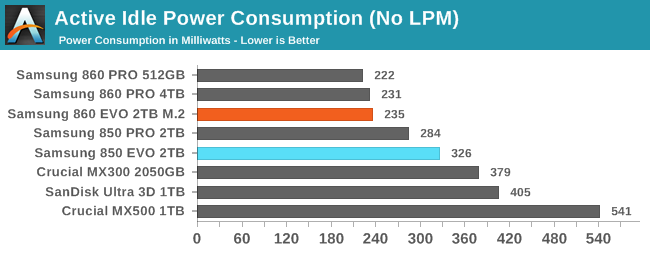
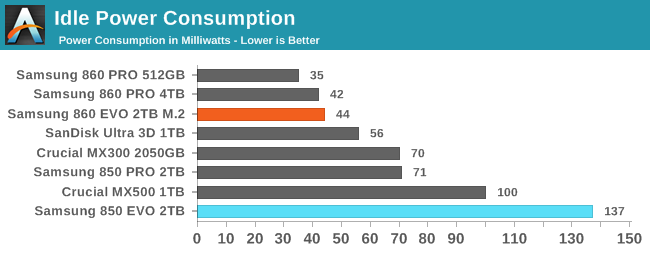
The idle power measurements for the 860 EVO are just a few milliwatts higher than for the 860 PRO, which can be attributed entirely to the M.2 to SATA converter board (it has a status LED). The 860 EVO benefits from all the same controller and DRAM power savings the 860 PRO brought. While there are some smaller SATA SSDs that have lower idle power numbers (eg. some DRAMless SSDs), among multi-TB drives Samsung has the lead.
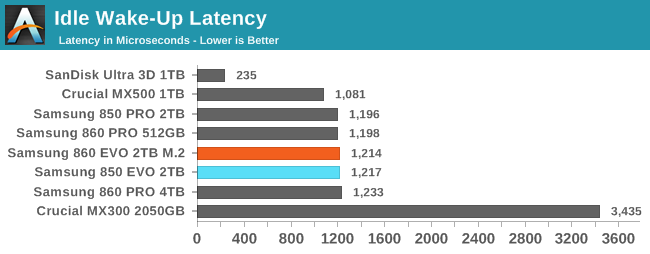
While Samsung's idle power usage has improved significantly with the 860 generation, the wake-up latency is unchanged. There's room for improvement here as many drives are able to wake up much faster from sleep states that are almost as deep as the Samsung 860 EVO's idle.
Conclusion
Samsung's update to their TLC SATA SSD is not quite as impressive as the improvements the MLC-based 860 PRO showed, but the Samsung 860 EVO's gains are still enough to put Samsung back on top in that product segment. The competition had caught up to the 850 EVO and surpassed it in several cases in recent months, but Samsung can still deliver a top-notch SSD.
The 860 EVO's performance did not improve in every metric, but on most of them it is slightly faster than the 850 EVO and it is usually as fast as any other TLC SATA SSD. The small handful of regressions should not have much effect on normal use and are not particularly severe even on synthetic benchmarks.
The Samsung 860 EVO's power consumption never goes much above 2W, regardless of the workload. At idle, it uses less power than any other drive in its class. However, total energy usage on our ATSB tests is still trailing behind some of the competitors, so the 860 EVO isn't the unqualified best choice for maximizing battery life.
Overall, the performance and power consumption of the Samsung 860 EVO make it a worthy successor to the 850 EVO. It does not offer any compelling reason for current users of an 850 EVO or similar SSD to upgrade, but the improvements are measurable, if otherwise usually imperceptible. For new systems, the 860 EVO is a reasonable offering for today's market, provided the price is right.
| SATA SSD Price Comparison | |||||
| 240-275GB | 480-525GB | 960-1050GB | 2TB | ||
| Samsung 860 EVO | $94.99 (38¢/GB) |
$169.99 (34¢/GB) |
$299.99 (30¢/GB) |
$649.99 (32¢/GB) |
|
| Crucial MX500 | $79.99 (32¢/GB) |
$134.95 (27¢/GB) |
$259.99 (26¢/GB) |
$499.99 (25¢/GB) |
|
| Crucial MX300 | $89.99 (33¢/GB) |
$147.45 (28¢/GB) |
$269.99 (26¢/GB) |
$528.70 (26¢/GB) |
|
| Samsung 850 EVO | $87.99 (35¢/GB) |
$149.99 (30¢/GB) |
$349.20 (35¢/GB) |
$697.95 (35¢/GB) |
|
| SanDisk Ultra 3D | $79.99 (32¢/GB) |
$129.99 (26¢/GB) |
$270.50 (27¢/GB) |
$499.99 (25¢/GB) |
|
| WD Blue 3D NAND | SATA | $79.99 (32¢/GB) |
$134.99 (27¢/GB) |
$259.99 (26¢/GB) |
$499.99 (25¢/GB) |
| M.2 | $90.41 (36¢/GB) |
$139.99 (28¢/GB) |
$289.99 (29¢/GB) |
$599.99 (30¢/GB) |
|
| Samsung 860 PRO | $139.99 (55¢/GB) |
$249.99 (49¢/GB) |
$479.99 (47¢/GB) |
$949.99 (46¢/GB) |
|
| Intel 545s | $89.99 (35¢/GB) |
$149.99 (29¢/GB) |
|||
| Crucial BX300 | $87.99 (37¢/GB) |
$144.99 (30¢/GB) |
|||
Looking specifically at 2TB M.2 SATA alternatives to the drive in this review, we find the WD Blue 3D NAND is $50 cheaper, and the 860 EVO is definitely not worth $50 more. Broadening the price comparison to include 2.5" models, the competition is much stronger. The 860 EVO is still selling at MSRP, and those prices are not competitive. The 2TB Crucial MX500 for $500 makes a lot more sense than the 2TB 860 EVO for $650.
Across the full range of capacities, Samsung is trying to continue charging a premium that their product no longer justified, because the alternatives are just as good. 30¢/GB should be about the upper limit of pricing on the 860 EVO, instead of being the lower limit.
As 64L 3D TLC finds its way out to other brands and as the other NAND manufacturers start supplying their 512Gb 64L TLC parts in volume, the competition will only increase. Samsung's reputation can guarantee the 860 EVO a lot of sales, but there are better deals out there.


