Original Link: https://www.anandtech.com/show/11658/the-amd-ryzen-3-1300x-ryzen-3-1200-cpu-review
The AMD Ryzen 3 1300X and Ryzen 3 1200 CPU Review: Zen on a Budget
by Ian Cutress on July 27, 2017 9:30 AM EST- Posted in
- CPUs
- AMD
- Zen
- Ryzen
- Ryzen 3
- Ryzen 3 1300X
- Ryzen 3 1200
AMD has always promised that Zen is a core suitable for entry level x86 computers all the way up to high-performance server parts. Within that scale so far, AMD has launched EPYC for servers, Ryzen 7 for high-end desktop and Ryzen 5 for mainstream consumers. All that is left is Threadripper for super-high-end desktops, coming in August, Zen paired with graphics, coming in Q3/Q4, and Ryzen 3 for entry level desktops, being launched today. The two entry level parts are quad core Zen CPUs, targeting the $109 to $129 boundary and offering four full x86 cores for the same price Intel offers two cores with hyperthreading.
Putting Zen on a Scale
Designing a core that scales from entry level to graphics to laptops to desktop and up to server is very difficult. You need a design that is very power efficient at the low end of the spectrum, but can push with enough grunt at the very top. When you design a core for each of those specific markets, there are tradeoffs you can make – features for one might not be needed on the other and vice versa. Then add in to the mix thinks like die-size, which will directly affect the cost of the products, and the need to remain price competitive is also an issue. Beyond the core design, there has to be sufficient memory bandwidth and IO for all the processors being made. Having a one-core-fits-all approach is tough.
However AMD seems to have pulled it off, going so far as using one silicon die design for everything aside from graphics. The Zen core has shown itself to be a big upswing in performance compared to AMD’s previous generation microarchitecture, and positioned at a price and performance competitive level at almost every stage of its so far. EPYC competes against Skylake-SP Xeons in important benchmarks, Ryzen 7 takes on Intel’s HEDT at half the cost, and Ryzen 5 offers a 3:1 ratio on thread count against the Core i5s at a similar price.
We’ve tested all three, in our reviews listed below:
- Sizing Up Servers: Intel's Skylake-SP Xeon versus AMD's EPYC 7000
- The AMD Zen and Ryzen 7 Review: A Deep Dive on 1800X, 1700X and 1700
- The AMD Ryzen 5 1600X vs Core i5 Review: Twelve Threads vs Four at $250
We also interviewed AMD’s CEO, Lisa Su, as the first Zen products launched:
So far all the products launched with Zen have aimed at the upper echelons of the PC market, covering mainstream, enthusiasts and enterprise customers – areas with high average selling prices to which a significant number of column inches are written. But the volume segment, key for metrics such as market share, are in the entry level products. So far the AMD Zen core, and the octo-core Zeppelin silicon design, has been battling on the high-end. With Ryzen 3, it comes to play in the budget market.
Zen Zen Zen-Gören Eriksson
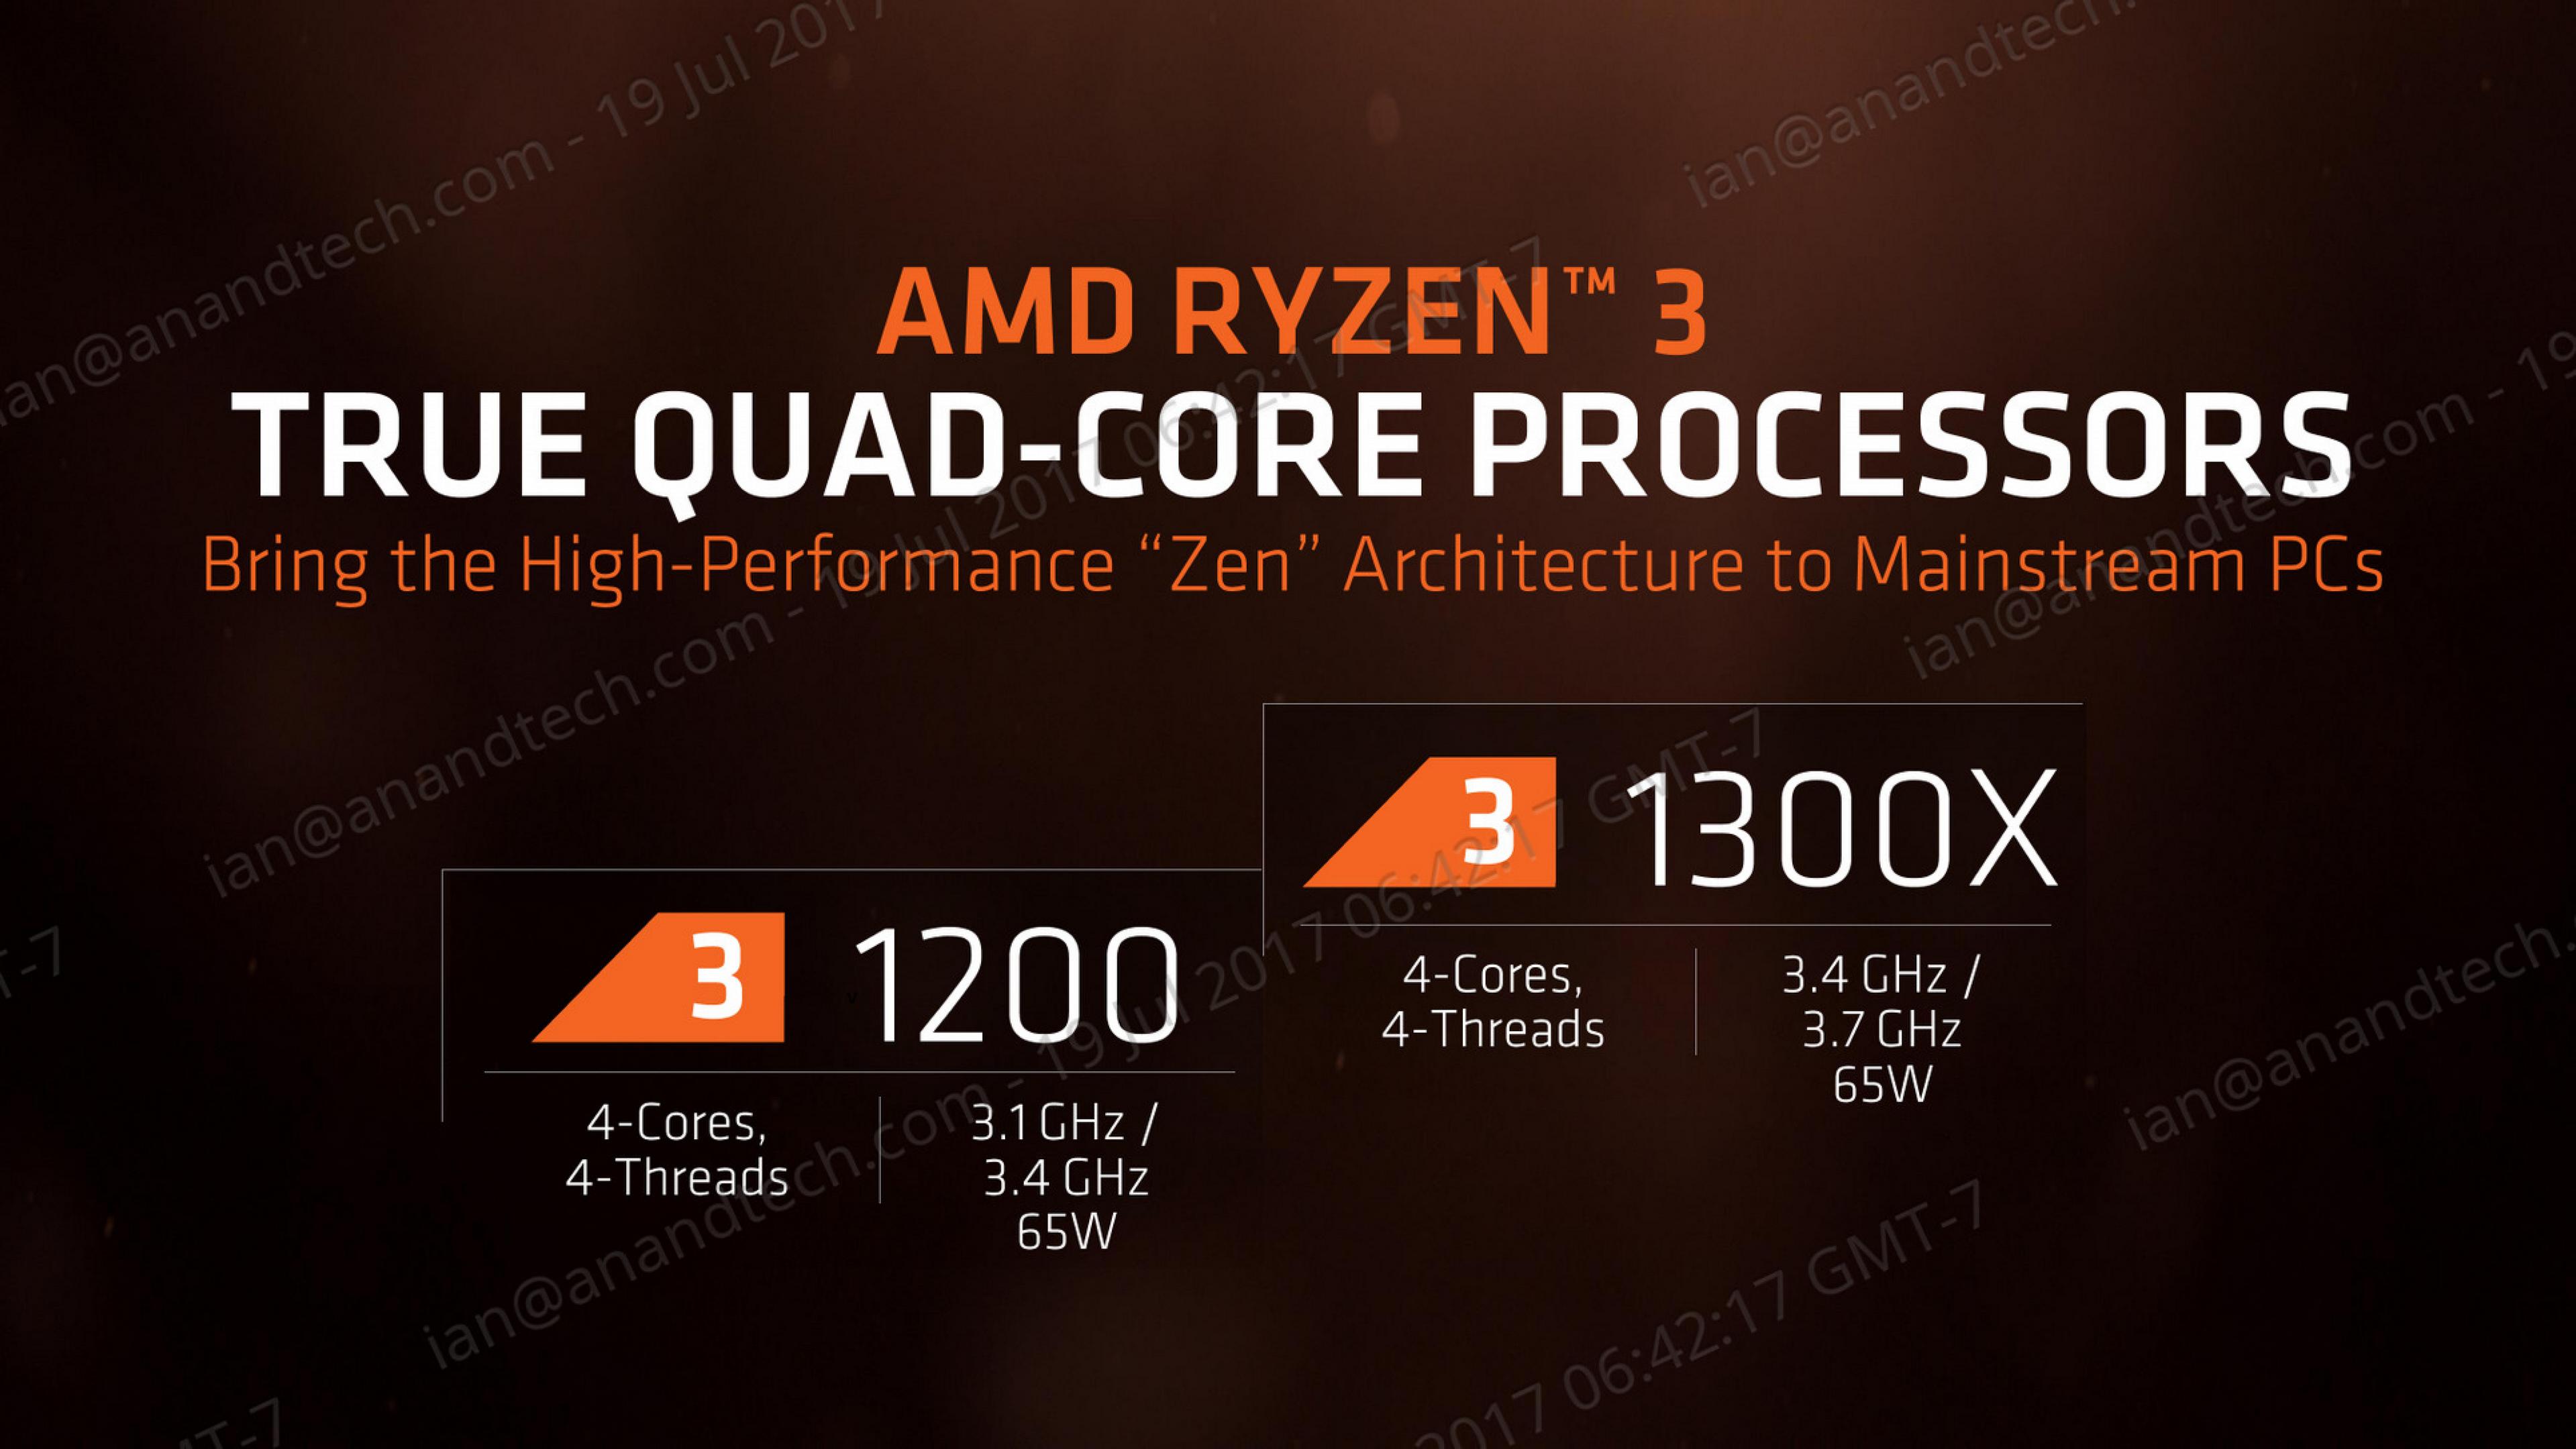
The two Ryzen 3 CPUs being launched today, worldwide, are the Ryzen 3 1300X and the Ryzen 3 1200. The base specifications for the Ryzen stack now look as follows:
| AMD Ryzen SKUs | |||||||
| Cores/ Threads |
Base/ Turbo |
XFR | L3 | TDP | Retail 7/27 |
Cooler | |
| Ryzen 7 1800X | 8/16 | 3.6/4.0 | +100 | 16 MB | 95 W | $419 | - |
| Ryzen 7 1700X | 8/16 | 3.4/3.8 | +100 | 16 MB | 95 W | $299 | - |
| Ryzen 7 1700 | 8/16 | 3.0/3.7 | +50 | 16 MB | 65 W | $279 | Spire RGB |
| Ryzen 5 1600X | 6/12 | 3.6/4.0 | +100 | 16 MB | 95 W | $229 | - |
| Ryzen 5 1600 | 6/12 | 3.2/3.6 | +100 | 16 MB | 65 W | $209 | Spire |
| Ryzen 5 1500X | 4/8 | 3.5/3.7 | +200 | 16 MB | 65 W | $189 | Spire |
| Ryzen 5 1400 | 4/8 | 3.2/3.4 | +50 | 8 MB | 65 W | $159 | Stealth |
| Ryzen 3 1300X | 4/4 | 3.5/3.7 | +200 | 8 MB | 65 W | $129 | Stealth |
| Ryzen 3 1200 | 4/4 | 3.1/3.4 | +50 | 8 MB | 65 W | $109 | Stealth |
The Ryzen 3 1300X is a cut version of the Ryzen 5 1500X, featuring the same frequencies and the same +200 MHz of XFR, but no simultaneous multithreading and half of the L3 with 8MB of L3 cache. That difference is still worth a third of the price, with the 1500X at $189 MSRP and the 1300X at $129 MSRP.
The Ryzen 3 1200 brings up the rear of the stack, being the lowest CPU in the stack, having the lowest frequency at 3.1G base, 3.4G turbo, 3.1G all-core turbo, no hyperthreading and the lowest amount of L3 cache. For the troubles comes the lowest price as well at $109, and should be bundled with the Wraith Stealth cooler (as is the 1300X).
Both processors are unlocked, allowing for full overclocking on B350 and X370 motherboards. Given some preliminary numbers for a future review, both CPUs seem to be capable of marching on towards 3.9-4.0 GHz fairly easily. AMD promotes both of the Ryzen 3 CPUs as being part of their 'VR Ready' line, compared with the premium line consisting of the Ryzen 7 parts and all but one of the Ryzen 5s.
As mentioned above, AMD is using the same 8-core Zeppelin silicon design as the Ryzen 5 and Ryzen 7 processors, as well as the EPYC server processors and the upcoming Threadripper CPUs. This is done for a few reasons, but namely cost and binning: to design a new set of masks on GlobalFoundries 14nm process is many tens of millions of dollars – if the performance of a unified design is sufficient to meet the targets, then it’s a go. On the binning side, one could argue that these were the processors on the stack that didn’t make the cut for the Ryzen 5 or Ryzen 7 parts, and by selling them cheap (but still reliable), AMD’s effective yield for the process increases and less money is thrown away.
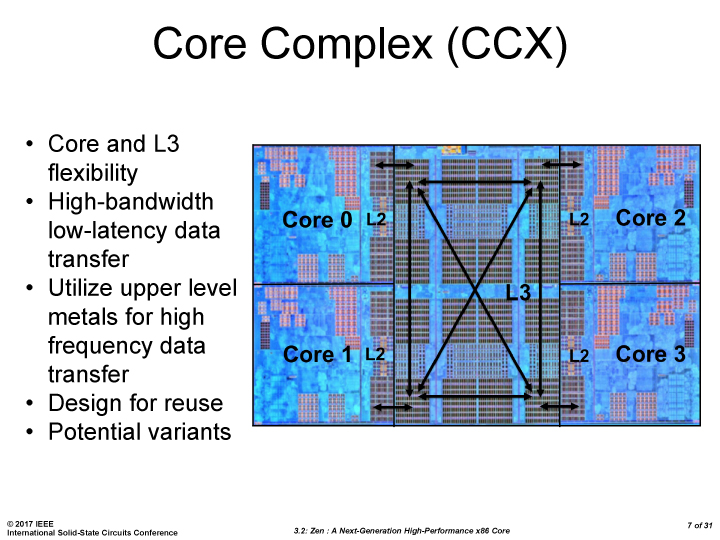
In order to facilitate a quad core design from the eight core chip, four cores are disabled. As discussed in previous articles, AMD’s Zeppelin design consists of two core clusters (two CCXs) of four cores each, connected internally via AMD’s Infinity Fabric.
In order to get down to four cores from eight, AMD has two possible solutions each with their pros and cons:
- Cut off one CCX, and leave one CCX available (4+0)
- Disable two cores per CCX, leaving two cores per CCX (2+2)
- Disable one core in one CCX, and three cores in the other CCX (1+3)
Number 3 leads to a lop-sided silicon die, and obviously wasn’t chosen.
With Number 1, leaving one CCX, this has positives in making sure that communication between each of the cores was the same, making performance consistency more predictable and less discussion about a non-uniform memory access design within the silicon. The downside is that if the silicon is binned lower because of a potential defect, there only has to be one defect in a CCX to make the whole thing unusable – get one in each CCX and it becomes useless reformed sand. Another downside is thermal performance: having four high performing cores next to each other will put strains on power consumption and heat, and ideally any silicon not in use electrically should be taken advantage of thermally to dissipate heat. There could also be another disadvantage, depending on how much IO is tied to a CCX for communication bandwidth – with only one path through to the DRAM controller, this could limit data flow per core.
With Number 2, the main advantage is going to be with thermals – with two CCXes in play with some silicon between them, the chip can run cores on opposite ends at a much higher power each without affecting each other as much, leading to potentially higher performance. The downside is core-to-core latency, as the CPU would have extended latency between neighboring cores and those in the different CCX, and it goes back to the non-uniform memory access argument with the Ryzen 7 CPUs.
AMD decided to go with the 2+2 arrangement for the quad core Ryzen parts, following on from the 3+3 arrangement on the hex-core Ryzen 5 CPUs.
Competition and Market
Both Intel and AMD are comparable on platform price, where B250 and B350 motherboards respectively cost around the same. The big upswing for AMD here is going to be overclocking, and potentially push the Ryzen 3 CPUs through to compete with the next one up the stack depending on stock performance. By contrast Intel’s performance is going to be static, and Intel might argue that for entry level products, overclocking is rarely a consideration for the bulk and volume purchasing agreements at this level. Intel also has a slight advantage in having some integrated graphics, negating the need for a discrete GPU.
There are two ways to approach analyzing the competition: configuration and price. For configuration, Ryzen 3 are quad-core CPUs without simultaneous multithreading, which would put them up against the Core i5 CPUs, which range from $182 to $239. Comparing on price, the Ryzen 3 1300X at $129 fits between the Core i3-7100 ($109) and Core i3-7300 ($149).
| Comparison: AMD Ryzen 3 1300X | |||
| Features | Intel Core i3-7100 |
AMD Ryzen 3 1300X |
Intel Core i3-7300 |
| Platform | Z270, B250 | X370, B350, A320 | Z270, B250 |
| Socket | LGA1151 | AM4 | LGA1151 |
| Cores/Threads | 2 / 4 | 4 / 4 | 2 / 4 |
| Base/Turbo/XFR | 3.9 GHz | 3.4 / 3.7 / 3.9 GHz | 4.0 GHz |
| GPU PCIe 3.0 | x16 | x16 | x16 |
| L2 Cache | 256 KB/core | 512 KB/core | 256 KB/core |
| L3 Cache | 3 MB | 8 MB | 4 MB |
| TDP | 51W | 65W | 51W |
| Retail Price (7/28) | $115 | $129 | $149 |
The Ryzen 3 1200 at $109 has the Core i3-7100 ($109) at the top end and the G4620 ($99) underneath. Intel would point out that the G4560 at $64 is also in play, and almost half the price.
| Comparison: AMD Ryzen 3 1200 | ||||
| Features | Intel Pentium G4560 |
Intel Pentium G4620 |
AMD Ryzen 3 1200 |
Intel Core i3-7100 |
| Platform | 200-series | 200-series | 300-series | 200-series |
| Socket | LGA 1151 | LGA1151 | AM4 | LGA1151 |
| Cores/Threads | 2 / 4 | 2 / 4 | 4 / 4 | 2 / 4 |
| Base/Turbo | 3.5 GHz | 3.7 GHz | 3.1 / 3.4 GHz | 3.9 GHz |
| GPU PCIe 3.0 | x16 | x16 | x16 | x16 |
| L2 Cache | 256 KB/core | 256 KB/core | 512 KB/core | 256 KB/core |
| L3 Cache | 3 MB | 3 MB | 8 MB | 3 MB |
| TDP | 54 W | 51W | 65W | 51W |
| Retail (7/28) | $80 | $105 | $109 | $115 |
Additional Notes On This Review
We are in the process of updating our AMD Ryzen 7 and Ryzen 5 results with the new AGESA 1006, and aim to have an article out soon comparing the two. At the time of this review, only the Ryzen 3 1200, Ryzen 3 1300X and Ryzen 5 1500X have been retested, due to time restraints of travel and other projects. In due course, all will be retested and examined.
Also due to time, as this review is being published, more benchmark results are coming in. Graphs will be added as this happens.
Pages In This Review
- 1: AMD Ryzen 3 Analysis
- 2: Test Bed and Setup
- 3: Benchmark Overview
- 4: Benchmarking Performance: CPU System Tests
- 5: Benchmarking Performance: CPU Rendering Tests
- 6: Benchmarking Performance: CPU Web Tests
- 7: Benchmarking Performance: CPU Encoding Tests
- 8: Benchmarking Performance: CPU Office Tests
- 9: Benchmarking Performance: CPU Legacy Tests
- 10: Gaming Performance: Civilization 6
- 11: Gaming Performance: Ashes of the Singularity Escalation
- 12: Gaming Performance: Shadow of Mordor
- 13: Gaming Performance: Rise of the Tomb Raider
- 14: Gaming Performance: Rocket League
- 15: Gaming Performance: Grand Theft Auto V
- 16: Power Consumption and Efficiency
- 17: Conclusions and Final Words
Test Bed and Setup
As per our processor testing policy, we take a premium category motherboard suitable for the socket, and equip the system with a suitable amount of memory running at the manufacturer's maximum supported frequency. This is also typically run at JEDEC subtimings where possible. It is noted that some users are not keen on this policy, stating that sometimes the maximum supported frequency is quite low, or faster memory is available at a similar price, or that the JEDEC speeds can be prohibitive for performance. While these comments make sense, ultimately very few users apply memory profiles (either XMP or other) as they require interaction with the BIOS, and most users will fall back on JEDEC supported speeds - this includes home users as well as industry who might want to shave off a cent or two from the cost or stay within the margins set by the manufacturer. Where possible, we will extend our testing to include faster memory modules either at the same time as the review or a later date.
| Test Setup | |
| Processor | AMD Ryzen 3 1300X (4C/4T, 3.4G, 65W) AMD Ryzen 3 1200 (4C/4T, 3.1G, 65W) |
| Motherboards | ASUS Crosshair VI Hero |
| Cooling | Noctua NH-U12S SE-AM4 |
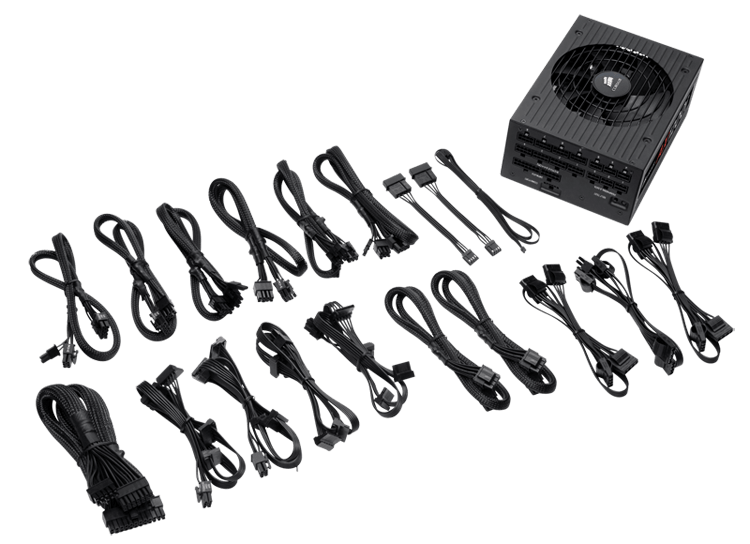
| Power Supply | Corsair AX860i |
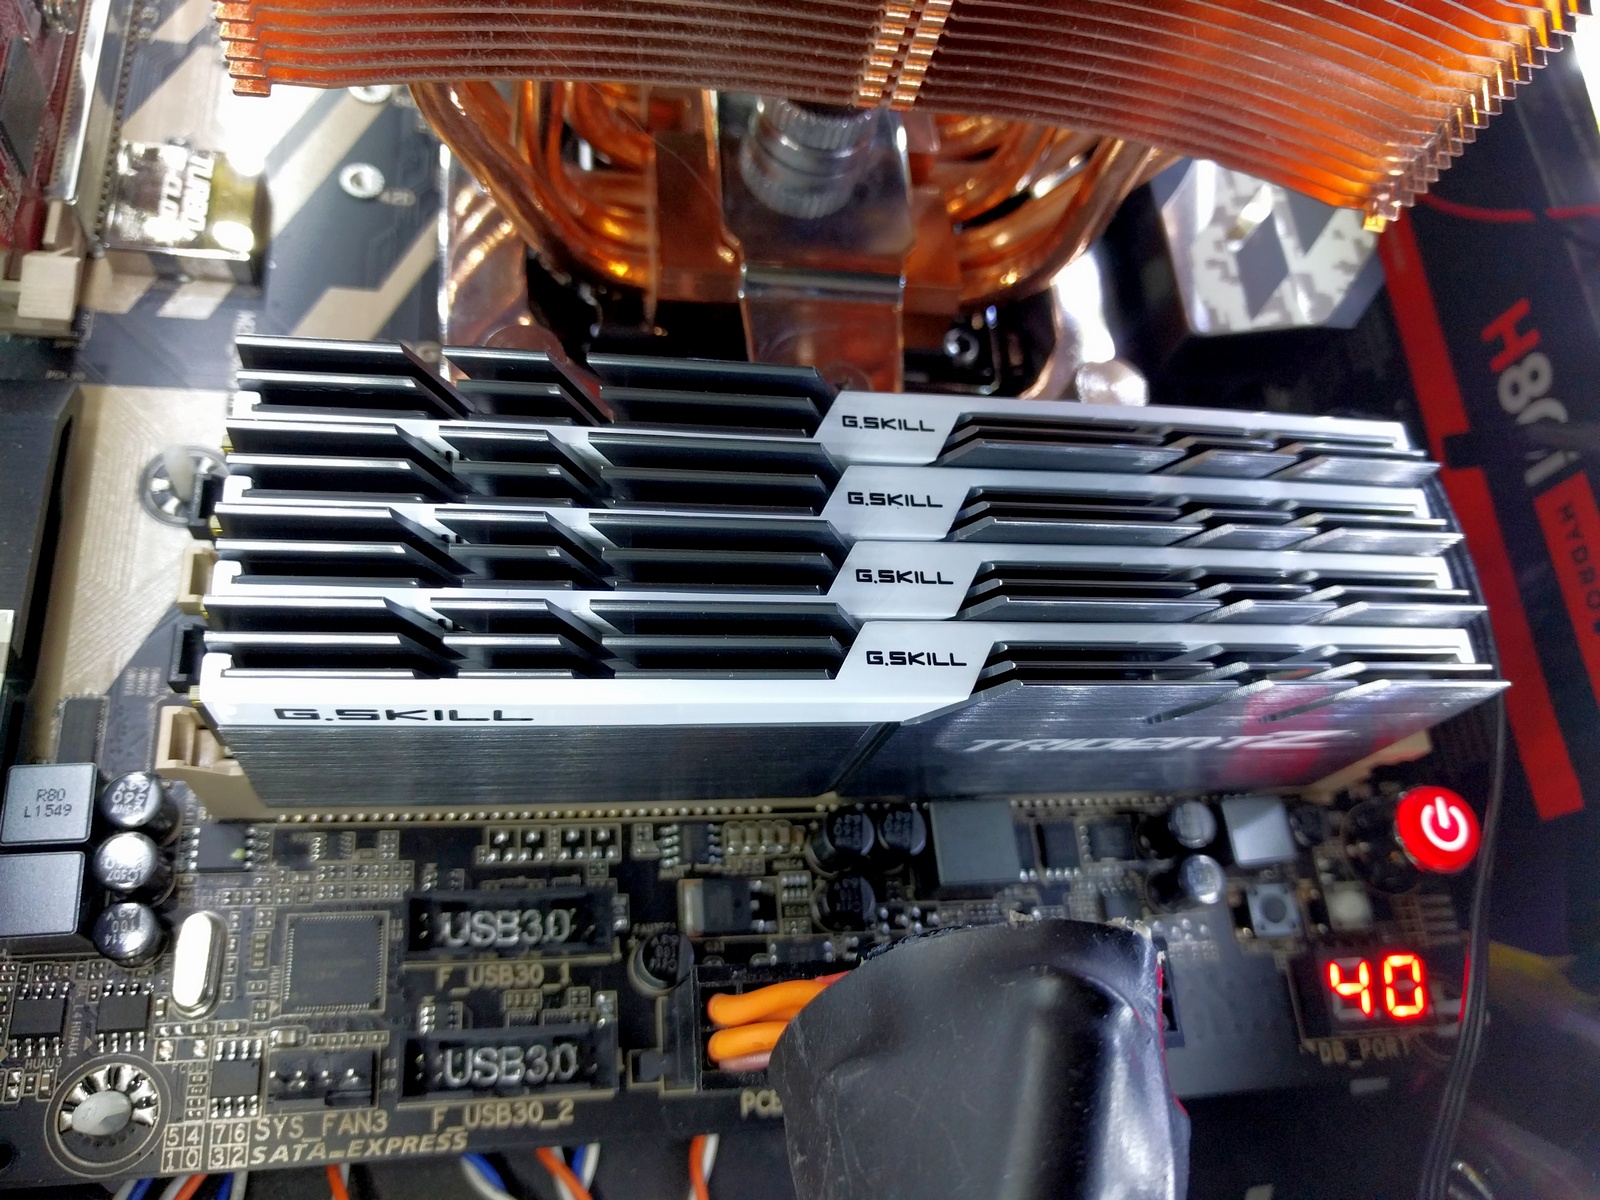
| Memory | Corsair Vengeance DDR4-3000 C15 2x8GB |
| Memory Settings | DDR4-2400 C15 |
| Video Cards | MSI GTX 1080 Gaming X 8GB ASUS GTX 1060 Strix 6GB Sapphire Nitro R9 Fury 4GB Sapphire Nitro RX 480 8GB Sapphire Nitro RX 460 4GB (CPU Tests) |
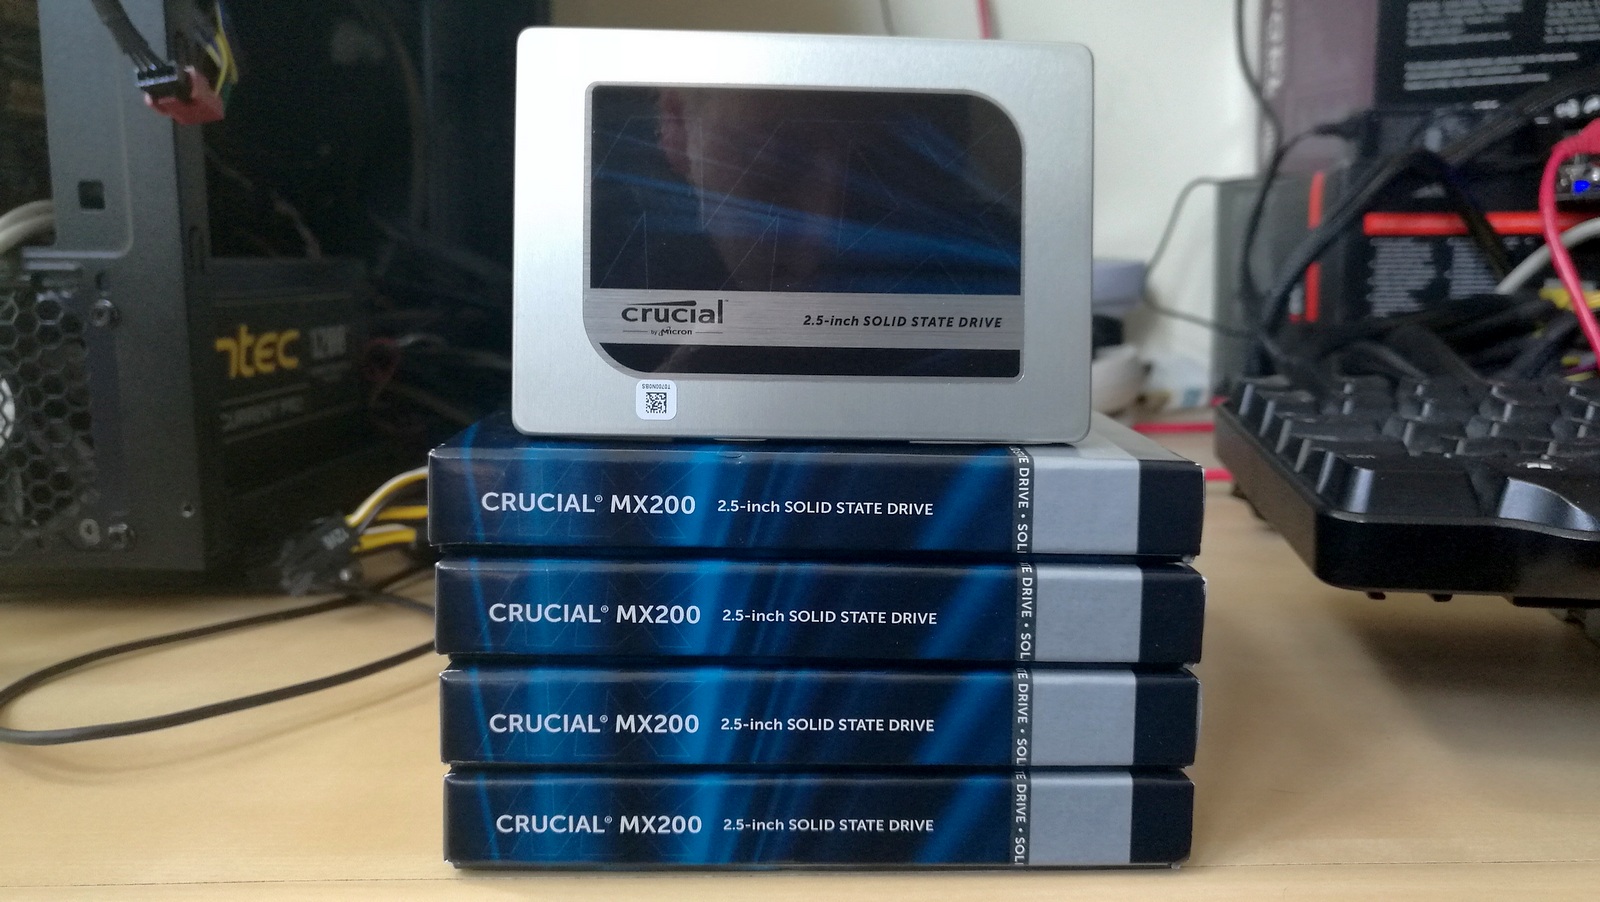
| Hard Drive | Crucial MX200 1TB |
| Optical Drive | LG GH22NS50 |
| Case | Open Test Bed |
| Operating System | Windows 10 Pro 64-bit |
Many thanks to...
We must thank the following companies for kindly providing hardware for our multiple test beds. Some of this hardware is not in this test bed specifically, but is used in other testing.
Thank you to Sapphire for providing us with several of their AMD GPUs. We met with Sapphire back at Computex 2016 and discussed a platform for our future testing on AMD GPUs with their hardware for several upcoming projects. As a result, they were able to sample us the latest silicon that AMD has to offer. At the top of the list was a pair of Sapphire Nitro R9 Fury 4GB GPUs, based on the first generation of HBM technology and AMD’s Fiji platform. As the first consumer GPU to use HDM, the R9 Fury is a key moment in graphics history, and this Nitro cards come with 3584 SPs running at 1050 MHz on the GPU with 4GB of 4096-bit HBM memory at 1000 MHz.
Further Reading: AnandTech’s Sapphire Nitro R9 Fury Review
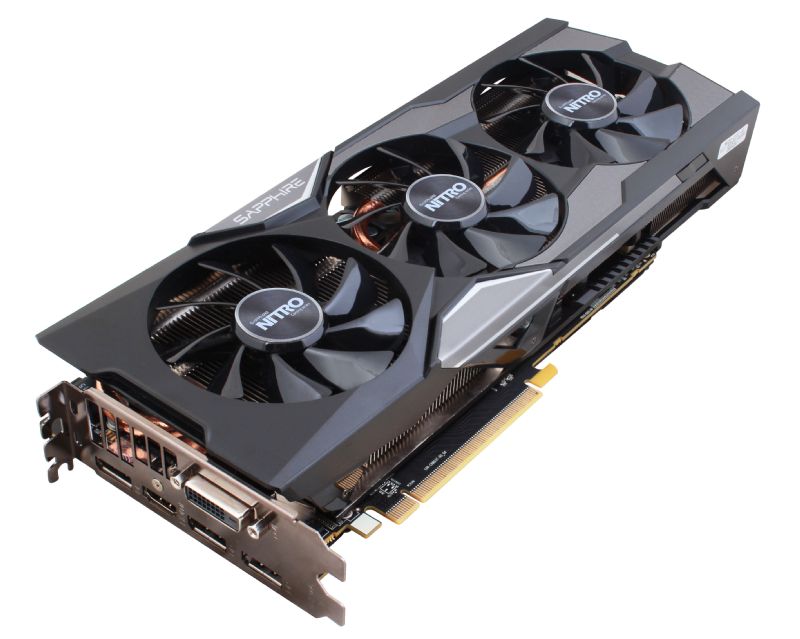
Following the Fury, Sapphire also supplied a pair of their latest Nitro RX 480 8GB cards to represent AMD’s current performance silicon on 14nm (as of March 2017). The move to 14nm yielded significant power consumption improvements for AMD, which combined with the latest version of GCN helped bring the target of a VR-ready graphics card as close to $200 as possible. The Sapphire Nitro RX 480 8GB OC graphics card is designed to be a premium member of the RX 480 family, having a full set of 8GB of GDDR5 memory at 6 Gbps with 2304 SPs at 1208/1342 MHz engine clocks.
Further Reading: AnandTech’s AMD RX 480 Review
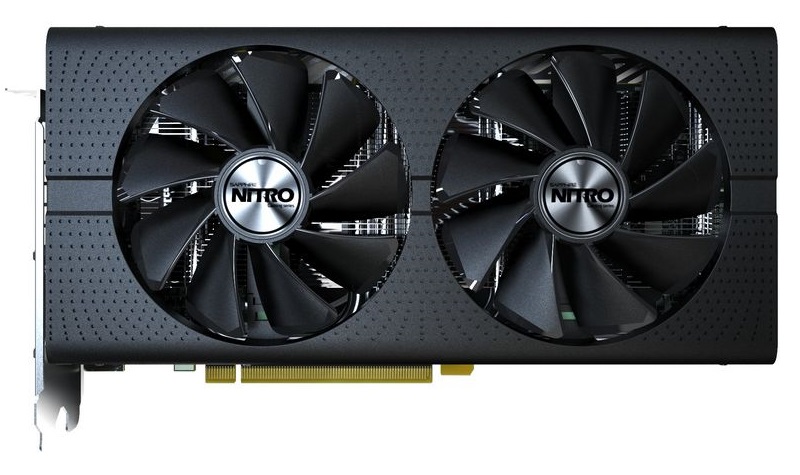
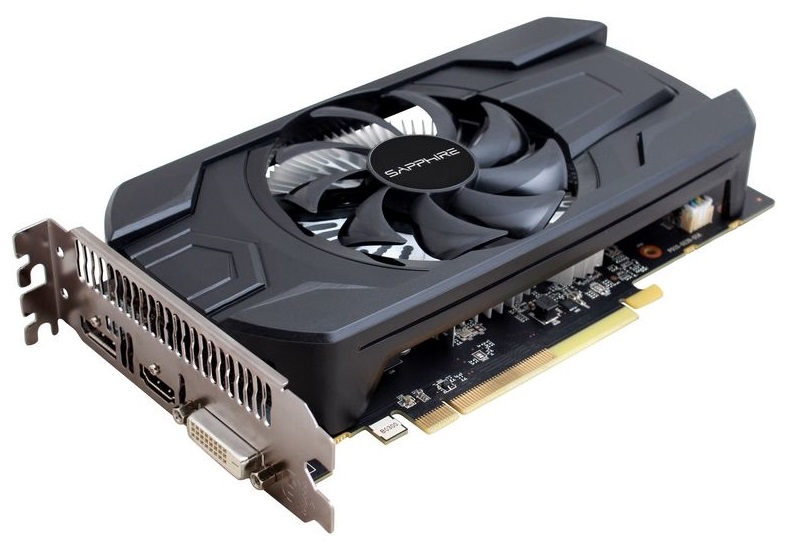
With the R9 Fury and RX 480 assigned to our gaming tests, Sapphire also passed on a pair of RX 460s to be used as our CPU testing cards. The amount of GPU power available can have a direct effect on CPU performance, especially if the CPU has to spend all its time dealing with the GPU display. The RX 460 is a nice card to have here, as it is powerful yet low on power consumption and does not require any additional power connectors. The Sapphire Nitro RX 460 2GB still follows on from the Nitro philosophy, and in this case is designed to provide power at a low price point. Its 896 SPs run at 1090/1216 MHz frequencies, and it is paired with 2GB of GDDR5 at an effective 7000 MHz.
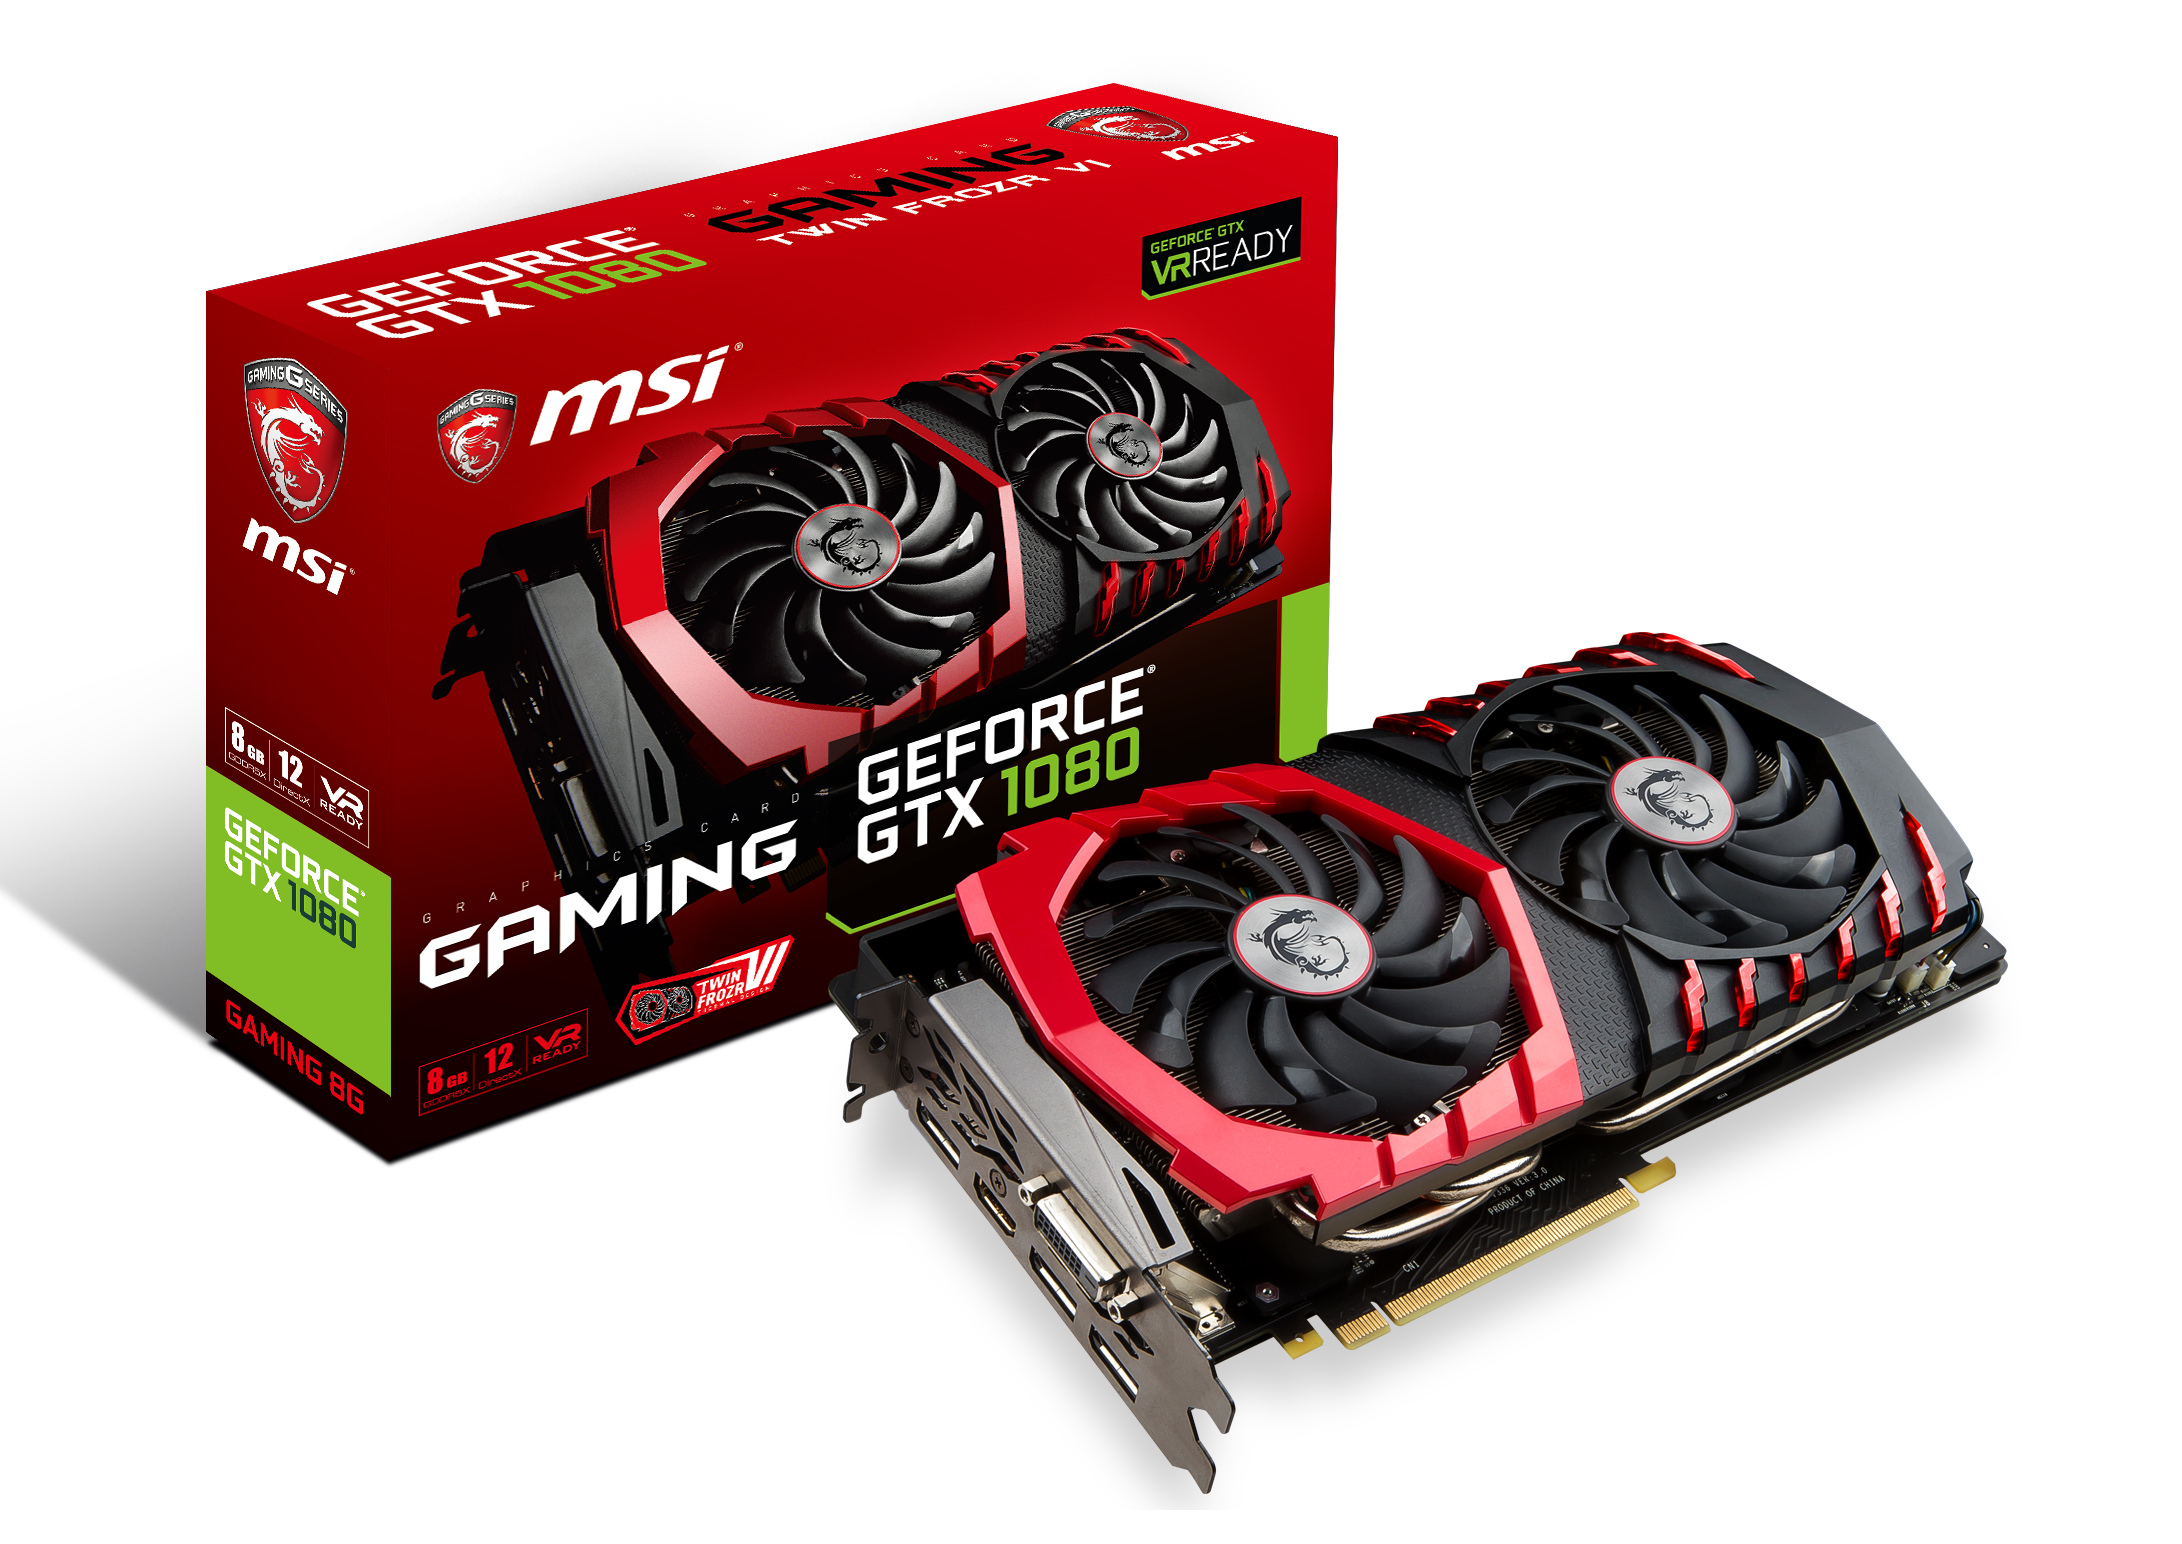
We must also say thank you to MSI for providing us with their GTX 1080 Gaming X 8GB GPUs. Despite the size of AnandTech, securing high-end graphics cards for CPU gaming tests is rather difficult. MSI stepped up to the plate in good fashion and high spirits with a pair of their high-end graphics. The MSI GTX 1080 Gaming X 8GB graphics card is their premium air cooled product, sitting below the water cooled Seahawk but above the Aero and Armor versions. The card is large with twin Torx fans, a custom PCB design, Zero-Frozr technology, enhanced PWM and a big backplate to assist with cooling. The card uses a GP104-400 silicon die from a 16nm TSMC process, contains 2560 CUDA cores, and can run up to 1847 MHz in OC mode (or 1607-1733 MHz in Silent mode). The memory interface is 8GB of GDDR5X, running at 10010 MHz. For a good amount of time, the GTX 1080 was the card at the king of the hill.
Further Reading: AnandTech’s NVIDIA GTX 1080 Founders Edition Review
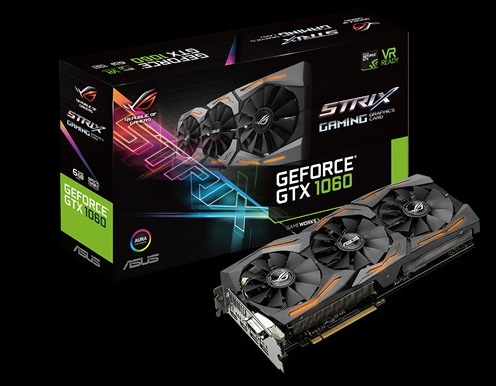
Thank you to ASUS for providing us with their GTX 1060 6GB Strix GPU. To complete the high/low cases for both AMD and NVIDIA GPUs, we looked towards the GTX 1060 6GB cards to balance price and performance while giving a hefty crack at >1080p gaming in a single graphics card. ASUS offered a hand here, supplying a Strix variant of the GTX 1060. This card is even longer than our GTX 1080, with three fans and LEDs crammed under the hood. STRIX is now ASUS’ lower cost gaming brand behind ROG, and the Strix 1060 sits at nearly half a 1080, with 1280 CUDA cores but running at 1506 MHz base frequency up to 1746 MHz in OC mode. The 6 GB of GDDR5 runs at a healthy 8008 MHz across a 192-bit memory interface.
Further Reading: AnandTech’s ASUS GTX 1060 6GB STRIX Review
Thank you to Crucial for providing us with MX200 SSDs. Crucial stepped up to the plate as our benchmark list grows larger with newer benchmarks and titles, and the 1TB MX200 units are strong performers. Based on Marvell's 88SS9189 controller and using Micron's 16nm 128Gbit MLC flash, these are 7mm high, 2.5-inch drives rated for 100K random read IOPs and 555/500 MB/s sequential read and write speeds. The 1TB models we are using here support TCG Opal 2.0 and IEEE-1667 (eDrive) encryption and have a 320TB rated endurance with a three-year warranty.
Further Reading: AnandTech's Crucial MX200 (250 GB, 500 GB & 1TB) Review
Thank you to Corsair for providing us with an AX1200i PSU. The AX1200i was the first power supply to offer digital control and management via Corsair's Link system, but under the hood it commands a 1200W rating at 50C with 80 PLUS Platinum certification. This allows for a minimum 89-92% efficiency at 115V and 90-94% at 230V. The AX1200i is completely modular, running the larger 200mm design, with a dual ball bearing 140mm fan to assist high-performance use. The AX1200i is designed to be a workhorse, with up to 8 PCIe connectors for suitable four-way GPU setups. The AX1200i also comes with a Zero RPM mode for the fan, which due to the design allows the fan to be switched off when the power supply is under 30% load.
Further Reading: AnandTech's Corsair AX1500i Power Supply Review
Thank you to G.Skill for providing us with memory. G.Skill has been a long-time supporter of AnandTech over the years, for testing beyond our CPU and motherboard memory reviews. We've reported on their high capacity and high-frequency kits, and every year at Computex G.Skill holds a world overclocking tournament with liquid nitrogen right on the show floor.
Further Reading: AnandTech's Memory Scaling on Haswell Review, with G.Skill DDR3-3000
2017 CPU Benchmarking
For our review, we are implementing our fresh CPU testing benchmark suite, using new scripts developed specifically for this testing. This means that with a fresh OS install, we can configure the OS to be more consistent, install the new benchmarks, maintain version consistency without random updates and start running the tests in under 5 minutes. After that it's a one button press to start an 8-10hr test (with a high-performance core) with nearly 100 relevant data points in the benchmarks given below. The tests cover a wide range of segments, some of which will be familiar but some of the tests are new to benchmarking in general, but still highly relevant for the markets they come from.
Our new CPU tests go through six main areas. We cover the Web (we've got an un-updateable version of Chrome 56), general system tests (opening tricky PDFs, emulation, brain simulation, AI, 2D image to 3D model conversion), rendering (ray tracing, modeling), encoding (compression, AES, h264 and HEVC), office based tests (PCMark and others), and our legacy tests, throwbacks from another generation of bad code but interesting to compare.
Our graphs typically list CPUs with microarchitecture, SKU name, cost and power. The cost will be one of two numbers, either the 1k unit price 'tray price' for when a business customer purchases 1000 CPUs, or the MSRP likely to be found at retail. The problem here is that neither Intel nor AMD are consistent: Intel has a tray price for every CPU, but an MSRP only for parts sold at retail. AMD typically quotes MSRP for CPUs at retail, tray prices for enterprise CPUs, and doesn't say much about OEM only parts. We try to find a balance here, so prices may be $10-$20 from what you might expect.
A side note on OS preparation. As we're using Windows 10, there's a large opportunity for something to come in and disrupt our testing. So our default strategy is multiple: disable the ability to update as much as possible, disable Windows Defender, uninstall OneDrive, disable Cortana as much as possible, implement the high performance mode in the power options, and disable the internal platform clock which can drift away from being accurate if the base frequency drifts (and thus the timing ends up inaccurate).
Additional Note for 7/28: As this review is being written, due to limited time, testing on the CPUs is still ongoing and some benchmark graphs will be added in time when the results come in and can be verified.
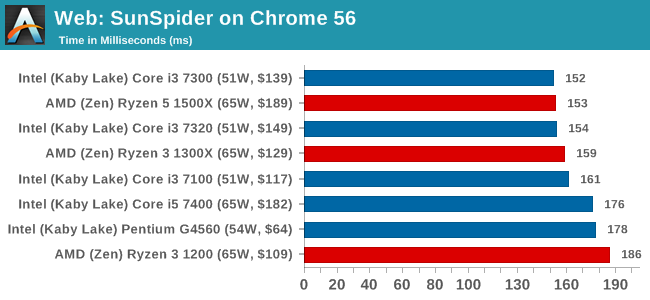
Web Tests on Chrome 56
Sunspider 1.0.2
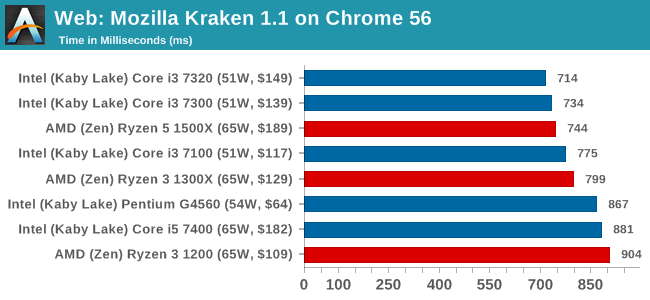
Mozilla Kraken 1.1
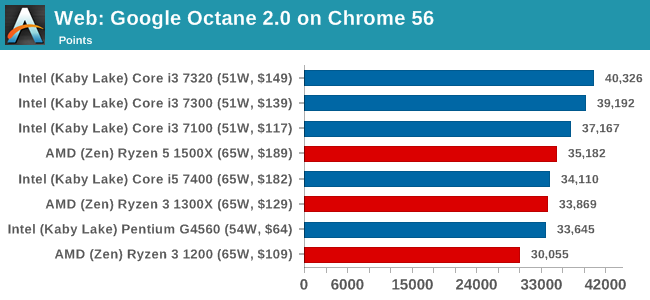
Google Octane 2.0
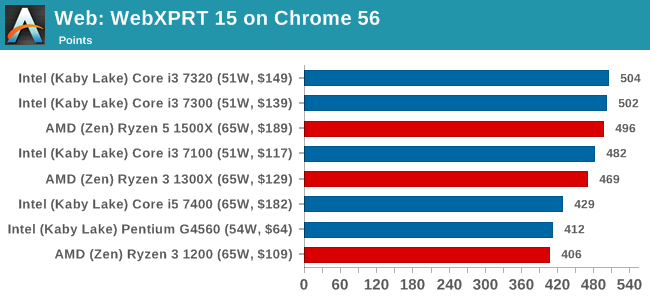
WebXPRT15
System Tests
PDF Opening
FCAT
3DPM v2.1
Dolphin v5.0
DigiCortex v1.20
Agisoft PhotoScan v1.0
Rendering Tests
Corona 1.3
Blender 2.78
LuxMark CPU C++
LuxMark CPU OpenCL
POV-Ray 3.7.1b4
Cinebench R15 ST
Cinebench R15 MT
Encoding Tests
7-Zip 9.2
WinRAR 5.40
AES Encoding (TrueCrypt 7.2)
HandBrake v1.0.2 x264 LQ
HandBrake v1.0.2 x264-HQ
HandBrake v1.0.2 HEVC-4K
Office / Professional
PCMark8
Chromium Compile (v56)
SYSmark 2014 SE
Legacy Tests
3DPM v1 ST / MT
x264 HD 3 Pass 1, Pass 2
Cinebench R11.5 ST / MT
Cinebench R10 ST / MT
A side note - a couple of benchmarks (LuxMark) weren't fully 100% giving good data during testing. Need to go back and re-work this part of our testing.
2017 CPU Gaming Tests
For our new set of GPU tests, we wanted to think big. There are a lot of users in the ecosystem that prioritize gaming above all else, especially when it comes to choosing the correct CPU. If there's a chance to save $50 and get a better graphics card for no loss in performance, then this is the route that gamers would prefer to tread. The angle here though is tough - lots of games have different requirements and cause different stresses on a system, with various graphics cards having different reactions to the code flow of a game. Then users also have different resolutions and different perceptions of what feels 'normal'. This all amounts to more degrees of freedom than we could hope to test in a lifetime, only for the data to become irrelevant in a few months when a new game or new GPU comes into the mix. Just for good measure, let us add in DirectX 12 titles that make it easier to use more CPU cores in a game to enhance fidelity.
Our original list of nine games planned in February quickly became six, due to the lack of professional-grade controls on Ubisoft titles. If you want to see For Honor, Steep or Ghost Recon: Wildlands benchmarked on AnandTech, point Ubisoft Annecy or Ubisoft Montreal in my direction. While these games have in-game benchmarks worth using, unfortunately they do not provide enough frame-by-frame detail to the end user, despite using it internally to produce the data the user eventually sees (and it typically ends up obfuscated by another layer as well). I would instead perhaps choose to automate these benchmarks via inputs, however the extremely variable loading time is a strong barrier to this.
So we have the following benchmarks as part of our 4/2 script, automated to the point of a one-button run and out pops the results four hours later, per GPU. Also listed are the resolutions and settings used.
- Civilization 6 (1080p Ultra, 4K Ultra)
- Ashes of the Singularity: Escalation* (1080p Extreme, 4K Extreme)
- Shadow of Mordor (1080p Ultra, 4K Ultra)
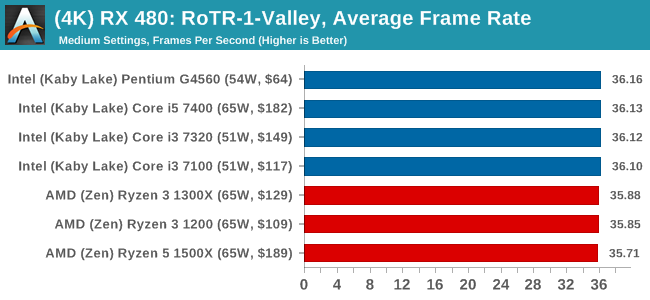
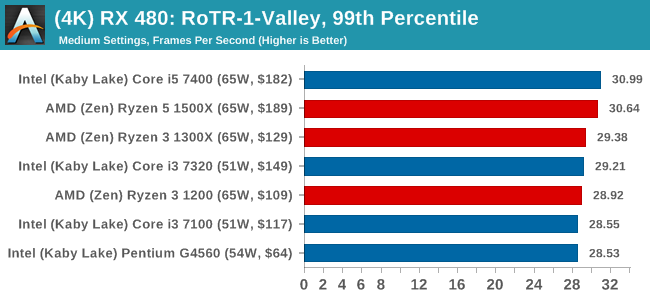
- Rise of the Tomb Raider #1 - GeoValley (1080p High, 4K Medium)
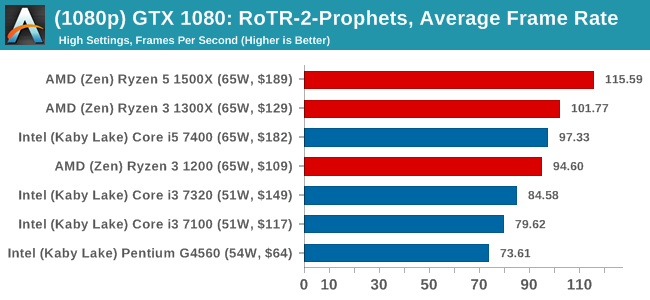
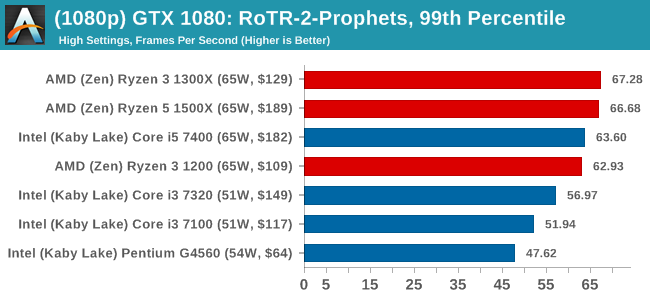
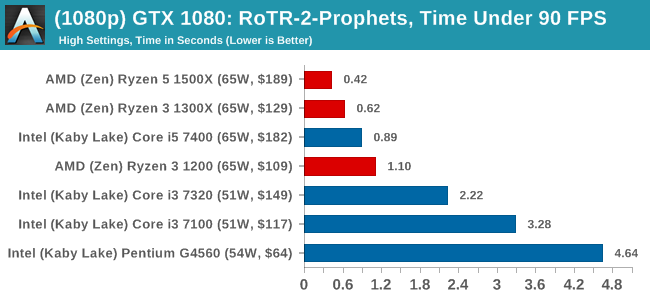
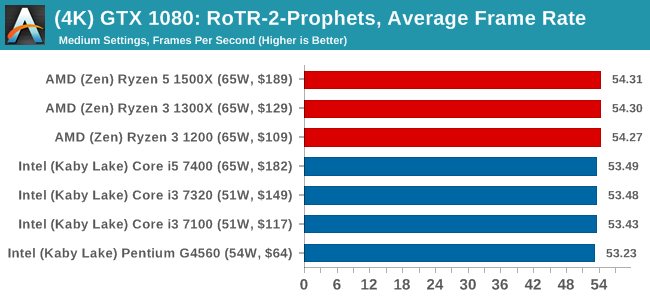
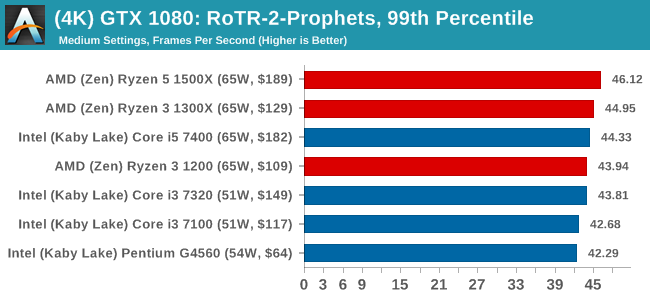
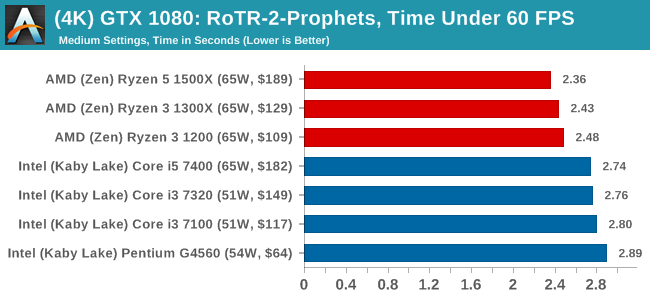
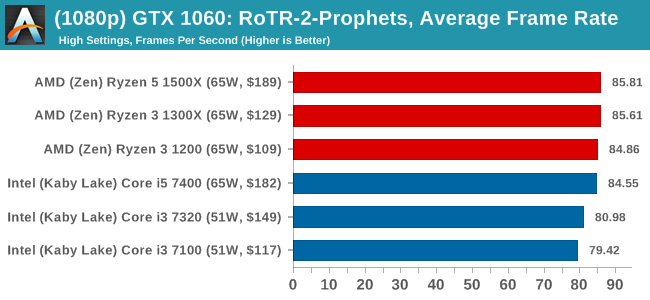
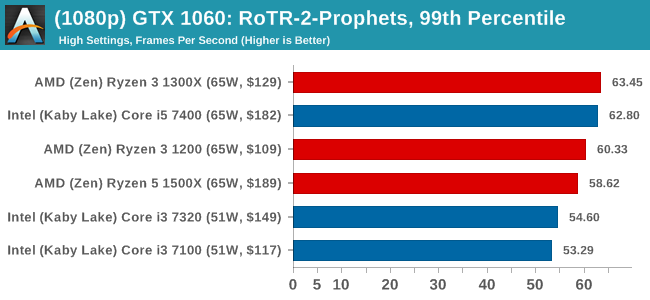
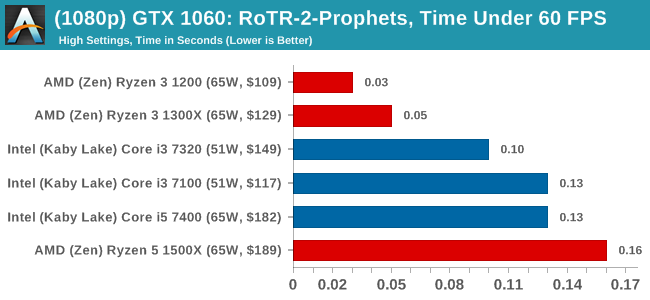
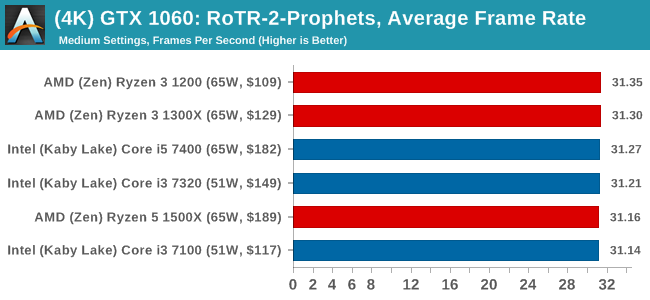
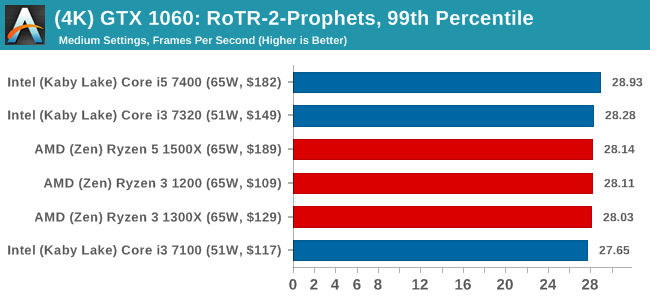
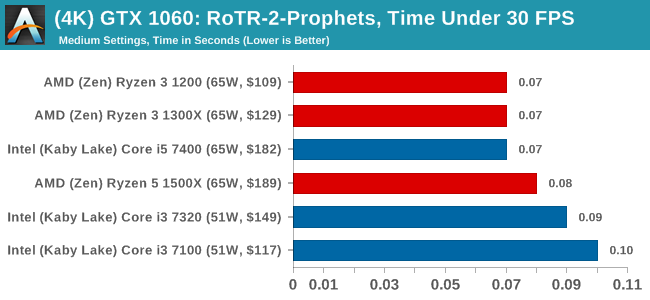
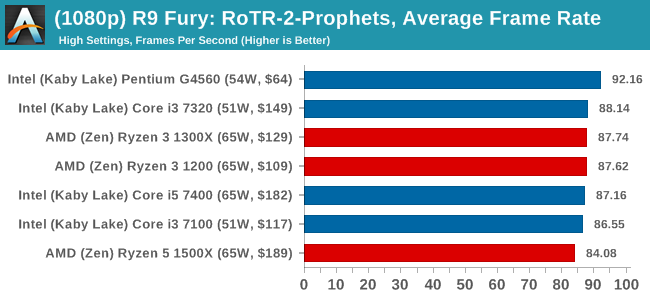
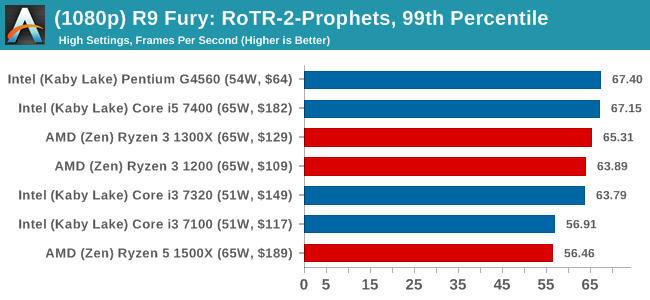
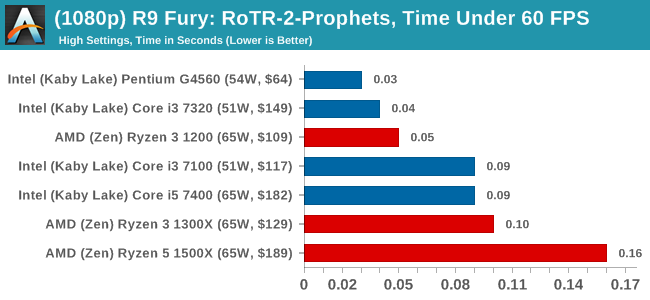
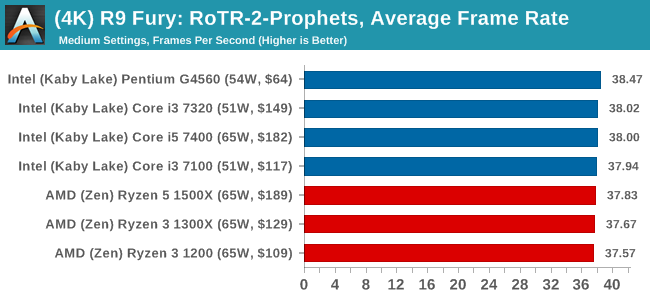
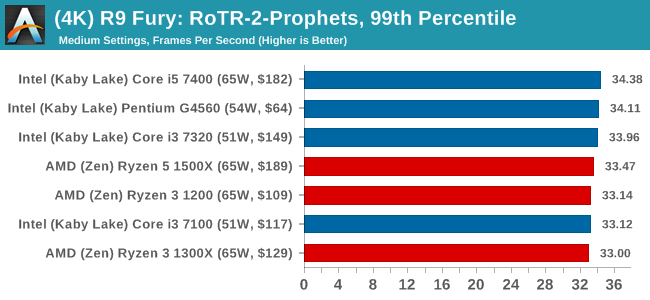
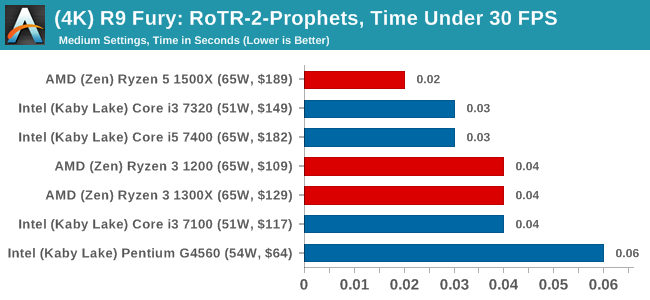
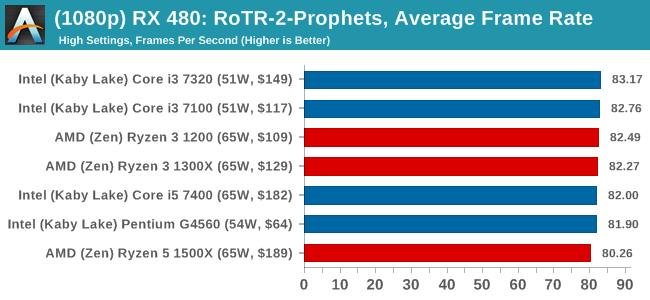
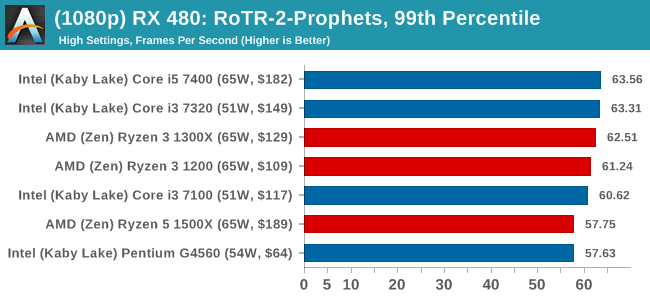
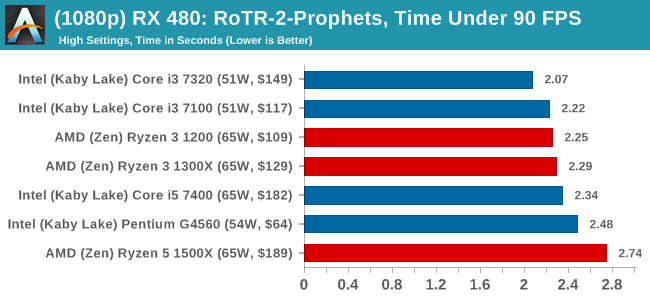
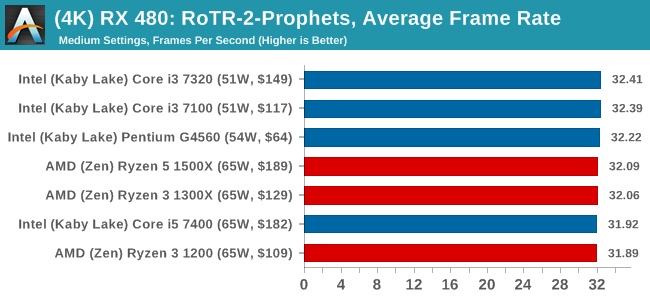
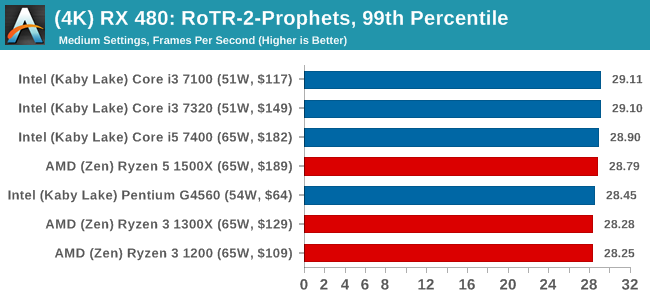
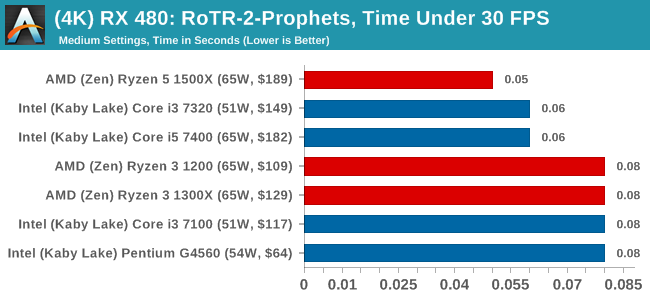
- Rise of the Tomb Raider #2 - Prophets (1080p High, 4K Medium)
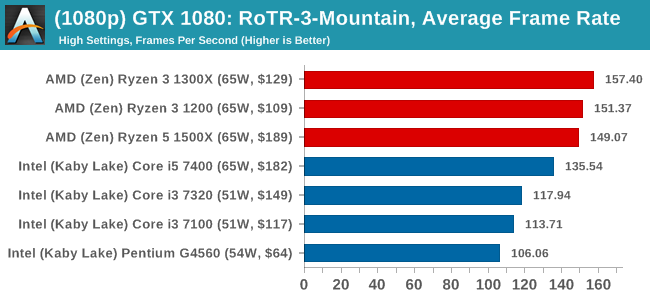
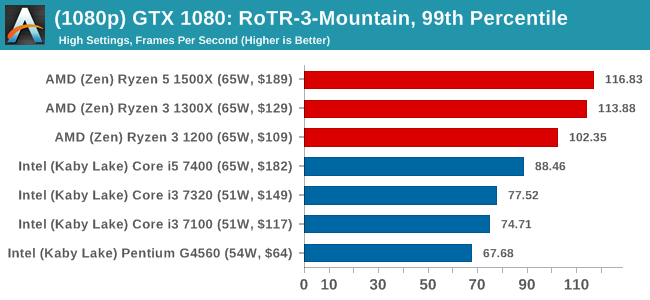
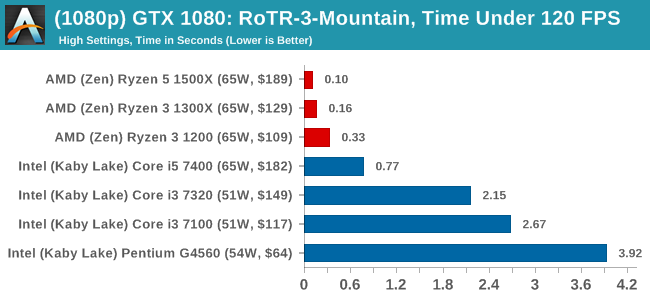
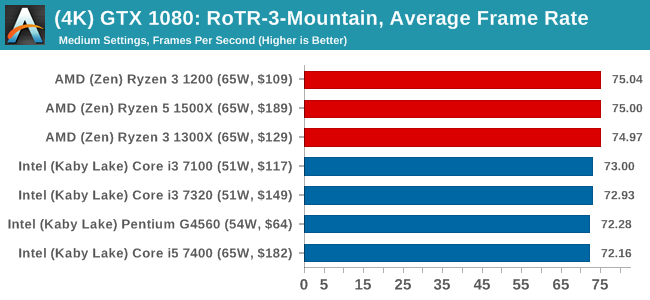
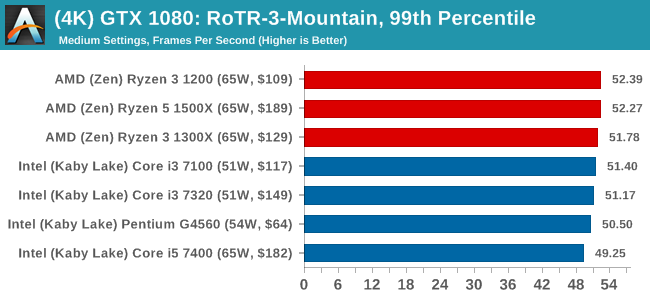
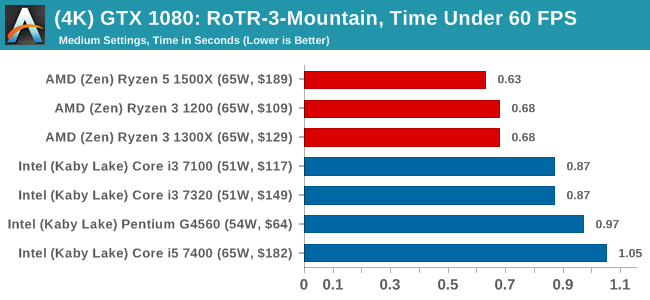
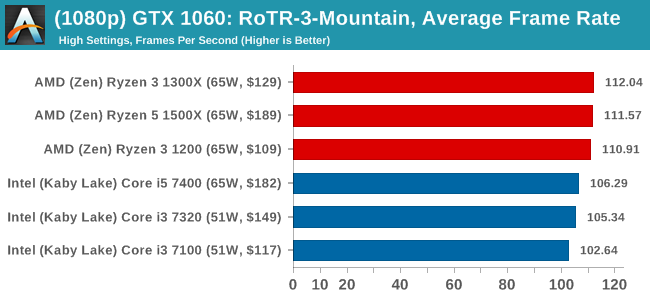
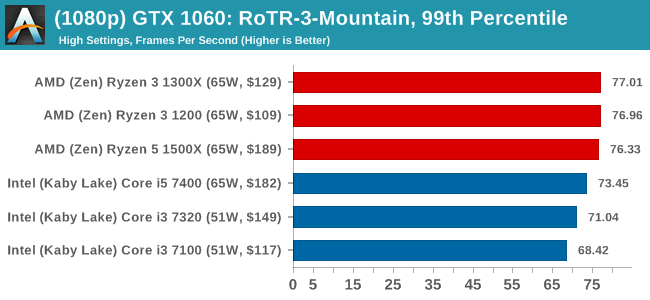
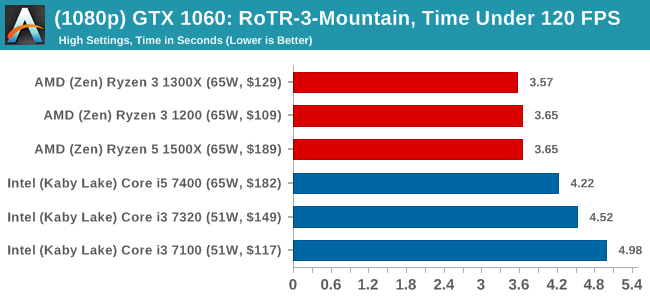
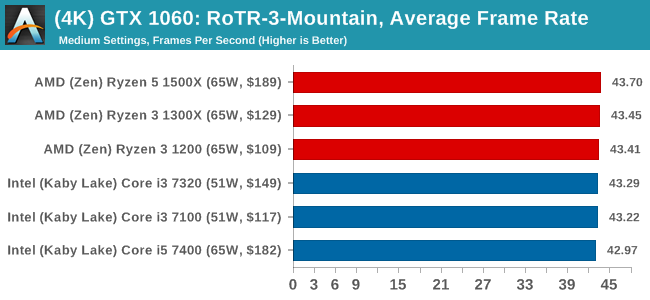
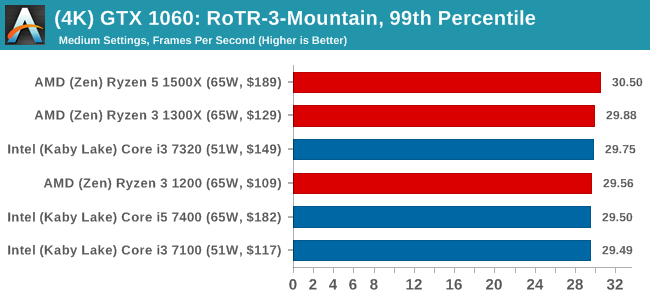
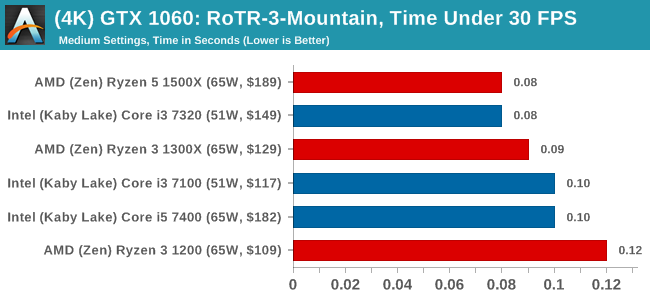
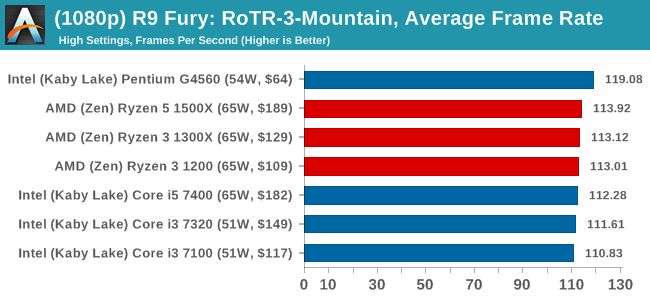
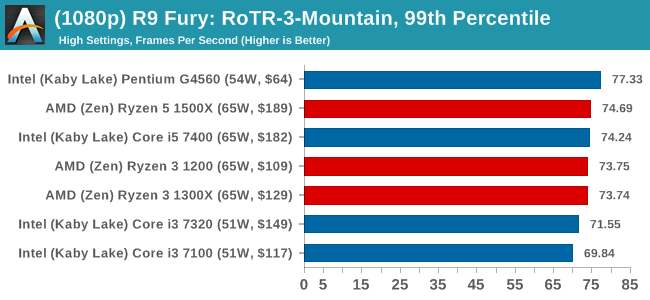
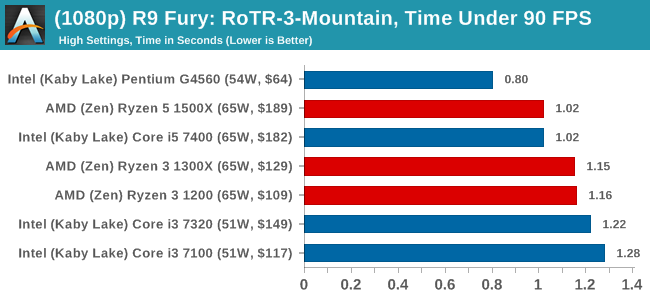
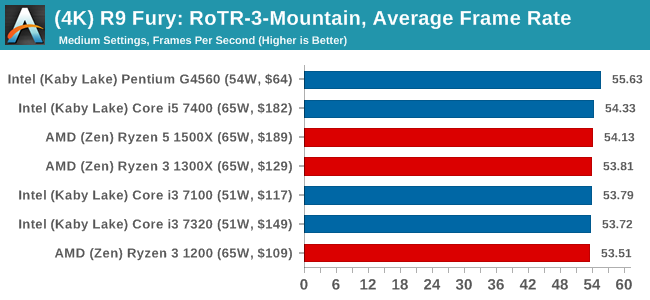
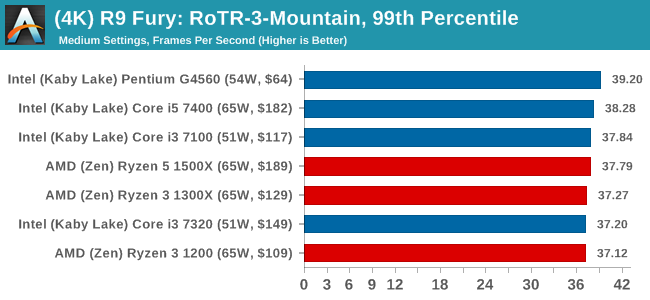
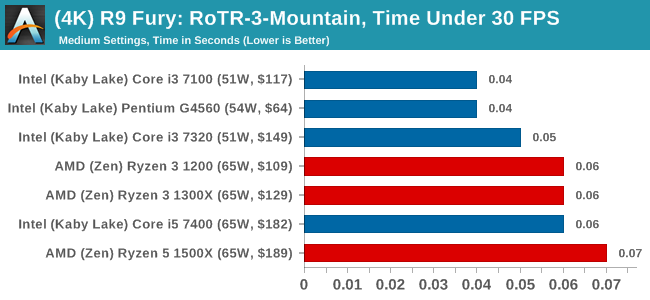
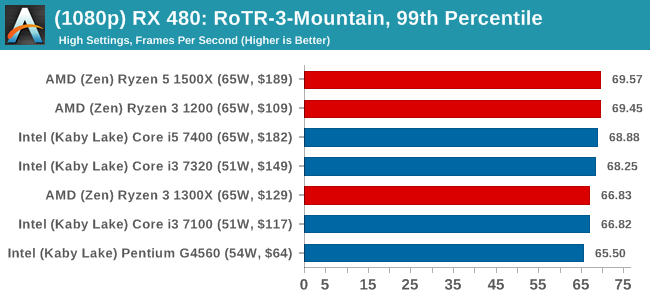
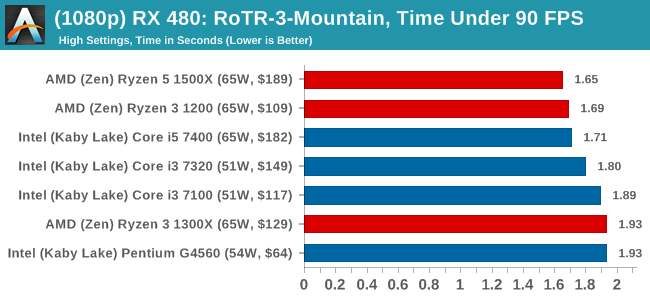
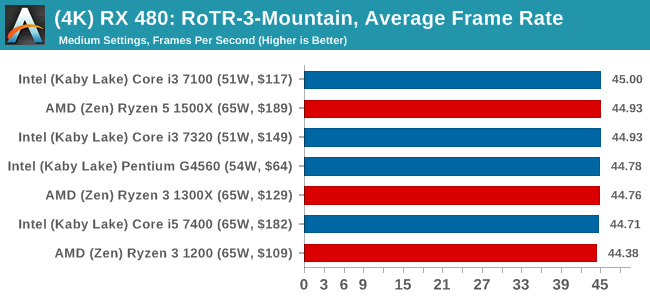
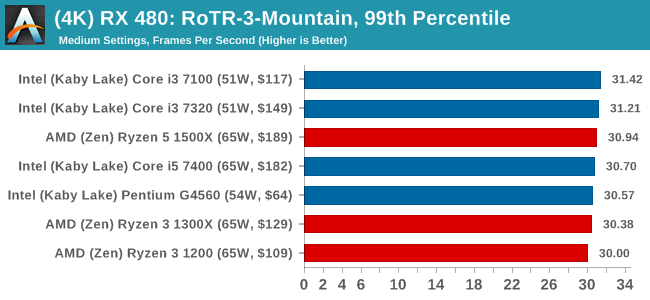
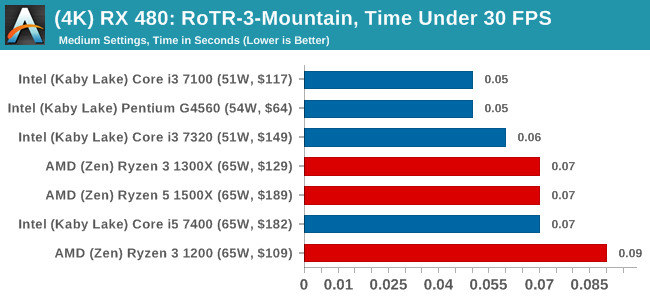
- Rise of the Tomb Raider #3 - Mountain (1080p High, 4K Medium)
- Rocket League (1080p Ultra, 4K Ultra)
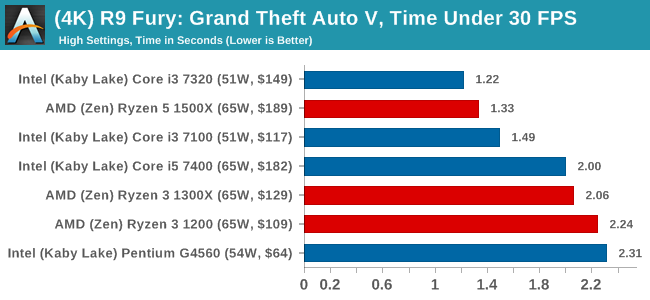
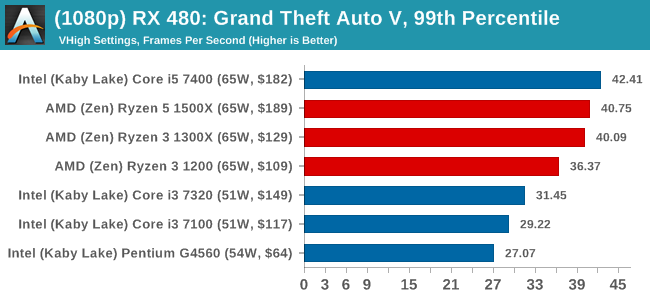
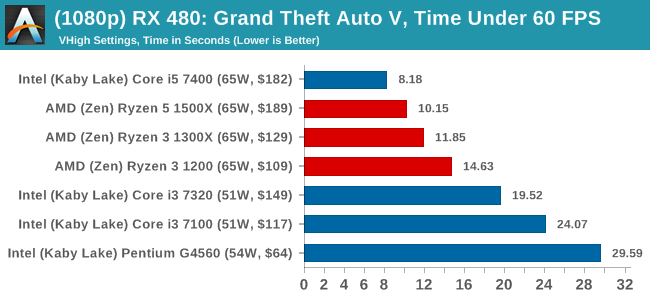
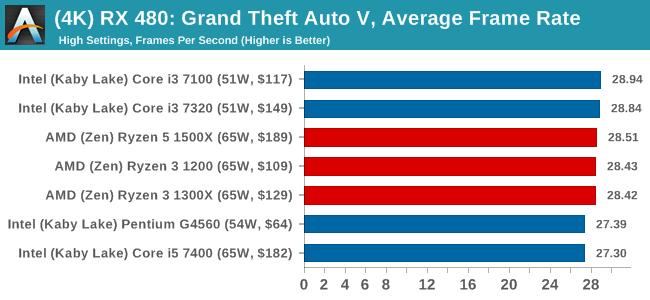
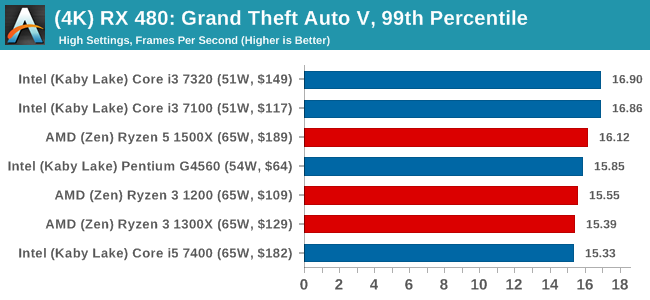
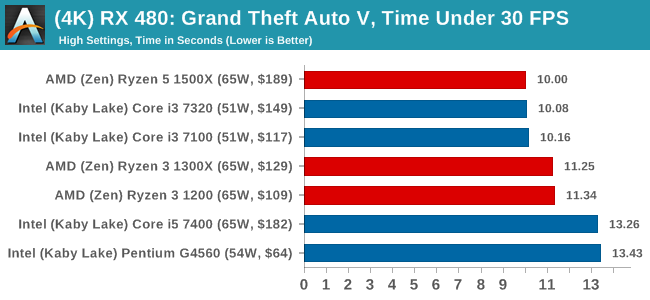
- Grand Theft Auto V (1080p Very High, 4K High)
For each of the GPUs in our testing, these games (at each resolution/setting combination) are run four times each, with outliers discarded. Average frame rates, 99th percentiles and 'Time Under x FPS' data is sorted, and the raw data is archived.
The four GPUs we've managed to obtain for these tests are:
- MSI GTX 1080 Gaming X 8G
- ASUS GTX 1060 Strix 6G
- Sapphire Nitro R9 Fury 4GB
- Sapphire Nitro RX 480 8GB
In our testing script, we save a couple of special things for the GTX 1080 here. The following tests are also added:
- Civilization 6 (8K Ultra, 16K Lowest)
This benchmark, with a little coercion, are able to be run beyond the specifications of the monitor being used, allowing for 'future' testing of GPUs at 8K and 16K with some amusing results. We are only running these tests on the GTX 1080, because there's no point watching a slideshow more than once.
Benchmarking Performance: CPU System Tests
Our first set of tests is our general system tests. These set of tests are meant to emulate more about what people usually do on a system, like opening large files or processing small stacks of data. This is a bit different to our office testing, which uses more industry standard benchmarks, and a few of the benchmarks here are relatively new and different.
All of our benchmark results can also be found in our benchmark engine, Bench.
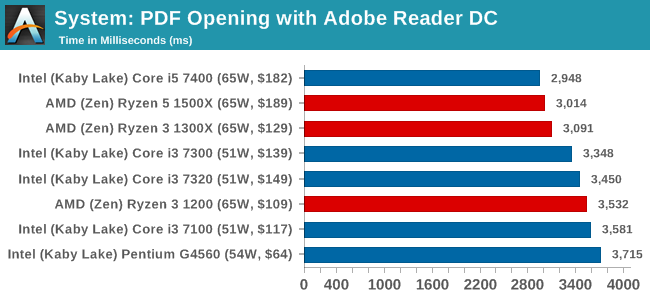
PDF Opening
First up is a self-penned test using a monstrous PDF we once received in advance of attending an event. While the PDF was only a single page, it had so many high-quality layers embedded it was taking north of 15 seconds to open and to gain control on the mid-range notebook I was using at the time. This put it as a great candidate for our 'let's open an obnoxious PDF' test. Here we use Adobe Reader DC, and disable all the update functionality within. The benchmark sets the screen to 1080p, opens the PDF to in fit-to-screen mode, and measures the time from sending the command to open the PDF until it is fully displayed and the user can take control of the software again. The test is repeated ten times, and the average time taken. Results are in milliseconds.
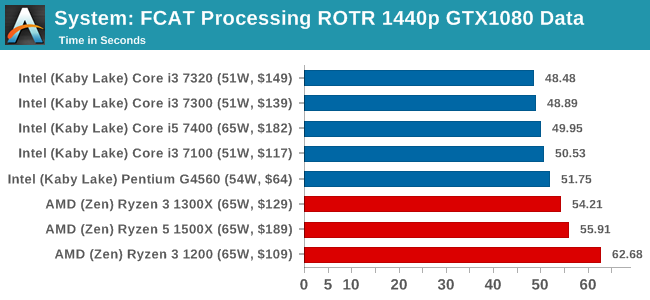
FCAT Processing: link
One of the more interesting workloads that has crossed our desks in recent quarters is FCAT - the tool we use to measure stuttering in gaming due to dropped or runt frames. The FCAT process requires enabling a color-based overlay onto a game, recording the gameplay, and then parsing the video file through the analysis software. The software is mostly single-threaded, however because the video is basically in a raw format, the file size is large and requires moving a lot of data around. For our test, we take a 90-second clip of the Rise of the Tomb Raider benchmark running on a GTX 980 Ti at 1440p, which comes in around 21 GB, and measure the time it takes to process through the visual analysis tool.
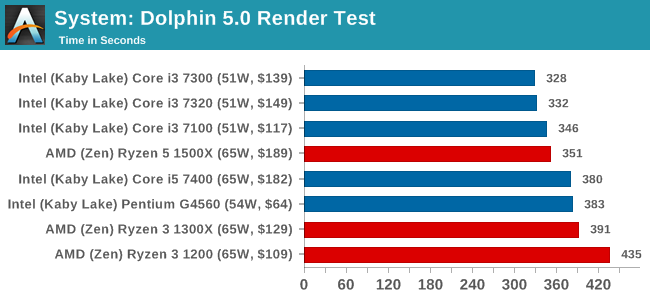
Dolphin Benchmark: link
Many emulators are often bound by single thread CPU performance, and general reports tended to suggest that Haswell provided a significant boost to emulator performance. This benchmark runs a Wii program that ray traces a complex 3D scene inside the Dolphin Wii emulator. Performance on this benchmark is a good proxy of the speed of Dolphin CPU emulation, which is an intensive single core task using most aspects of a CPU. Results are given in minutes, where the Wii itself scores 17.53 minutes.
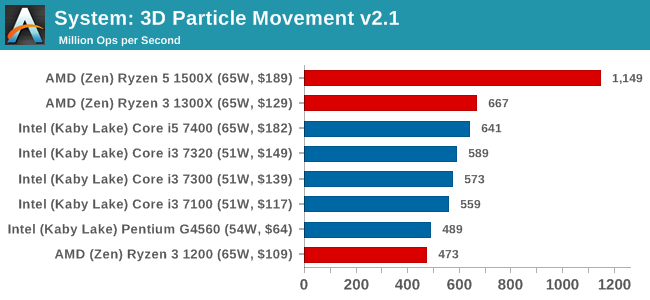
3D Movement Algorithm Test v2.1: link
This is the latest version of the self-penned 3DPM benchmark. The goal of 3DPM is to simulate semi-optimized scientific algorithms taken directly from my doctorate thesis. Version 2.1 improves over 2.0 by passing the main particle structs by reference rather than by value, and decreasing the amount of double->float->double recasts the compiler was adding in. It affords a ~25% speed-up over v2.0, which means new data.
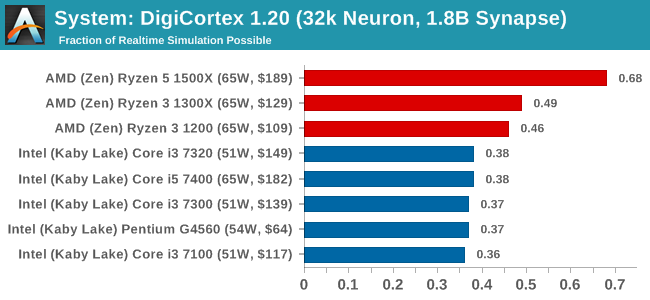
DigiCortex v1.20: link
Despite being a couple of years old, the DigiCortex software is a pet project for the visualization of neuron and synapse activity in the brain. The software comes with a variety of benchmark modes, and we take the small benchmark which runs a 32k neuron/1.8B synapse simulation. The results on the output are given as a fraction of whether the system can simulate in real-time, so anything above a value of one is suitable for real-time work. The benchmark offers a 'no firing synapse' mode, which in essence detects DRAM and bus speed, however we take the firing mode which adds CPU work with every firing.
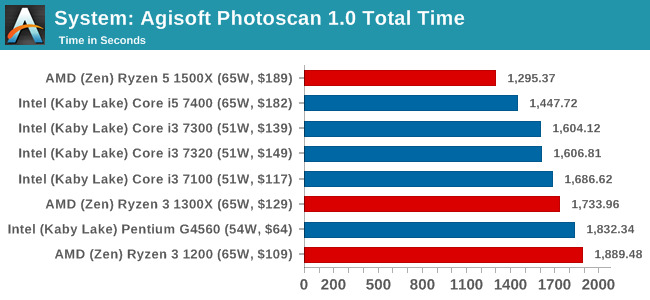
Agisoft Photoscan 1.0: link
Photoscan stays in our benchmark suite from the previous version, however now we are running on Windows 10 so features such as Speed Shift on the latest processors come into play. The concept of Photoscan is translating many 2D images into a 3D model - so the more detailed the images, and the more you have, the better the model. The algorithm has four stages, some single threaded and some multi-threaded, along with some cache/memory dependency in there as well. For some of the more variable threaded workload, features such as Speed Shift and XFR will be able to take advantage of CPU stalls or downtime, giving sizeable speedups on newer microarchitectures.
Benchmarking Performance: CPU Rendering Tests
Rendering tests are a long-time favorite of reviewers and benchmarkers, as the code used by rendering packages is usually highly optimized to squeeze every little bit of performance out. Sometimes rendering programs end up being heavily memory dependent as well - when you have that many threads flying about with a ton of data, having low latency memory can be key to everything. Here we take a few of the usual rendering packages under Windows 10, as well as a few new interesting benchmarks.
All of our benchmark results can also be found in our benchmark engine, Bench.
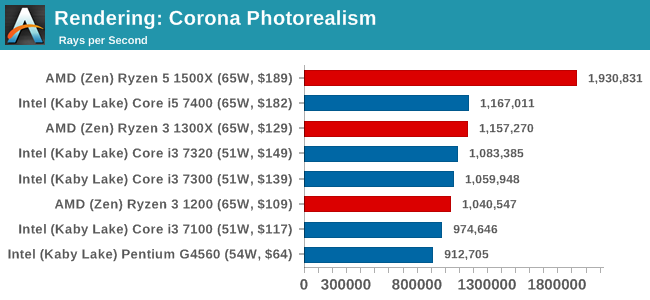
Corona 1.3: link
Corona is a standalone package designed to assist software like 3ds Max and Maya with photorealism via ray tracing. It's simple - shoot rays, get pixels. OK, it's more complicated than that, but the benchmark renders a fixed scene six times and offers results in terms of time and rays per second. The official benchmark tables list user submitted results in terms of time, however I feel rays per second is a better metric (in general, scores where higher is better seem to be easier to explain anyway). Corona likes to pile on the threads, so the results end up being very staggered based on thread count.
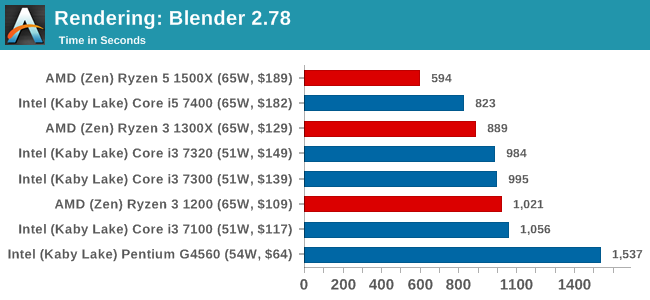
Blender 2.78: link
For a render that has been around for what seems like ages, Blender is still a highly popular tool. We managed to wrap up a standard workload into the February 5 nightly build of Blender and measure the time it takes to render the first frame of the scene. Being one of the bigger open source tools out there, it means both AMD and Intel work actively to help improve the codebase, for better or for worse on their own/each other's microarchitecture.
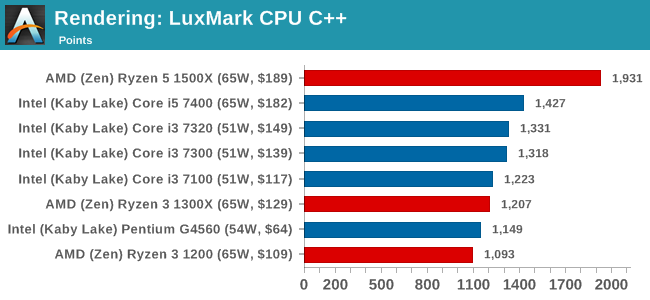
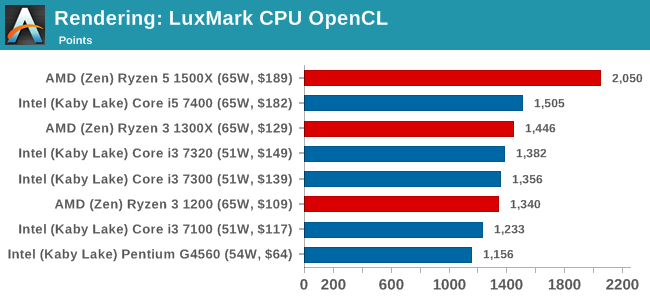
LuxMark v3.1: Link
As a synthetic, LuxMark might come across as somewhat arbitrary as a renderer, given that it's mainly used to test GPUs, but it does offer both an OpenCL and a standard C++ mode. In this instance, aside from seeing the comparison in each coding mode for cores and IPC, we also get to see the difference in performance moving from a C++ based code-stack to an OpenCL one with a CPU as the main host.
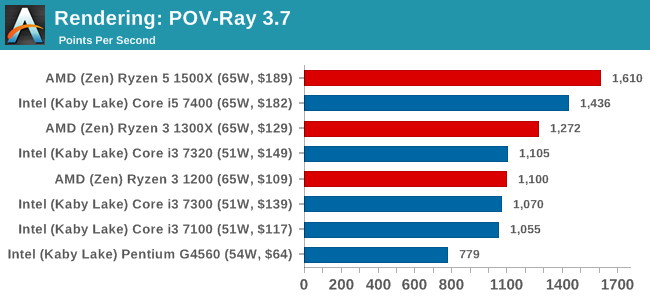
POV-Ray 3.7.1b4: link
Another regular benchmark in most suites, POV-Ray is another ray-tracer but has been around for many years. It just so happens that during the run up to AMD's Ryzen launch, the code base started to get active again with developers making changes to the code and pushing out updates. Our version and benchmarking started just before that was happening, but given time we will see where the POV-Ray code ends up and adjust in due course.
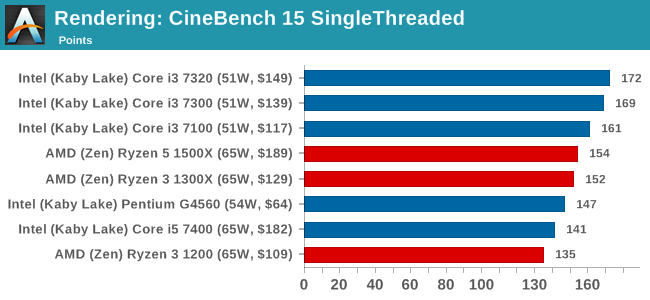
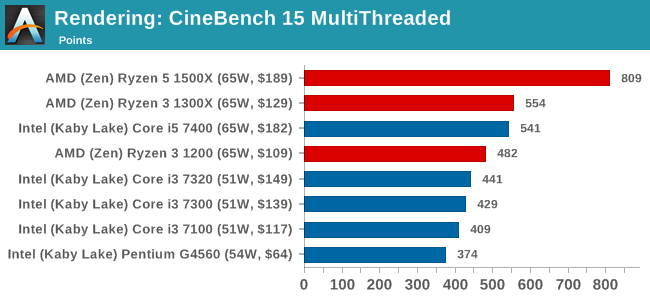
Cinebench R15: link
The latest version of CineBench has also become one of those 'used everywhere' benchmarks, particularly as an indicator of single thread performance. High IPC and high frequency gives performance in ST, whereas having good scaling and many cores is where the MT test wins out.
Benchmarking Performance: CPU Web Tests
One of the issues when running web-based tests is the nature of modern browsers to automatically install updates. This means any sustained period of benchmarking will invariably fall foul of the 'it's updated beyond the state of comparison' rule, especially when browsers will update if you give them half a second to think about it. Despite this, we were able to find a series of commands to create an un-updatable version of Chrome 56 for our 2017 test suite. While this means we might not be on the bleeding edge of the latest browser, it makes the scores between CPUs comparable.
All of our benchmark results can also be found in our benchmark engine, Bench.
SunSpider 1.0.2: link
The oldest web-based benchmark in this portion of our test is SunSpider. This is a very basic javascript algorithm tool, and ends up being more a measure of IPC and latency than anything else, with most high-performance CPUs scoring around about the same. The basic test is looped 10 times and the average taken. We run the basic test 4 times.
Mozilla Kraken 1.1: link
Kraken is another Javascript based benchmark, using the same test harness as SunSpider, but focusing on more stringent real-world use cases and libraries, such as audio processing and image filters. Again, the basic test is looped ten times, and we run the basic test four times.
Google Octane 2.0: link
Along with Mozilla, as Google is a major browser developer, having peak JS performance is typically a critical asset when comparing against the other OS developers. In the same way that SunSpider is a very early JS benchmark, and Kraken is a bit newer, Octane aims to be more relevant to real workloads, especially in power constrained devices such as smartphones and tablets.
WebXPRT 2015: link
While the previous three benchmarks do calculations in the background and represent a score, WebXPRT is designed to be a better interpretation of visual workloads that a professional user might have, such as browser based applications, graphing, image editing, sort/analysis, scientific analysis and financial tools.
Benchmarking Performance: CPU Encoding Tests
One of the interesting elements on modern processors is encoding performance. This includes encryption/decryption, as well as video transcoding from one video format to another. In the encrypt/decrypt scenario, this remains pertinent to on-the-fly encryption of sensitive data - a process by which more modern devices are leaning to for software security. Video transcoding as a tool to adjust the quality, file size and resolution of a video file has boomed in recent years, such as providing the optimum video for devices before consumption, or for game streamers who are wanting to upload the output from their video camera in real-time. As we move into live 3D video, this task will only get more strenuous, and it turns out that the performance of certain algorithms is a function of the input/output of the content.
All of our benchmark results can also be found in our benchmark engine, Bench.
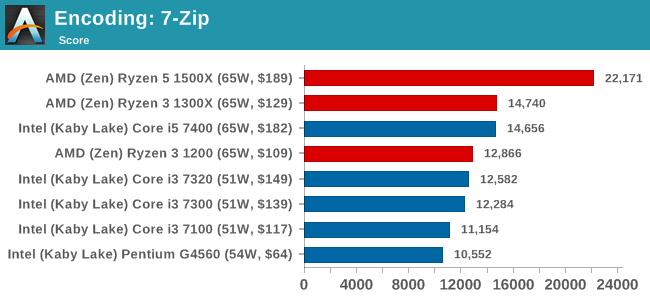
7-Zip 9.2: link
One of the freeware compression tools that offers good scaling performance between processors is 7-Zip. It runs under an open-source licence, is fast, and easy to use tool for power users. We run the benchmark mode via the command line for four loops and take the output score.
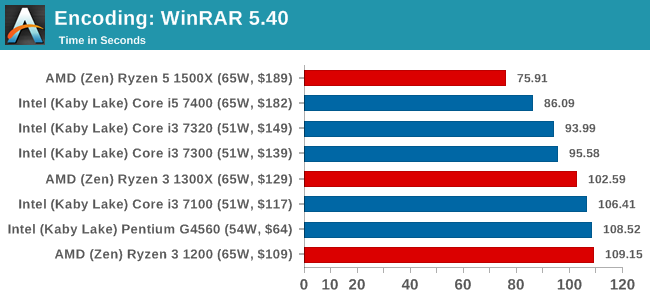
WinRAR 5.40: link
For the 2017 test suite, we move to the latest version of WinRAR in our compression test. WinRAR in some quarters is more user-friendly that 7-Zip, hence its inclusion. Rather than use a benchmark mode as we did with 7-Zip, here we take a set of files representative of a generic stack (33 video files in 1.37 GB, 2834 smaller website files in 370 folders in 150 MB) of compressible and incompressible formats. The results shown are the time taken to encode the file. Due to DRAM caching, we run the test 10 times and take the average of the last five runs when the benchmark is in a steady state.
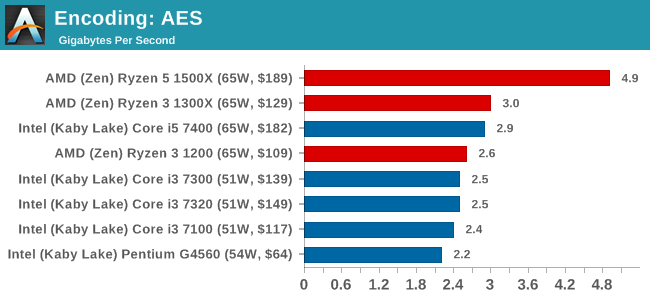
AES Encoding
Algorithms using AES coding have spread far and wide as a ubiquitous tool for encryption. Again, this is another CPU limited test, and modern CPUs have special AES pathways to accelerate their performance. We often see scaling in both frequency and cores with this benchmark. We use the latest version of TrueCrypt and run its benchmark mode over 1GB of in-DRAM data. Results shown are the GB/s average of encryption and decryption.
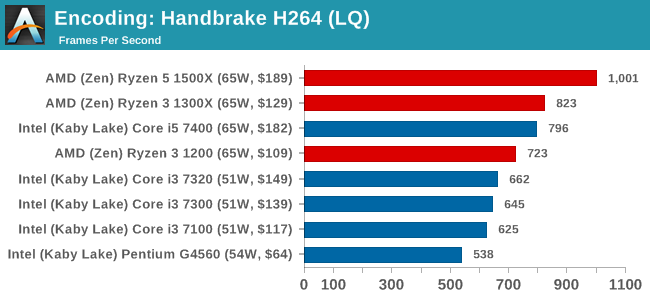
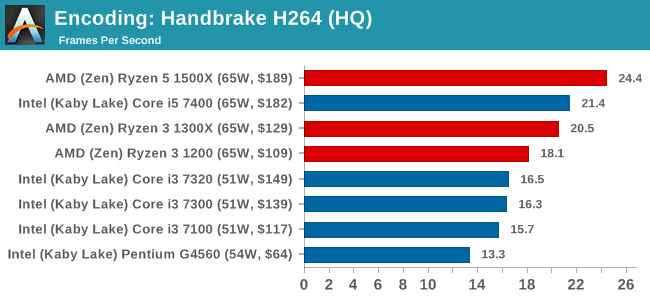
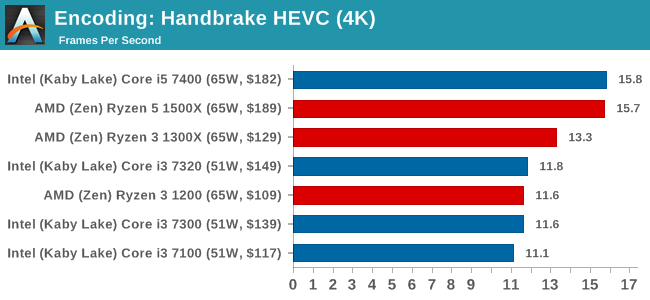
HandBrake v1.0.2 H264 and HEVC: link
As mentioned above, video transcoding (both encode and decode) is a hot topic in performance metrics as more and more content is being created. First consideration is the standard in which the video is encoded, which can be lossless or lossy, trade performance for file-size, trade quality for file-size, or all of the above can increase encoding rates to help accelerate decoding rates. Alongside Google's favorite codec, VP9, there are two others that are taking hold: H264, the older codec, is practically everywhere and is designed to be optimized for 1080p video, and HEVC (or H265) that is aimed to provide the same quality as H264 but at a lower file-size (or better quality for the same size). HEVC is important as 4K is streamed over the air, meaning less bits need to be transferred for the same quality content.
Handbrake is a favored tool for transcoding, and so our test regime takes care of three areas.
Low Quality/Resolution H264: He we transcode a 640x266 H264 rip of a 2 hour film, and change the encoding from Main profile to High profile, using the very-fast preset.
High Quality/Resolution H264: A similar test, but this time we take a ten-minute double 4K (3840x4320) file running at 60 Hz and transcode from Main to High, using the very-fast preset.
HEVC Test: Using the same video in HQ, we change the resolution and codec of the original video from 4K60 in H264 into 4K60 HEVC.
Benchmarking Performance: CPU Office Tests
The office programs we use for benchmarking aren't specific programs per-se, but industry standard tests that hold weight with professionals. The goal of these tests is to use an array of software and techniques that a typical office user might encounter, such as video conferencing, document editing, architectural modeling, and so on and so forth.
All of our benchmark results can also be found in our benchmark engine, Bench.
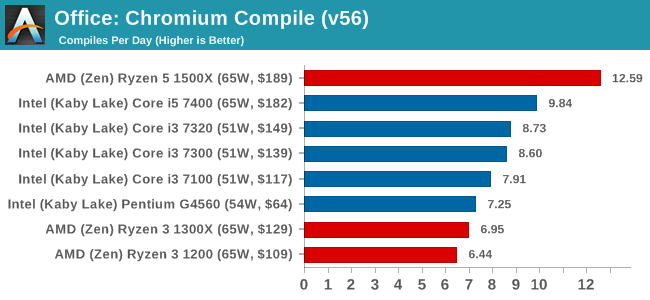
Chromium Compile (v56)
Our new compilation test uses Windows 10 Pro, VS Community 2015.3 with the Win10 SDK to compile a nightly build of Chromium. We've fixed the test for a build in late March 2017, and we run a fresh full compile in our test. Compilation is the typical example given of a variable threaded workload - some of the compile and linking is linear, whereas other parts are multithreaded.
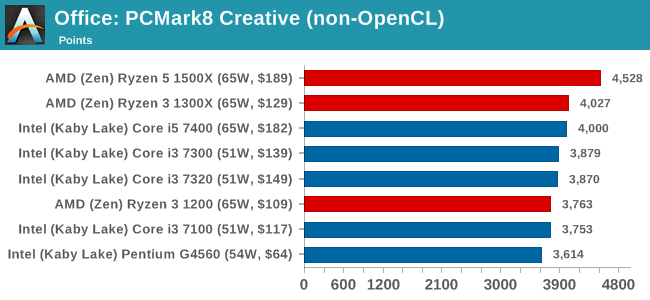
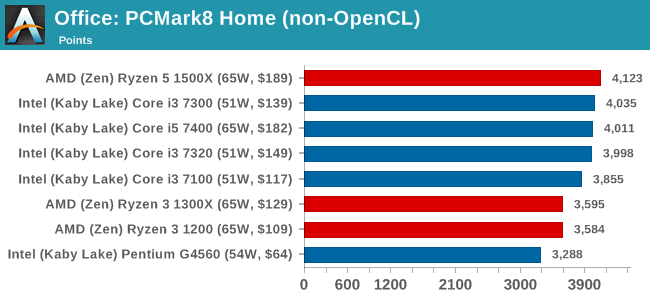
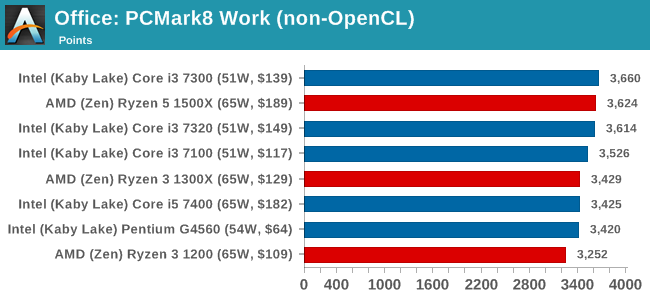
PCMark8: link
Despite originally coming out in 2008/2009, Futuremark has maintained PCMark8 to remain relevant in 2017. On the scale of complicated tasks, PCMark focuses more on the low-to-mid range of professional workloads, making it a good indicator for what people consider 'office' work. We run the benchmark from the commandline in 'conventional' mode, meaning C++ over OpenCL, to remove the graphics card from the equation and focus purely on the CPU. PCMark8 offers Home, Work and Creative workloads, with some software tests shared and others unique to each benchmark set.
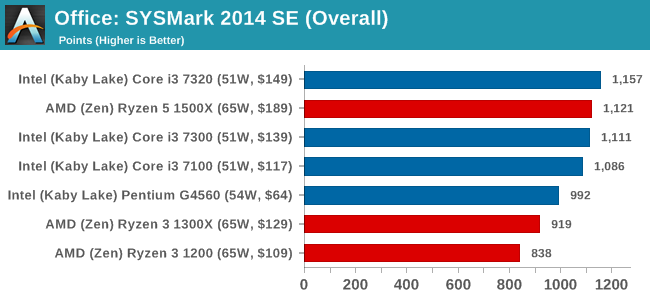
SYSmark 2014 SE: link
SYSmark is developed by Bapco, a consortium of industry CPU companies. The goal of SYSmark is to take stripped down versions of popular software, such as Photoshop and Onenote, and measure how long it takes to process certain tasks within that software. The end result is a score for each of the three segments (Office, Media, Data) as well as an overall score. Here a reference system (Core i3-6100, 4GB DDR3, 256GB SSD, Integrated HD 530 graphics) is used to provide a baseline score of 1000 in each test.
A note on context for these numbers. AMD left Bapco in the last two years, due to differences of opinion on how the benchmarking suites were chosen and AMD believed the tests are angled towards Intel processors and had optimizations to show bigger differences than what AMD felt was present. The following benchmarks are provided as data, but the conflict of opinion between the two companies on the validity of the benchmark is provided as context for the following numbers.
Benchmarking Performance: CPU Legacy Tests
Our legacy tests represent benchmarks that were once at the height of their time. Some of these are industry standard synthetics, and we have data going back over 10 years. All of the data here has been rerun on Windows 10, and we plan to go back several generations of components to see how performance has evolved.
All of our benchmark results can also be found in our benchmark engine, Bench.
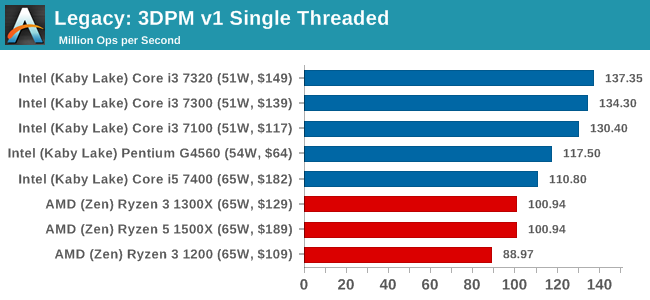
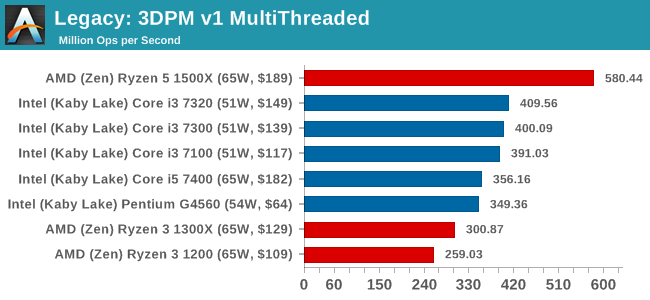
3D Particle Movement v1
3DPM is a self-penned benchmark, taking basic 3D movement algorithms used in Brownian Motion simulations and testing them for speed. High floating point performance, MHz and IPC wins in the single thread version, whereas the multithread version has to handle the threads and loves more cores. This is the original version, written in the style of a typical non-computer science student coding up an algorithm for their theoretical problem, and comes without any non-obvious optimizations not already performed by the compiler, such as false sharing.
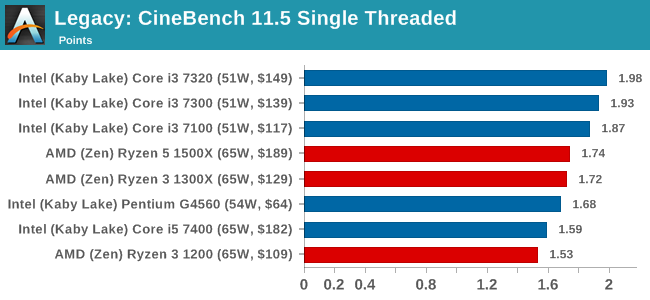
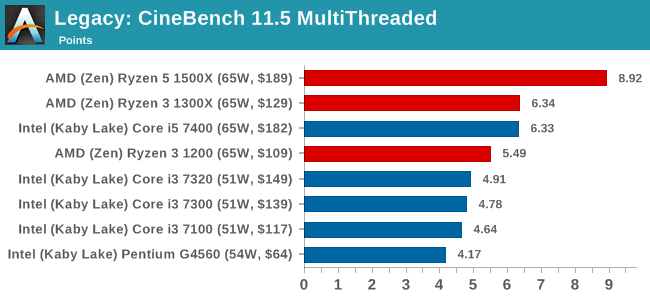
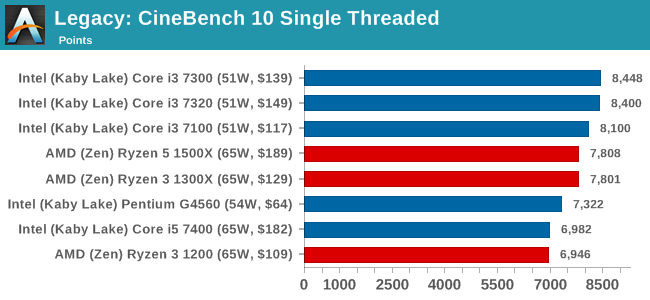
CineBench 11.5 and 10
Cinebench is a widely known benchmarking tool for measuring performance relative to MAXON's animation software Cinema 4D. Cinebench has been optimized over a decade and focuses on purely CPU horsepower, meaning if there is a discrepancy in pure throughput characteristics, Cinebench is likely to show that discrepancy. Arguably other software doesn't make use of all the tools available, so the real world relevance might purely be academic, but given our large database of data for Cinebench it seems difficult to ignore a small five-minute test. We run the modern version 15 in this test, as well as the older 11.5 and 10 due to our back data.

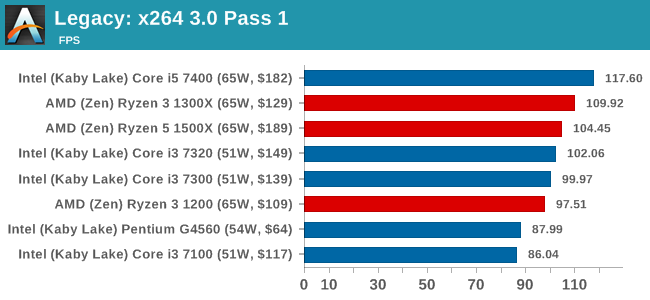
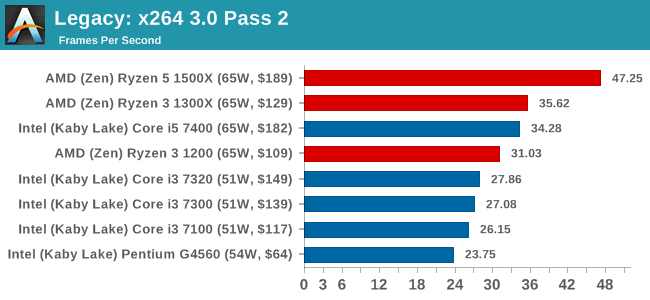
x264 HD 3.0
Similarly, the x264 HD 3.0 package we use here is also kept for historic regressional data. The latest version is 5.0.1, and encodes a 1080p video clip into a high-quality x264 file. Version 3.0 only performs the same test on a 720p file, and in most circumstances the software performance hits its limit on high-end processors, but still works well for mainstream and low-end. Also, this version only takes a few minutes, whereas the latest can take over 90 minutes to run.
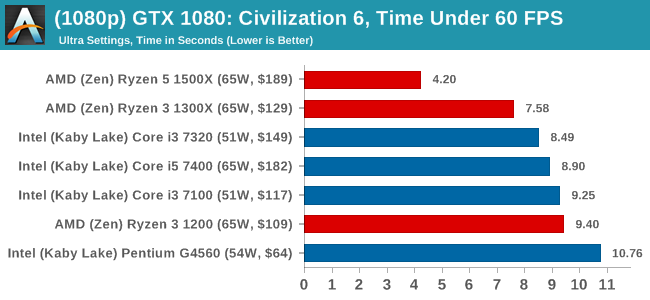
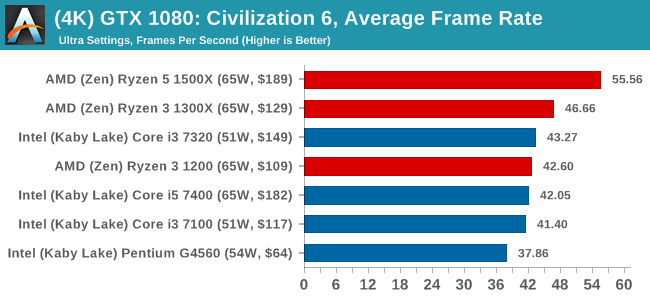
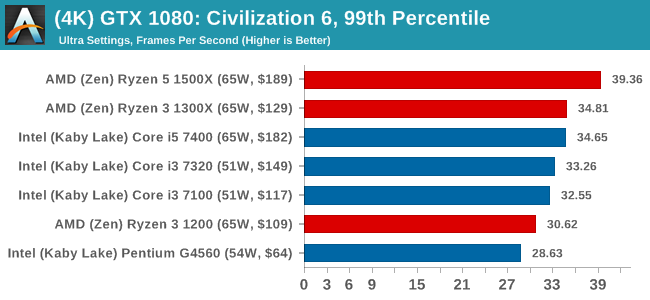
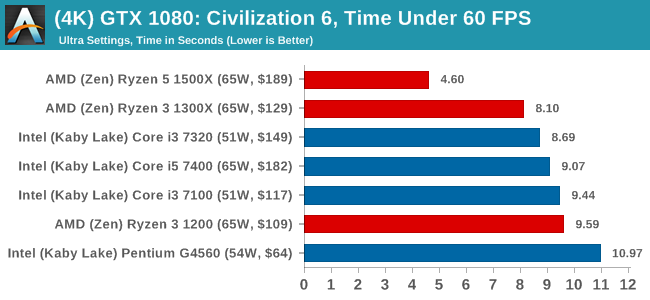
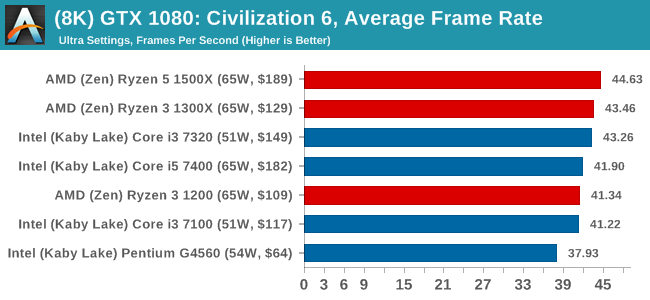
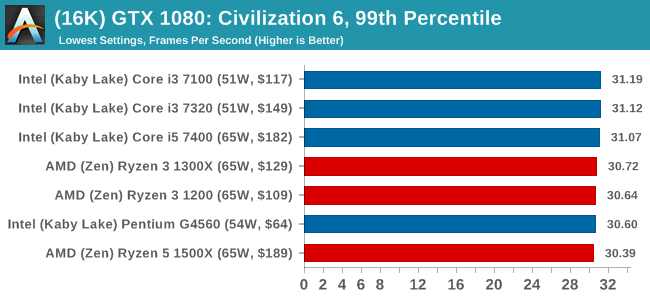
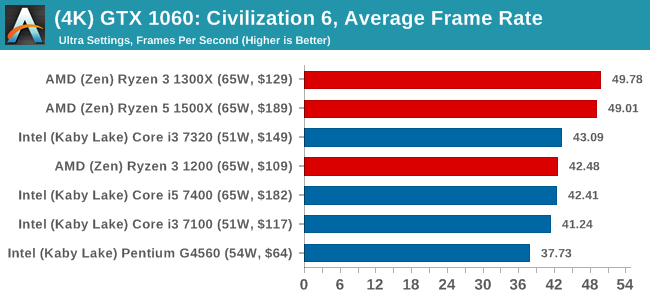
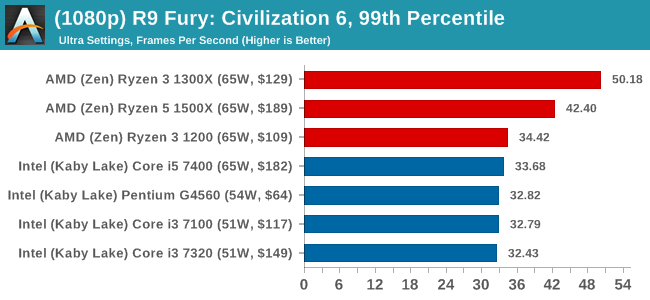
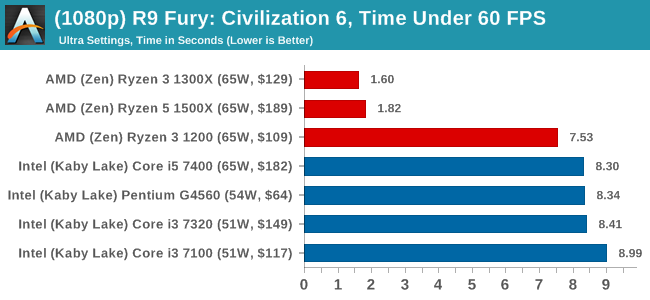
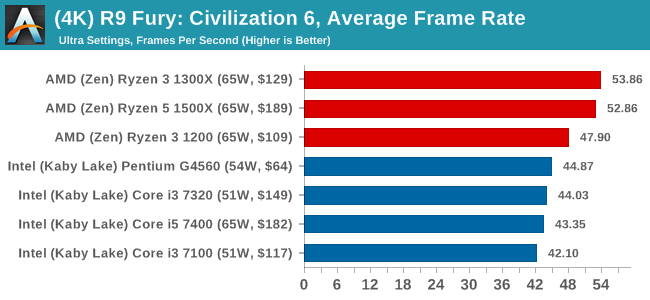
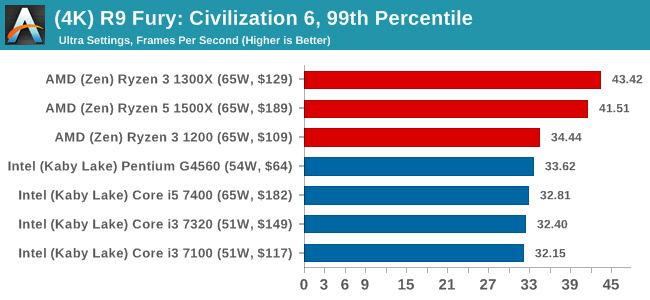
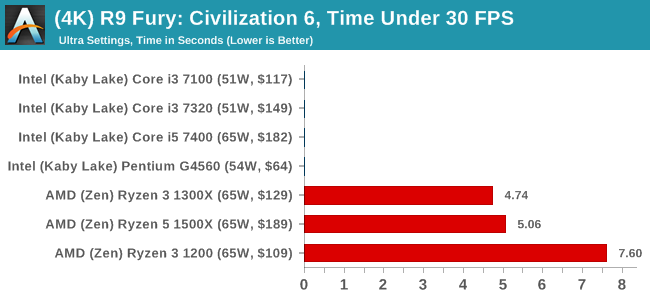
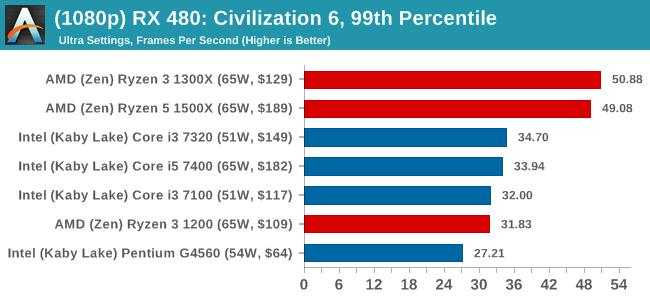
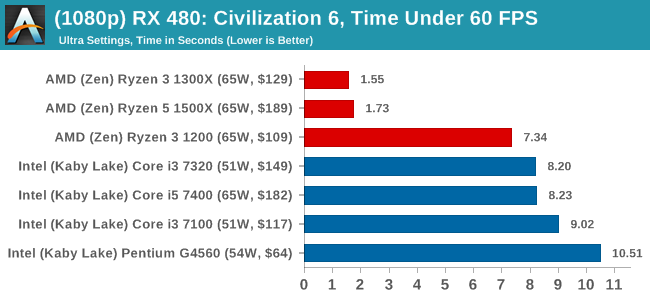
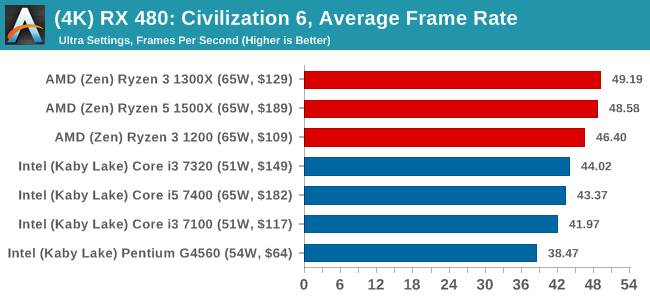
Civilization 6
First up in our CPU gaming tests is Civilization 6. Originally penned by Sid Meier and his team, the Civ series of turn-based strategy games are a cult classic, and many an excuse for an all-nighter trying to get Gandhi to declare war on you due to an integer overflow. Truth be told I never actually played the first version, but every edition from the second to the sixth, including the fourth as voiced by the late Leonard Nimoy, it a game that is easy to pick up, but hard to master.

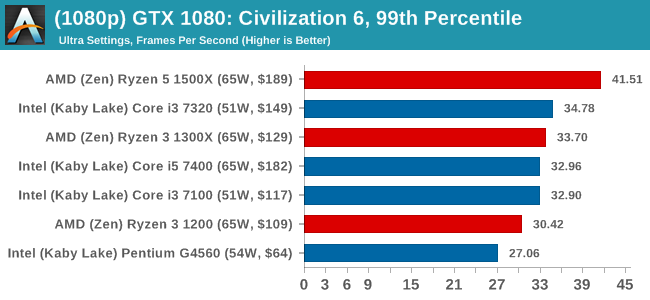
Benchmarking Civilization has always been somewhat of an oxymoron – for a turn based strategy game, the frame rate is not necessarily the important thing here and even in the right mood, something as low as 5 frames per second can be enough. With Civilization 6 however, Firaxis went hardcore on visual fidelity, trying to pull you into the game. As a result, Civilization can taxing on graphics and CPUs as we crank up the details, especially in DirectX 12.
Perhaps a more poignant benchmark would be during the late game, when in the older versions of Civilization it could take 20 minutes to cycle around the AI players before the human regained control. The new version of Civilization has an integrated ‘AI Benchmark’, although it is not currently part of our benchmark portfolio yet, due to technical reasons which we are trying to solve. Instead, we run the graphics test, which provides an example of a mid-game setup at our settings.
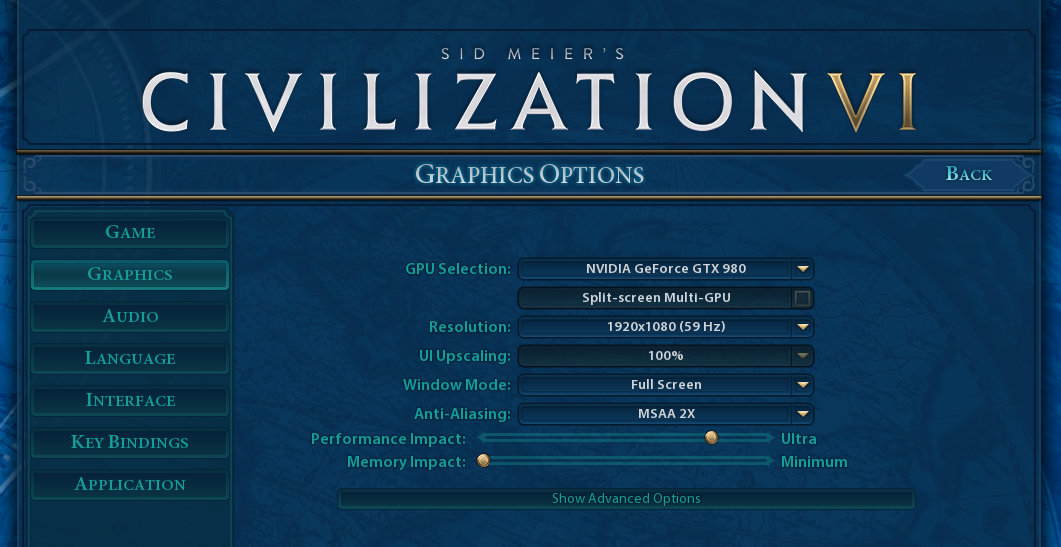
At both 1920x1080 and 4K resolutions, we run the same settings. Civilization 6 has sliders for MSAA, Performance Impact and Memory Impact. The latter two refer to detail and texture size respectively, and are rated between 0 (lowest) to 5 (extreme). We run our Civ6 benchmark in position four for performance (ultra) and 0 on memory, with MSAA set to 2x.
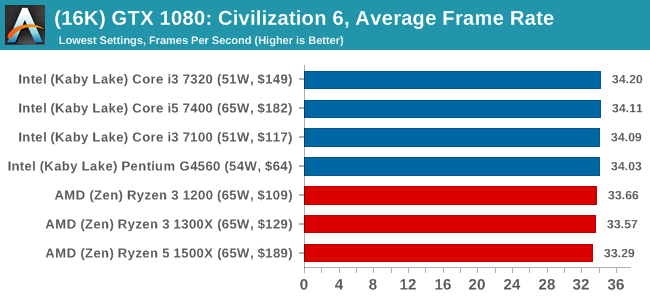
For reviews where we include 8K and 16K benchmarks (Civ6 allows us to benchmark extreme resolutions on any monitor) on our GTX 1080, we run the 8K tests similar to the 4K tests, but the 16K tests are set to the lowest option for Performance.
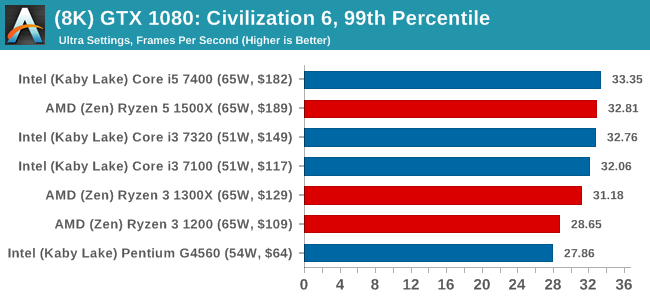
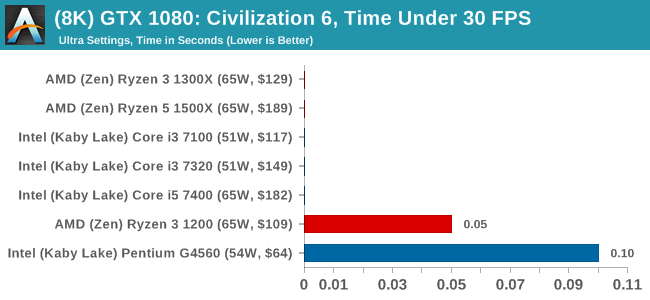
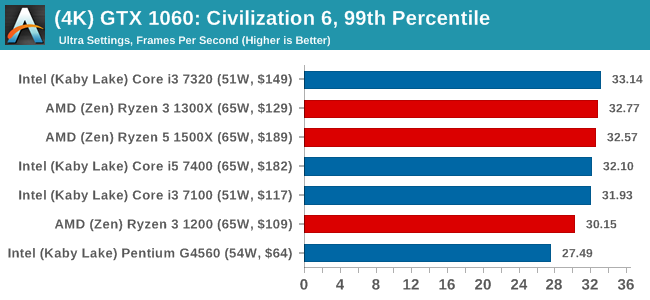
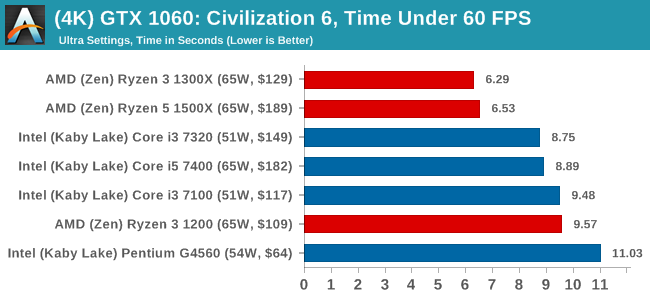
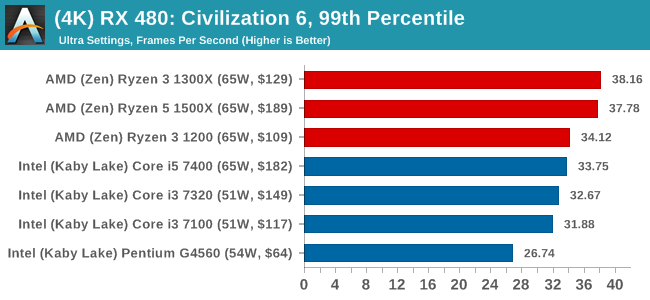
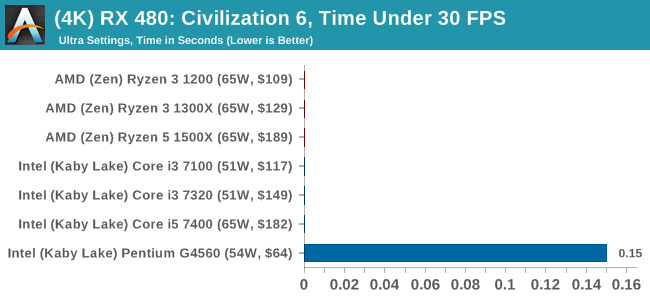
For all our results, we show the average frame rate at 1080p first. Mouse over the other graphs underneath to see 99th percentile frame rates and 'Time Under' graphs, as well as results for other resolutions. All of our benchmark results can also be found in our benchmark engine, Bench.
MSI GTX 1080 Gaming 8G Performance

1080p
4K
8K
16K

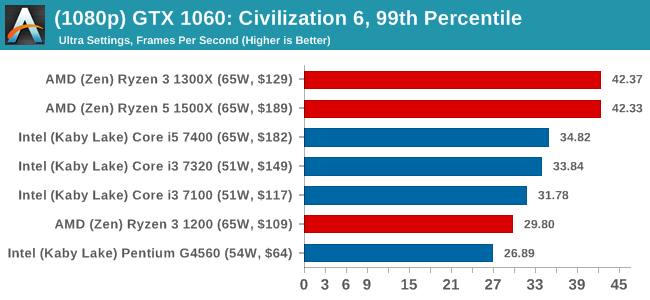
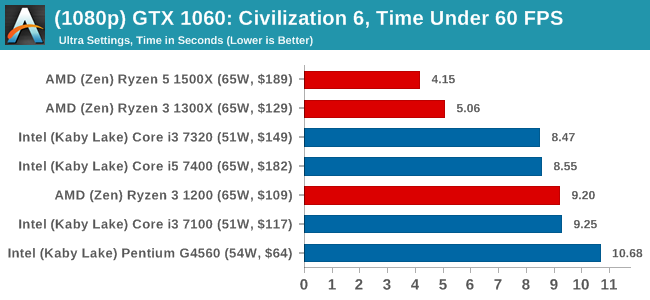
ASUS GTX 1060 Strix 6GB Performance
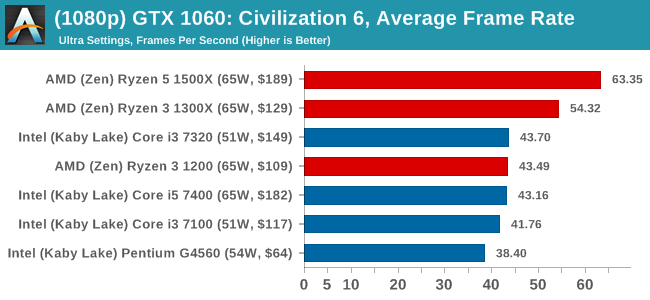
1080p
4K
Sapphire R9 Fury 4GB Performance
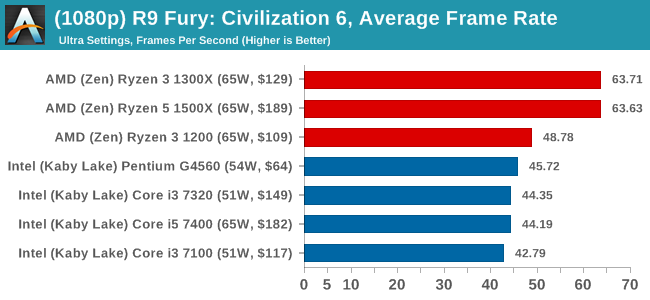
1080p
4K
Sapphire RX 480 8GB Performance
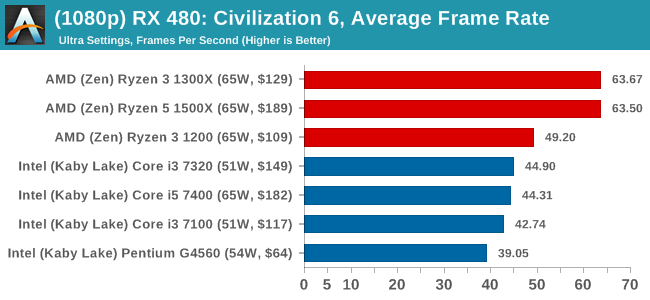
1080p
4K
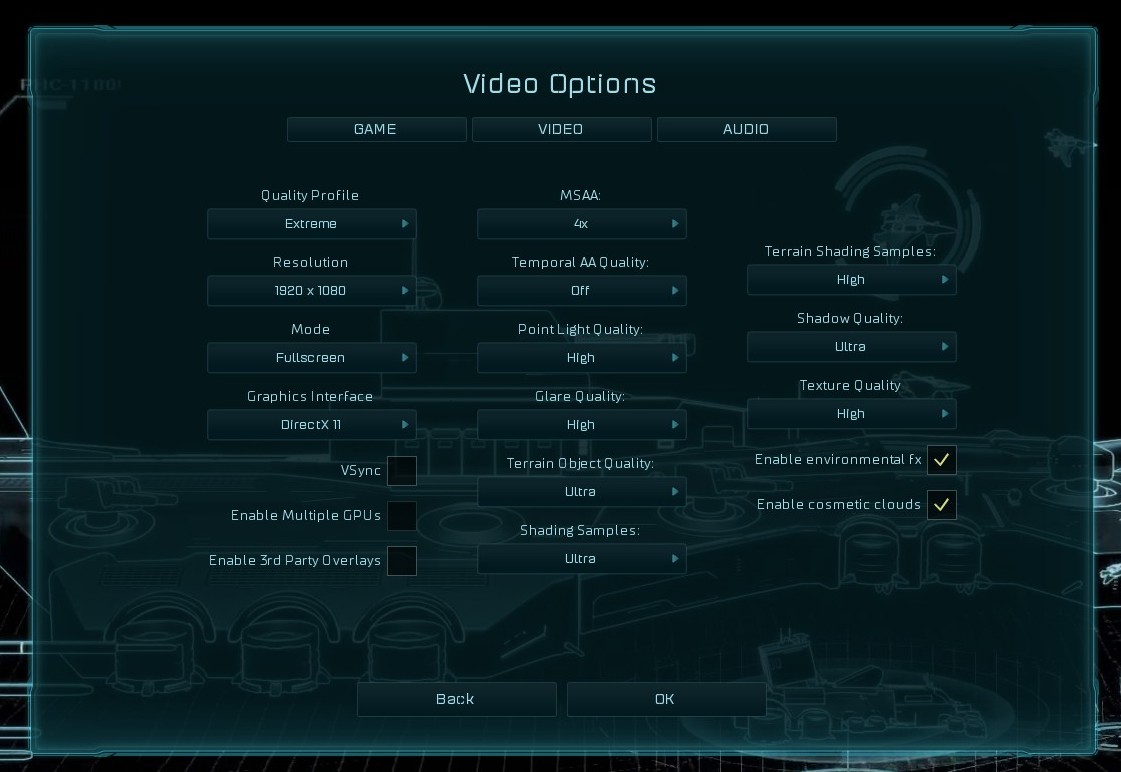
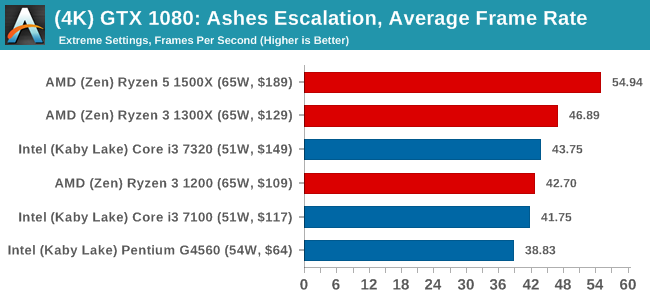
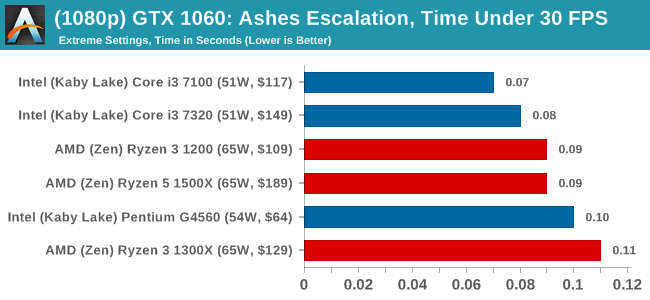
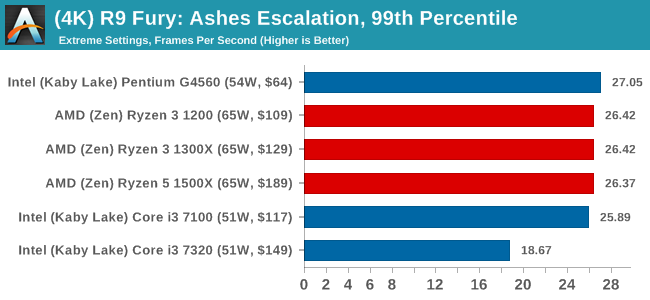
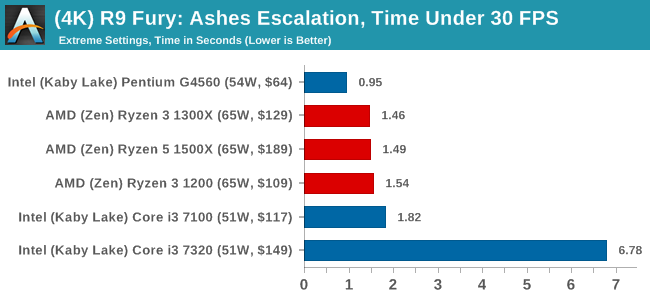
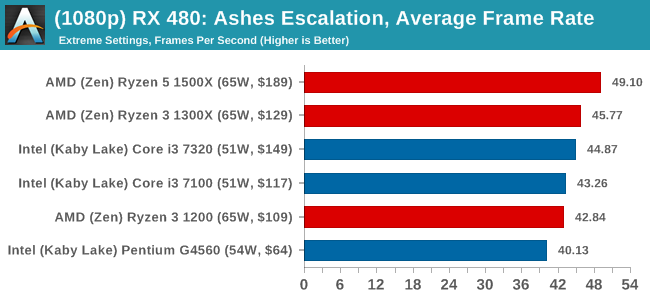
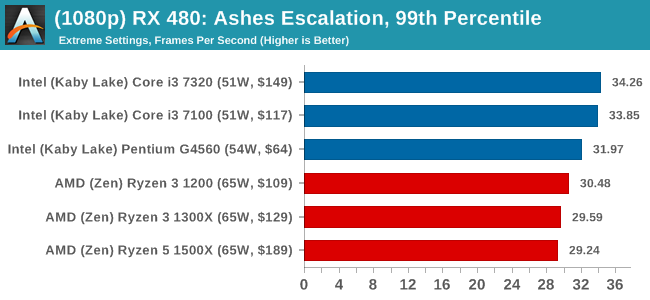
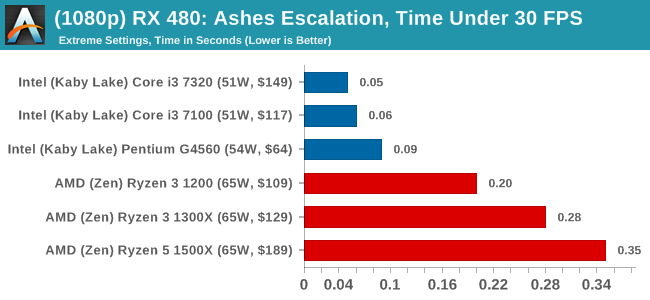
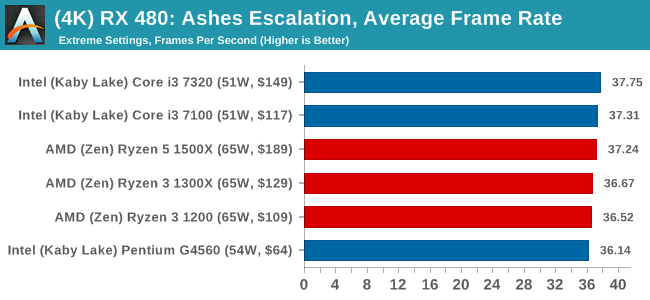
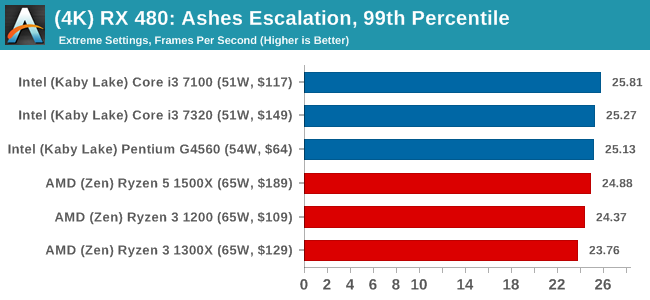
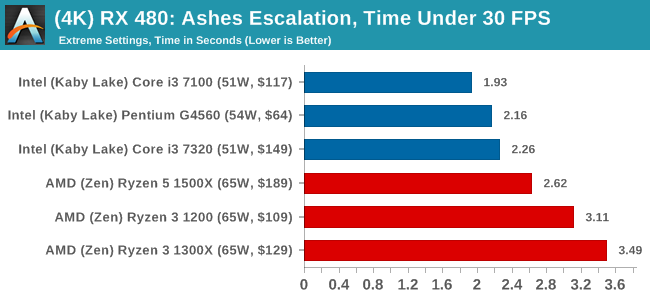
Ashes of the Singularity: Escalation
Seen as the holy child of DirectX12, Ashes of the Singularity (AoTS, or just Ashes) has been the first title to actively go explore as many of DirectX12s features as it possibly can. Stardock, the developer behind the Nitrous engine which powers the game, has ensured that the real-time strategy title takes advantage of multiple cores and multiple graphics cards, in as many configurations as possible.
As a real-time strategy title, Ashes is all about responsiveness during both wide open shots but also concentrated battles. With DirectX12 at the helm, the ability to implement more draw calls per second allows the engine to work with substantial unit depth and effects that other RTS titles had to rely on combined draw calls to achieve, making some combined unit structures ultimately very rigid.
Stardock clearly understand the importance of an in-game benchmark, ensuring that such a tool was available and capable from day one, especially with all the additional DX12 features used and being able to characterize how they affected the title for the developer was important. The in-game benchmark performs a four minute fixed seed battle environment with a variety of shots, and outputs a vast amount of data to analyze.
For our benchmark, we run a fixed v2.11 version of the game due to some peculiarities of the splash screen added after the merger with the standalone Escalation expansion, and have an automated tool to call the benchmark on the command line. (Prior to v2.11, the benchmark also supported 8K/16K testing, however v2.11 has odd behavior which nukes this.)
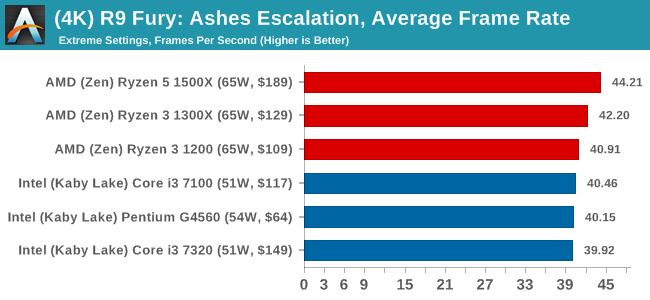
At both 1920x1080 and 4K resolutions, we run the same settings. Ashes has dropdown options for MSAA, Light Quality, Object Quality, Shading Samples, Shadow Quality, Textures, and separate options for the terrain. There are several presents, from Very Low to Extreme: we run our benchmarks at Extreme settings, and take the frame-time output for our average, percentile, and time under analysis.
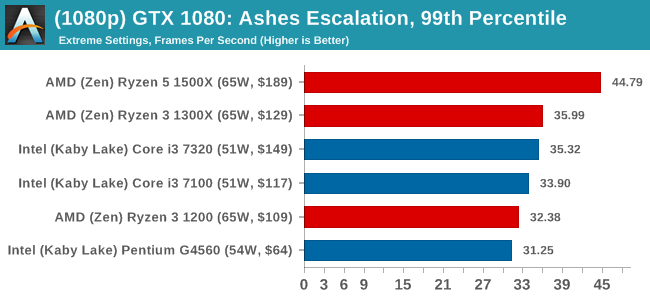
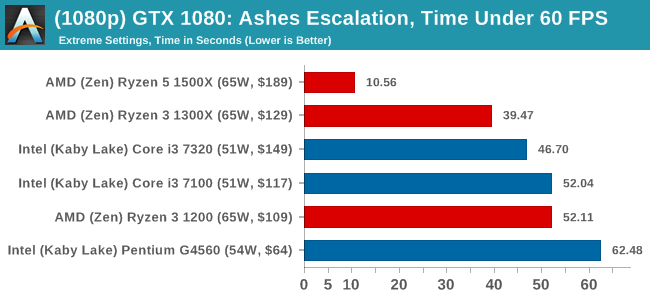
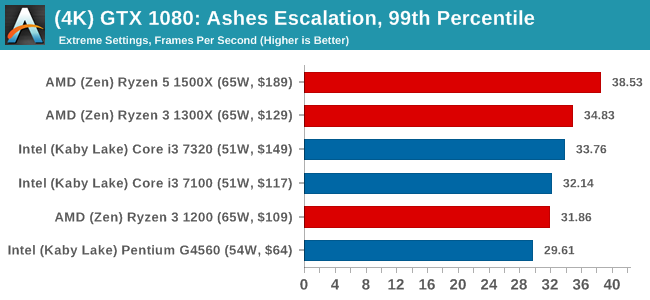
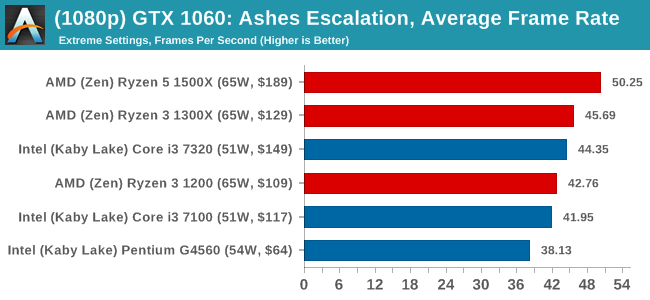
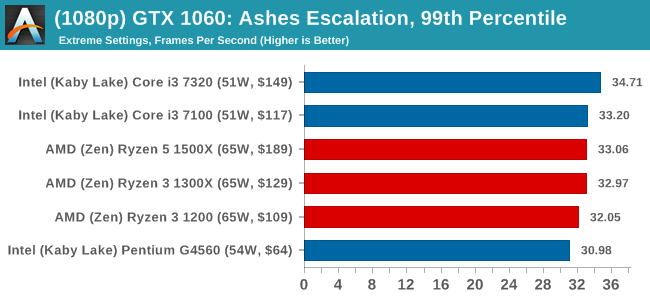
For all our results, we show the average frame rate at 1080p first. Mouse over the other graphs underneath to see 99th percentile frame rates and 'Time Under' graphs, as well as results for other resolutions. All of our benchmark results can also be found in our benchmark engine, Bench.
MSI GTX 1080 Gaming 8G Performance
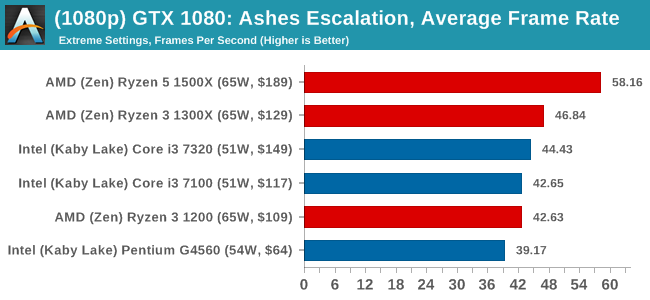
1080p
4K

ASUS GTX 1060 Strix 6GB Performance
1080p
4K
Sapphire R9 Fury 4GB Performance
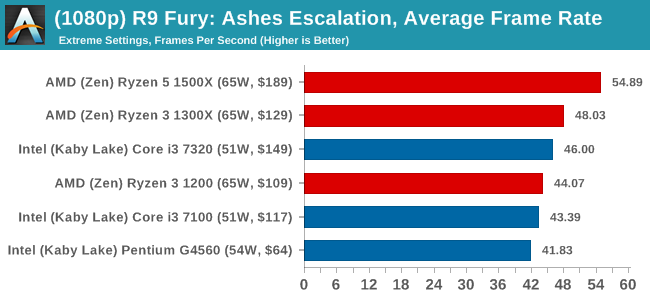
1080p
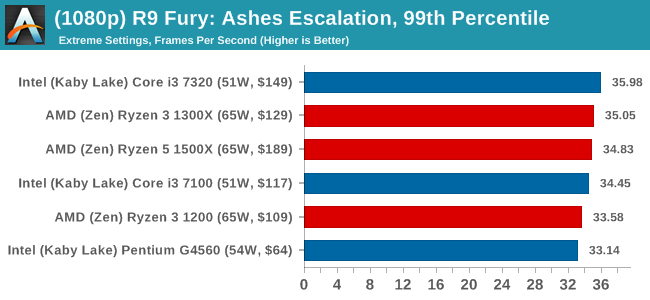
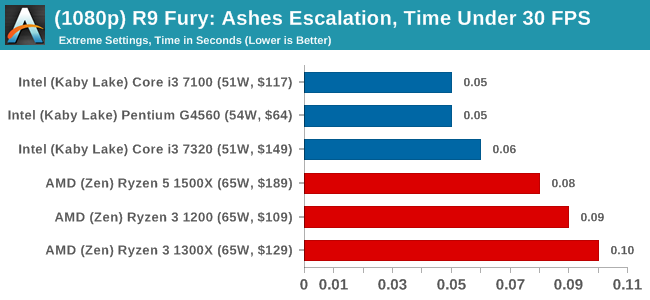
4K
Sapphire RX 480 8GB Performance
1080p
4K
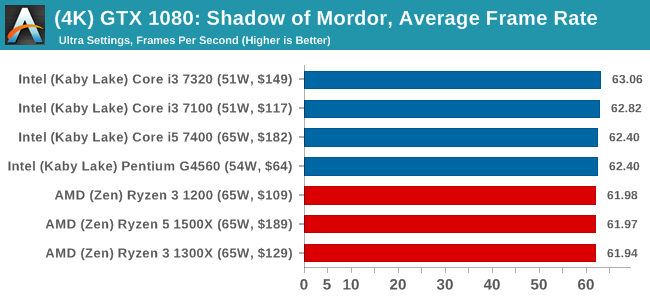
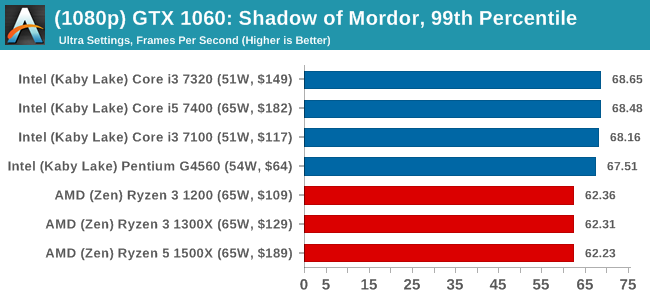
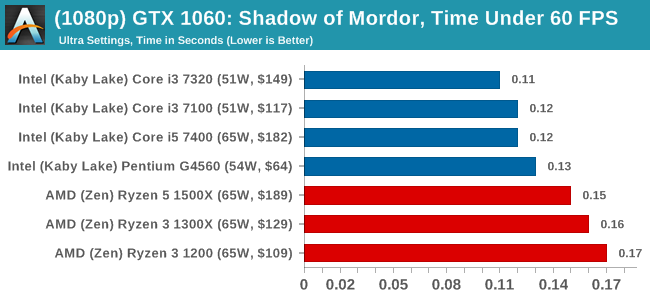
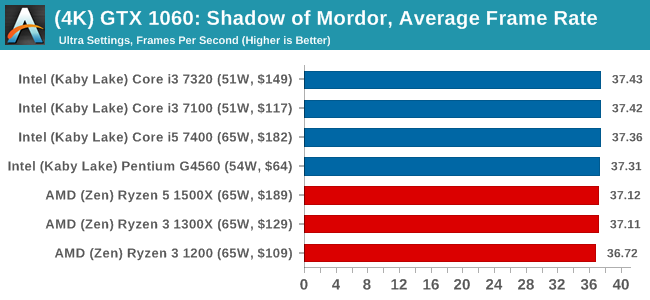
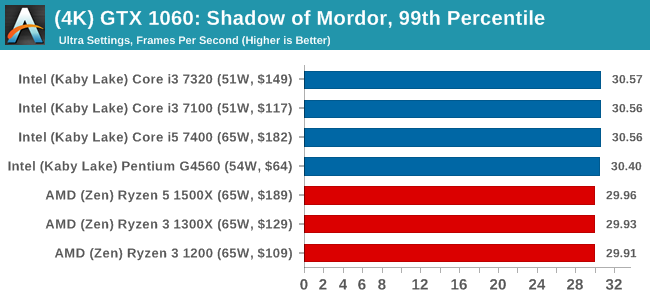
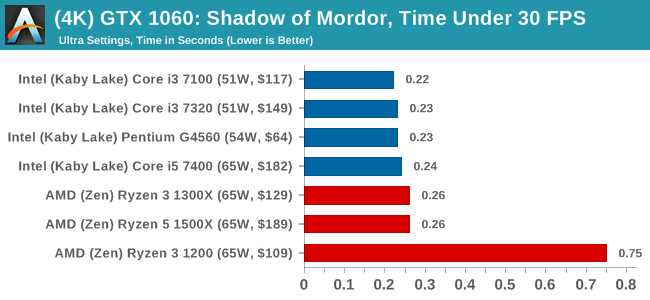
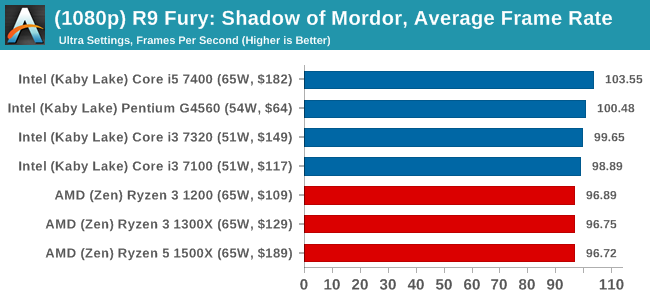
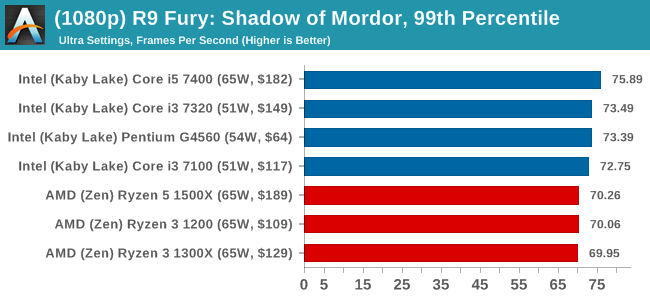
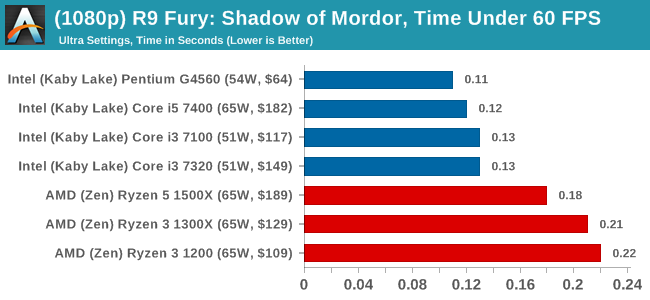
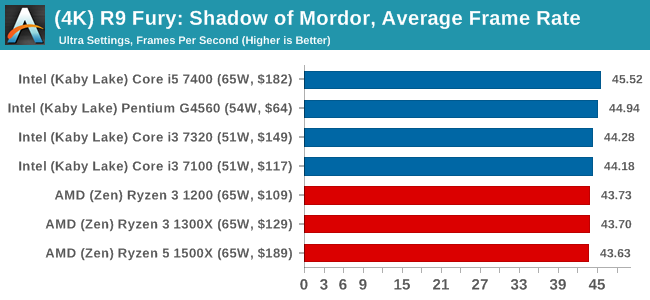
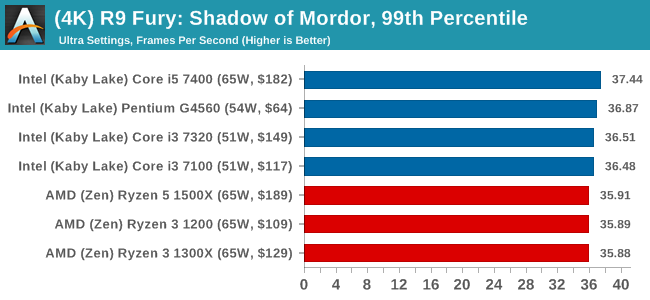
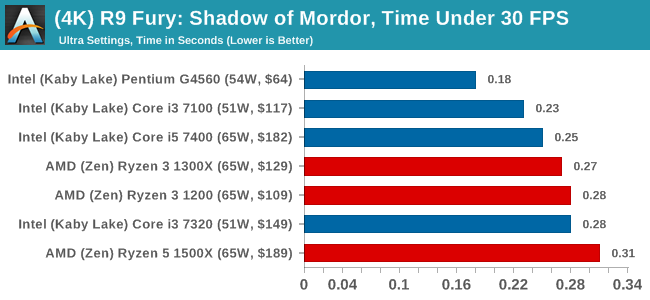
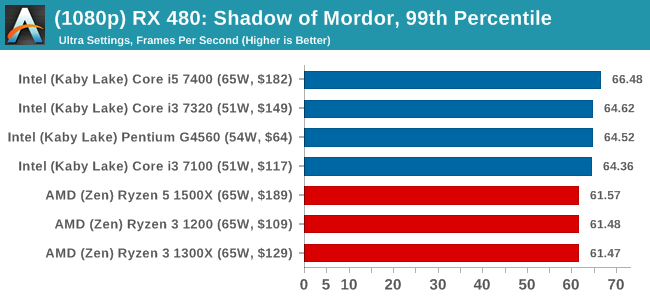
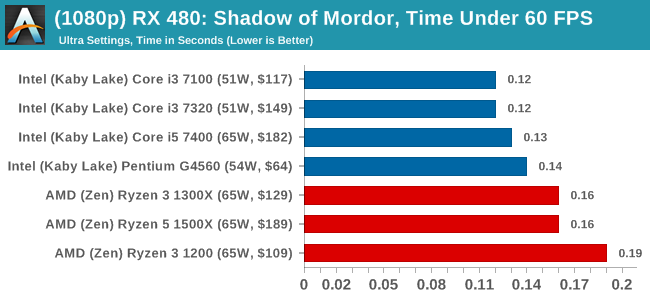
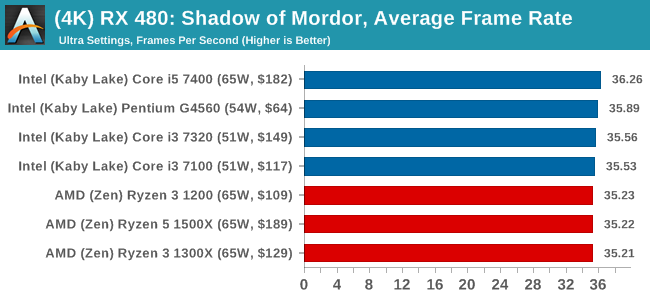
Shadow of Mordor
The next title in our testing is a battle of system performance with the open world action-adventure title, Middle Earth: Shadow of Mordor (SoM for short). Produced by Monolith and using the LithTech Jupiter EX engine and numerous detail add-ons, SoM goes for detail and complexity. The main story itself was written by the same writer as Red Dead Redemption, and it received Zero Punctuation’s Game of The Year in 2014.

A 2014 game is fairly old to be testing now, however SoM has a stable code and player base, and can still stress a PC down to the ones and zeroes. At the time, SoM was unique, offering a dynamic screen resolution setting allowing users to render at high resolutions that are then scaled down to the monitor. This form of natural oversampling was designed to let the user experience a truer vision of what the developers wanted, assuming you had the graphics hardware to power it but had a sub-4K monitor.
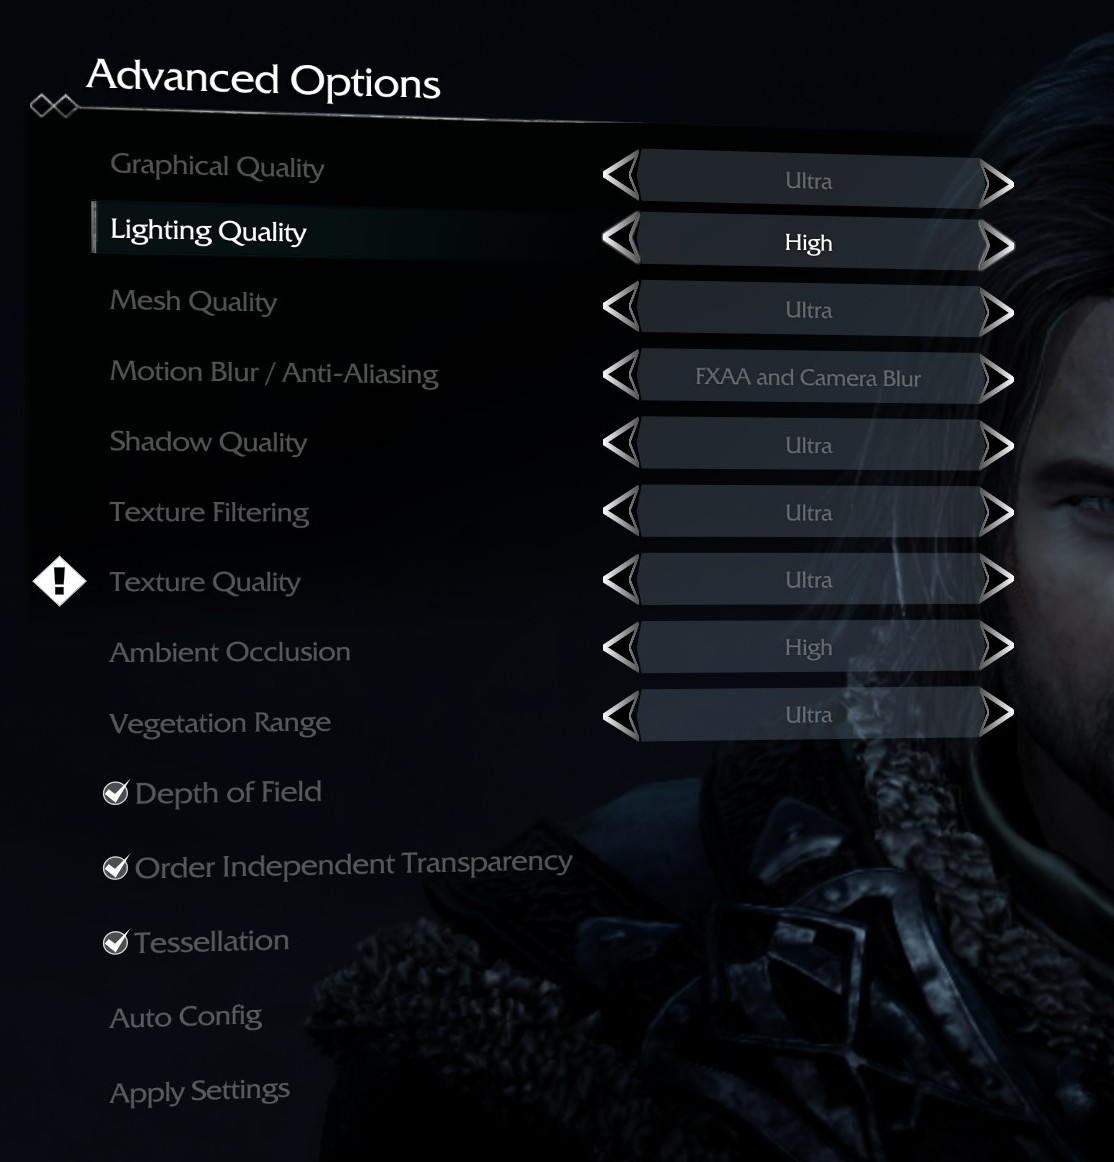
The title has an in-game benchmark, for which we run with an automated script implement the graphics settings, select the benchmark, and parse the frame-time output which is dumped on the drive. The graphics settings include standard options such as Graphical Quality, Lighting, Mesh, Motion Blur, Shadow Quality, Textures, Vegetation Range, Depth of Field, Transparency and Tessellation. There are standard presets as well.
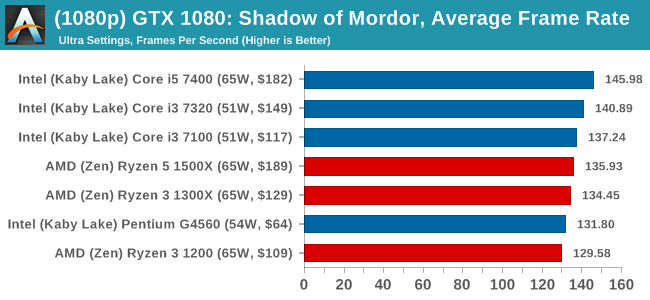
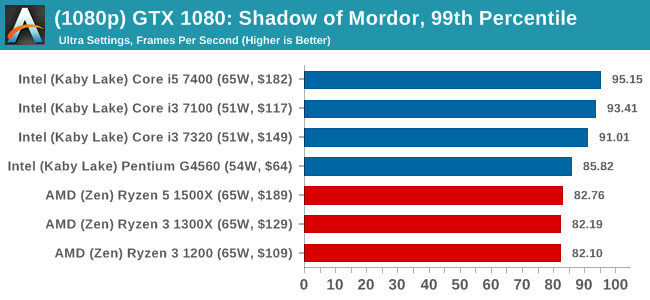
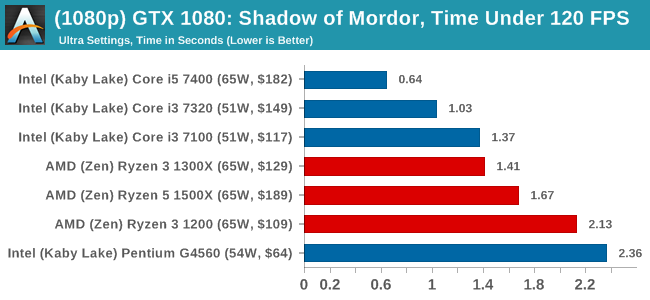
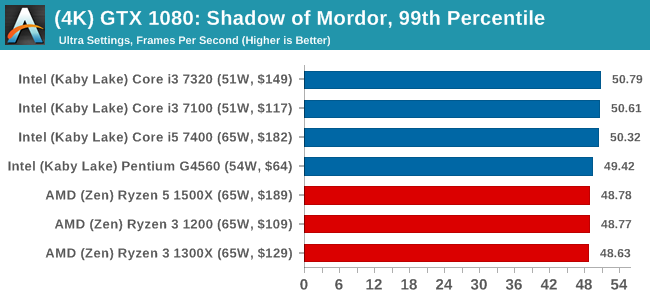
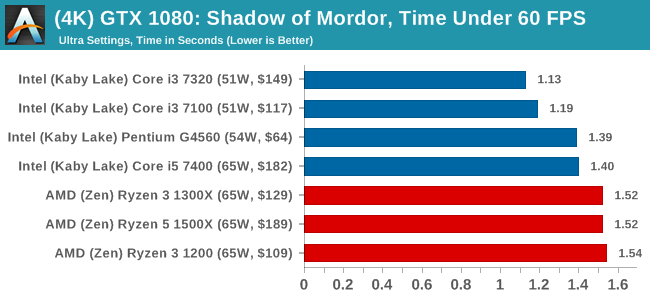
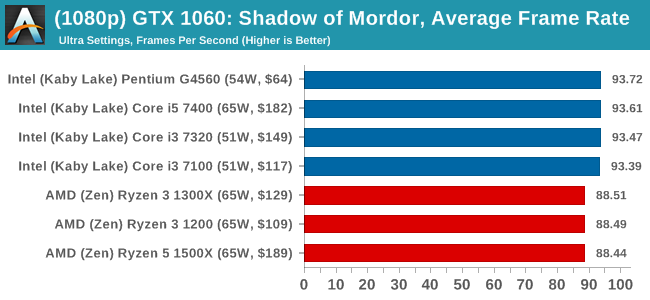
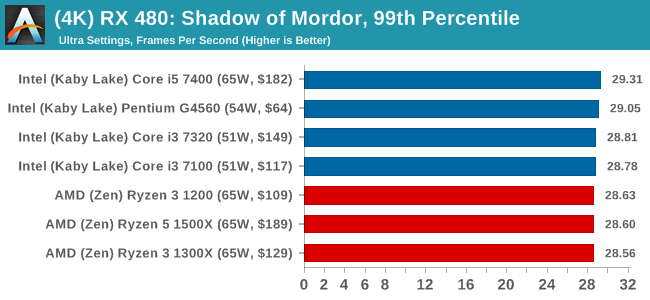
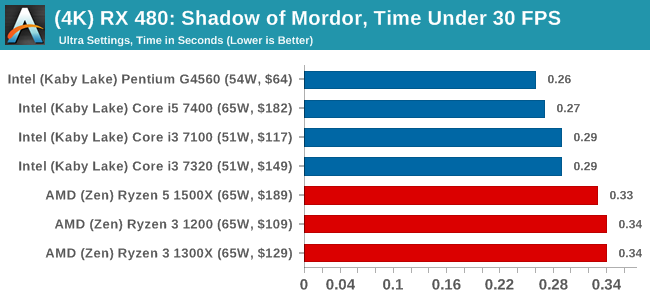
We run the benchmark at 1080p and a native 4K, using our 4K monitors, at the Ultra preset. Results are averaged across four runs and we report the average frame rate, 99th percentile frame rate, and time under analysis.
For all our results, we show the average frame rate at 1080p first. Mouse over the other graphs underneath to see 99th percentile frame rates and 'Time Under' graphs, as well as results for other resolutions. All of our benchmark results can also be found in our benchmark engine, Bench.
MSI GTX 1080 Gaming 8G Performance
1080p
4K
ASUS GTX 1060 Strix 6GB Performance
1080p
4K
Sapphire R9 Fury 4GB Performance
1080p
4K
Sapphire RX 480 8GB Performance

1080p
4K
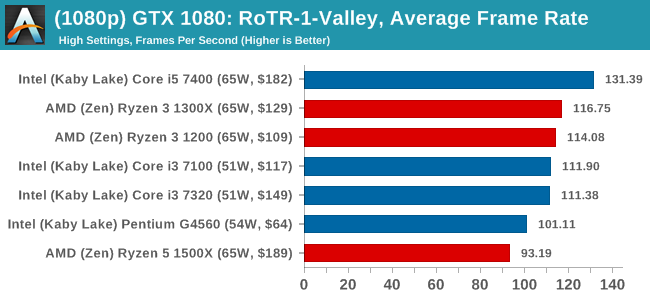
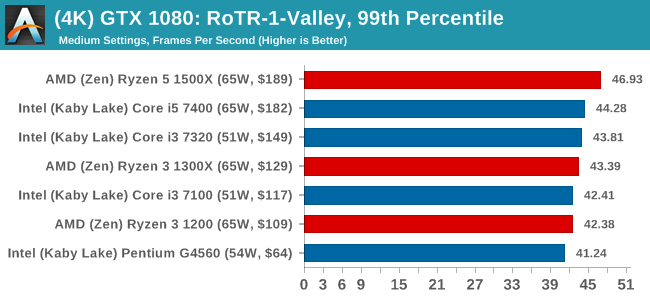
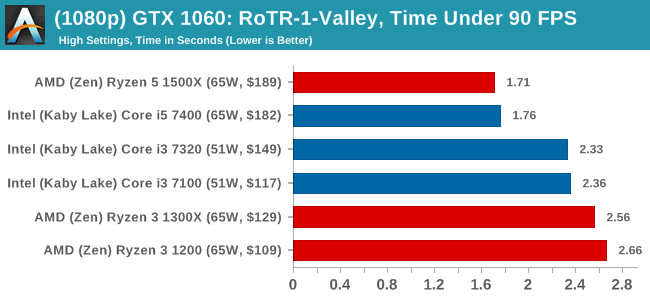
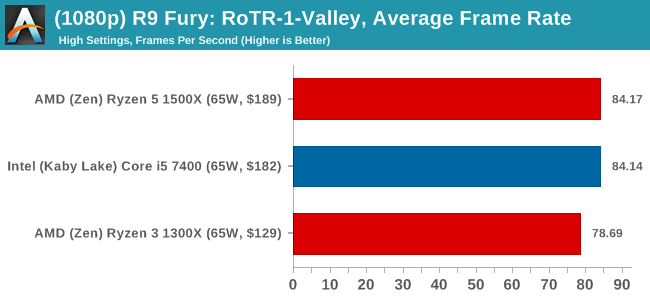
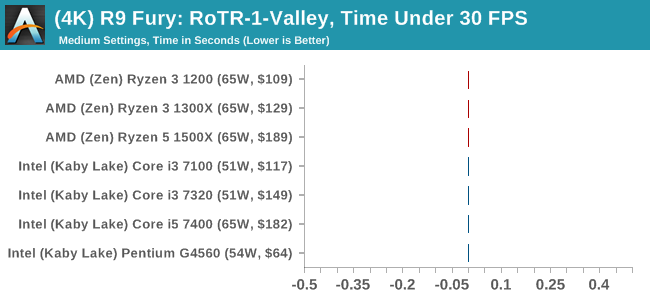
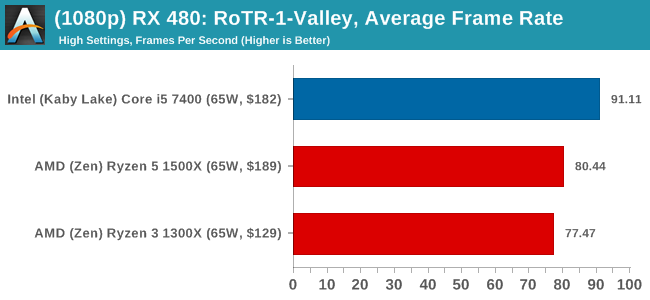
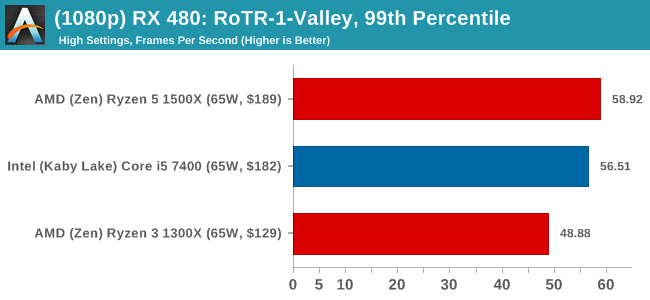
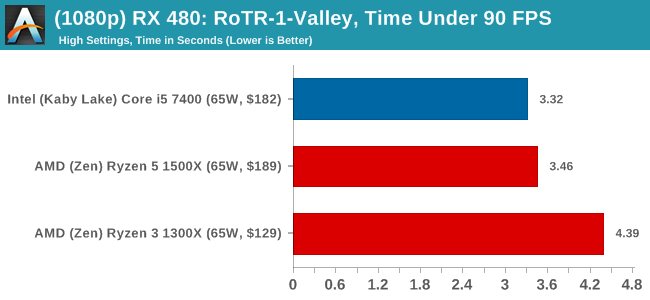
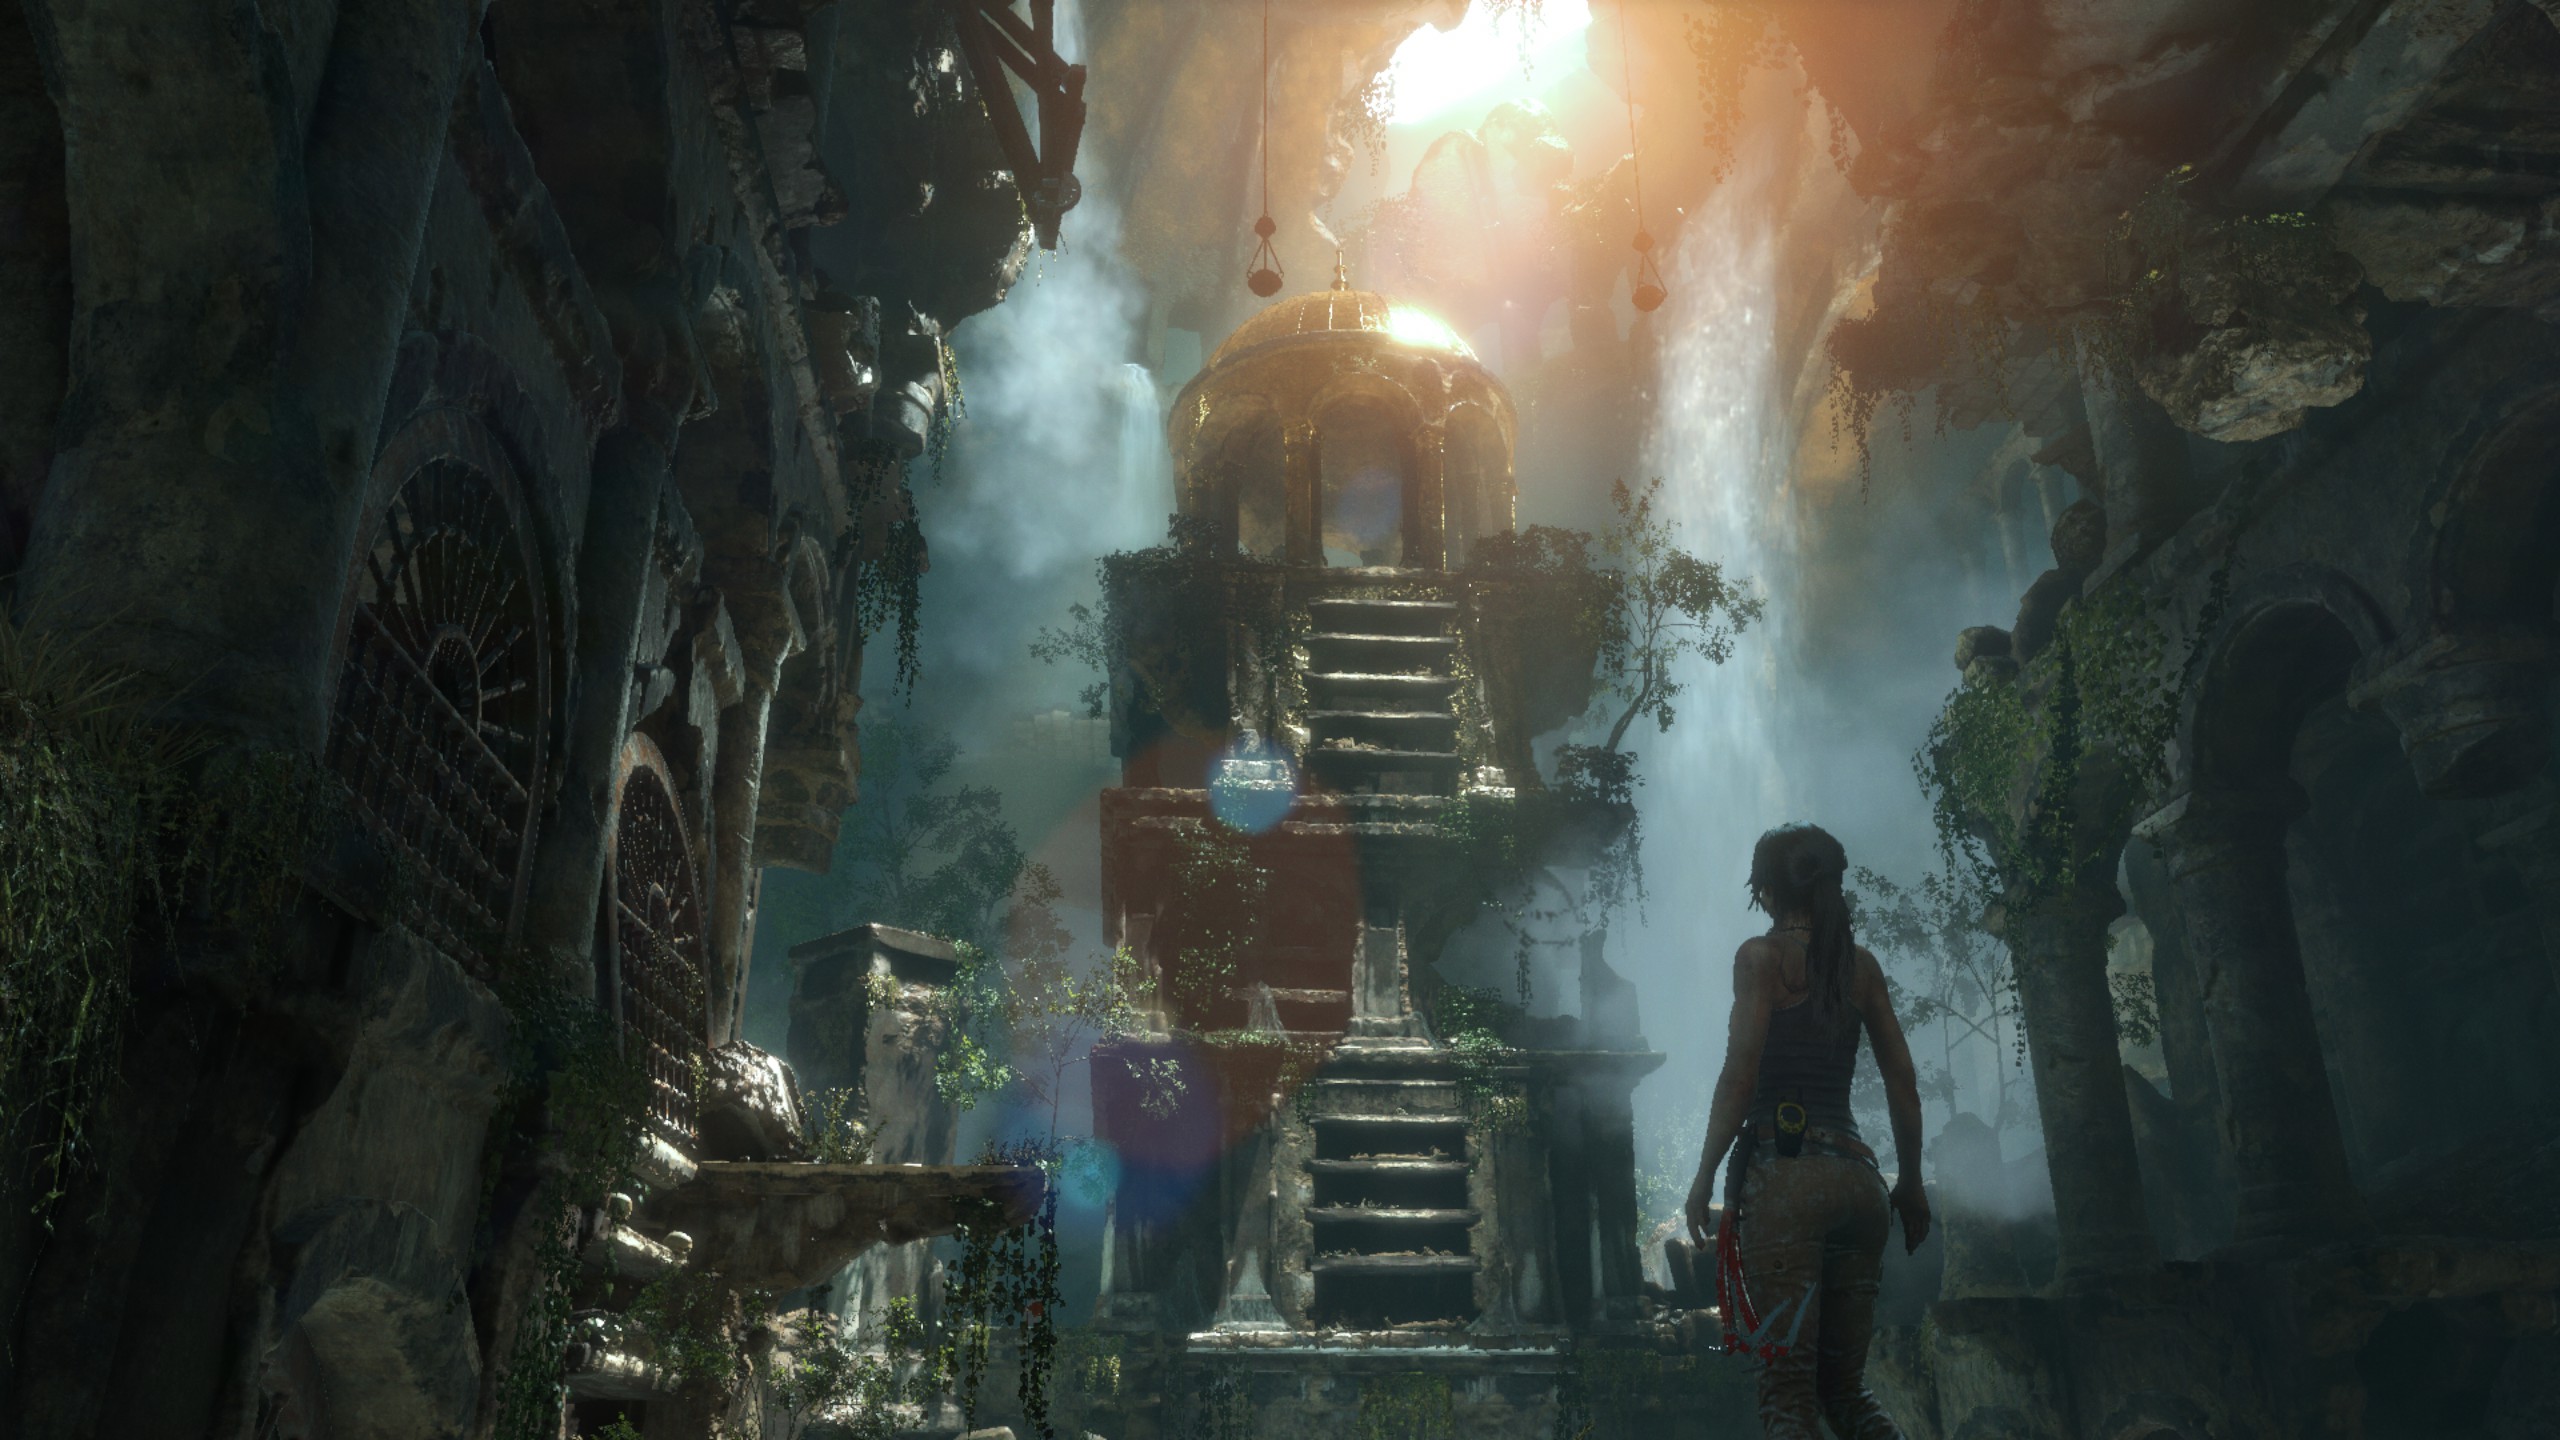
Rise of the Tomb Raider
One of the newest games in the gaming benchmark suite is Rise of the Tomb Raider (RoTR), developed by Crystal Dynamics, and the sequel to the popular Tomb Raider which was loved for its automated benchmark mode. But don’t let that fool you: the benchmark mode in RoTR is very much different this time around.
Visually, the previous Tomb Raider pushed realism to the limits with features such as TressFX, and the new RoTR goes one stage further when it comes to graphics fidelity. This leads to an interesting set of requirements in hardware: some sections of the game are typically GPU limited, whereas others with a lot of long-range physics can be CPU limited, depending on how the driver can translate the DirectX 12 workload.

Where the old game had one benchmark scene, the new game has three different scenes with different requirements: Geothermal Valley (1-Valley), Prophet’s Tomb (2-Prophet) and Spine of the Mountain (3-Mountain) - and we test all three. These are three scenes designed to be taken from the game, but it has been noted that scenes like 2-Prophet shown in the benchmark can be the most CPU limited elements of that entire level, and the scene shown is only a small portion of that level. Because of this, we report the results for each scene on each graphics card separately.

Graphics options for RoTR are similar to other games in this type, offering some presets or allowing the user to configure texture quality, anisotropic filter levels, shadow quality, soft shadows, occlusion, depth of field, tessellation, reflections, foliage, bloom, and features like PureHair which updates on TressFX in the previous game.
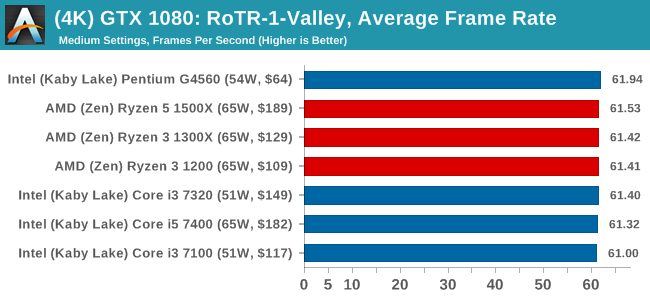
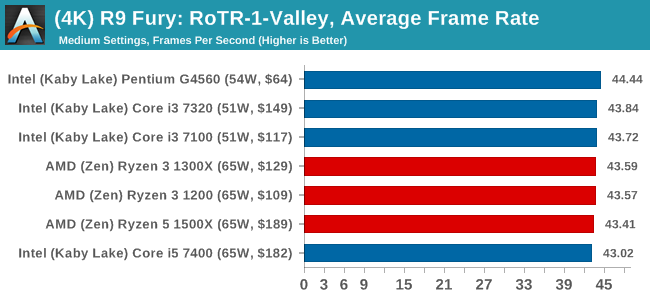
Again, we test at 1920x1080 and 4K using our native 4K displays. At 1080p we run the High preset, while at 4K we use the Medium preset which still takes a sizable hit in frame rate.
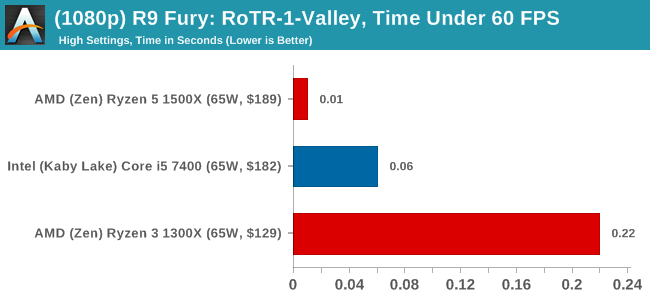
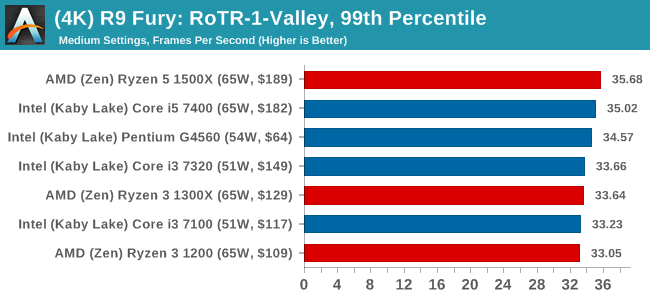
It is worth noting that RoTR is a little different to our other benchmarks in that it keeps its graphics settings in the registry rather than a standard ini file, and unlike the previous TR game the benchmark cannot be called from the command-line. Nonetheless we scripted around these issues to automate the benchmark four times and parse the results. From the frame time data, we report the averages, 99th percentiles, and our time under analysis.
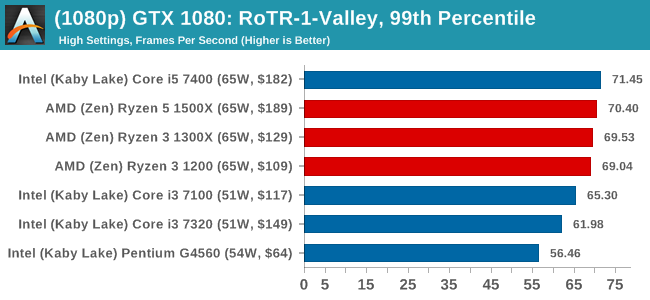
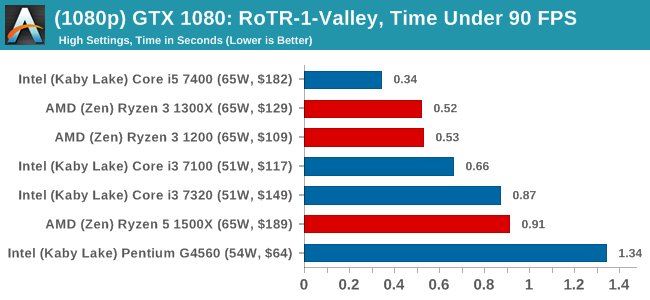
For all our results, we show the average frame rate at 1080p first. Mouse over the other graphs underneath to see 99th percentile frame rates and 'Time Under' graphs, as well as results for other resolutions. All of our benchmark results can also be found in our benchmark engine, Bench.
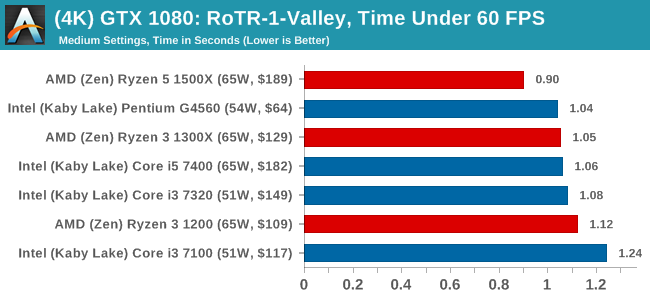
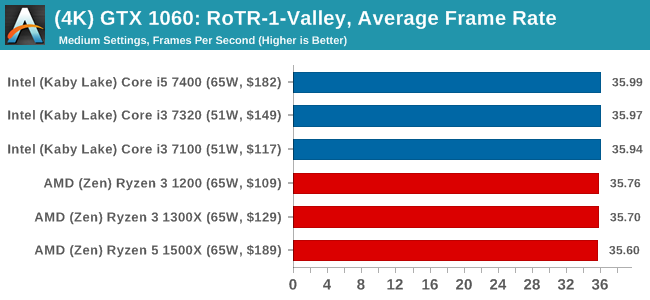
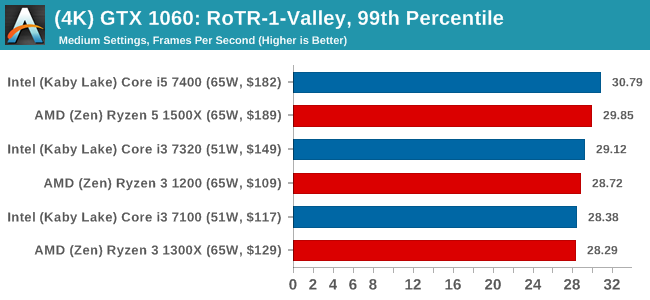
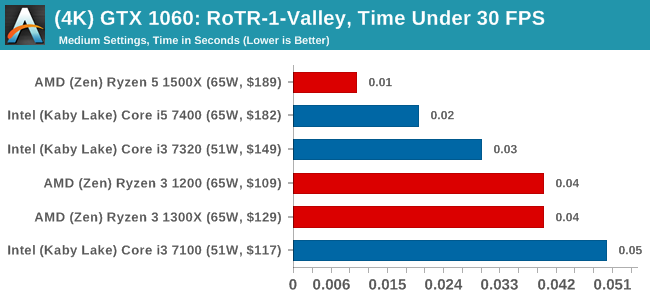
#1 Geothermal Valley

MSI GTX 1080 Gaming 8G Performance
1080p
4K
ASUS GTX 1060 Strix 6GB Performance
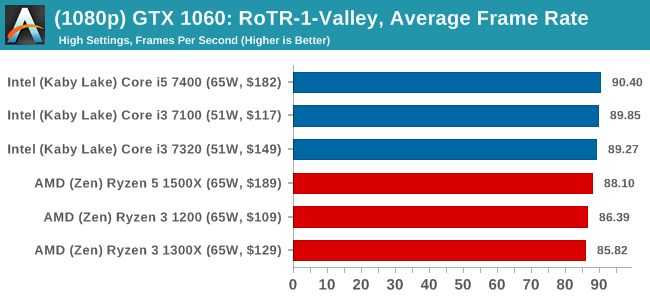
1080p
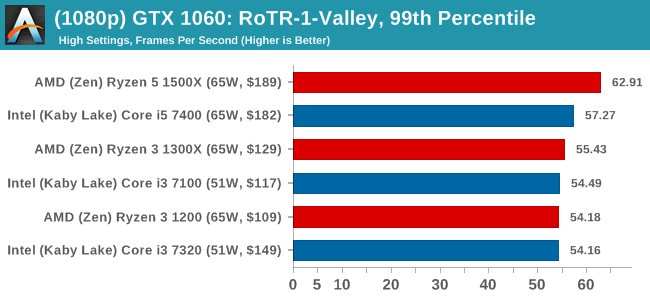
4K
Sapphire R9 Fury 4GB Performance
1080p

4K
Sapphire RX 480 8GB Performance
1080p
4K

Geothermal Valley had some issues in our benchmark test suite, where the 1080p benchmark wouldn't output frame time data for the first section. The issue has been debugged from our end and future reviews should contain all the data.
#2 Prophet's Tomb
MSI GTX 1080 Gaming 8G Performance
1080p
4K
ASUS GTX 1060 Strix 6GB Performance
1080p
4K
Sapphire R9 Fury 4GB Performance
1080p
4K
Sapphire RX 480 8GB Performance
1080p
4K
#3 Spine of the Mountain
MSI GTX 1080 Gaming 8G Performance
1080p
4K
ASUS GTX 1060 Strix 6GB Performance
1080p
4K
Sapphire R9 Fury 4GB Performance
1080p
4K
Sapphire RX 480 8GB Performance

1080p
4K
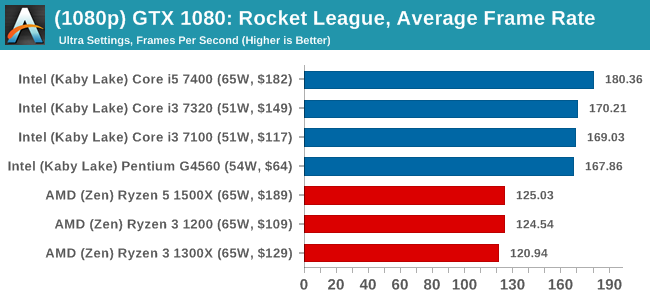
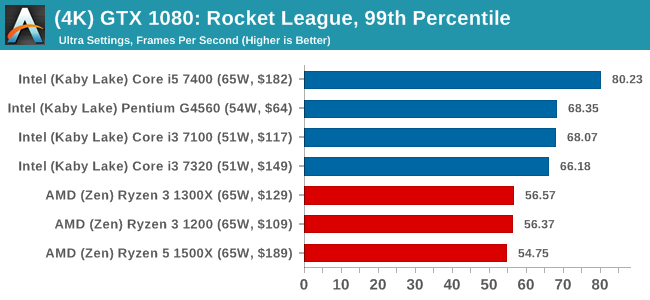
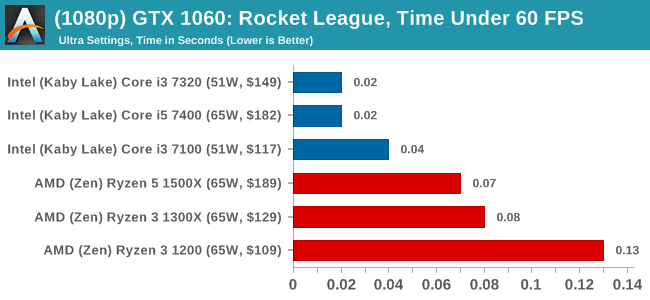
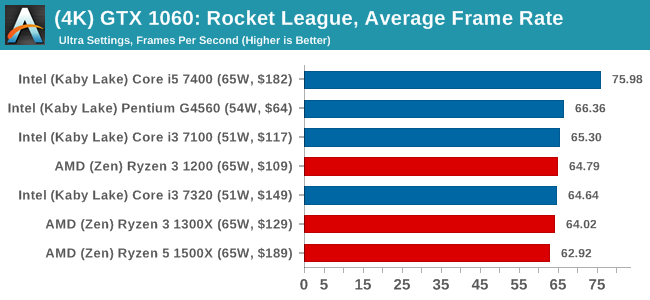
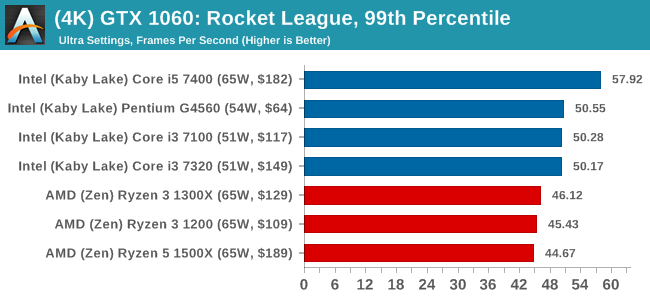
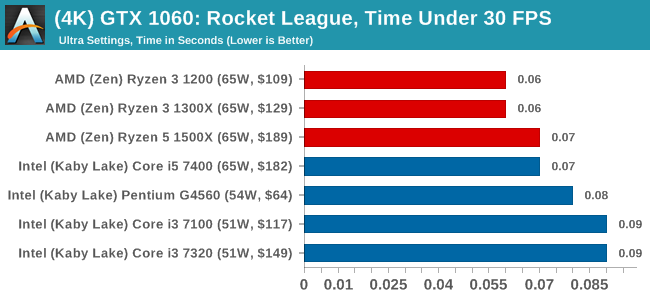
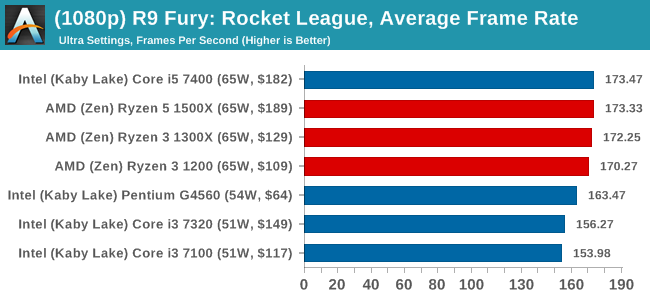
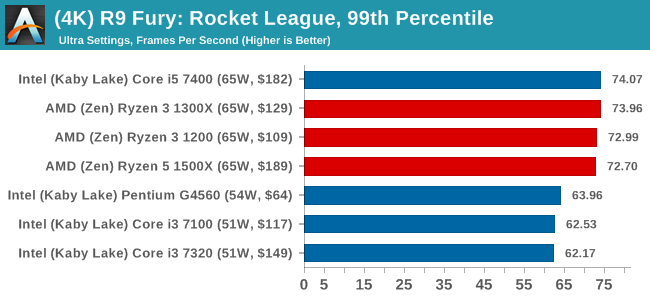
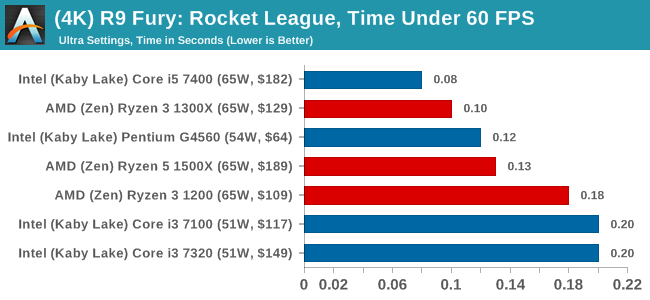
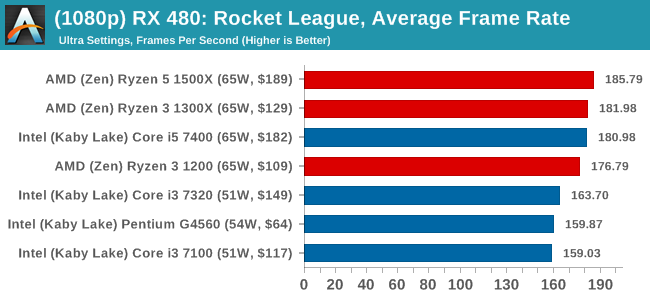
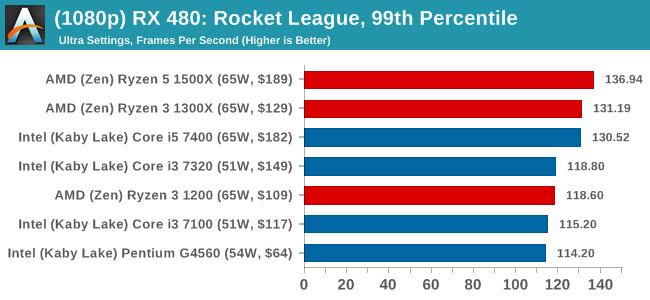
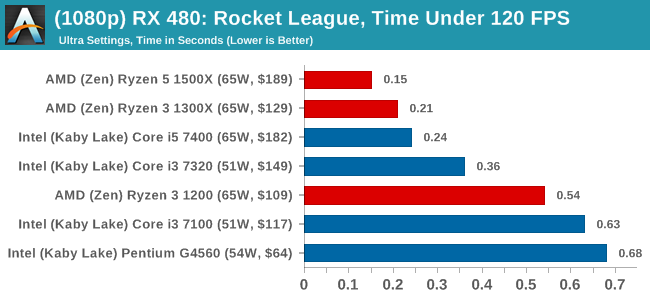
Rocket League
Hilariously simple pick-up-and-play games are great fun. I'm a massive fan of the Katamari franchise for that reason — passing start on a controller and rolling around, picking up things to get bigger, is extremely simple. Until we get a PC version of Katamari that I can benchmark, we'll focus on Rocket League.
Rocket League combines the elements of pick-up-and-play, allowing users to jump into a game with other people (or bots) to play football with cars with zero rules. The title is built on Unreal Engine 3, which is somewhat old at this point, but it allows users to run the game on super-low-end systems while still taxing the big ones. Since the release in 2015, it has sold over 5 million copies and seems to be a fixture at LANs and game shows. Users who train get very serious, playing in teams and leagues with very few settings to configure, and everyone is on the same level. Rocket League is quickly becoming one of the favored titles for e-sports tournaments, especially when e-sports contests can be viewed directly from the game interface.

Based on these factors, plus the fact that it is an extremely fun title to load and play, we set out to find the best way to benchmark it. Unfortunately for the most part automatic benchmark modes for games are few and far between. Partly because of this, but also on the basis that it is built on the Unreal 3 engine, Rocket League does not have a benchmark mode. In this case, we have to develop a consistent run and record the frame rate.
Read our initial analysis on our Rocket League benchmark on low-end graphics here.
With Rocket League, there is no benchmark mode, so we have to perform a series of automated actions, similar to a racing game having a fixed number of laps. We take the following approach: Using Fraps to record the time taken to show each frame (and the overall frame rates), we use an automation tool to set up a consistent 4v4 bot match on easy, with the system applying a series of inputs throughout the run, such as switching camera angles and driving around.
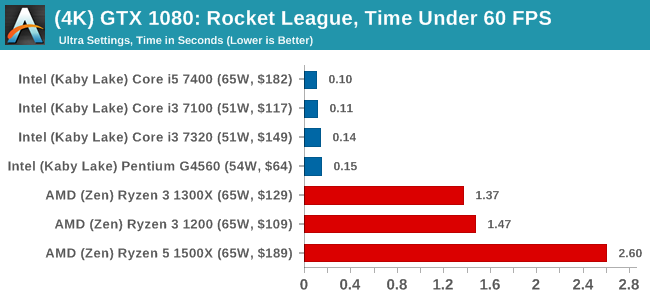
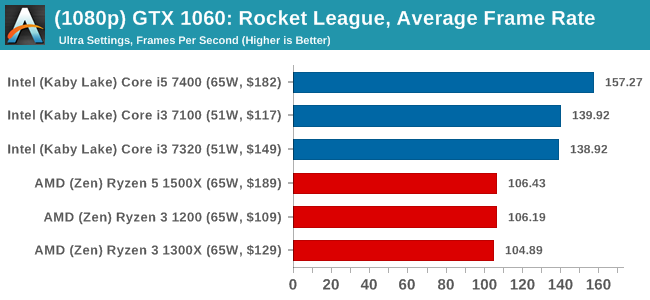
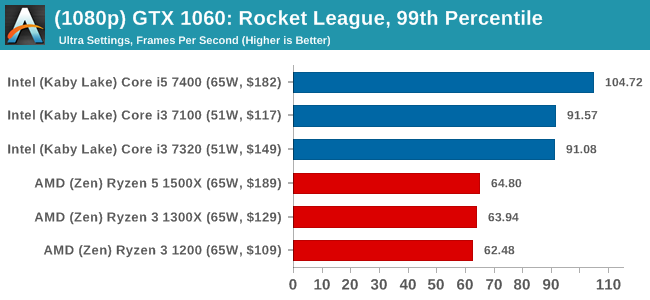
It turns out that this method is nicely indicative of a real bot match, driving up walls, boosting and even putting in the odd assist, save and/or goal, as weird as that sounds for an automated set of commands. To maintain consistency, the commands we apply are not random but time-fixed, and we also keep the map the same (Aquadome, known to be a tough map for GPUs due to water/transparency) and the car customization constant. We start recording just after a match starts, and record for 4 minutes of game time (think 5 laps of a DIRT: Rally benchmark), with average frame rates, 99th percentile and frame times all provided.
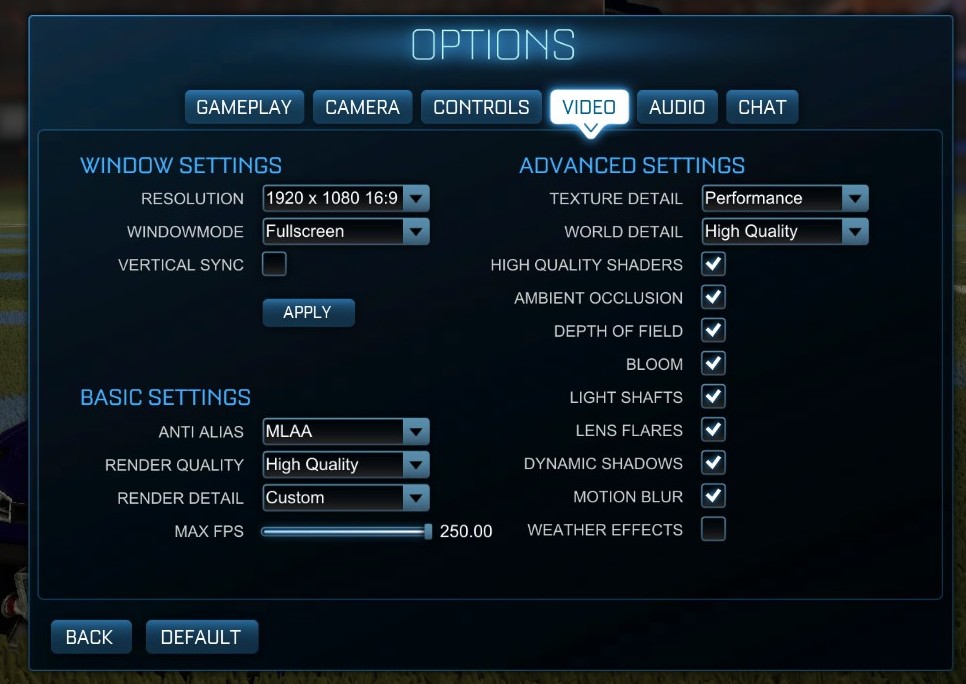
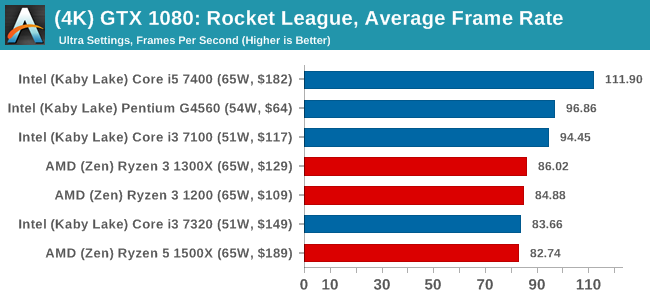
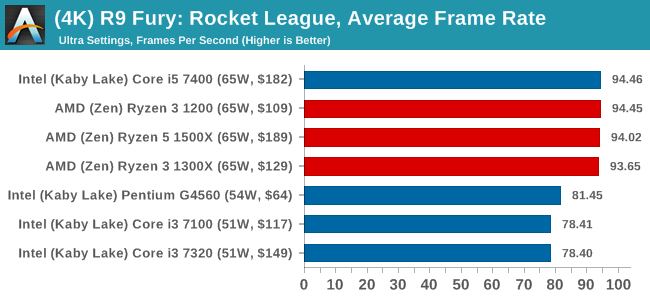
The graphics settings for Rocket League come in four broad, generic settings: Low, Medium, High and High FXAA. There are advanced settings in place for shadows and details; however, for these tests, we keep to the generic settings. For both 1920x1080 and 4K resolutions, we test at the High preset with an unlimited frame cap.
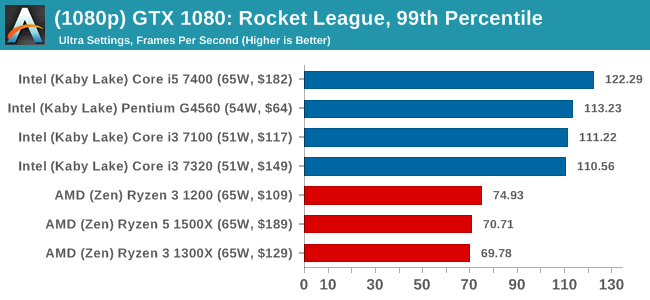
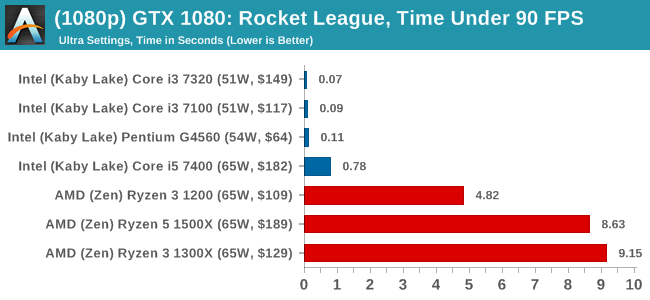
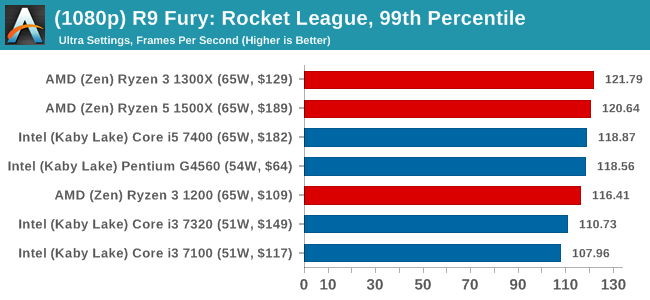
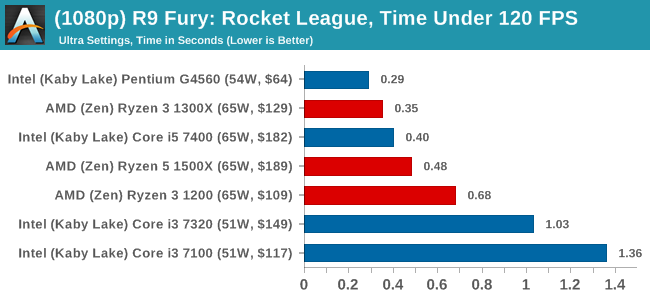
For all our results, we show the average frame rate at 1080p first. Mouse over the other graphs underneath to see 99th percentile frame rates and 'Time Under' graphs, as well as results for other resolutions. All of our benchmark results can also be found in our benchmark engine, Bench.
MSI GTX 1080 Gaming 8G Performance
1080p
4K
ASUS GTX 1060 Strix 6GB Performance
1080p
4K
Sapphire R9 Fury 4GB Performance
1080p
4K
Sapphire RX 480 8GB Performance
1080p
4K
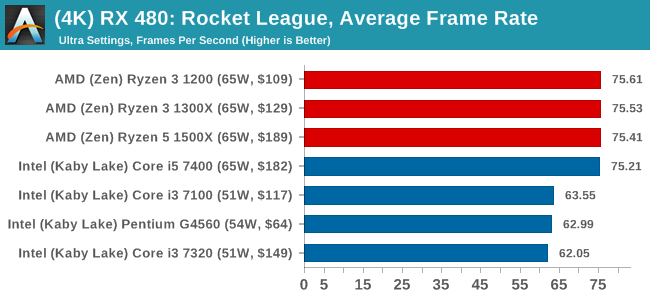
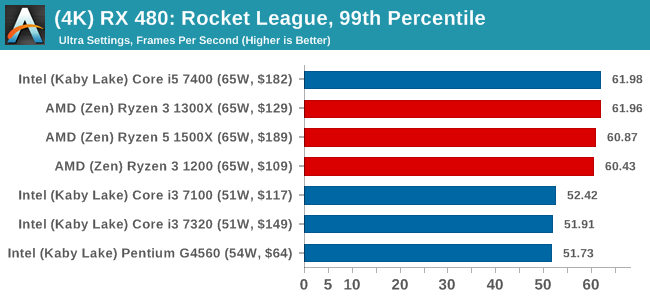
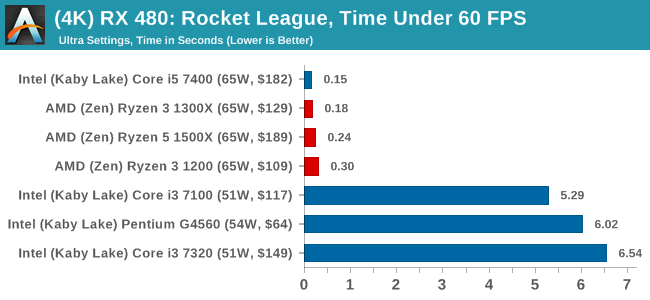
Rocket League Notes on GTX
The map we use in our testing, Aquadome, is known to be strenuous on a system, hence we see frame rates lower than what people expect for Rocket League - we're trying to cover the worst case scenario. But the results also show how AMD CPUs and NVIDIA GPUs do not seem to be playing ball with each other, which we've been told is likely related to drivers.
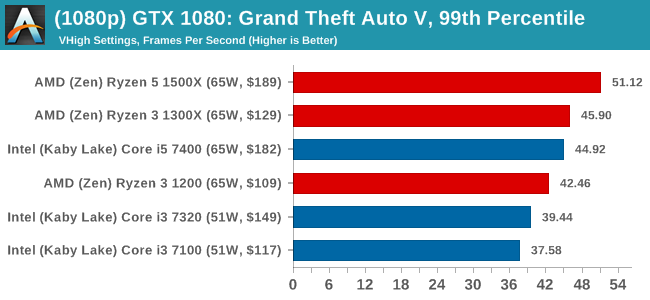
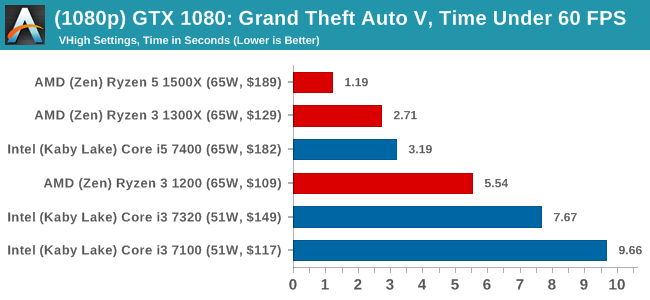
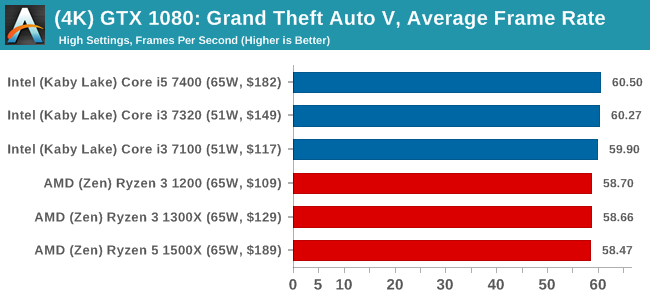
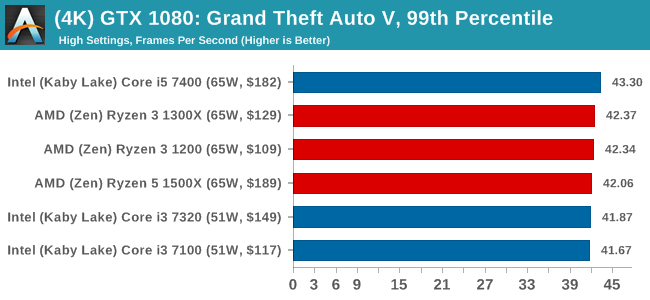
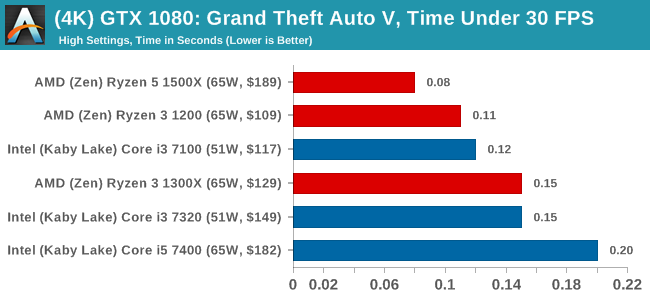
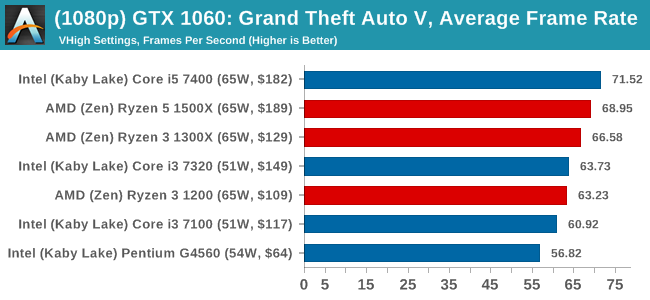
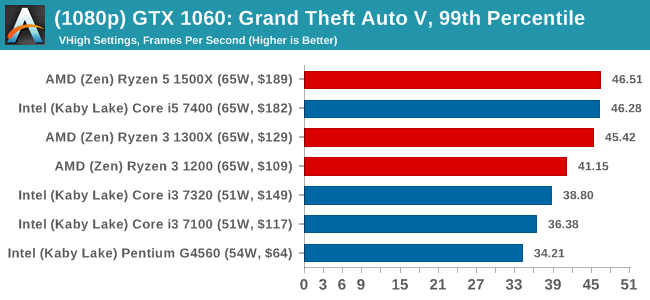
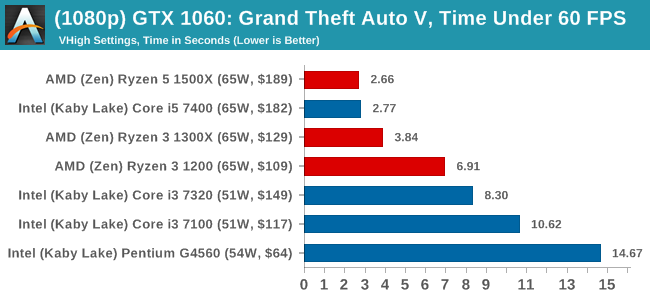
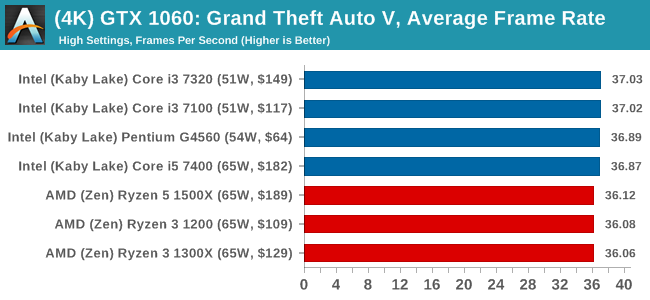
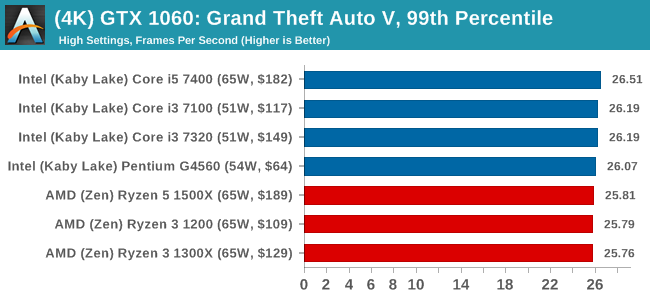
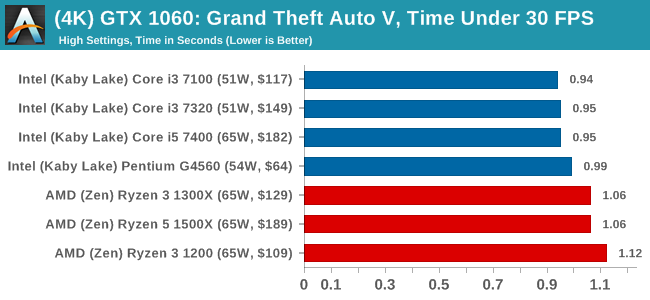
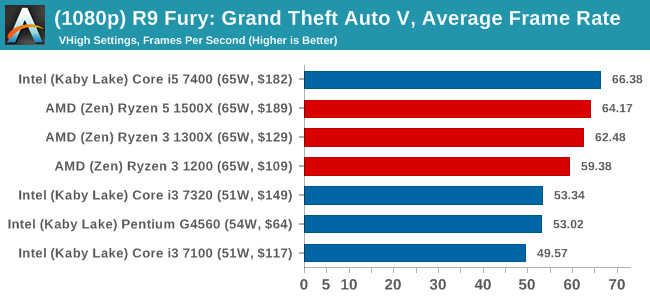
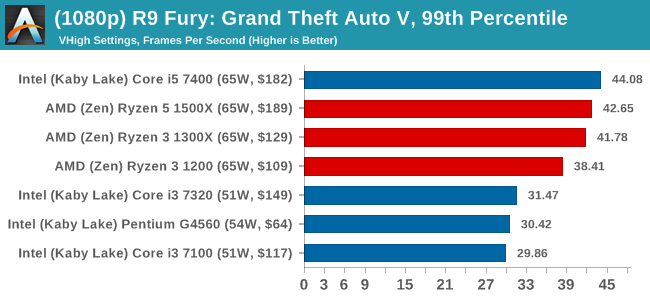
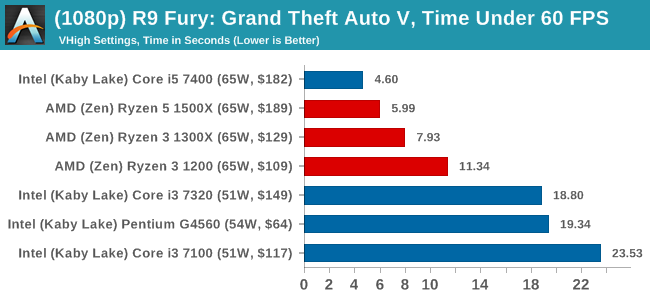
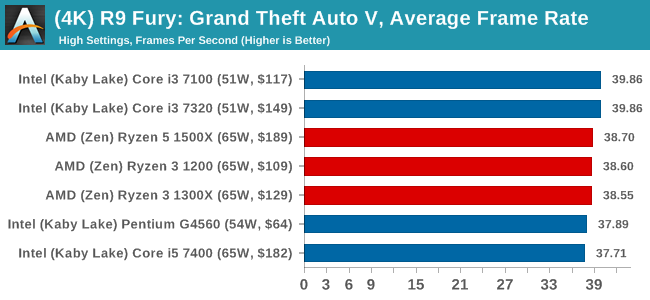
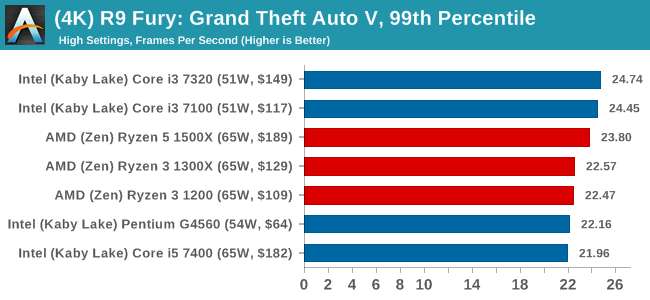
Grand Theft Auto
The highly anticipated iteration of the Grand Theft Auto franchise hit the shelves on April 14th 2015, with both AMD and NVIDIA in tow to help optimize the title. GTA doesn’t provide graphical presets, but opens up the options to users and extends the boundaries by pushing even the hardest systems to the limit using Rockstar’s Advanced Game Engine under DirectX 11. Whether the user is flying high in the mountains with long draw distances or dealing with assorted trash in the city, when cranked up to maximum it creates stunning visuals but hard work for both the CPU and the GPU.
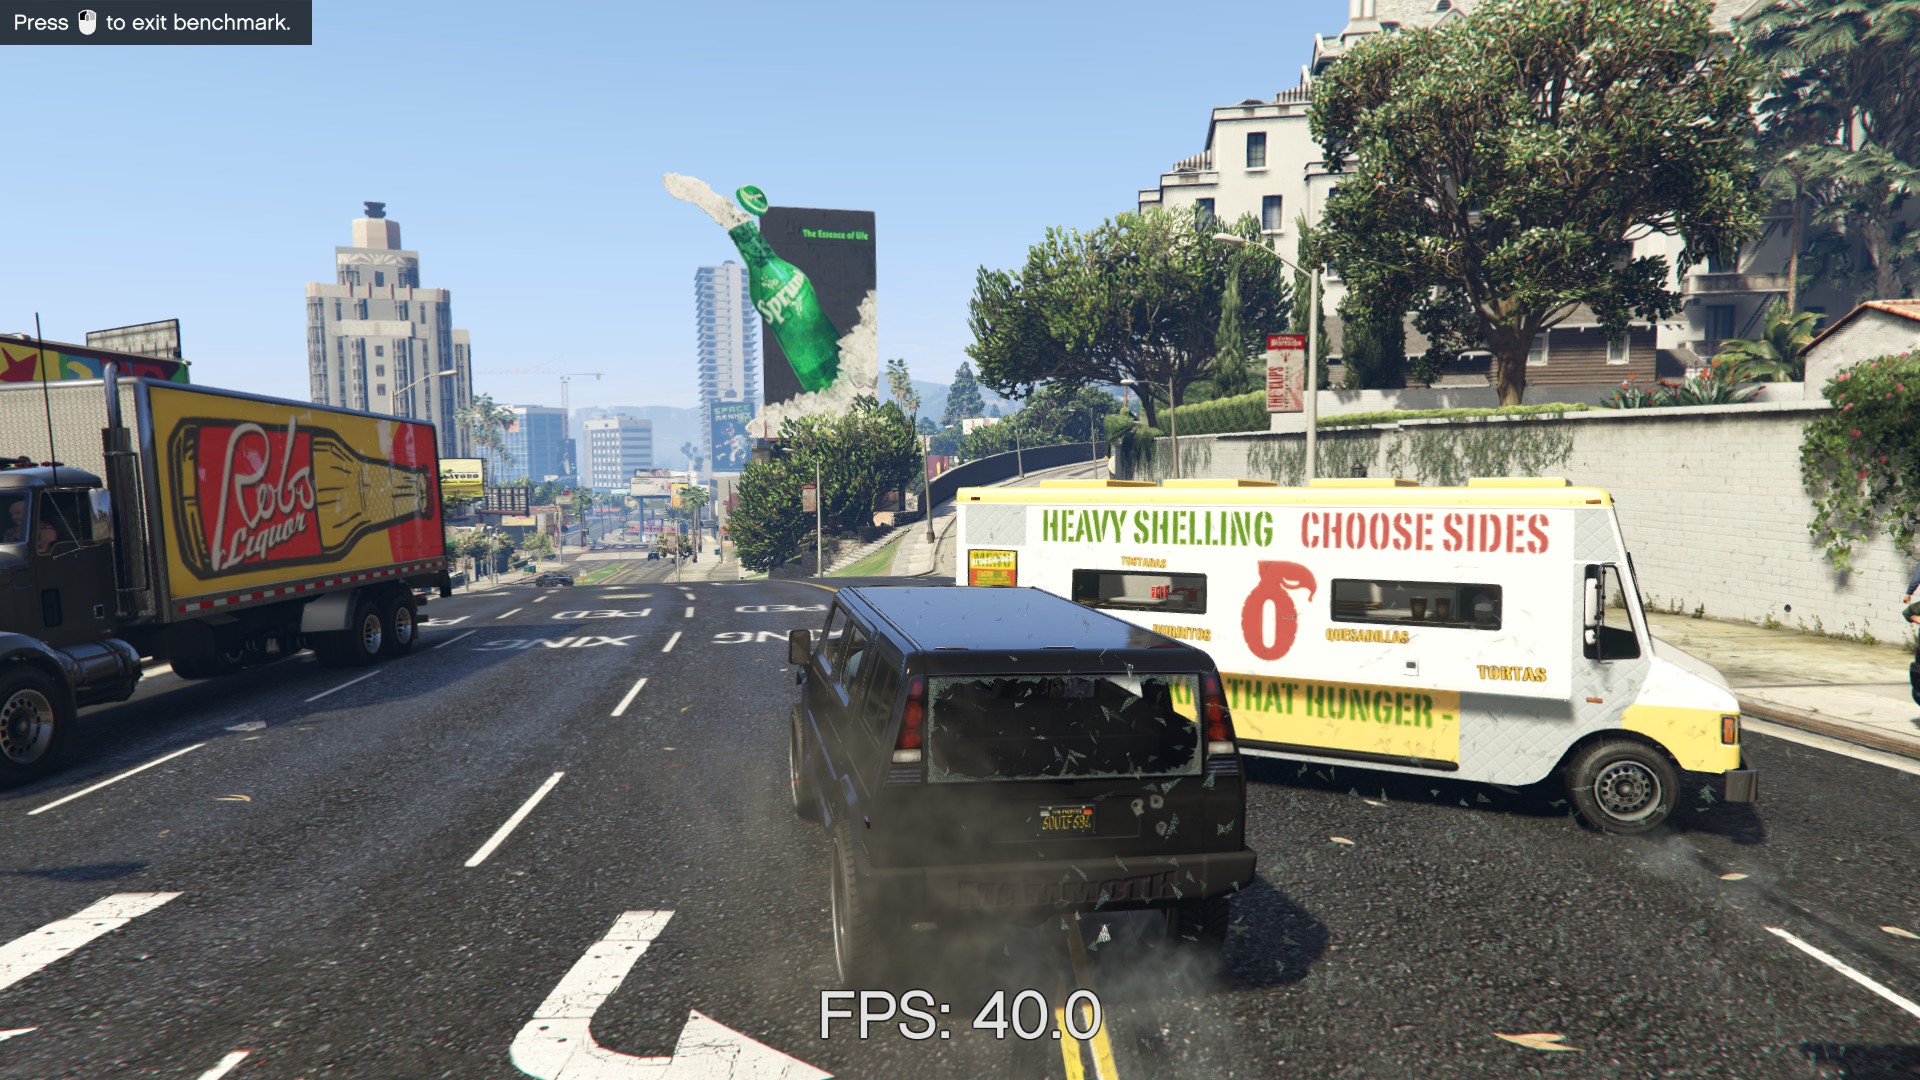
For our test we have scripted a version of the in-game benchmark. The in-game benchmark consists of five scenarios: four short panning shots with varying lighting and weather effects, and a fifth action sequence that lasts around 90 seconds. We use only the final part of the benchmark, which combines a flight scene in a jet followed by an inner city drive-by through several intersections followed by ramming a tanker that explodes, causing other cars to explode as well. This is a mix of distance rendering followed by a detailed near-rendering action sequence, and the title thankfully spits out frame time data.
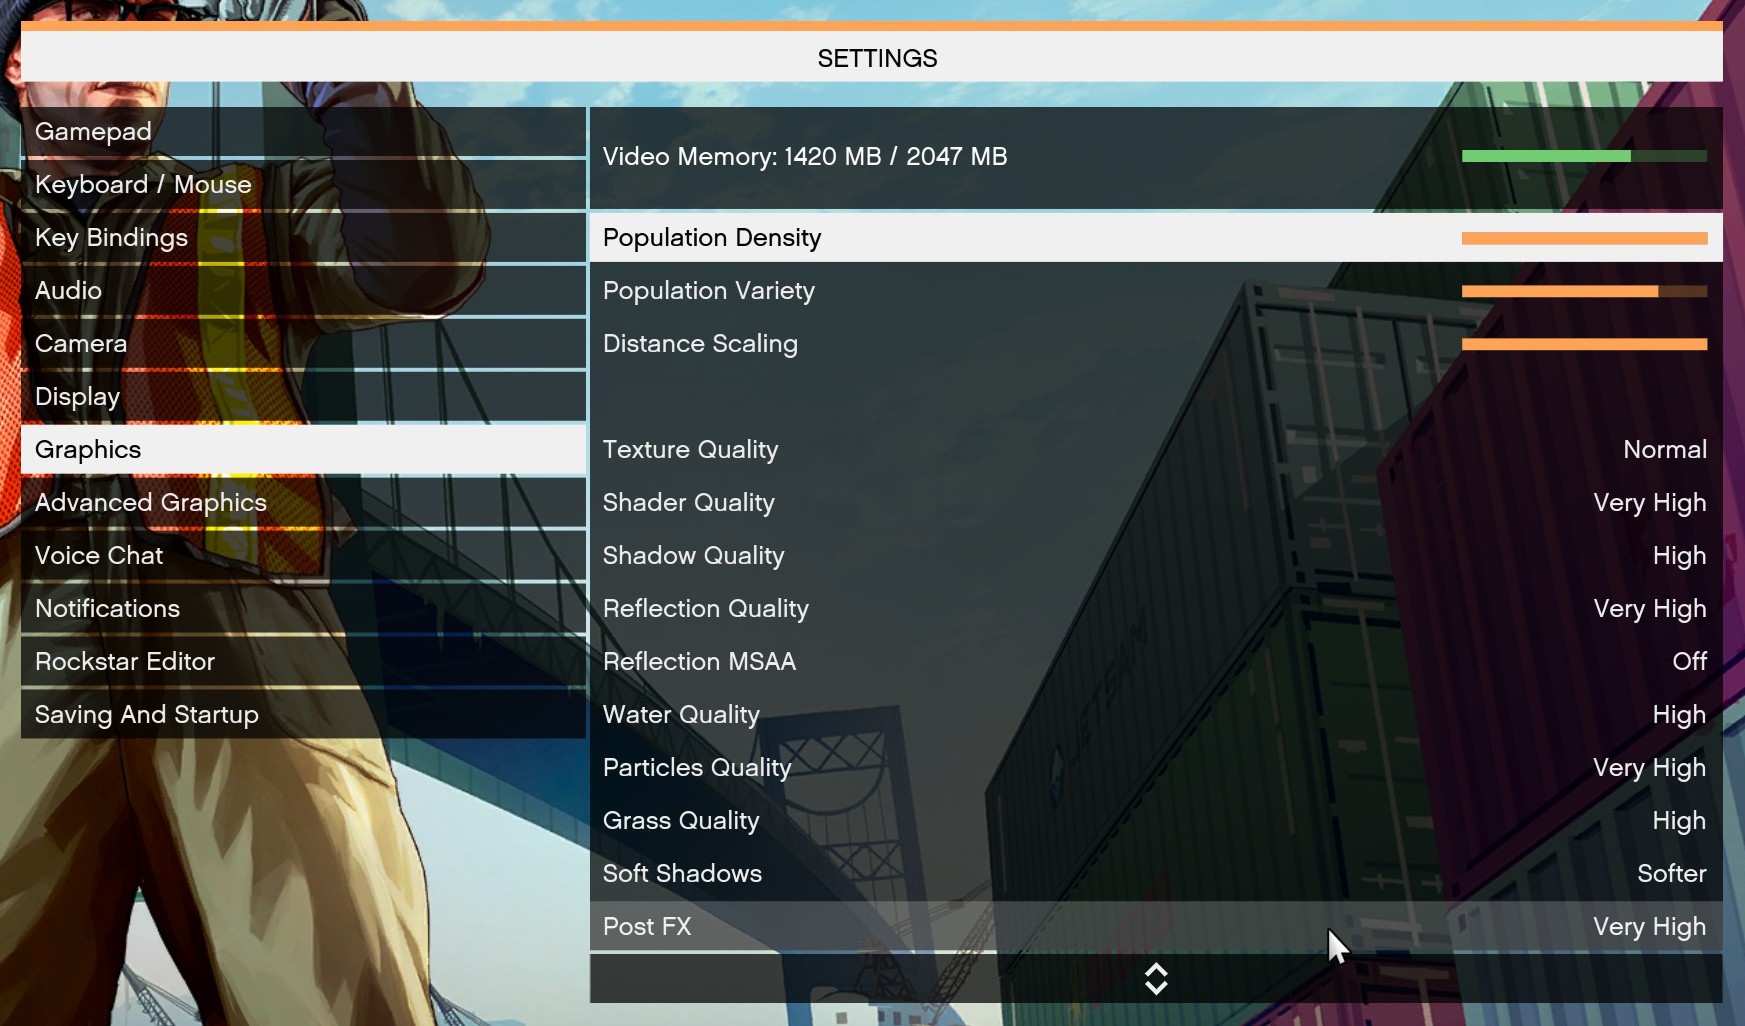
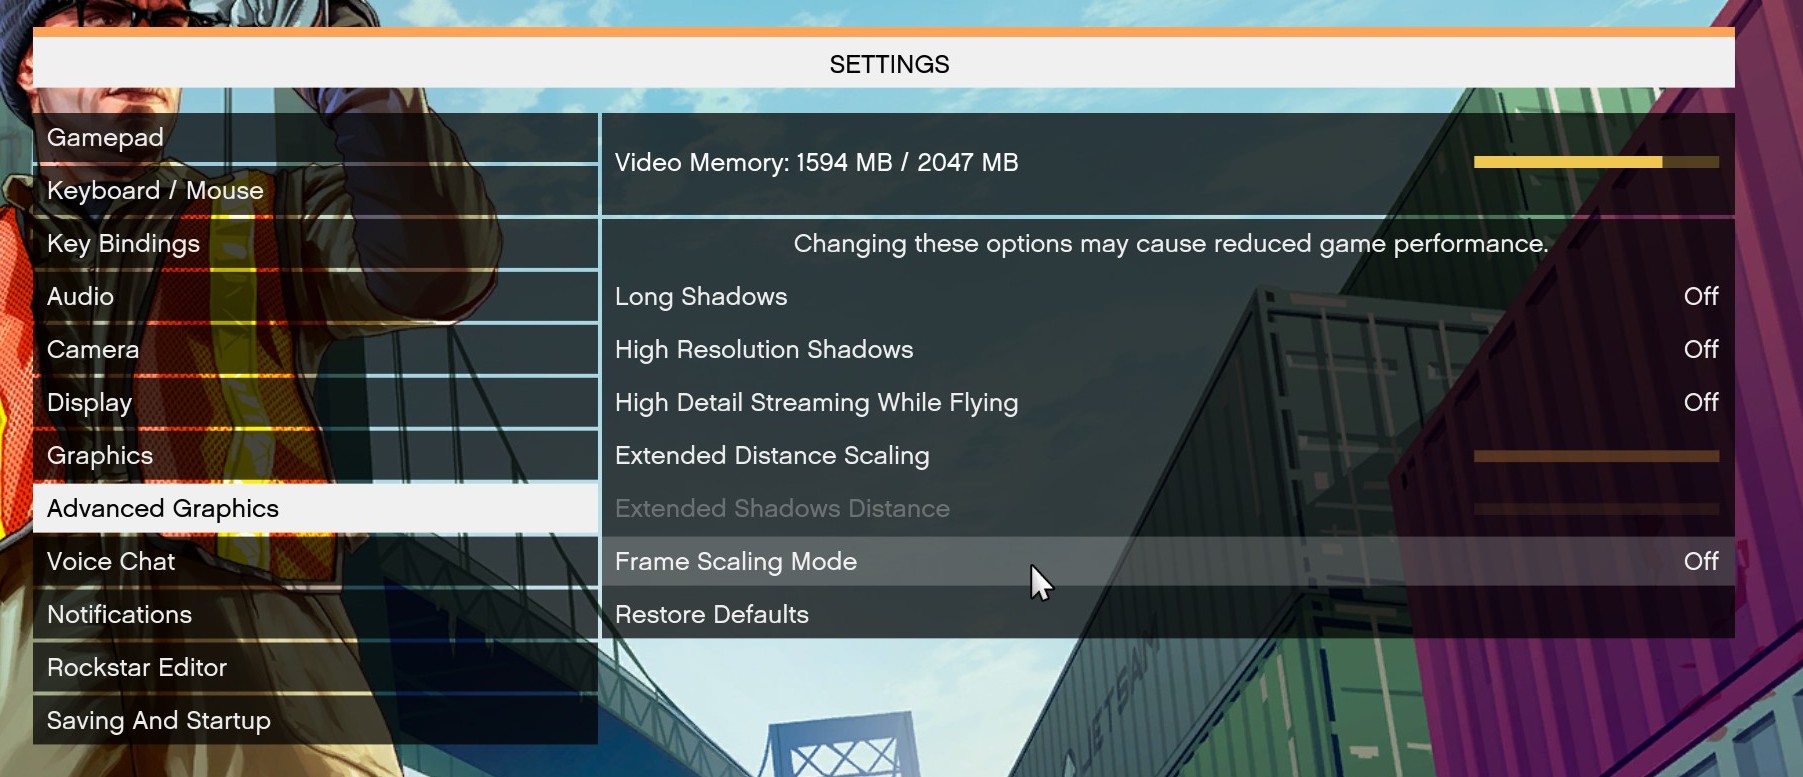
There are no presets for the graphics options on GTA, allowing the user to adjust options such as population density and distance scaling on sliders, but others such as texture/shadow/shader/water quality from Low to Very High. Other options include MSAA, soft shadows, post effects, shadow resolution and extended draw distance options. There is a handy option at the top which shows how much video memory the options are expected to consume, with obvious repercussions if a user requests more video memory than is present on the card (although there’s no obvious indication if you have a low end GPU with lots of GPU memory, like an R7 240 4GB).
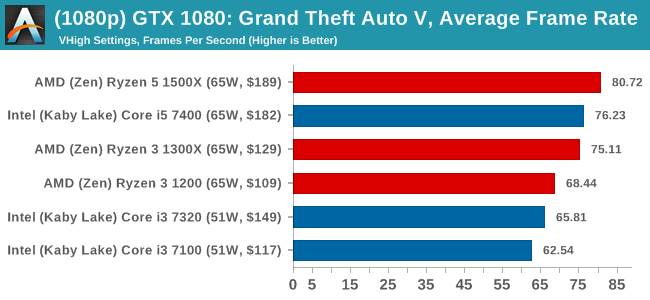
To that end, we run the benchmark at 1920x1080 using an average of Very High on the settings, and also at 4K using High on most of them. We take the average results of four runs, reporting frame rate averages, 99th percentiles, and our time under analysis.
For all our results, we show the average frame rate at 1080p first. Mouse over the other graphs underneath to see 99th percentile frame rates and 'Time Under' graphs, as well as results for other resolutions. All of our benchmark results can also be found in our benchmark engine, Bench.
MSI GTX 1080 Gaming 8G Performance
1080p
4K
ASUS GTX 1060 Strix 6GB Performance
1080p
4K
Sapphire R9 Fury 4GB Performance
1080p
4K
Sapphire RX 480 8GB Performance

1080p
4K
Power Consumption
For our power consumption readings, we run a Prime 95 load and slowly ramp up the number of threads in play, taking power data from the internal CPU registers that report for when turbo modes or thermal modes should activate. Depending on the CPU access, we can get data that varies from the full package down to individual cores, uncore, integrated graphics and DRAM controllers.
For the Ryzen CPUs, the API pulls out the total package power consumption first.
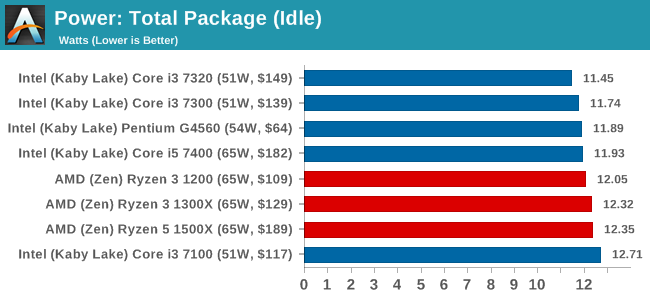
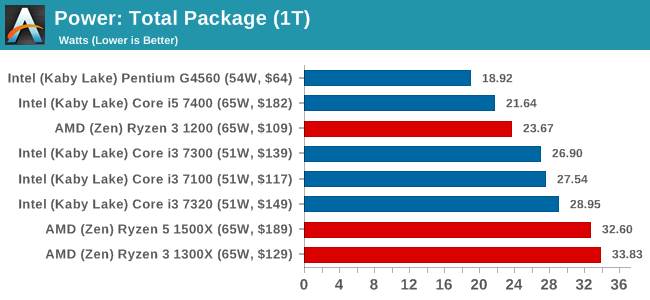
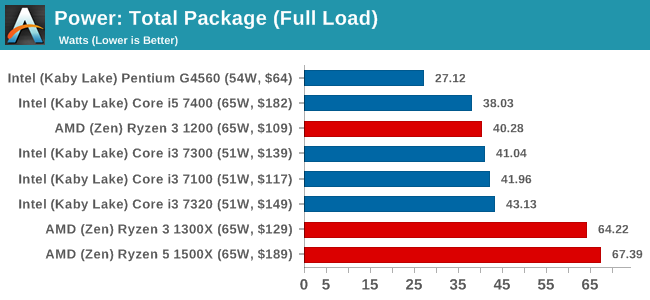
At idle, all the CPUs are pretty much equivalent. The cores are fully idle here, leaving the rest of the chip active enough for tick-over. As we ramp up the load, the higher-frequency Ryzen CPUs move towards their 65W TDP, with the Ryzen 3 1300X almost being spot on at 64.2W. The Intel CPUs are clocked higher, but only have two cores to contend with. The Ryzen 3 1200 is clocked lower than the Ryzen 3 1300X, hitting a better efficiency point in the Zen design. This ultimately bodes well for upcoming quad-core SKUs in laptops.
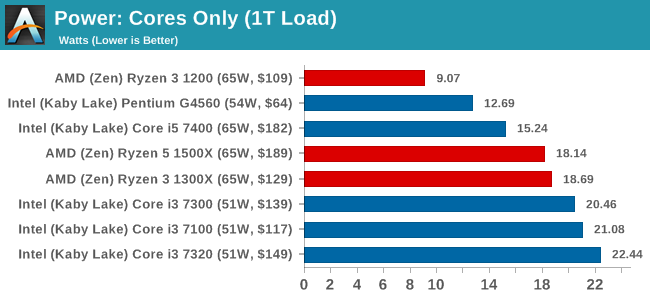
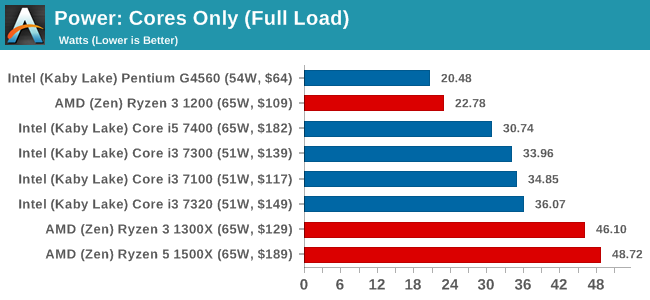
One of the odd things about the power consumption of the Ryzen 3 CPUs is the difference between how much power the cores internally measure compared to the full power consumption of the package measured as a whole, including the Infinity Fabric, DRAM controllers, IO and such. For the Ryzen 3 1200 for example, at full load the package has a power consumption of 40.43 W total, but the cores only count for 23.05W, leaving 17.38W on the table for the non-core elements in the chip. If we compare that to the Ryzen 5 1500X, we have 68.79W for the package and 49.69W for the cores, a 19.1W difference. For the Ryzen 7 1700X, it becomes 81.51W for the package and 62.10W for the cores, a 19.4W difference.
On the high-end chips, the difference is a smaller portion of the full power consumption, but on the Ryzen 3 processors the cores are only 57% of the power consumption, leaving 43% for the rest of the chip. A lot of this power could be the inter-CCX infinity fabric path, which means that packages like EPYC are giving away a lot of power to IF. If it is more other features, it could spell a number of problems for upcoming mobile chips, limiting the lower bounds of the power consumption. Naturally, I actually want to get my hands on to an EPYC processor in my own lab to see if we can pin down what is happening here.
Conclusion
For as much hype and excitement that has been generated around Zen and the Ryzen products so far, with everything focused on the high-end when we hit the lower elements of the stack and the volume parts, not much ‘excitement’ is to be had. We’ve already gone through the new fancy microarchitecture and the platform, and what matters at this end of the spectrum is a pure performance per dollar metric. So far the Ryzen 7 parts have certainly hit that goal, especially when originally compared to Broadwell-E when the Ryzen 7 parts per launched. For the Ryzen 3, the direct competition is Kaby Lake, and CPUs with a much higher IPC. But where Intel has two cores, AMD has four.
Diving straight into the graphs, the Single Thread performance graph is as follows. All data is shown relative to the performance of the Ryzen 3 1300X.
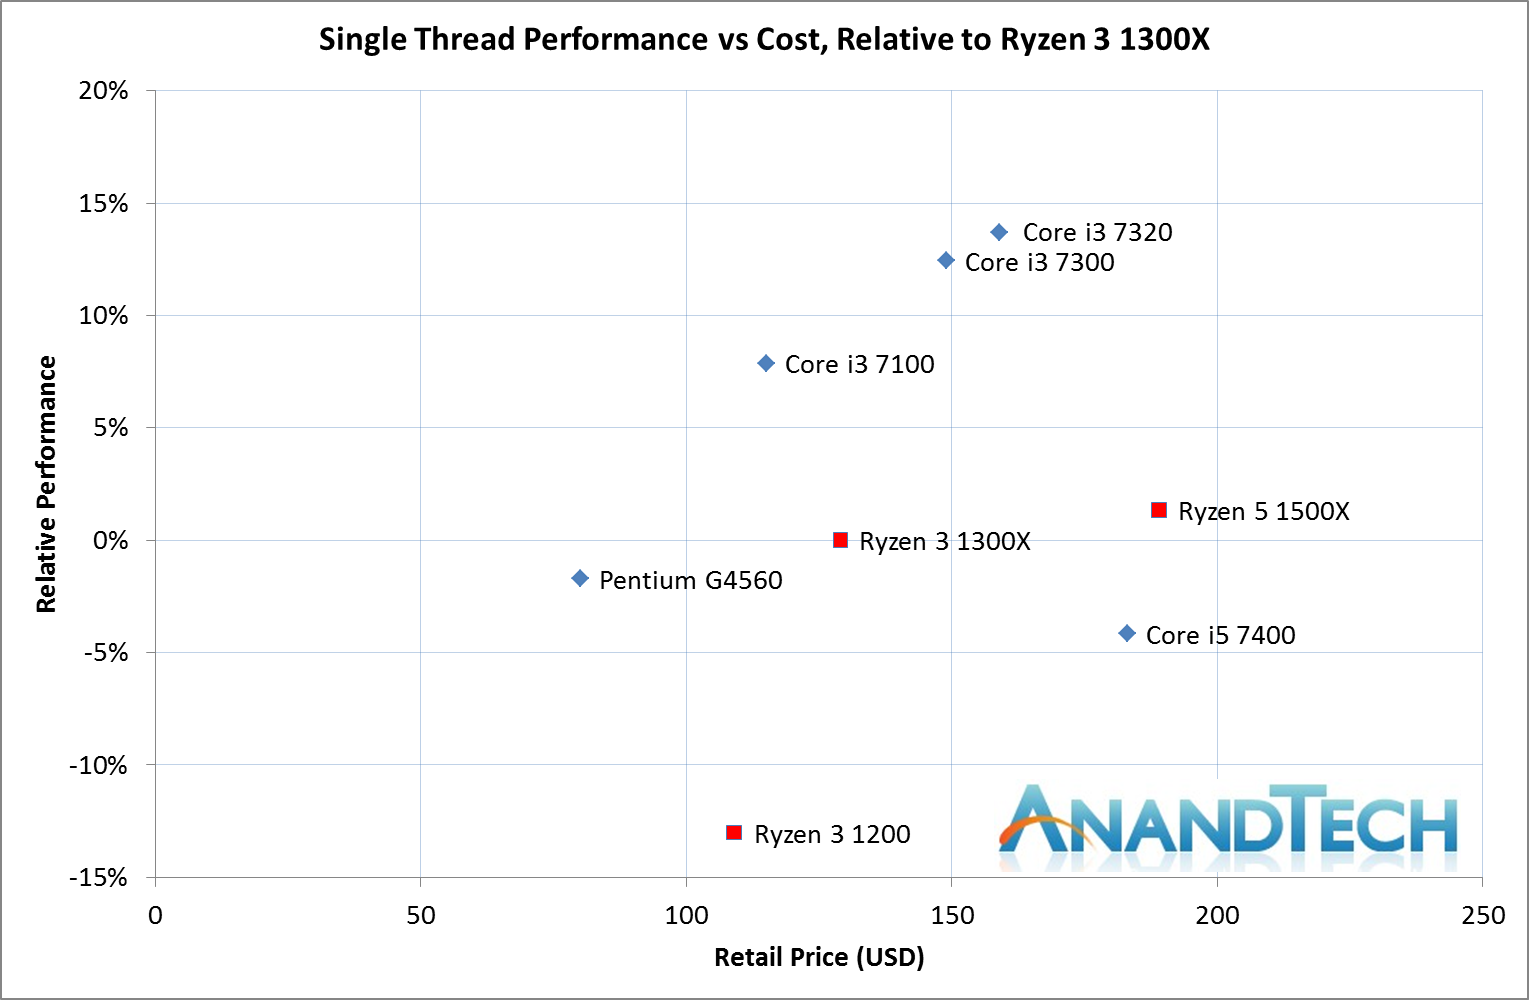
For the AMD CPUs, the 1300X and 1500X are near in base/turbo frequency (3400/3700 vs 3500/3700) and so score about the same, and the Ryzen 3 1200 at 3100/3400 scores about 13% lower.
The Intel CPUs here show a distinct curve from the Pentium G4560 at 3.5 GHz through the Core i3s at 3.9 GHz, 4.0 GHz and 4.1 GHz. The Core i5 7400 scores a lot lower here, with its base frequency of 3.0 GHz and a turbo up to 3.5 GHz.
For the multi-thread performance:
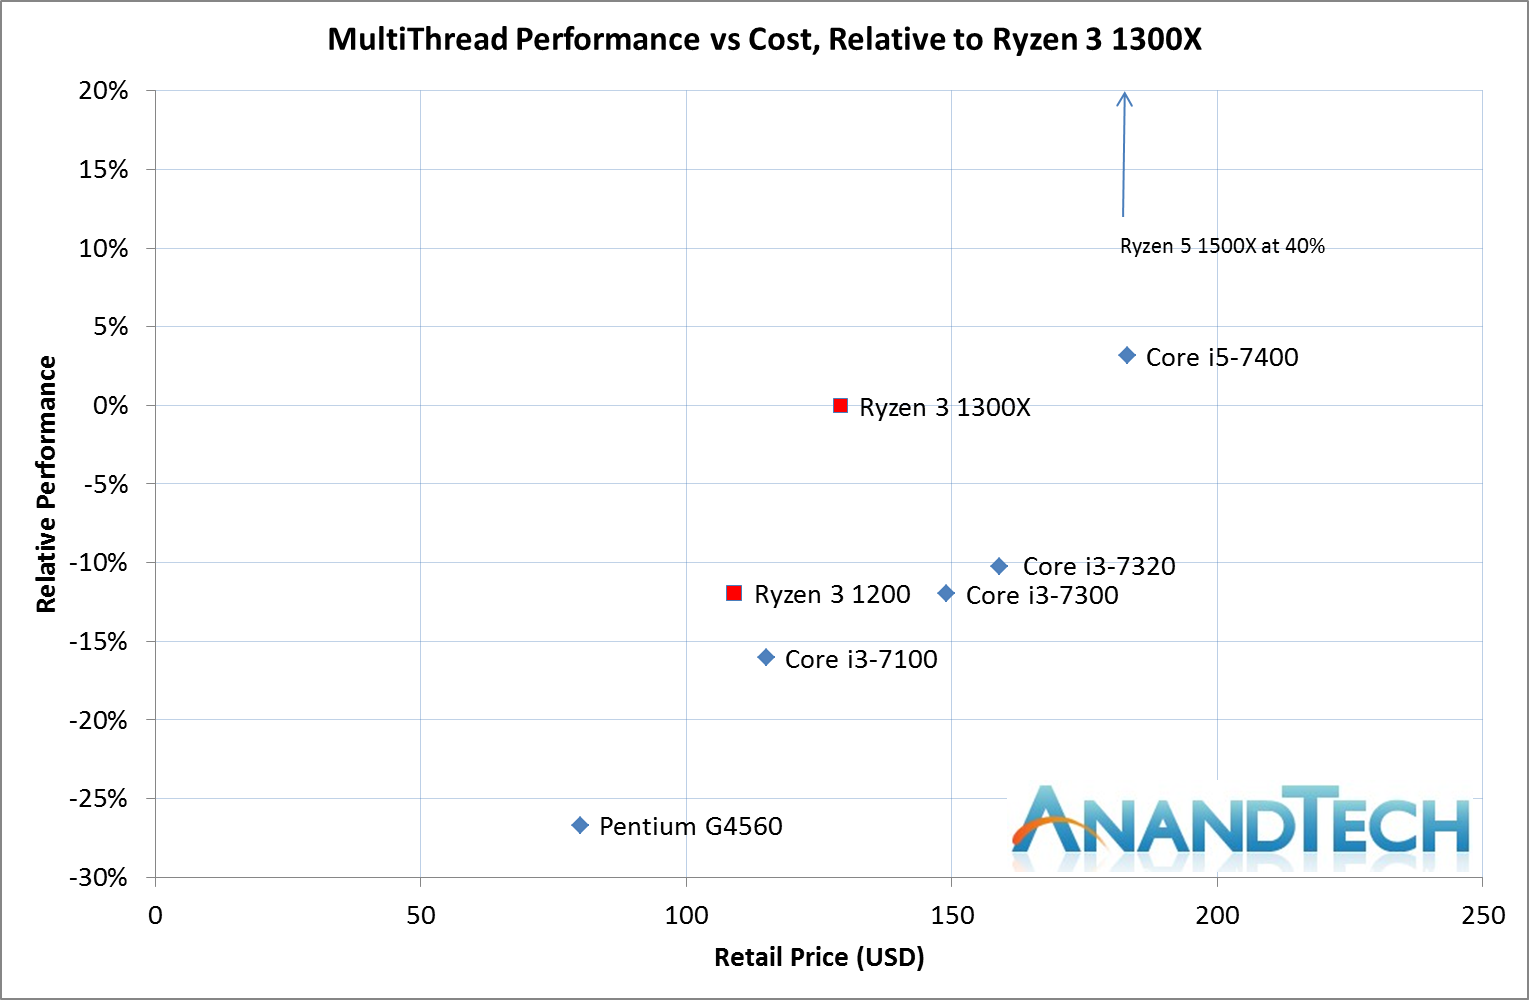
We shopped the graph here at +20% otherwise it would look odd, but the Ryzen 5 1500X with simultaneous multithreading gets a +40% boost over the 1300X, while the Ryzen 3 1200 sits again at around -12%. All the dual core intel parts lag behind here compared to AMD’s quad cores, although the Ryzen 3 1200 and the Core i3-7300 are closely matched – but the Ryzen wins on price by being ~$40 cheaper. The Core i5-7400, competes against the Ryzen 3 1300X here as they are both quad cores, and the Intel wins despite the lower frequency due to higher IPC – which comes at a $50+ premium.
For our combined all-in-one graph, we included our mixed workload data and weighted the results 40:50:10 for single:multi:mixed thread workloads.
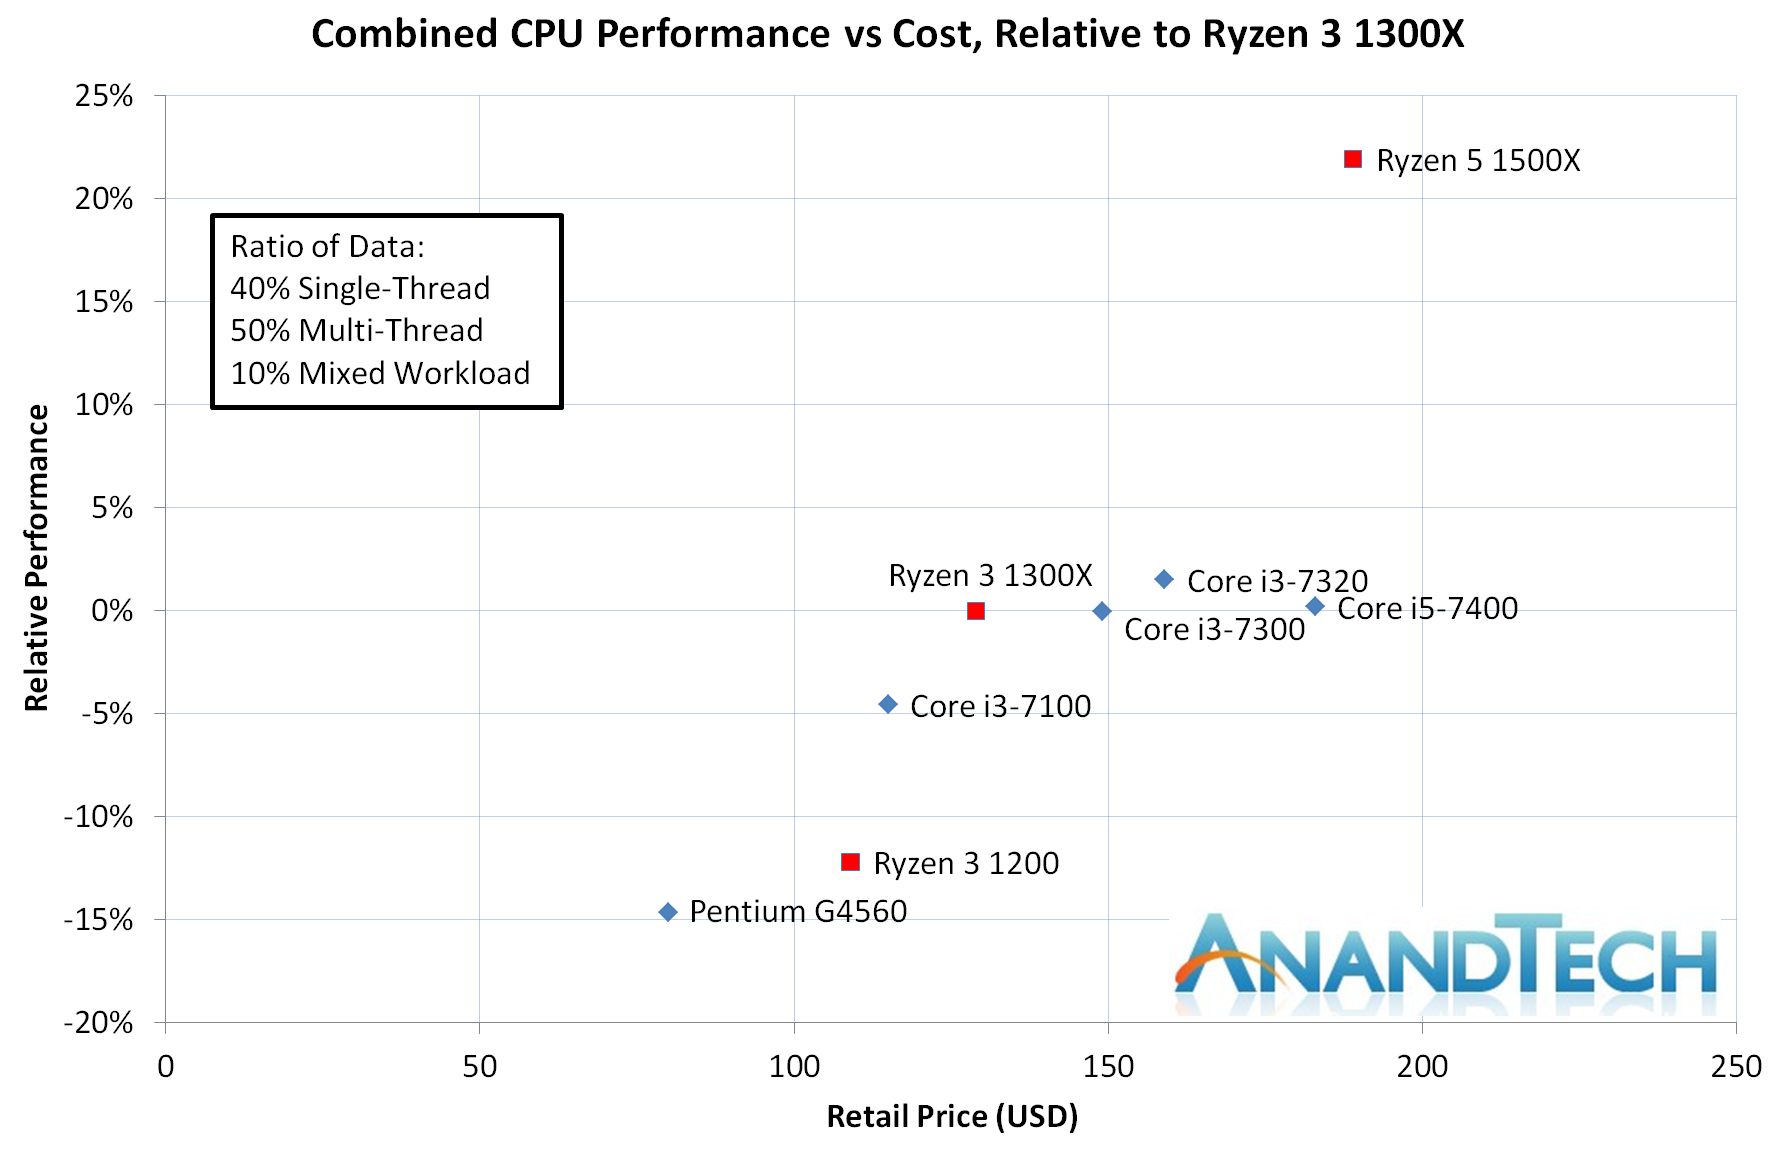
If we ignore the Ryzen 5 1500X in the top right corner, there are a few stories here.
First is that the Ryzen 3 1200 does not look like an attractive option. It performs +2-3% of the Pentium but is $30 more expensive, and the Core i3-7100 beats it by 8% for only a sub-$10 cost.
Then there is the Ryzen 3 1300X. Compared to the Core i3-7300/7320 and the Core i5-7400, it clearly wins on performance per dollar all around. Compared to the Core i3-7100 though, it offers almost 5% more performance for around $10-15 more, which is just under 10% of the cost. Depending on budgets, each one could be an attractive option.
We’re still working through our gaming testing as this review goes live, and we’ll add graphs for that in a bit.


