Original Link: https://www.anandtech.com/show/11244/the-amd-ryzen-5-1600x-vs-core-i5-review-twelve-threads-vs-four
The AMD Ryzen 5 1600X vs Core i5 Review: Twelve Threads vs Four at $250
by Ian Cutress on April 11, 2017 9:00 AM EST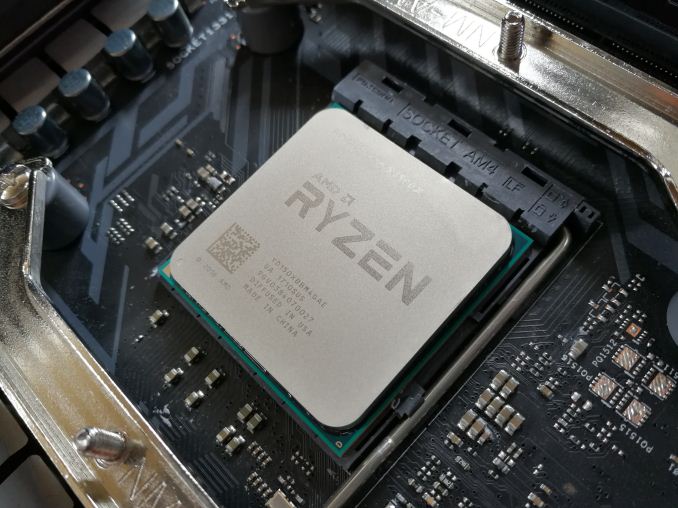
Since the announcement of AMD’s mid-range offerings, it was clear that Ryzen 5 is going to have some major advantages over its direct price competition. For $250, the top Ryzen 5 1600X gives six cores and twelve threads of AMD’s latest microarchitecture. For the same price from Intel with a Core i5, you get four cores and no extra threads. Even though the Intel Core i5 based on Kaby Lake will have an instructions-per-clock advantage, it’s a hard hill to climb when the competition has 50% more cores and 200% more threads. In this review, we take the Ryzen 5 1600X and see if it smashes the market wide open.
Ryzen 3, Ryzen 5, Ryzen 7 (...Ryzen 9?)
Today marks the retail availability of AMD’s Ryzen 5 line of desktop processors. As the name suggests, Ryzen 5 sits between Ryzen 7, which was launched in March 2017, and Ryzen 3, to be launched in Q2 2017. The launch of Ryzen 7 last month was a return to the high-performance market for AMD, with its new x86 microarchitecture and core design built on GlobalFoundries 14nm process offering equivalent performance to Intel’s high-end desktop (HEDT) parts for under half-the-cost. Ryzen 5 is a step below that HEDT market, aiming more at mainstream users on more reasonable budgets.
One of the throwbacks to the Ryzen 7 launch for AMD was that the competition in that space was invariably overpriced to begin with – having had no competition for so many years, Intel was able to dictate the price and performance ratios without losing market share. While Ryzen 7 came out fighting in that market, ultimately it was up against a two-generation old CPU design from Intel, and not the latest, due to the way that Intel staggers its design cycle between mainstream and high-end processors. Ryzen 5, on the other hand, is coming out against processors that Intel has launched this year, on their leading design.
So while Ryzen 7 undercut the HEDT market by offering the same performance (in most cases) for half the price, Ryzen 5 can’t do the same. The midstream market is more price sensitive, and as a result AMD is launching Ryzen 5 at similar price points to Intel in this field. So while AMD can’t compete on price, it tackles the midstream market with more cores and more threads instead. Where Intel offers four cores, AMD offers six. Where Intel offers four threads, AMD offers twelve. This has implications for performance and power, which will be a part of this review.
(I'm joking about Ryzen 9 in the title to this section. No Ryzen 9 has been announced.)
The Ryzen Series
Without further ado, here is where the Ryzen families stand:
| AMD Ryzen 7 SKUs | |||||||
| Cores/ Threads |
Base/ Turbo |
XFR | L3 | TDP | Cost | Cooler | |
| Ryzen 7 1800X | 8/16 | 3.6/4.0 | +100 | 16 MB | 95 W | $499 | - |
| Ryzen 7 1700X | 8/16 | 3.4/3.8 | +100 | 16 MB | 95 W | $399 | - |
| Ryzen 7 1700 | 8/16 | 3.0/3.7 | +50 | 16 MB | 65 W | $329 | Spire RGB |
| AMD Ryzen 5 SKUs | |||||||
| Cores/ Threads |
Base/ Turbo |
XFR | L3 | TDP | Cost | Cooler | |
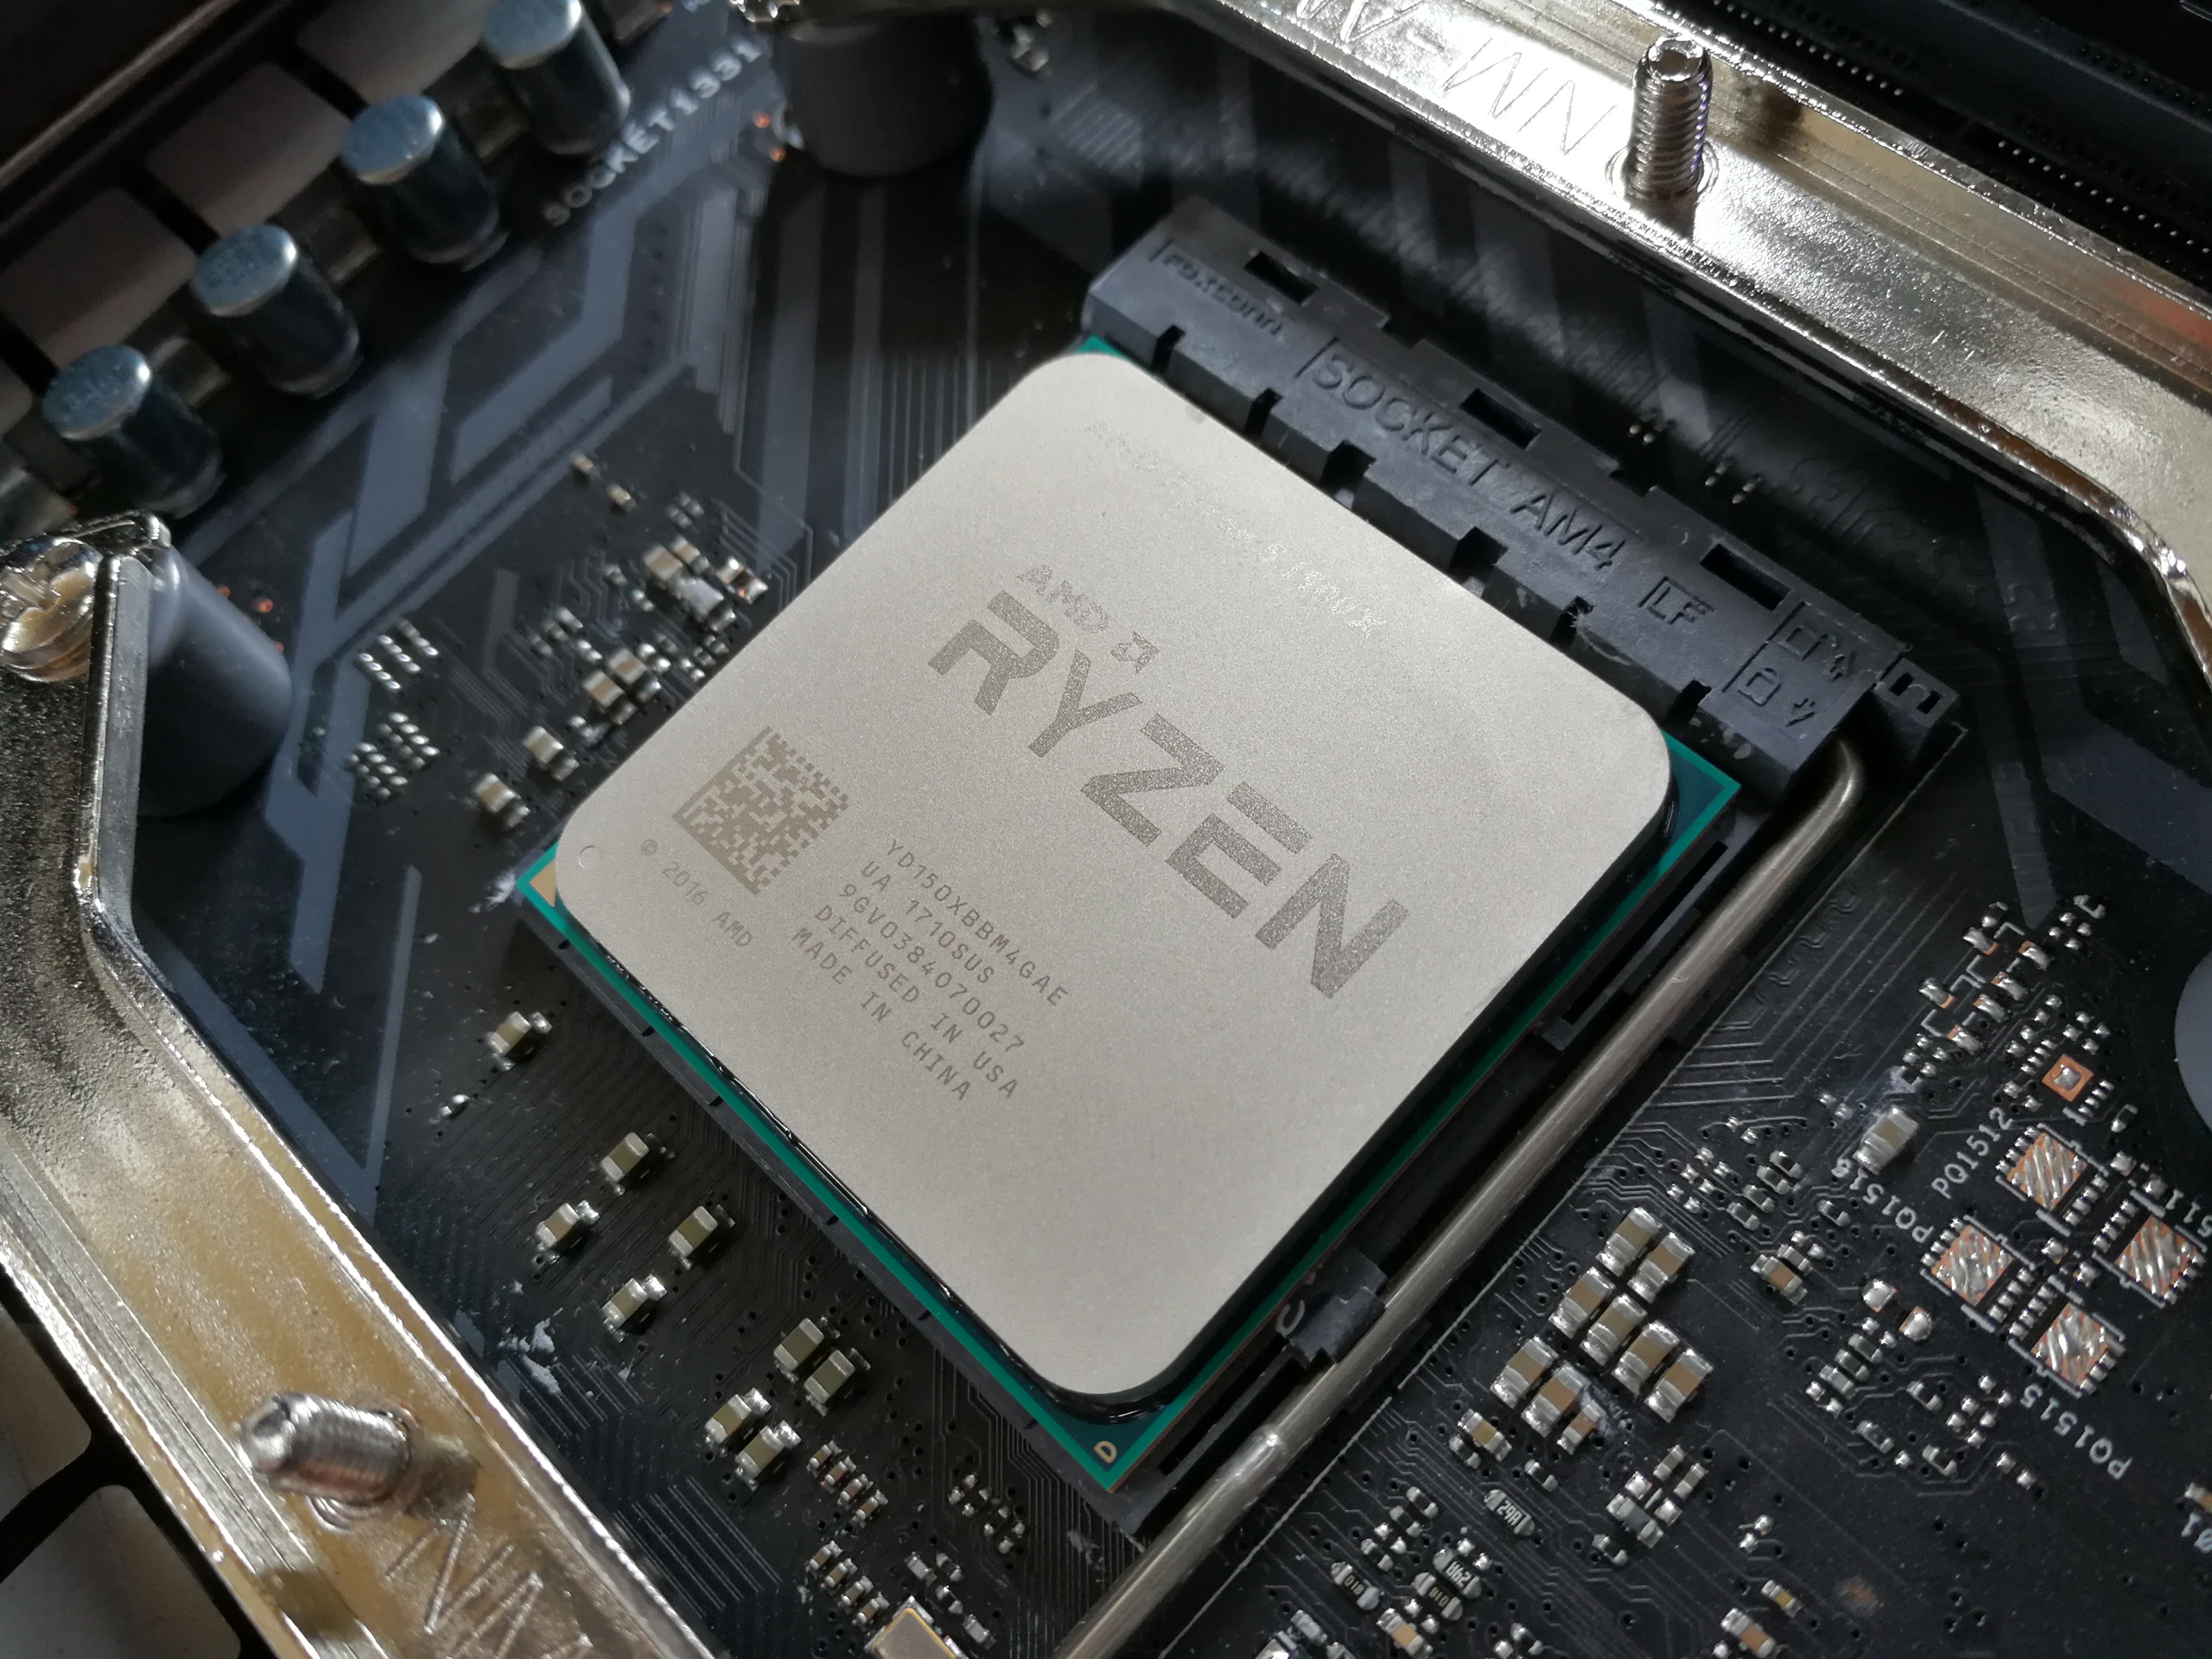
| Ryzen 5 1600X | 6/12 | 3.6/4.0 | +100 | 16 MB | 95 W | $249 | - |
| Ryzen 5 1600 | 6/12 | 3.2/3.6 | +100 | 16 MB | 65 W | $219 | Spire |
| Ryzen 5 1500X | 4/8 | 3.5/3.7 | +200 | 16 MB | 65 W | $189 | Spire |
| Ryzen 5 1400 | 4/8 | 3.2/3.4 | +50 | 8 MB | 65 W | $169 | Stealth |
Normally we see parts with with fewer cores having a higher clock frequency, however perhaps due to the voltage scaling of the design, we see a matched Ryzen 5 1600X in frequency to the Ryzen 7 1800X, but the rest of the Ryzen 5 family are offered at a lower TDP instead.
All the Ryzen 5 parts are unlocked, similar to the Ryzen 7 parts, and all four exhibit some movement in their ‘Extreme Frequency Range’ (XFR) mode, with the 1500X offering +200 MHz when there is sufficient cooling at hand.. AMD is going to offer some of these SKUs with their redesigned Wraith coolers, except the 1600X.
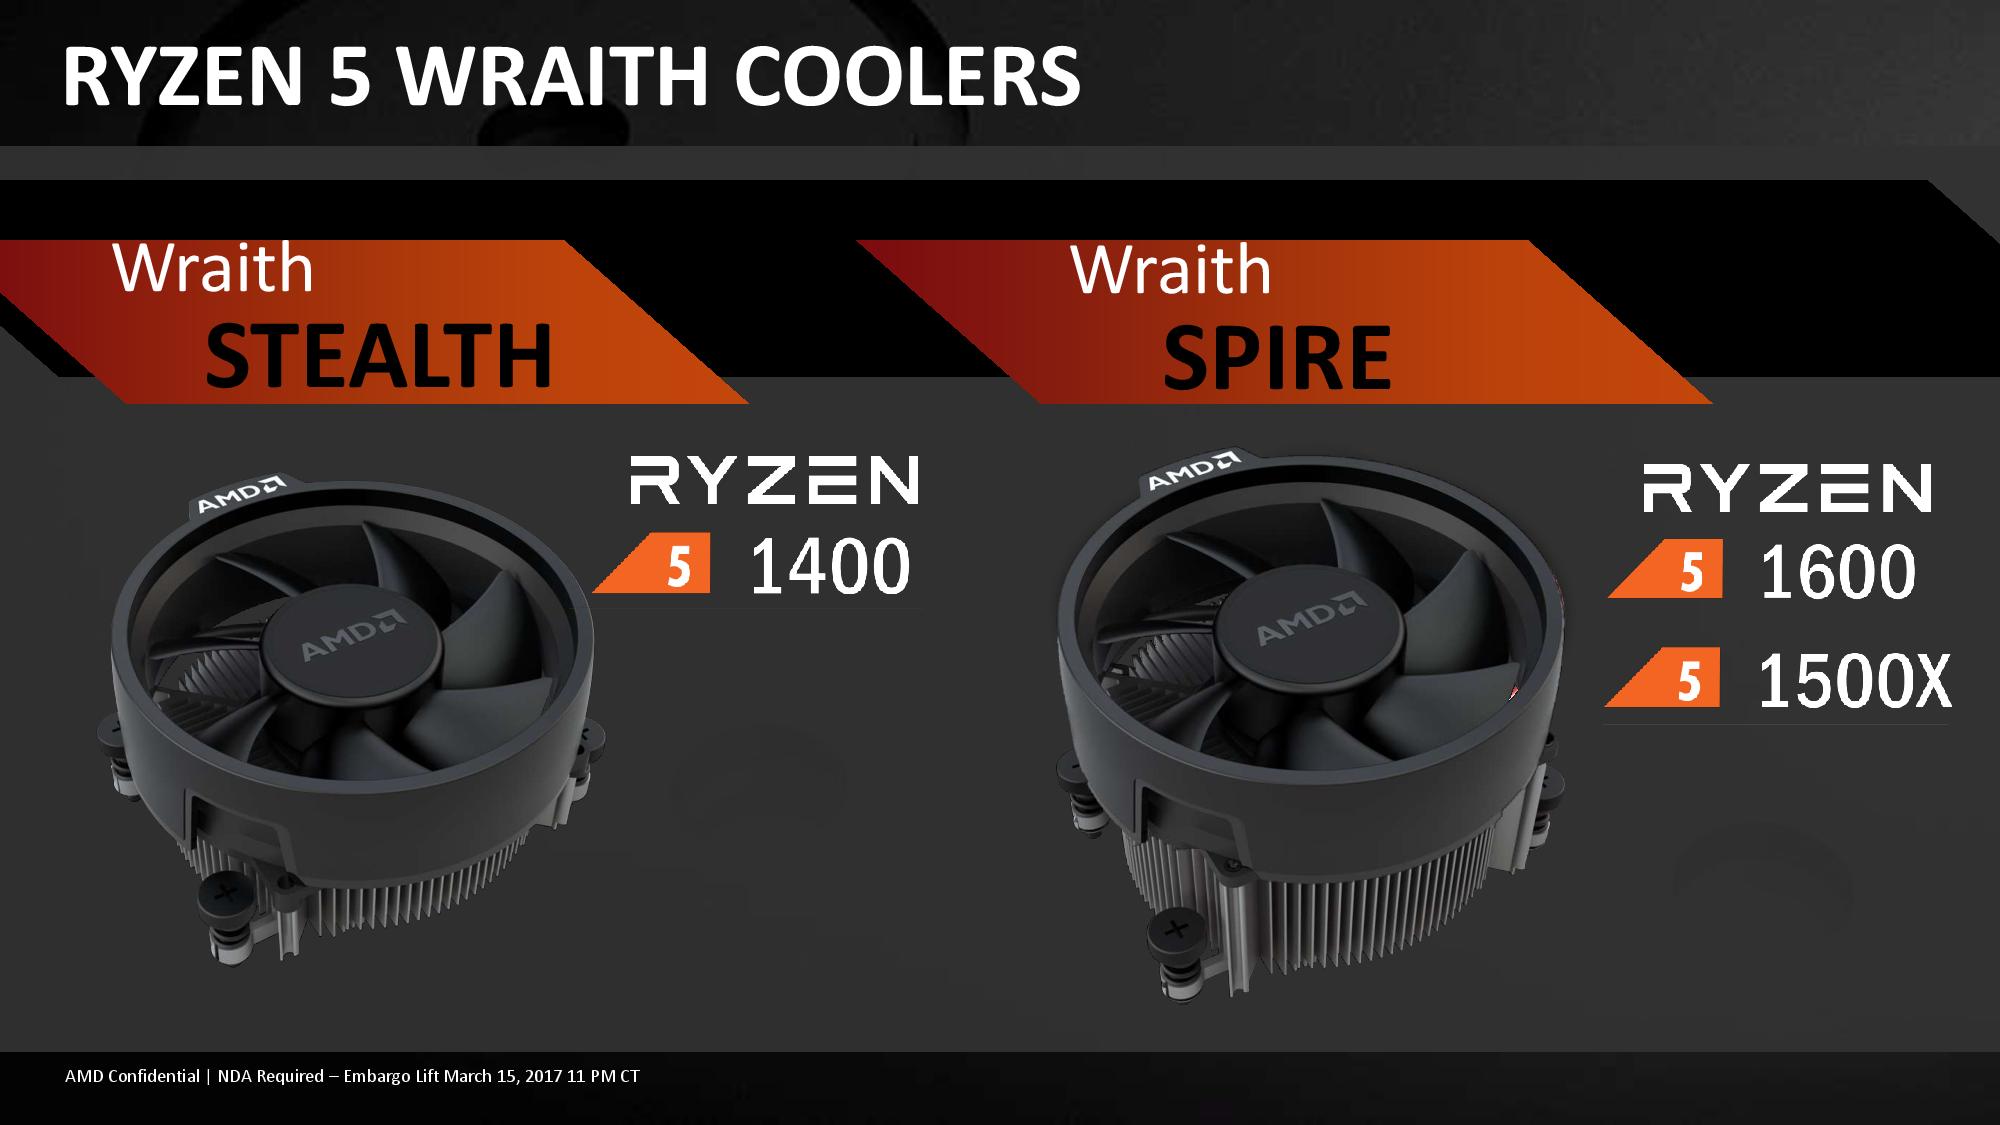
It is worth noting that the Wraith Spire for Ryzen 5 will not have RGB lighting, whereas the Wraith Spire for Ryzen 7 does use an RGB ring. OEMs will be able to use the higher-end Wraith Max stock cooler for their pre-built systems. AMD stated that at present, there are no plans to bring the Wraith coolers to retail as individual units, however they will keep track of how many users want them as individual items and regularly approach the issue internally.
To clarify some initial confusion, AMD has given me official TDP support numbers for the coolers. The entry level Wraith Stealth is 65W, the Wraith Spire is 65W for high-ambient conditions (AMD states this might be considered an '80W' design in low-ambient), and the Wraith Max is 95W for OEM builds using Ryzen 7 95W parts.
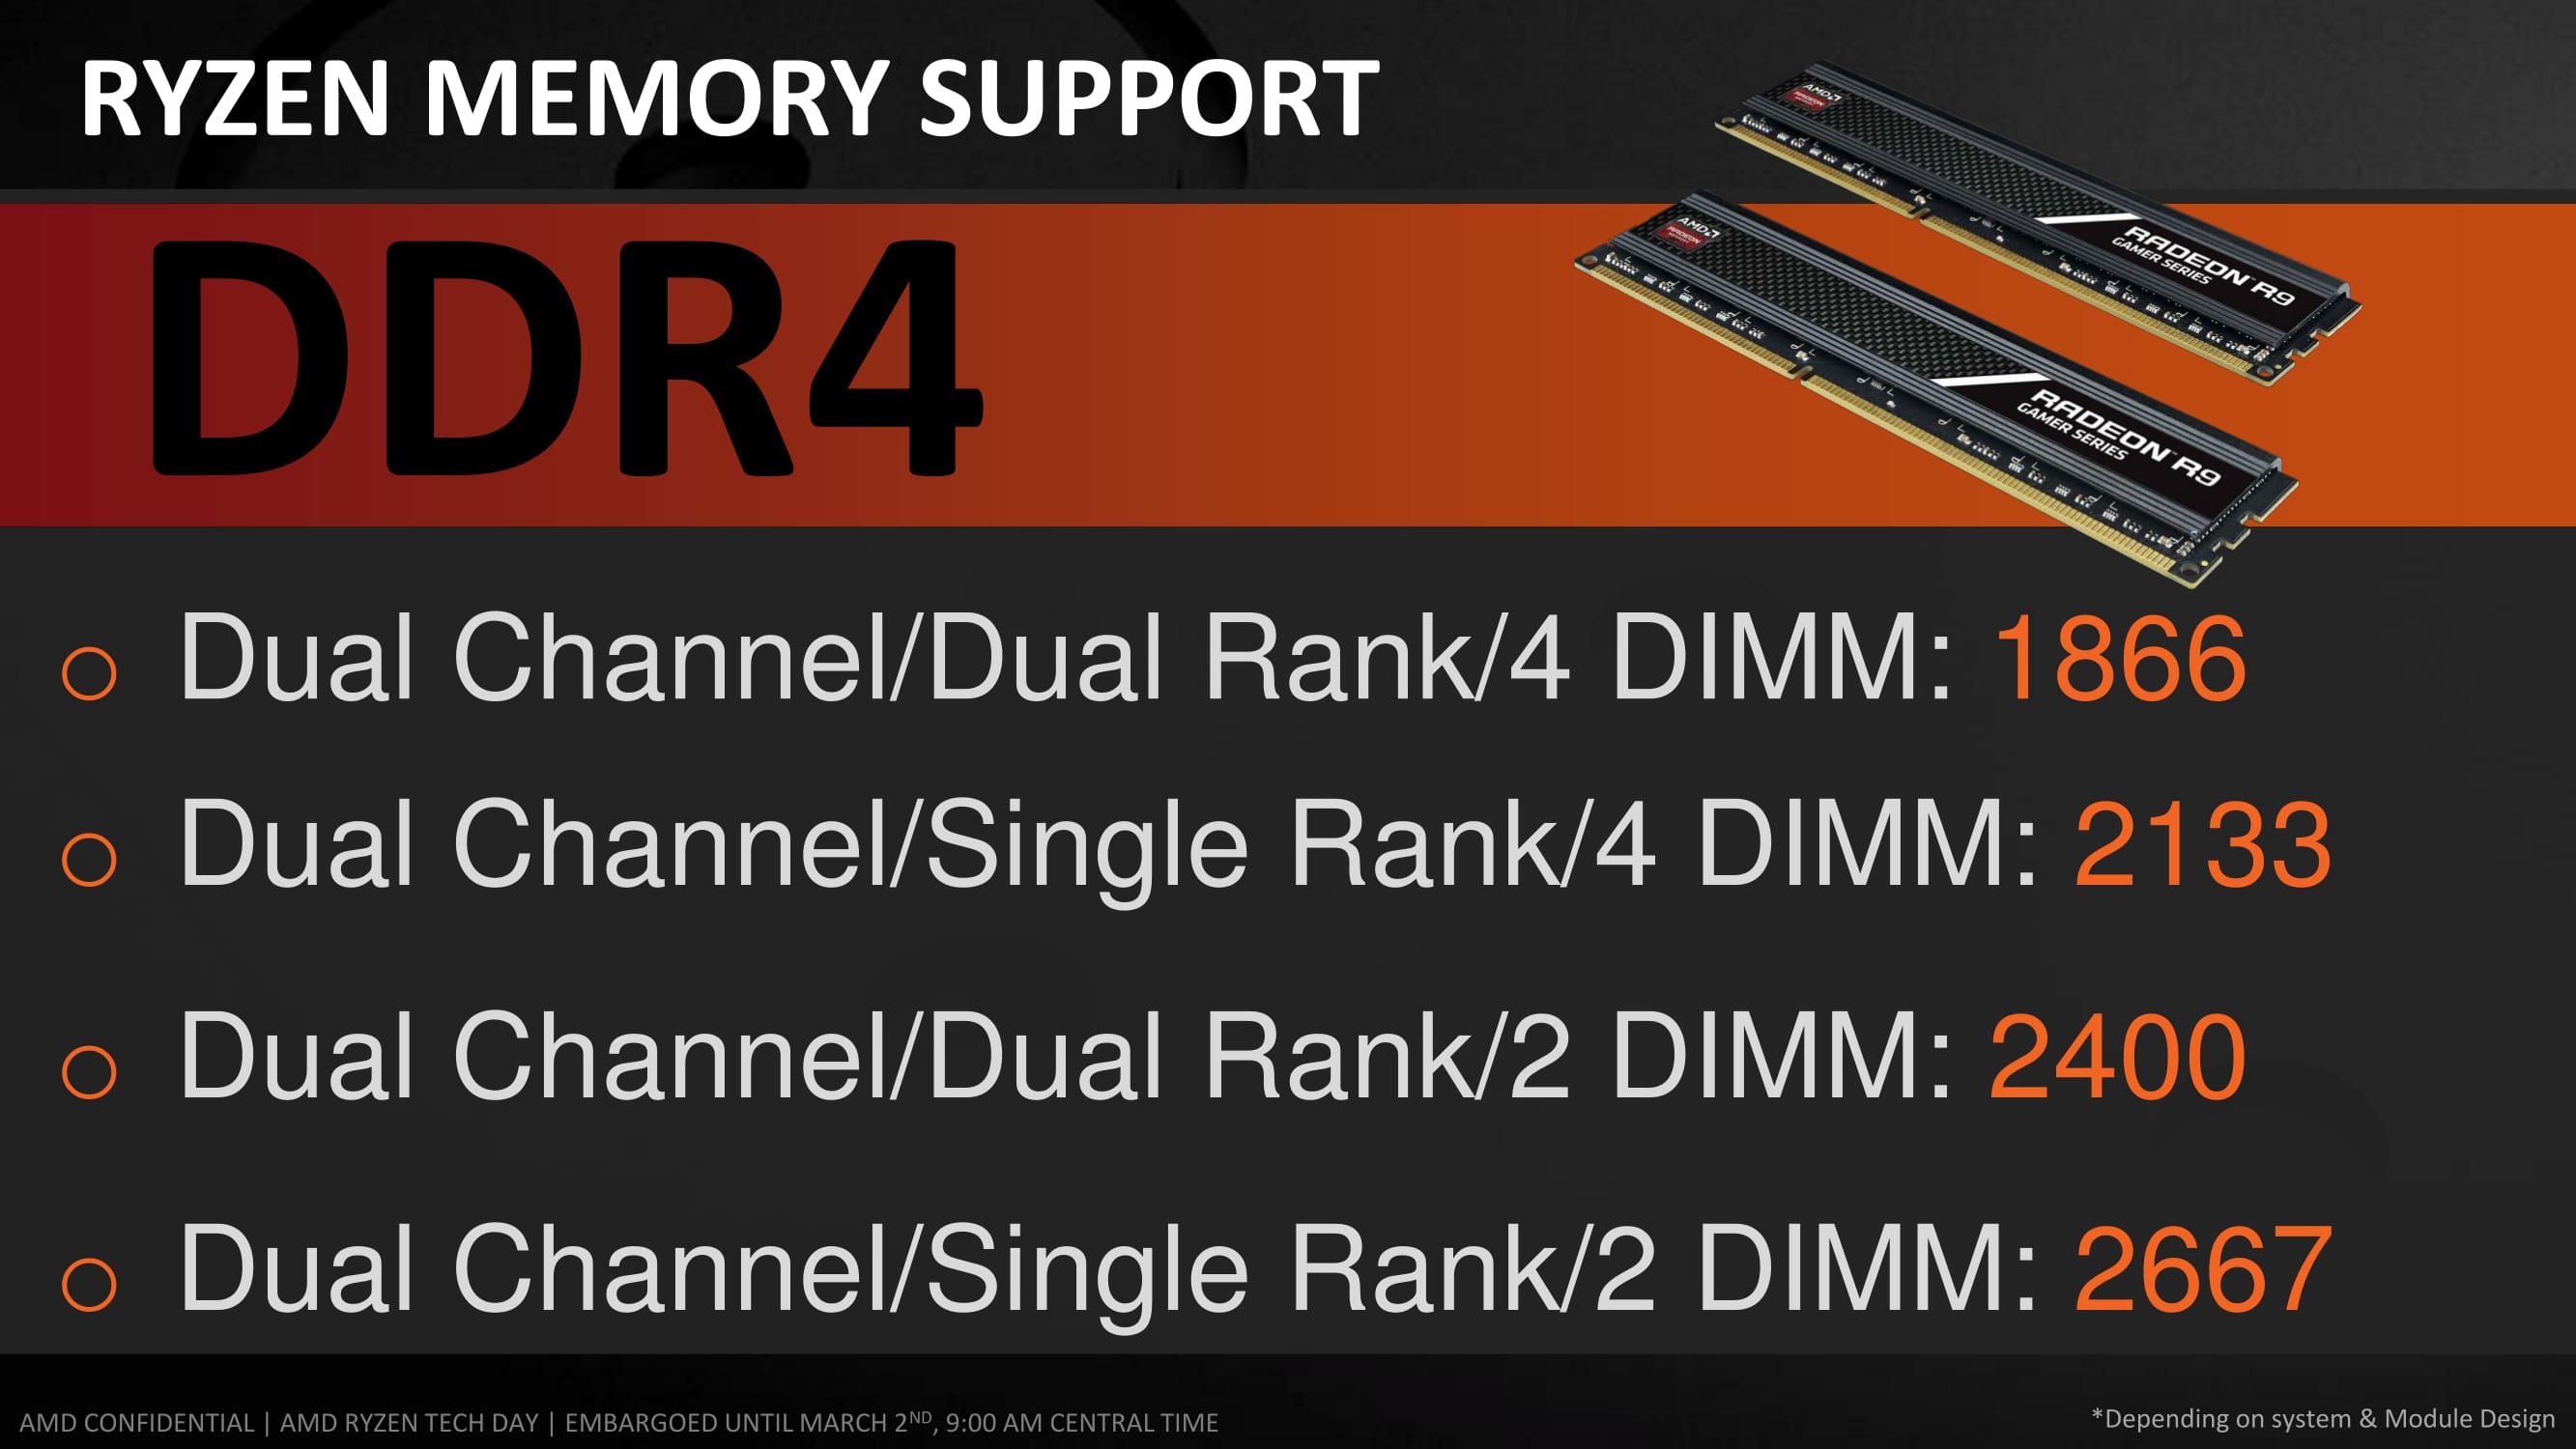
All the Ryzen 5 parts will support DDR4 ECC and non-ECC memory, and the memory support is the same as Ryzen 7, and will depend on how many modules and the types of modules being used. Recently companies like ADATA announced official support for AM4, as some users have found that there were memory growing pains when Ryzen 7 was launched.
Platform support for Ryzen 5, relating to PCIe lanes and chipset configurations, is identical to Ryzen 7. Each CPU offers sixteen PCIe 3.0 lanes for graphics, along with four lanes for a chipset and four lanes for storage. Chipsets can then offer up to eight PCIe 2.0 lanes which can bifurcated up to x4 (AMD GPUs can use chipset lanes for graphics as well, however at reduced bandwidth and additional latency).
Competition
The high-end Ryzen 5 1600X, at $249, is a shoe-in to compete against Intel’s i5-7600K at $242. Intel’s CPU is based on the Kaby Lake microarchitecture, and we’ve already shown in the Ryzen 7 review that by comparison Ryzen is more circa Broadwell, which is two generations behind. AMD won’t win much when it comes to single-threaded tests here, but the multi-threaded situation is where AMD shines.
| Comparison: Ryzen 5 1600X vs Core i5-7600K | ||
| AMD Ryzen 5 1600X |
Features | Intel Core i5-7600K |
| 6 / 12 | Cores/Threads | 4 / 4 |
| 3.6 / 4.0 GHz | Base/Turbo | 3.8 / 4.2 GHz |
| 16 | PCIe 3.0 Lanes | 16 |
| 16 MB | L3 Cache | 6 MB |
| 95 W | TDP | 91 W |
| $249 | Price (MSRP) | $242 |
Here we have twelve threads against four, at a 95W TDP compared to a 91W TDP (the 1600 is 65W, which looks better on paper). It is expected that for situations where a compute workload can scale across cores and threads that the AMD chip will wipe the floor with the competition. For more generic office workloads, it will interesting to see where the marks fall.
On the quad-core parts, there are several competitive points to choose from. The AMD Ryzen 5 1500X, at $189, sits near Intel’s Core i5-7500 at $192. This would be a shootout of a base quad-core in the Core i5 versus a quad-core with hyperthreading.
| Comparison: Ryzen 5 1500X vs Core i5-7500 | ||
| AMD Ryzen 5 1500X |
Features | Intel Core i5-7500 |
| 4 / 8 | Cores/Threads | 4 / 4 |
| 3.5 / 3.7 GHz | Base/Turbo | 3.4 / 3.8 GHz |
| 16 | PCIe 3.0 Lanes | 16 |
| 16 MB | L3 Cache | 6 MB |
| 65 W | TDP | 65 W |
| $189 | Price (MSRP) | $182 |
The reason why I didn’t pull out the Core i3-7350K there, at $168, is because the performance of the 7350K sits near the Pentium G4560, which is only $64 (and the subject of an upcoming review). That all being said, the $168 price of the i3-7350K matches up to the $169 price of the Ryzen 5 1400, although the 1400 has double the cores and double the threads of the 7350K.
Chipsets for Ryzen 5
The chipsets for AMD’s AM4 CPUs come in three main forms: the high-end X370 designed for premium Ryzen 7 systems and multi-GPU gaming (or multi-PCIe card workstations), mid-range B350 motherboards that still support overclocking but are more targeted at Ryzen 5 systems with a single graphics card, and the more budget range A320 which does not have overclocking and will be a fit in for Ryzen 3 later this year.
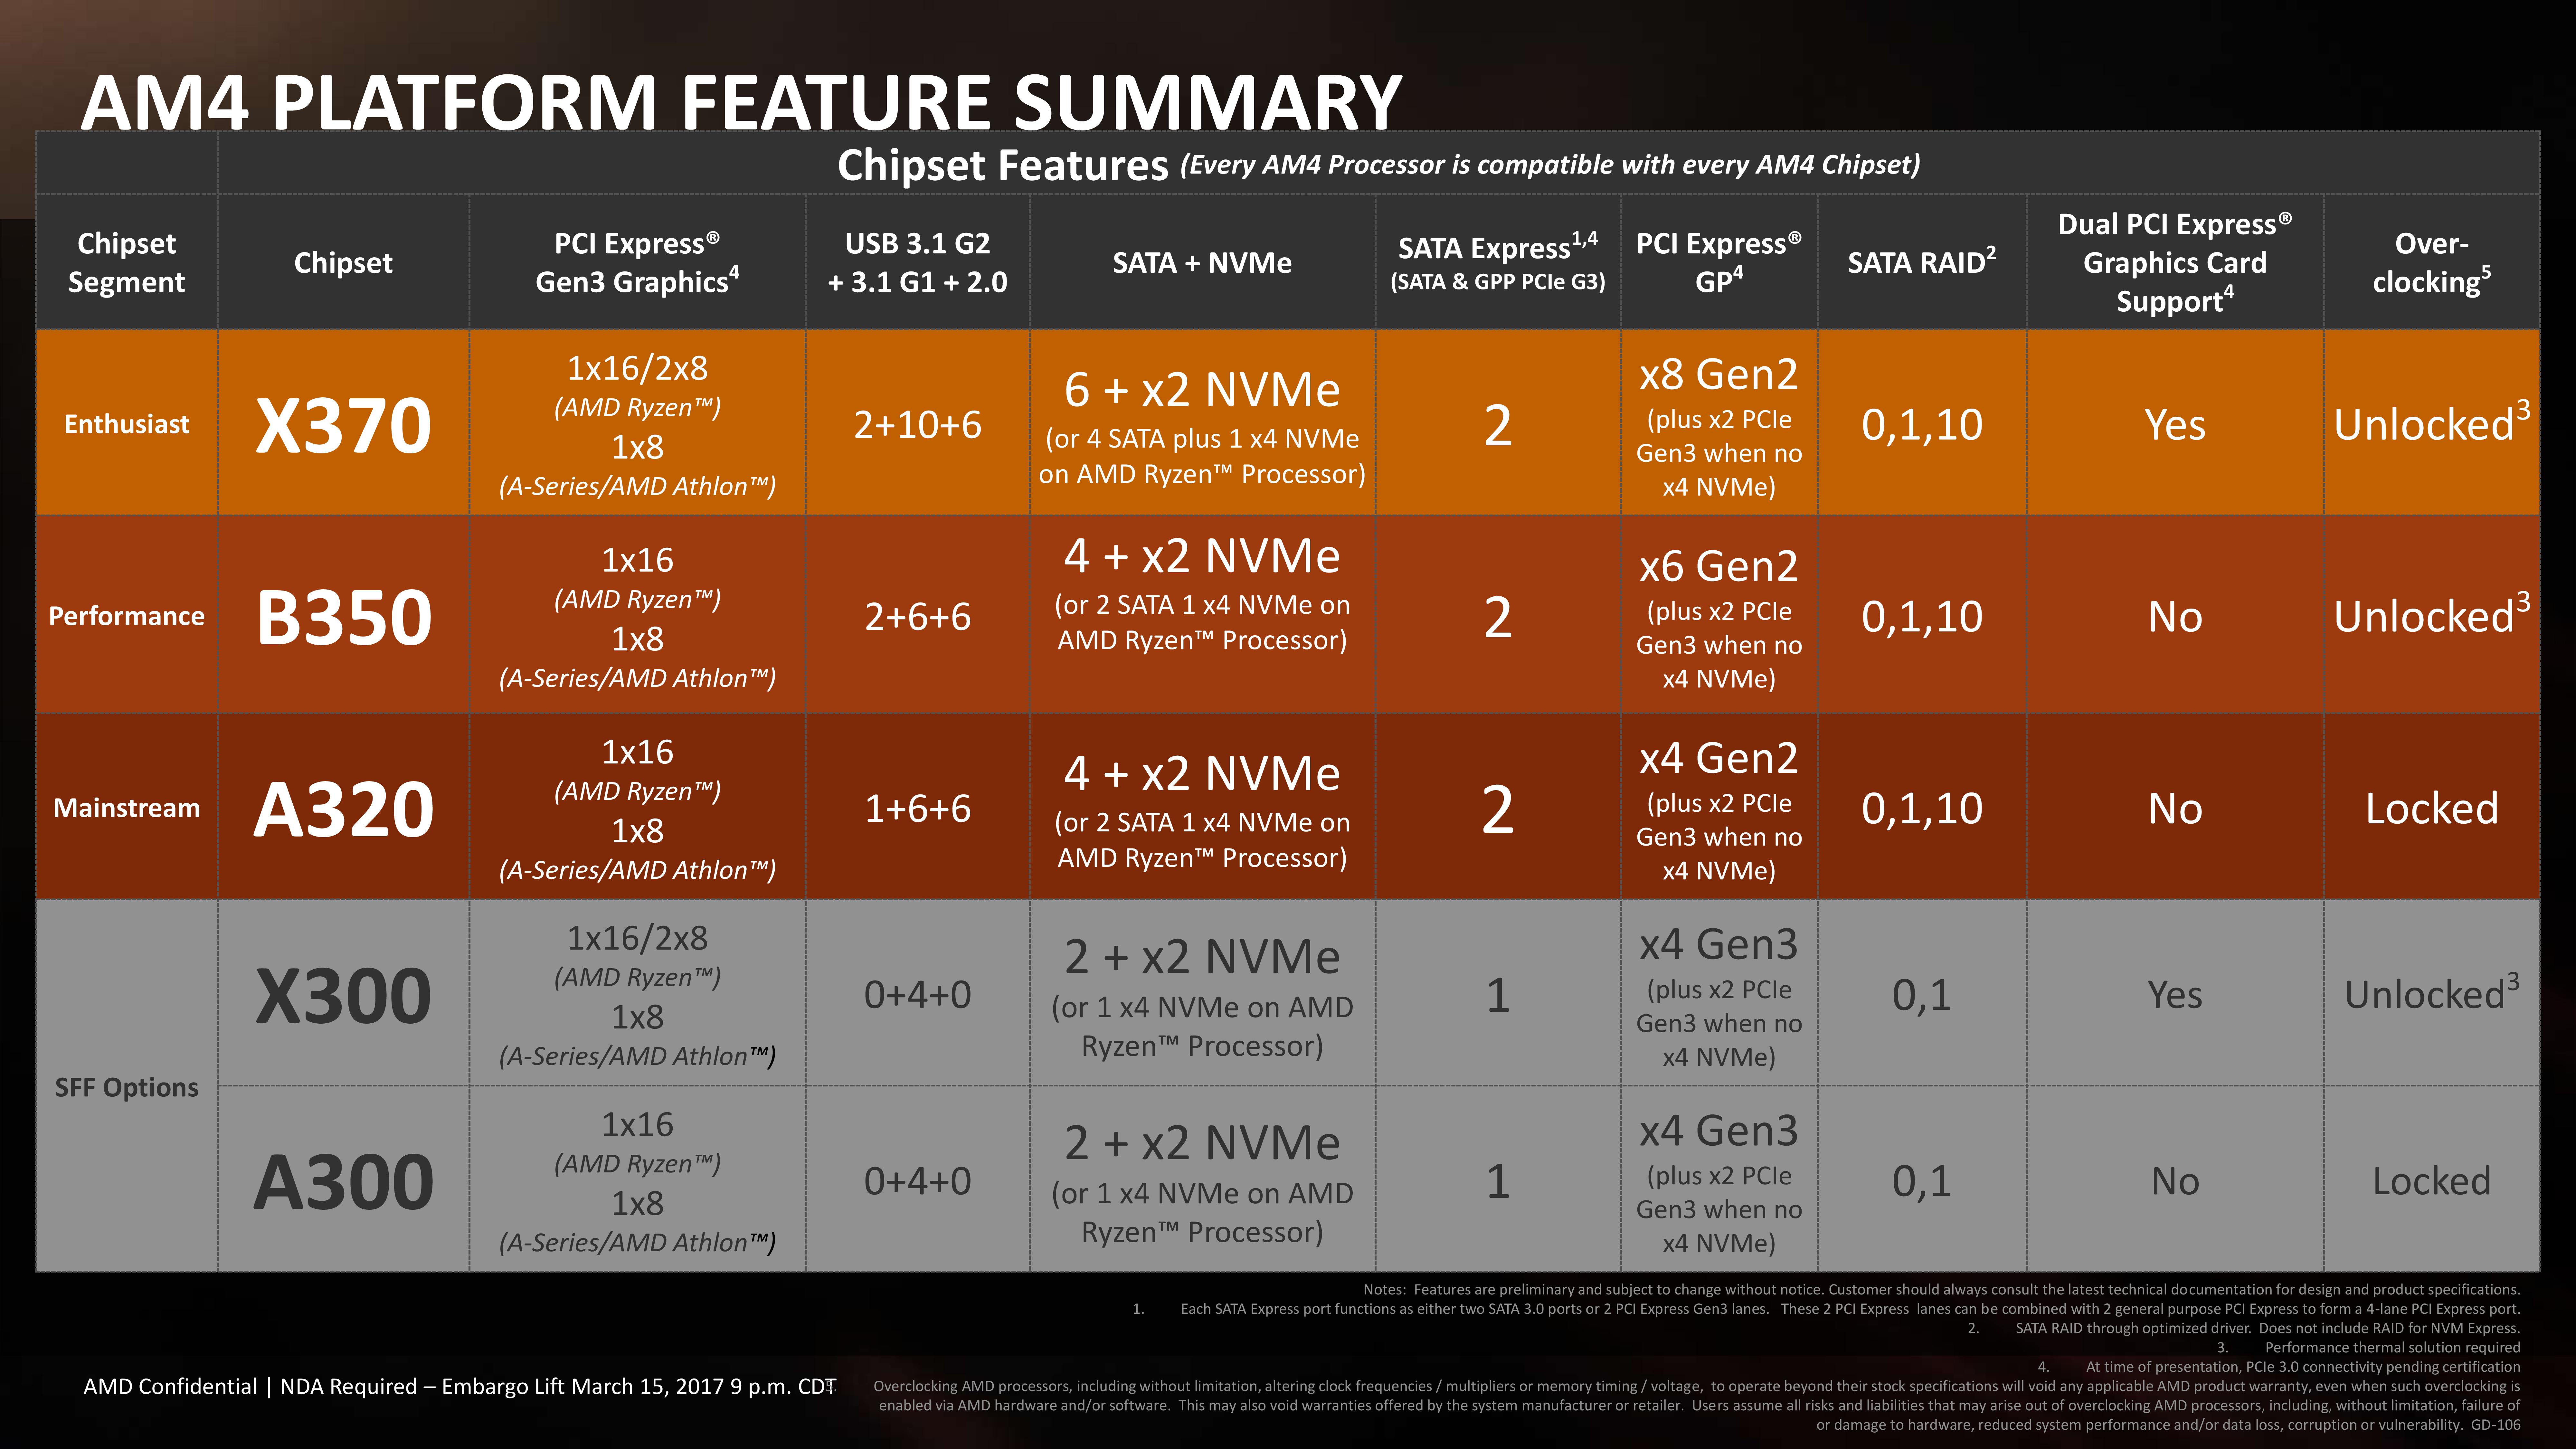
We are now at a point where the motherboard manufacturers are swimming in AMD motherboards, and distributors are building stock of various models. For Ryzen 5, AMD is pitching the B350 chipset based motherboards as a suitable solution, especially when compared to Intel’s B250 motherboards for Kaby Lake processors.
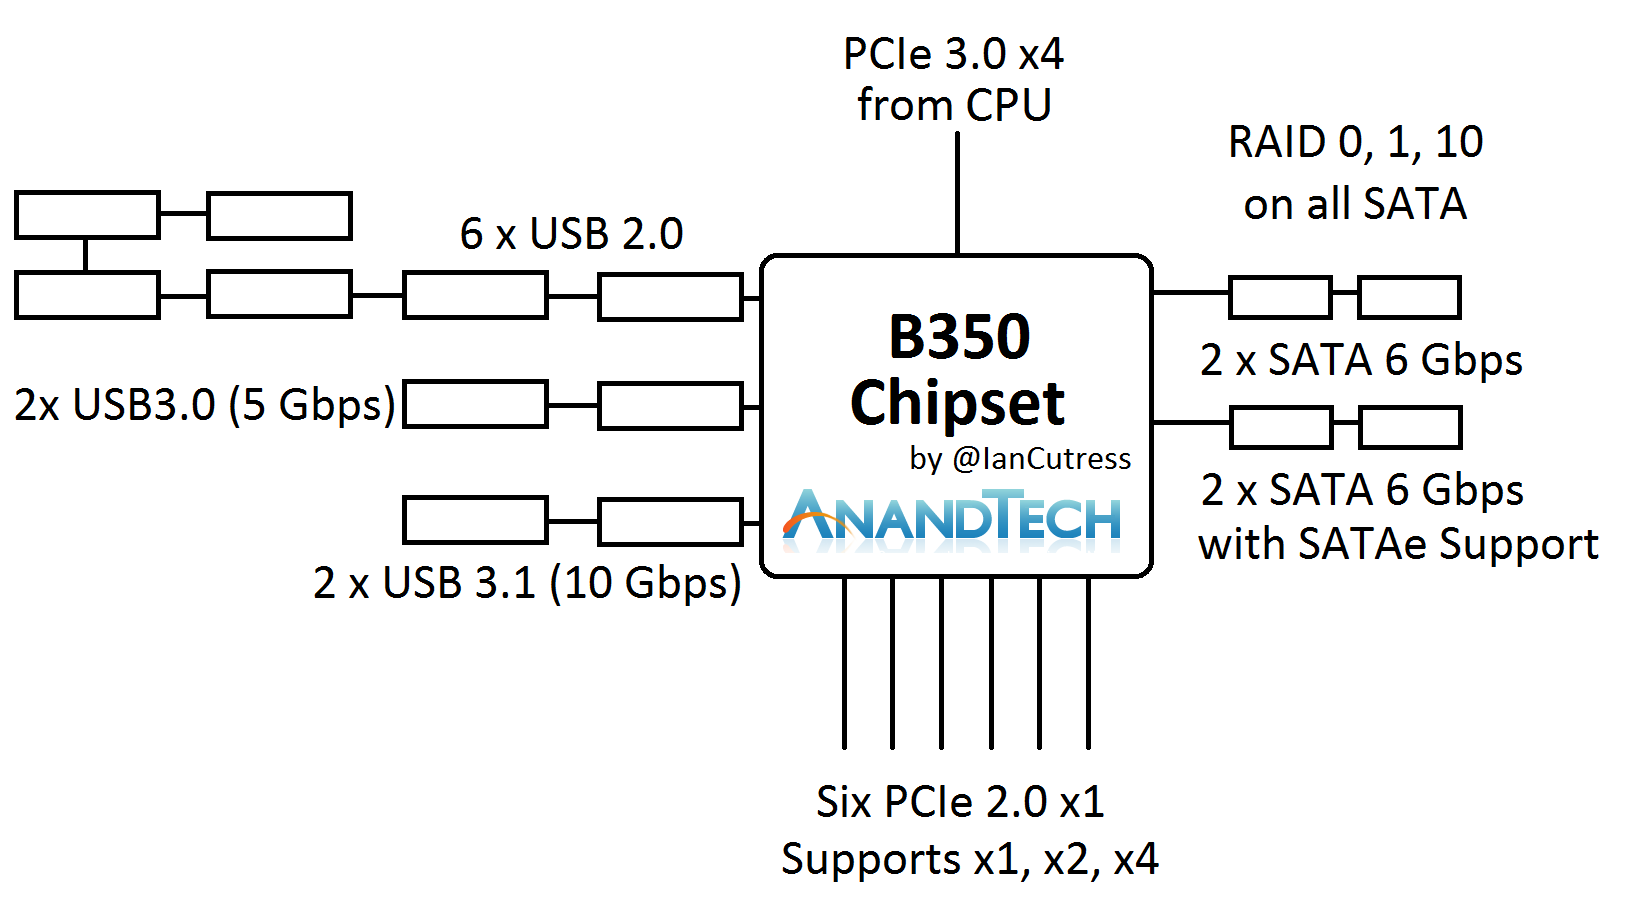
The B350 configuration matches that on the X370, save for a couple of PCIe lanes from the chipset and the focus on a single GPU.
Ryzen 5, Core Allocation, and Power
In our original review of Ryzen 7, we showed that the underlying silicon design of the Ryzen package consists of a single eight-core Zeppelin die with Zen microarchitecture cores.
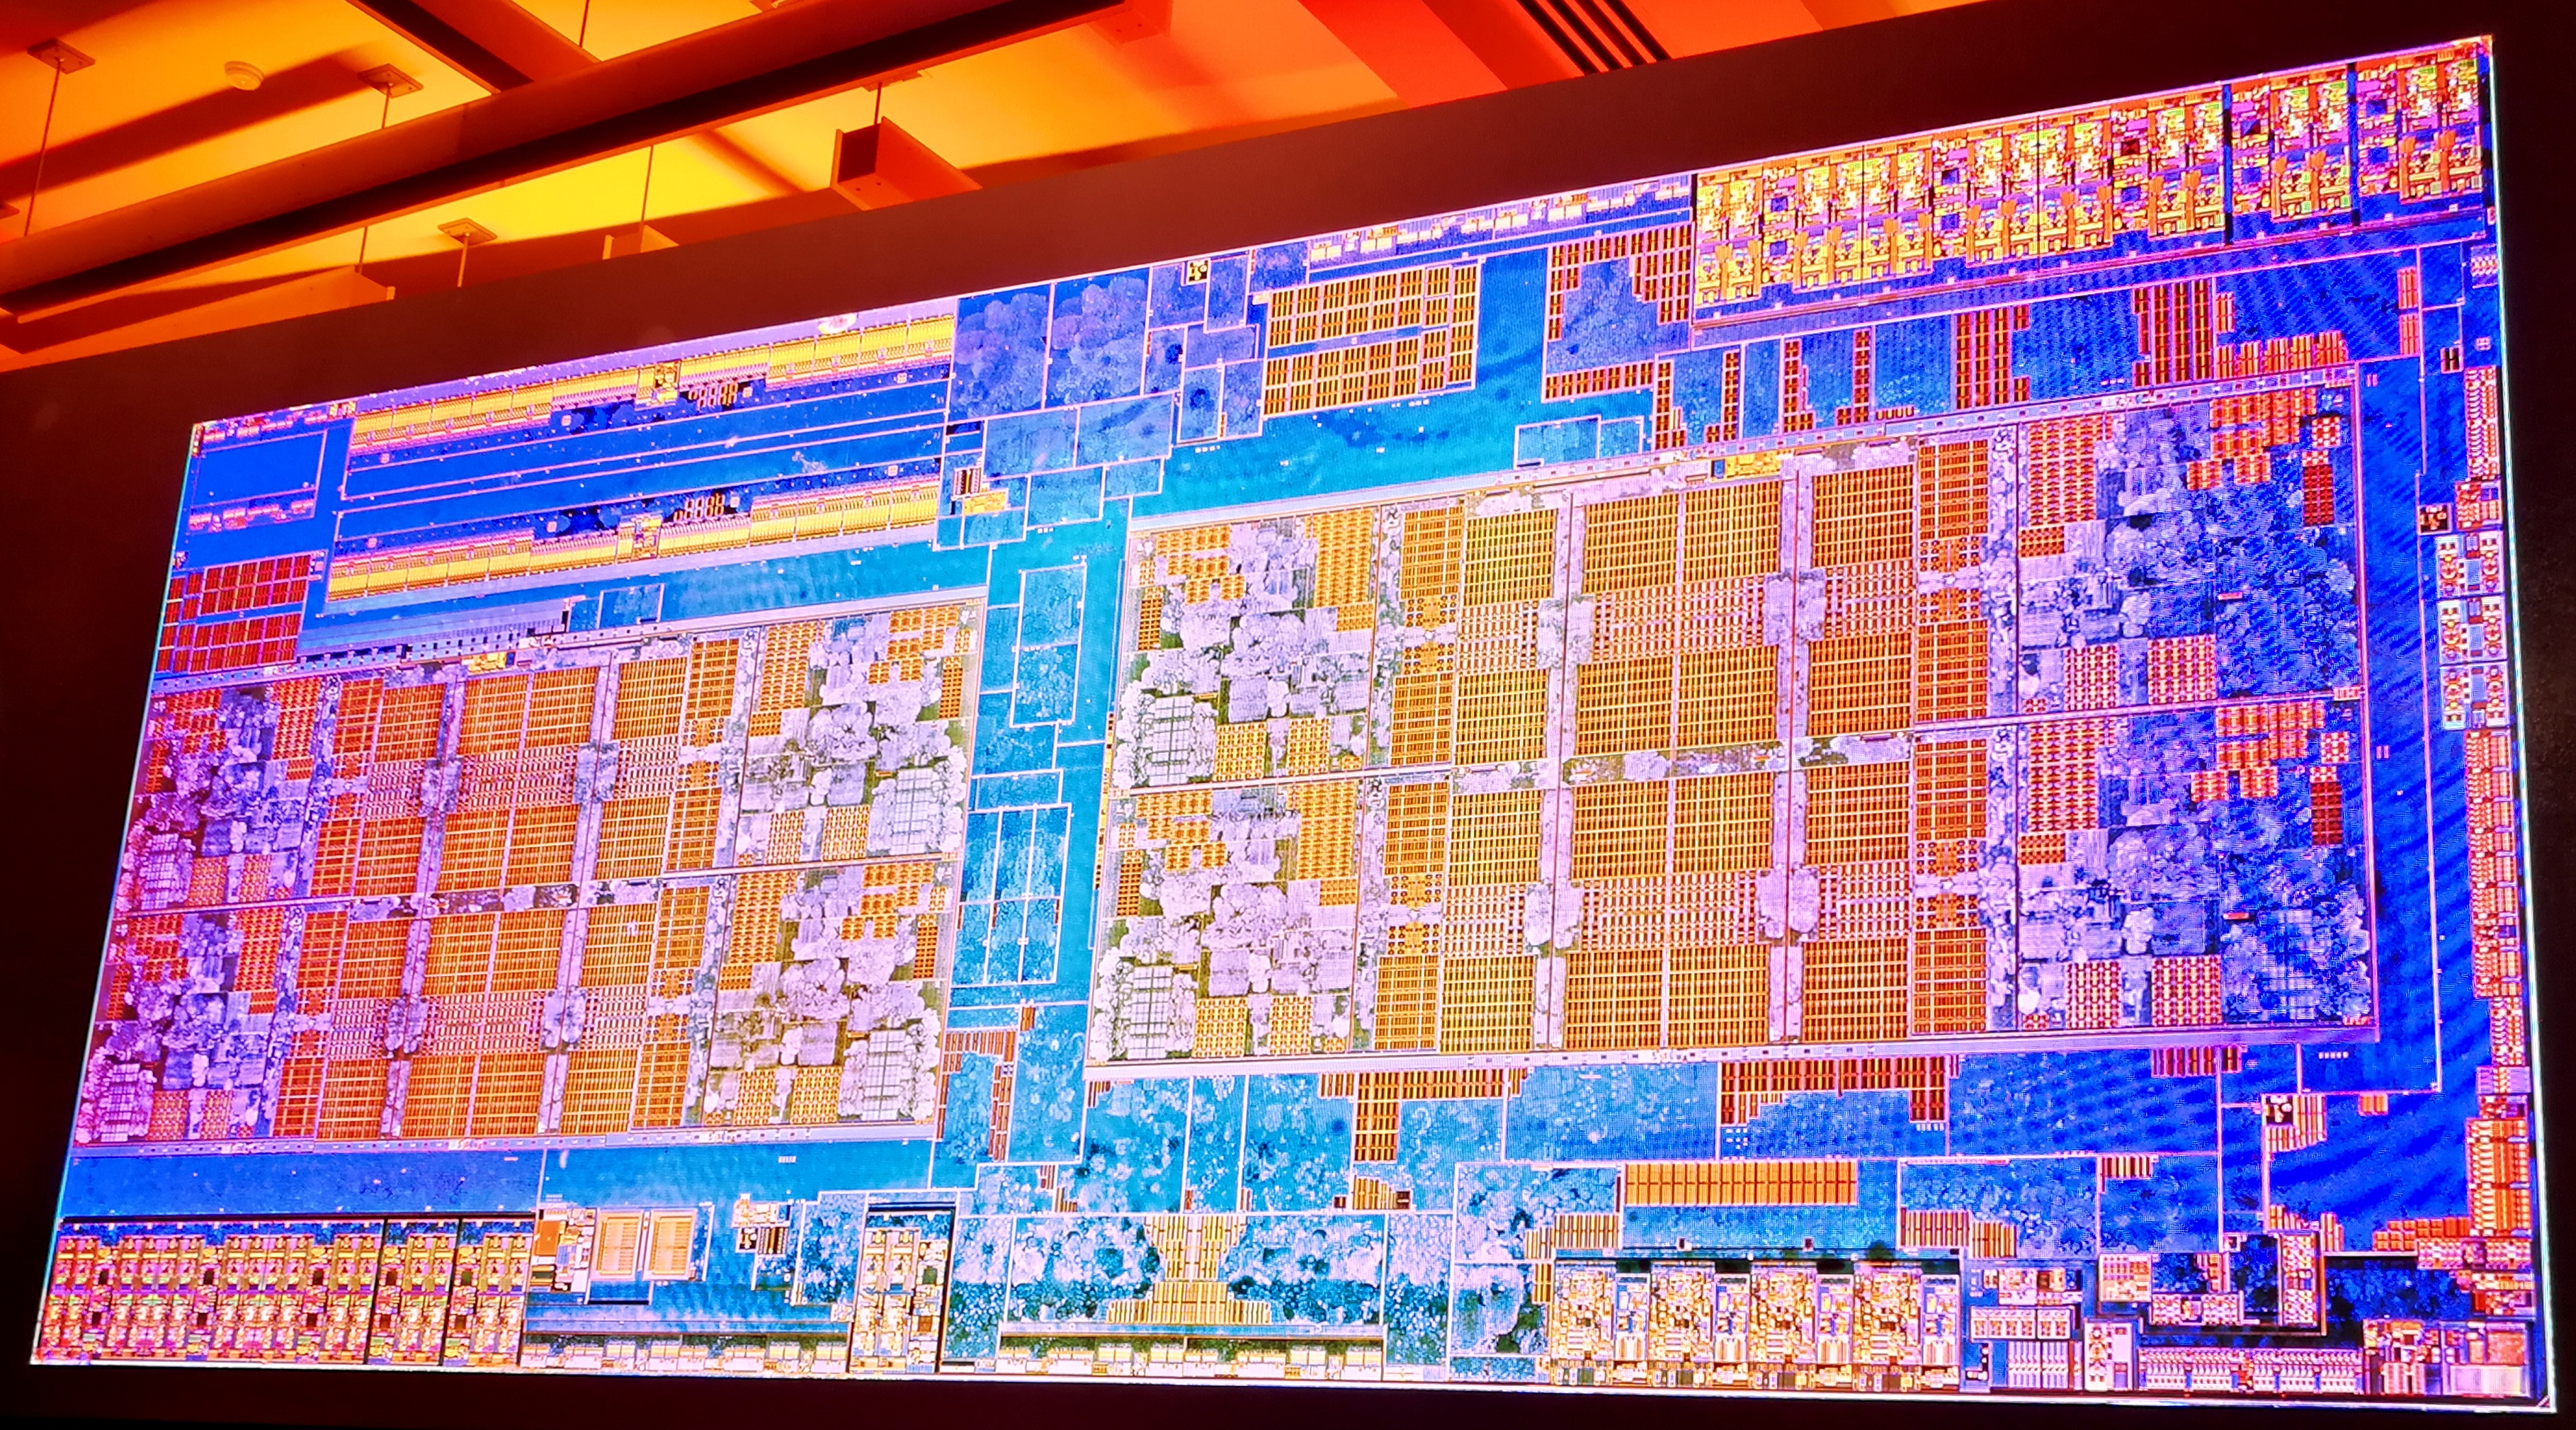
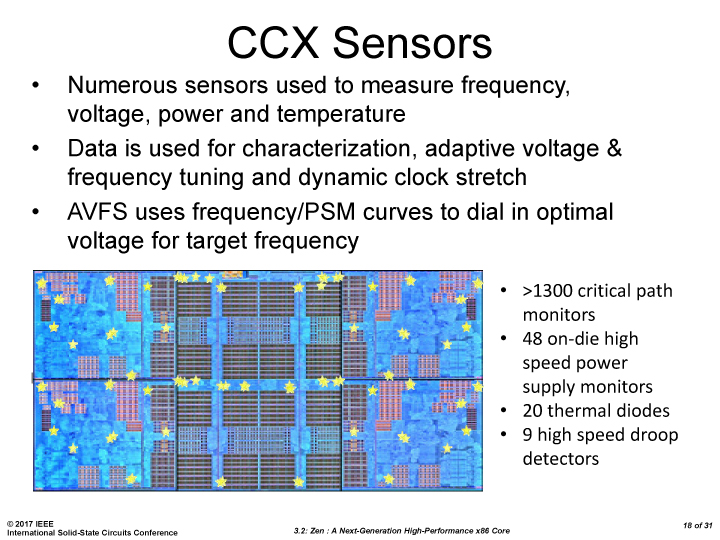
The silicon design consists of two core complexes (CCX) of four cores apiece. Each CCX comes with 512 KB of L2 cache per core, which is disabled when a core is disabled, and each CCX has 8MB of L3 cache which can remain enabled even when cores are disabled. This L3 cache is an exclusive victim cache, meaning that it only accepts evicted L2 cache entries, rather than loading data straight into it (which is how Intel builds their current L3 cache designs).
One of the suggestions regarding Ryzen 7’s performance was about thread migration and scheduling on the core design, especially as core-to-core latency varies depending on where the cores are located (and there’s a jump between CCXes). Despite the use of AMD’s new Infinity Fabric, which is ultimately a superset of HyperTransport, there is still a slightly longer delay jumping over that CCX boundary, although the default Windows scheduler knows how to manage that boundary as demonstrated by Allyn at PCPerspective.
So when dealing with a four-core or six-core CPU, and the base core design has eight-cores, how does AMD cut them up? It is possible for AMD to offer a 4+0, 3+1 or 2+2 design for its quad-core parts, or 4+2 and 3+3 variants for its hexacore parts, similar to the way that Intel cuts up its integrated graphics for GT1 variants.
There are some positives and negatives to each configuration, some of which we have managed to view through this review. The main downside from high level to a configuration split across CCXes, such as a 2+2 or 3+3, is that CCX boundary. Given that the Windows scheduler knows how to deal with this means this is less of an issue, but it is still present.
There are a couple of upsides. Firstly is related to binning – if the 2+2 chips didn’t exist, and AMD only supported 4+0 configurations, then if the binning of such processors was down to silicon defects, fewer silicon dies would be able to be used, as one CCX would have to be perfect. Depending on yield this may or may not be an issue to begin with, but having a 2+2 (and AMD states that all 2+2 configs will be performance equivalent) means more silicon available, driving down cost by having more viable CPUs per wafer out of the fabs.
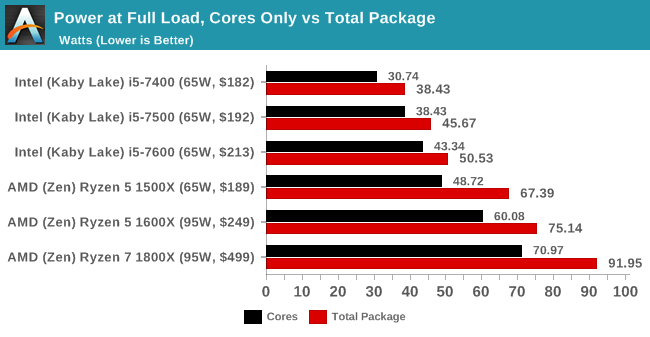
Secondly, there’s the power argument. Logic inside a processor expends energy, and more energy when using a higher voltage/frequency. When placing lots of high-energy logic next to each other, the behavior becomes erratic and the logic has to reduce in voltage/frequency to remain stable. This is why AVX/AVX2 from Intel causes those cores to run at a lower frequency compared to the rest of the core. A similar thing can occur within a CCX: if all four cores of a CCX are loaded (and going by Windows Scheduler that is what happens in order), then the power available to each core has to be reduced to remain stable. Ideally, if there’s no cross communication between threads, you want the computation to be in opposite cores as threads increase. This is not a new concept – some core designs intentionally put in ‘dark silicon’ - silicon of no use apart from providing extra space/area between high power consuming logic. By placing the cores in a 2+2 and 3+3 design for Ryzen 5, this allows the cores to run at a higher power than if they were in 4+0 and 4+2 configurations.
Here’s some power numbers to show this. First, let’s start with a core diagram.
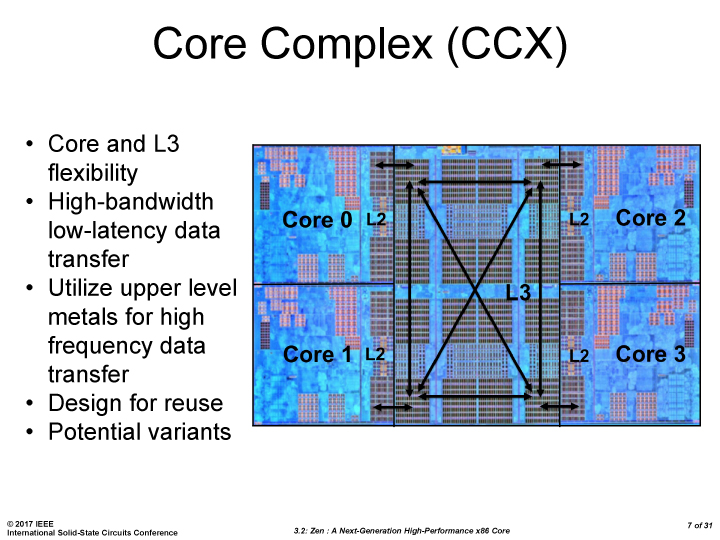
Where exactly the 0/1/2/3 cores are labelled is not really important, except 0-3 are in one CCX and 4-7 are in another CCX. As we load up the cores with two threads each, we can see the power allocation change between them. It is worth noting that the Ryzen cores have a realistic voltage/frequency limit near 4.0-4.1 GHz due to the manufacturing process – getting near or above this frequency requires a lot of voltage, which translates into power.
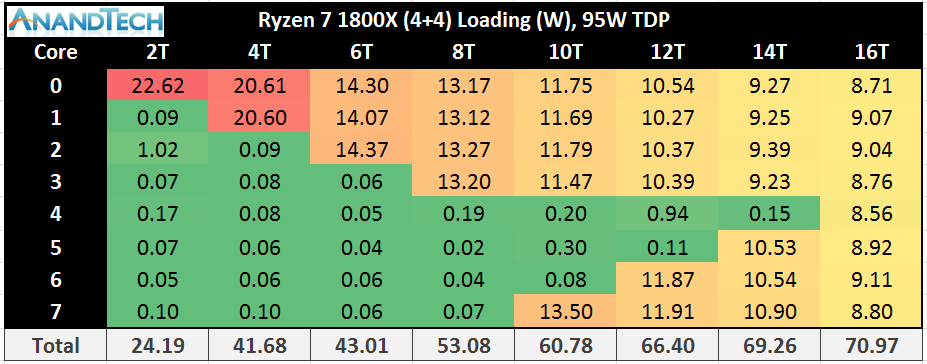
First up is the 1800X, which is a 4+4 configuration with a maximum TDP of 95W. One fully loaded core gets 22.6W, and represents the core at its maximum frequency with XFR also enabled. The same thing happens with two cores fully loaded, but at 20.6 W apiece. Moving onto three cores loaded is where XFR is disabled, and we see the drop to 3.7 GHz is saving power, as we only consume +1.33W compared to the two cores loaded situation. Three to four cores, still all on the same CCX, shows a decrease in power per core.
As we load up the first core of the second CCX, we see an interesting change. The core on CCX-2 has a bigger power allocation than any core in CCX-1. This can be interpreted in two ways: there is more dark silicon around, leading to a higher potential for this core on CCX-2, or that more power is required given the core is on its own. Technically it is still running at the same frequency as the cores on CCX1. Now as we populate the cores on CCX-2, they still consume more power per core until we hit the situation where all cores are loaded and the system is more or less equal.
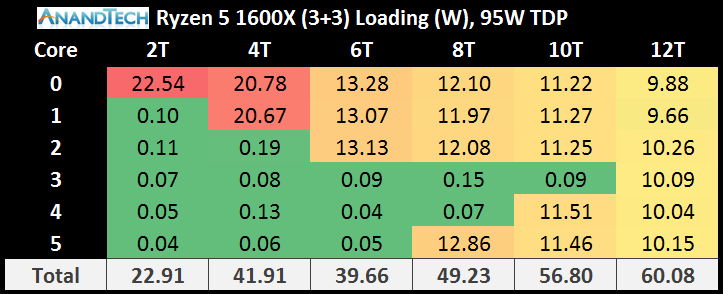
Moving to the Ryzen 5 1600X, which is a 3+3 configuration, nets more of the same. During XFR with one or two cores loaded, the power consumption is high. As we move onto the second CCX, the cores on CCX-2 consumer more power per core than those already loaded on CCX-1.
It is worth noting here that the jump from two cores loaded to three cores loaded on the 3+3 gives a drop in the total power consumption of the cores. Checking my raw data numbers, and this also translates to a total package power drop as well, showing how much extra effort it is to run these cores near 4.0 GHz with XFR enabled.
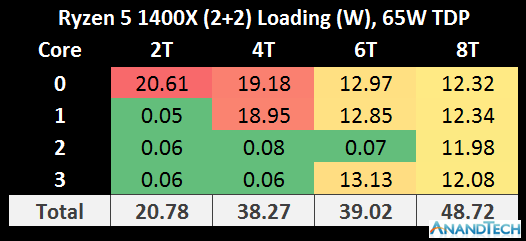
On the Ryzen 5 1500X, using a 2+2 configuration, the situation is again duplicated. The hard comparison here is the 2+2 of the 1500X to the 4+0 on the 1800X, because the TDP of each of the processors is different.
It should be noted however the total package power consumption (cores plus IO plus memory controller and so on) is actually another 10W or so above these numbers per chip.
The cache configurations play an important role in the power consumption numbers as well. In a 3+3 or a 2+2 configuration, despite one or two cores per CCX being disabled, the L3 cache is still fully enabled in these processors. As a result, cutting 25% of the cores doesn’t cut 25% of the total core power, depending on how the L3 cache is being used.
Nonetheless, the Ryzen 5 1600X, despite being at the same rated TDP as the Ryzen 7 1800X, does not get close to matching the power consumption. This ropes back into the point at the top of the page – usually we see fewer cores giving a higher frequency to match the power consumption with parts that have more cores. Because the silicon design has such a high barrier to get over 4.0 GHz with voltage and power, AMD has decided that it is too big a jump to remain stable, but still given the 1600X the higher TDP rating anyway. This may be a nod to the fact that it will cause users to go out and buy bigger cooling solutions, providing sufficient headroom for Turbo modes and XFR, giving better performance.
Despite this, we see the 1800X and 1500X each tear their TDP rating for power consumption (92W vs 95W and 67W vs 65W respectively).
However, enough talking about the power consumption. Time for benchmarks!
Test Bed Setup
As per our processor testing policy, we take a premium category motherboard suitable for the socket, and equip the system with a suitable amount of memory running at the manufacturer's maximum supported frequency. This is also typically run at JEDEC subtimings where possible. It is noted that some users are not keen on this policy, stating that sometimes the maximum supported frequency is quite low, or faster memory is available at a similar price, or that the JEDEC speeds can be prohibitive for performance. While these comments make sense, ultimately very few users apply memory profiles (either XMP or other) as they require interaction with the BIOS, and most users will fall back on JEDEC supported speeds - this includes home users as well as industry who might want to shave off a cent or two from the cost or stay within the margins set by the manufacturer. Where possible, we will extend out testing to include faster memory modules either at the same time as the review or a later date.
| Test Setup | |
| Processor | AMD Ryzen 5 1600X (6C/12T, 3.6G, 95W) AMD Ryzen 5 1500X (4C/8T, 3.5G, 65W) |
| Motherboards | ASUS Crosshair VI Hero |
| Cooling | Noctua NH-U12S SE-AM4 |
| Power Supply | Corsair AX860i |
| Memory | Corsair Vengeance DDR4-3000 C15 2x8GB |
| Memory Settings | DDR4-2400 C15 |
| Video Cards | MSI GTX 1080 Gaming X 8GB ASUS GTX 1060 Strix 6GB Sapphire Nitro R9 Fury 4GB Sapphire Nitro RX 480 8GB Sapphire Nitro RX 460 4GB (CPU Tests) |
| Hard Drive | Crucial MX200 1TB |
| Optical Drive | LG GH22NS50 |
| Case | Open Test Bed |
| Operating System | Windows 10 Pro 64-bit |
Hardware
We must thank the following companies for kindly providing hardware for our multiple test beds. Some of this hardware is not in this test bed specifically, but is used in other testing.
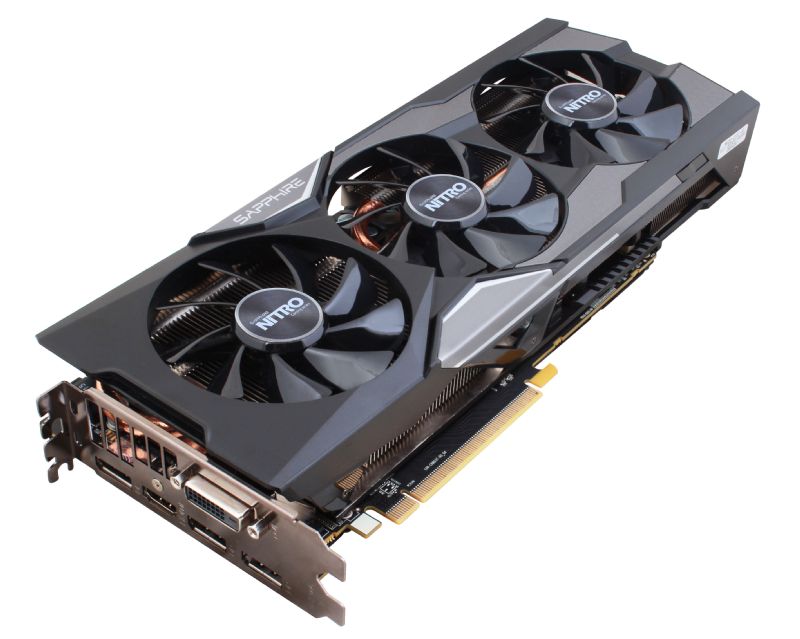
Thank you to Sapphire for providing us with several of their AMD GPUs. We met with Sapphire back at Computex 2016 and discussed a platform for our future testing on AMD GPUs with their hardware for several upcoming projects. As a result, they were able to sample us the latest silicon that AMD has to offer. At the top of the list was a pair of Sapphire Nitro R9 Fury 4GB GPUs, based on the first generation of HBM technology and AMD’s Fiji platform. As the first consumer GPU to use HDM, the R9 Fury is a key moment in graphics history, and this Nitro cards come with 3584 SPs running at 1050 MHz on the GPU with 4GB of 4096-bit HBM memory at 1000 MHz.
Further Reading: AnandTech’s Sapphire Nitro R9 Fury Review
Following the Fury, Sapphire also supplied a pair of their latest Nitro RX 480 8GB cards to represent AMD’s current performance silicon on 14nm (as of March 2017). The move to 14nm yielded significant power consumption improvements for AMD, which combined with the latest version of GCN helped bring the target of a VR-ready graphics card as close to $200 as possible. The Sapphire Nitro RX 480 8GB OC graphics card is designed to be a premium member of the RX 480 family, having a full set of 8GB of GDDR5 memory at 6 Gbps with 2304 SPs at 1208/1342 MHz engine clocks.
Further Reading: AnandTech’s AMD RX 480 Review
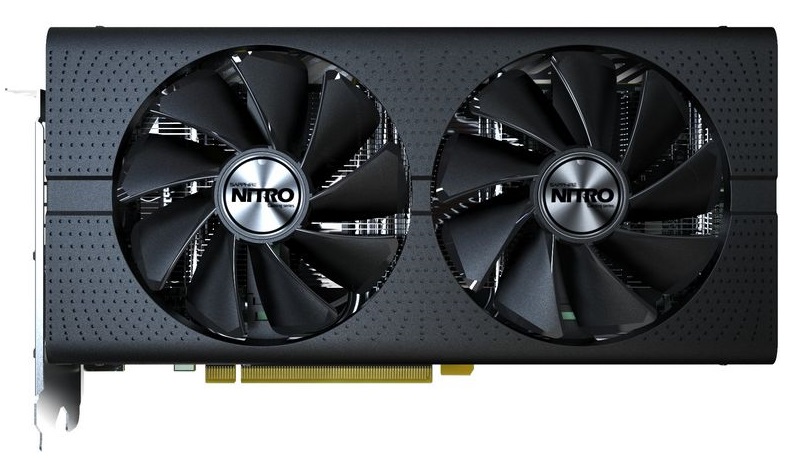
With the R9 Fury and RX 480 assigned to our gaming tests, Sapphire also passed on a pair of RX 460s to be used as our CPU testing cards. The amount of GPU power available can have a direct effect on CPU performance, especially if the CPU has to spend all its time dealing with the GPU display. The RX 460 is a nice card to have here, as it is powerful yet low on power consumption and does not require any additional power connectors. The Sapphire Nitro RX 460 2GB still follows on from the Nitro philosophy, and in this case is designed to provide power at a low price point. Its 896 SPs run at 1090/1216 MHz frequencies, and it is paired with 2GB of GDDR5 at an effective 7000 MHz.

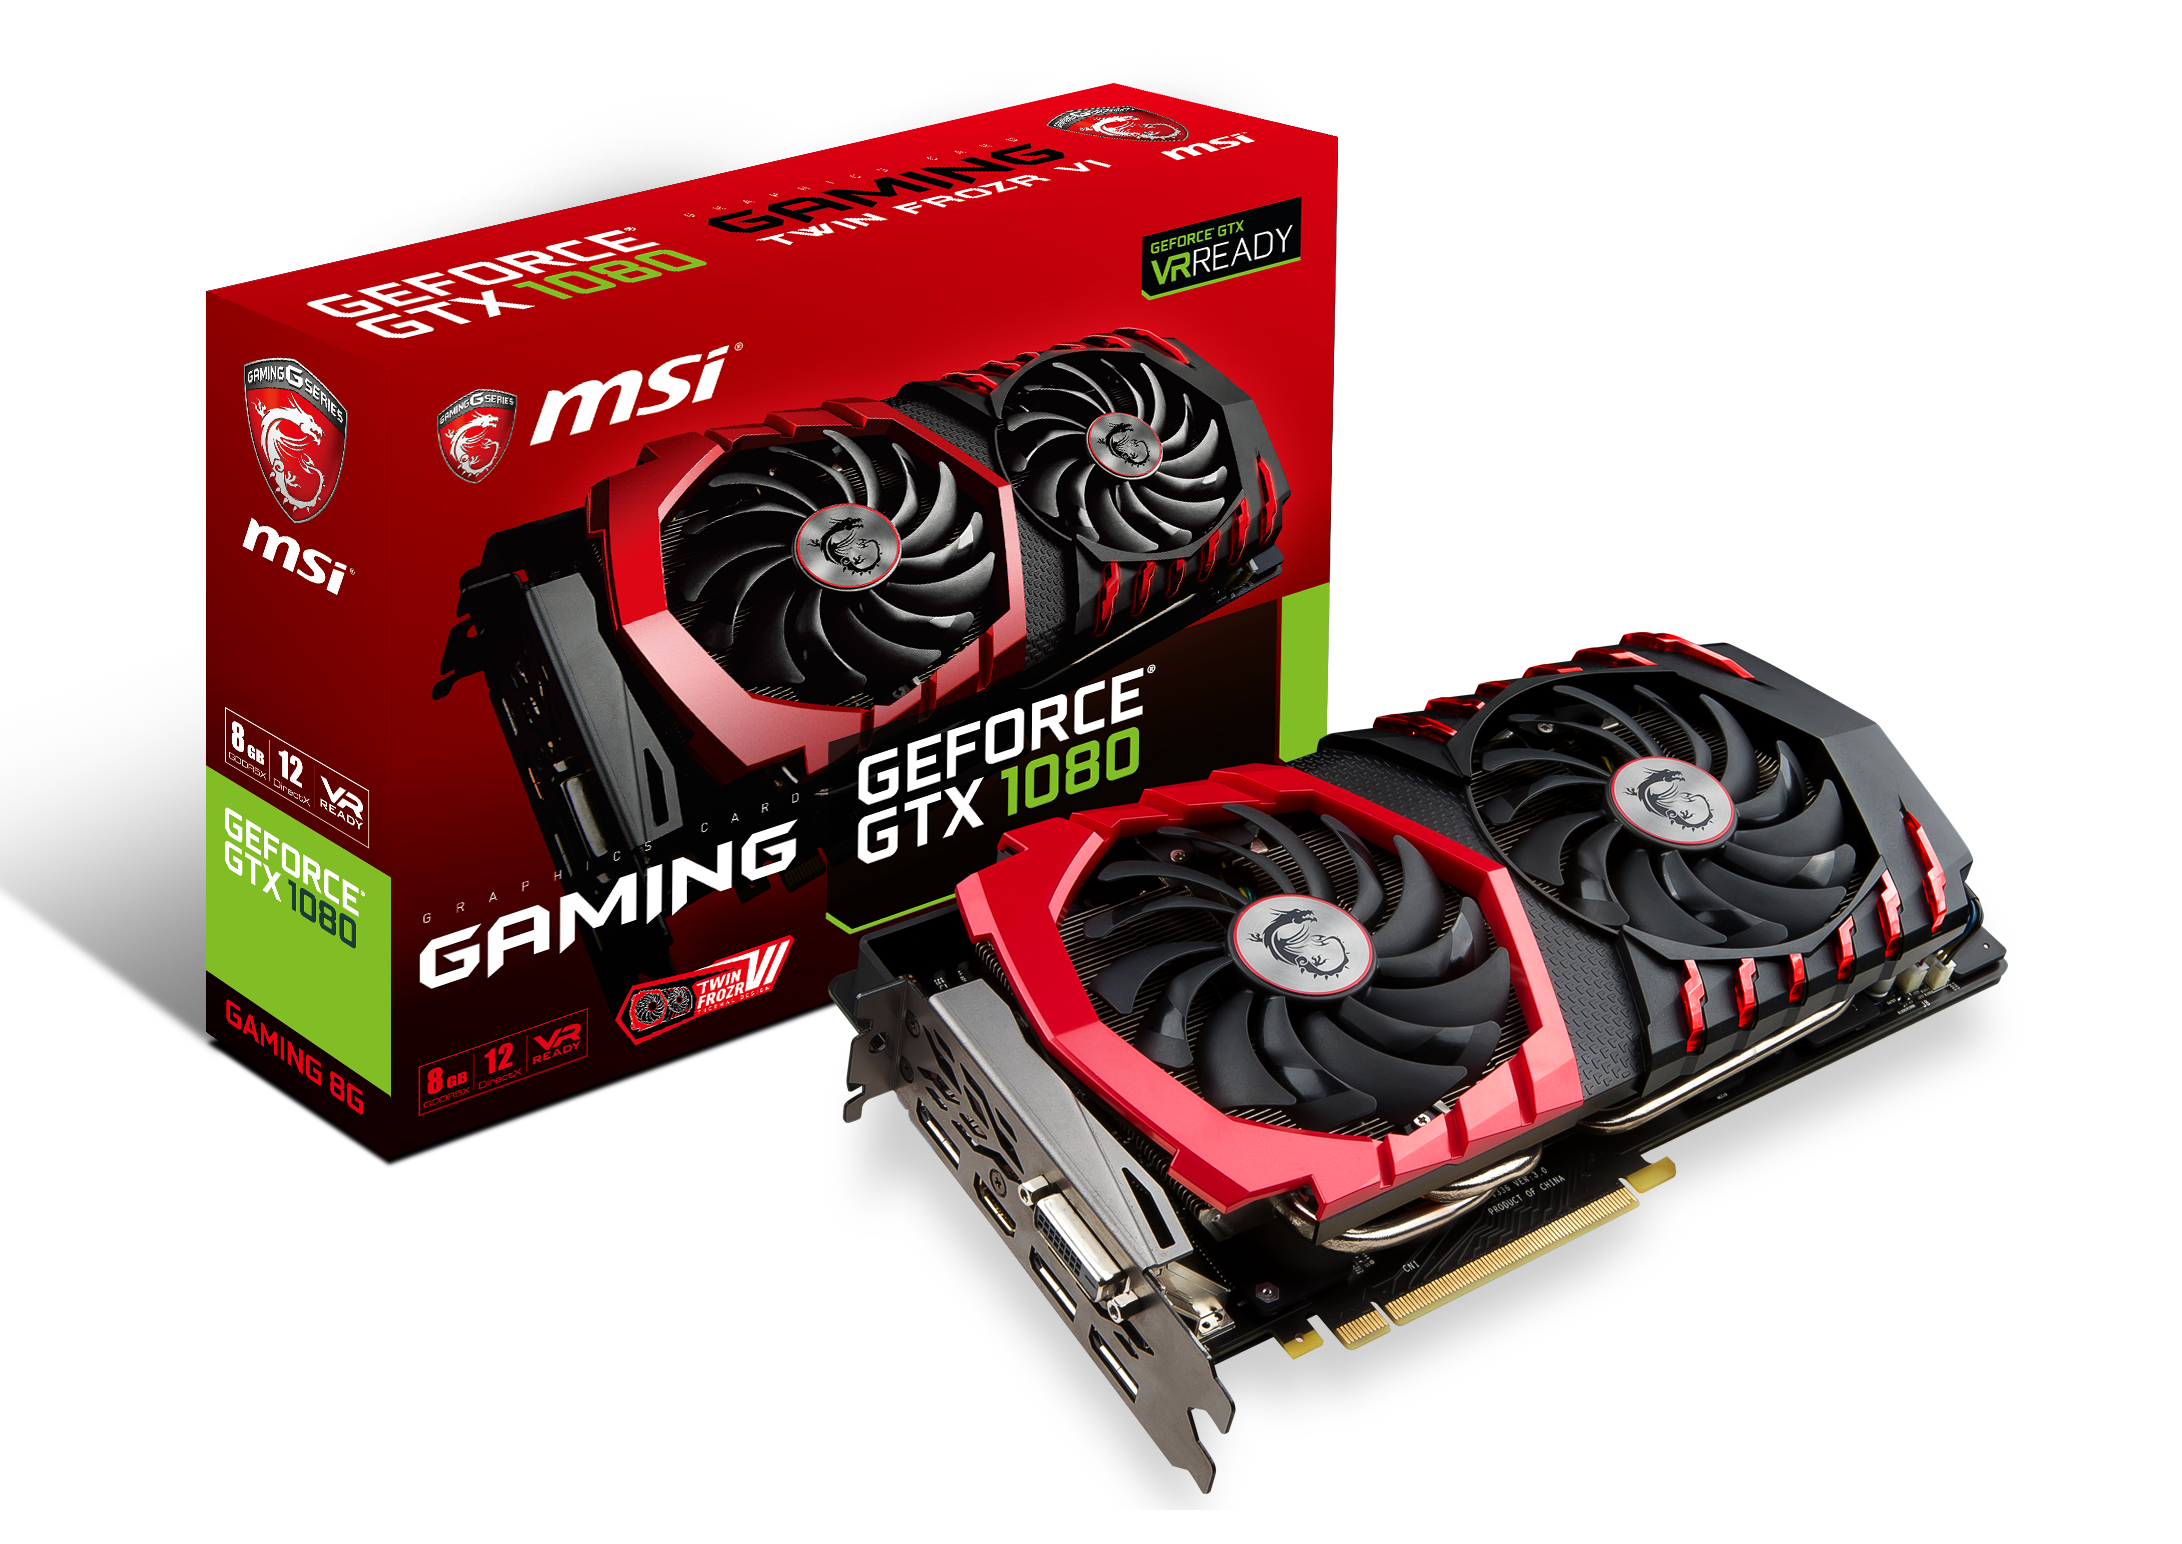
We must also say thank you to MSI for providing us with their GTX 1080 Gaming X 8GB GPUs. Despite the size of AnandTech, securing high-end graphics cards for CPU gaming tests is rather difficult. MSI stepped up to the plate in good fashion and high spirits with a pair of their high-end graphics. The MSI GTX 1080 Gaming X 8GB graphics card is their premium air cooled product, sitting below the water cooled Seahawk but above the Aero and Armor versions. The card is large with twin Torx fans, a custom PCB design, Zero-Frozr technology, enhanced PWM and a big backplate to assist with cooling. The card uses a GP104-400 silicon die from a 16nm TSMC process, contains 2560 CUDA cores, and can run up to 1847 MHz in OC mode (or 1607-1733 MHz in Silent mode). The memory interface is 8GB of GDDR5X, running at 10010 MHz. For a good amount of time, the GTX 1080 was the card at the king of the hill.
Further Reading: AnandTech’s NVIDIA GTX 1080 Founders Edition Review
Thank you to ASUS for providing us with their GTX 1060 6GB Strix GPU. To complete the high/low cases for both AMD and NVIDIA GPUs, we looked towards the GTX 1060 6GB cards to balance price and performance while giving a hefty crack at >1080p gaming in a single graphics card. ASUS lent a hand here, supplying a Strix variant of the GTX 1060. This card is even longer than our GTX 1080, with three fans and LEDs crammed under the hood. STRIX is now ASUS’ lower cost gaming brand behind ROG, and the Strix 1060 sits at nearly half a 1080, with 1280 CUDA cores but running at 1506 MHz base frequency up to 1746 MHz in OC mode. The 6 GB of GDDR5 runs at a healthy 8008 MHz across a 192-bit memory interface.
Further Reading: AnandTech’s ASUS GTX 1060 6GB STRIX Review

Thank you to Corsair for providing us with AX860i PSUs.
Thank you to Crucial for providing us with MX200 SSDs.
Thank you to ASRock for providing us with Gaming G10 Routers.
Thank you to Silverstone for providing us with Intel CPU Coolers, Fans and HDMI Cables.
Benchmarking Suite 2017
2017 CPU
For our Ryzen review, we are implementing our new CPU testing benchmark suite, fully scripted as of 2/17. This means that with a fresh OS install, we can configure the OS to be more consistent, install the new benchmarks, maintain version consistency without random updates and start running the tests in under 5 minutes. After that it's a one button press to start an 8-10hr test (with a high-performance core) with nearly 100 relevant data points in the benchmarks given below. The tests cover a wide range of segments, some of which will be familiar but some of the tests are new to benchmarking in general, but still highly relevant for the markets they come from.
Our new CPU tests go through six main areas. We cover the Web (we've got an un-updateable version of Chrome 56), general system tests (opening tricky PDFs, emulation, brain simulation, AI, 2D image to 3D model conversion), rendering (ray tracing, modeling), encoding (compression, AES, h264 and HEVC), office based tests (PCMark and others), and our legacy tests, throwbacks from another generation of bad code but interesting to compare.
A side note on OS preparation. As we're using Windows 10, there's a large opportunity for something to come in and disrupt our testing. So our default strategy is multiple: disable the ability to update as much as possible, disable Windows Defender, uninstall OneDrive, disable Cortana as much as possible, implement the high performance mode in the power options, and disable the internal platform clock which can drift away from being accurate if the base frequency drifts (and thus the timing ends up inaccurate).
Web Tests on Chrome 56
Sunspider
Kraken
Octane
Web13
Web15
PDF Opening
FCAT
3DPM v21
Dolphin v5.0
DigiCortex v1.20
Agisoft PS v1.0
Corona
Blender 2.78.1
LuxMark CPU C++
LuxMark CPU OpenCL
POV-Ray
CB15 ST
CB15 MT
7-Zip
WinRAR
TrueCrypt
HandBrake 264-LQ
HandBrake 264-HQ
HandBrake 265-4K (reworked from Ryzen 7 review)
PCMark8
Chromium Compile (new for Ryzen 5)
SYSmark 2014 / SE
Legacy Tests
3DPM v1 ST / MT
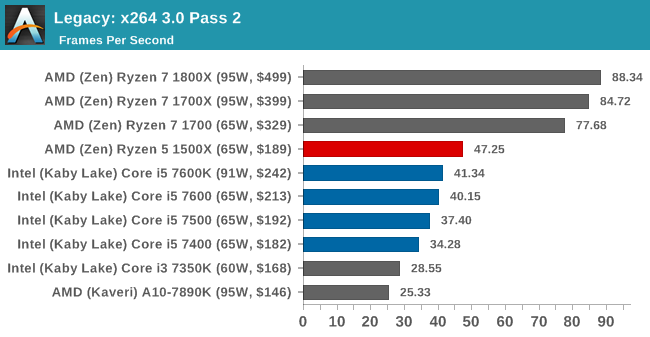
x264 HD 3 Pass 1, Pass 2
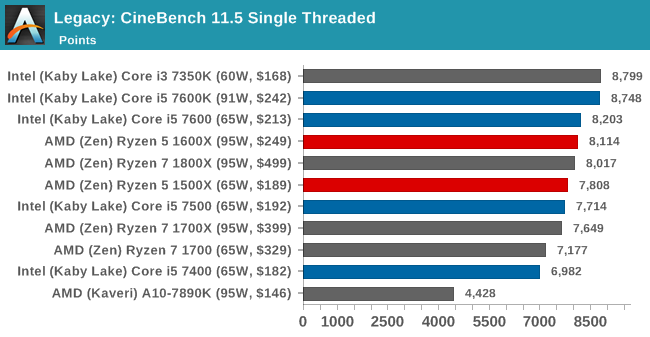
CB 11.5 ST / MT
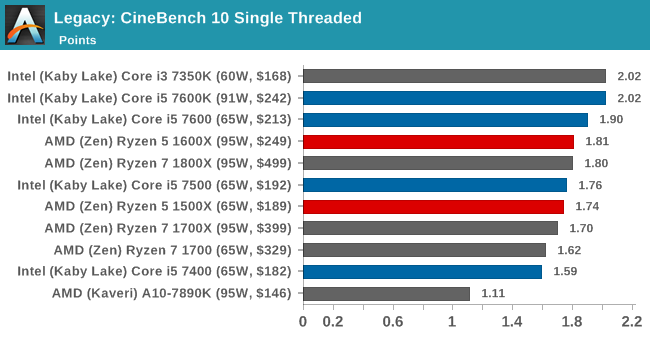
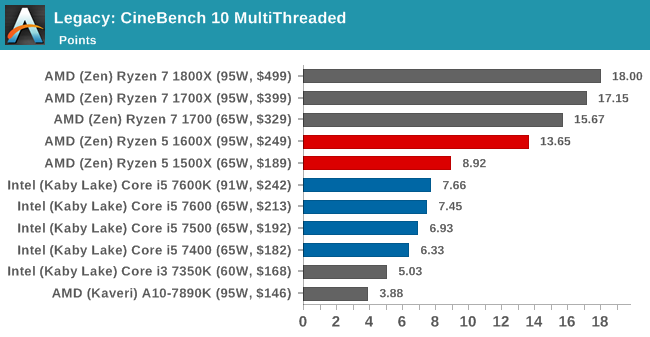
CB 10 ST / MT
A side note - a couple of benchmarks (LuxMark) weren't fully 100% giving good data during testing. Need to go back and re-work this part of our testing.
2017 GPU
For our new set of GPU tests, we wanted to think big. There are a lot of users in the ecosystem that prioritize gaming above all else, especially when it comes to choosing the correct CPU. If there's a chance to save $50 and get a better graphics card for no loss in performance, then this is the route that gamers would prefer to tread. The angle here though is tough - lots of games have different requirements and cause different stresses on a system, with various graphics cards having different reactions to the code flow of a game. Then users also have different resolutions and different perceptions of what feels 'normal'. This all amounts to more degrees of freedom than we could hope to test in a lifetime, only for the data to become irrelevant in a few months when a new game or new GPU comes into the mix. Just for good measure, let us add in DirectX 12 titles that make it easier to use more CPU cores in a game to enhance fidelity.
Our original list of nine games planned in February quickly became six, due to the lack of professional-grade controls on Ubisoft titles. If you want to see For Honor, Steep or Ghost Recon: Wildlands benchmarked on AnandTech, point Ubisoft Annecy or Ubisoft Montreal in my direction. While these games have in-game benchmarks worth using, unfortunately they do not provide enough frame-by-frame detail to the end user, despite using it internally to produce the data the user eventually sees (and it typically ends up obfuscated by another layer as well). I would instead perhaps choose to automate these benchmarks via inputs, however the extremely variable loading time is a strong barrier to this.
So we have the following benchmarks as part of our 4/2 script, automated to the point of a one-button run and out pops the results four hours later, per GPU. Also listed are the resolutions and settings used.
Civilization 6 (1080p Ultra, 4K Ultra)
Ashes of the Singularity: Escalation* (1080p Extreme, 4K Extreme)
Shadow of Mordor (1080p Ultra, 4K Ultra)
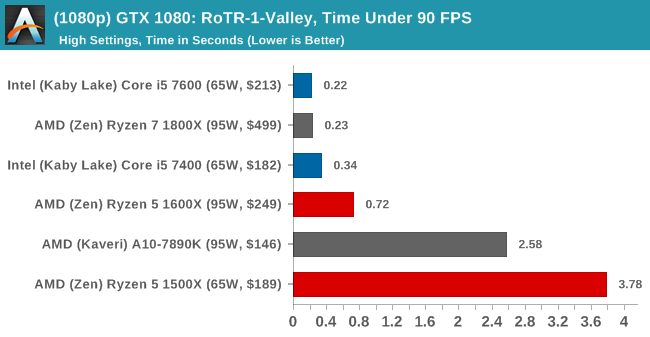
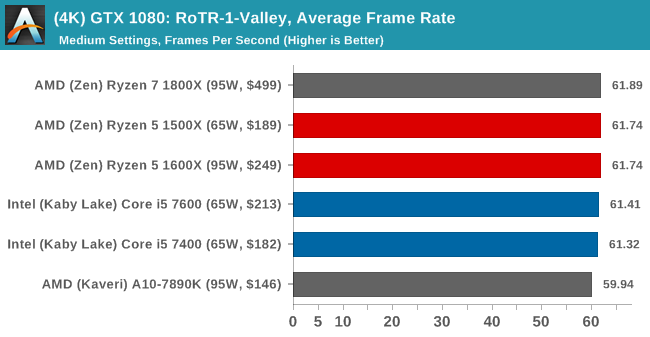
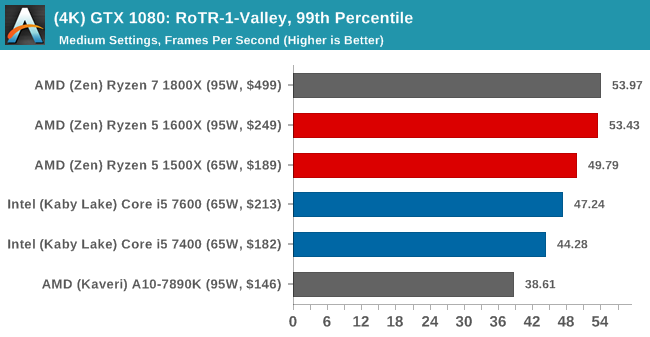
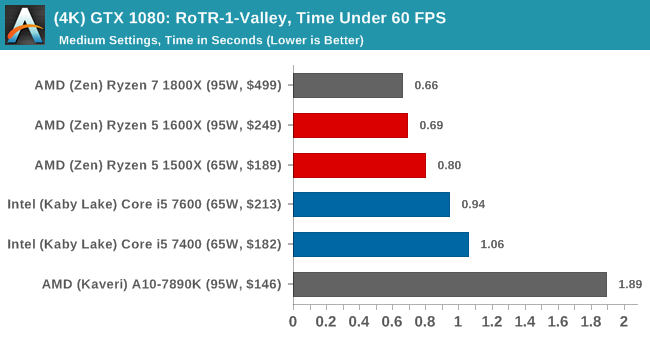
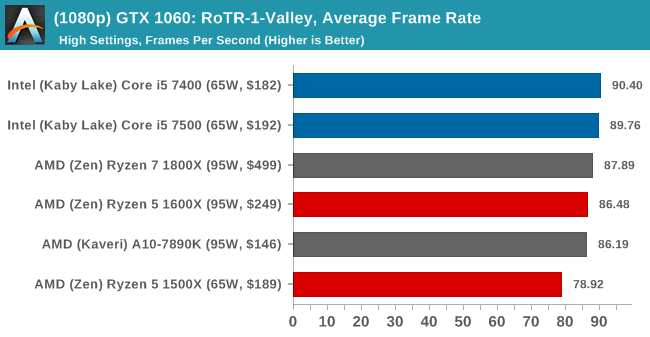
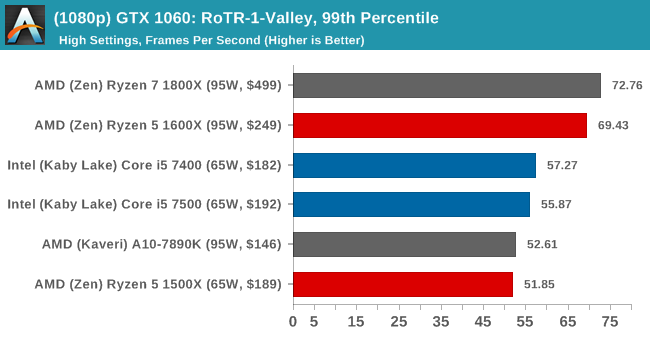
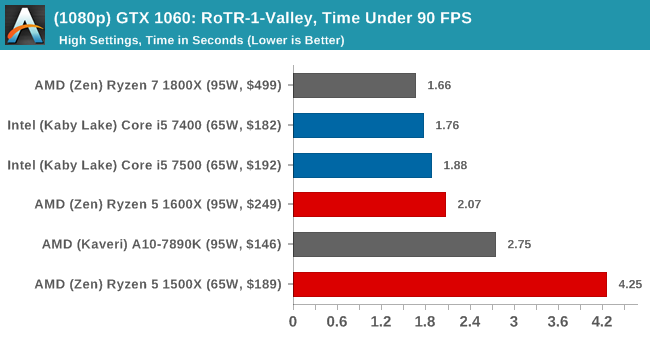
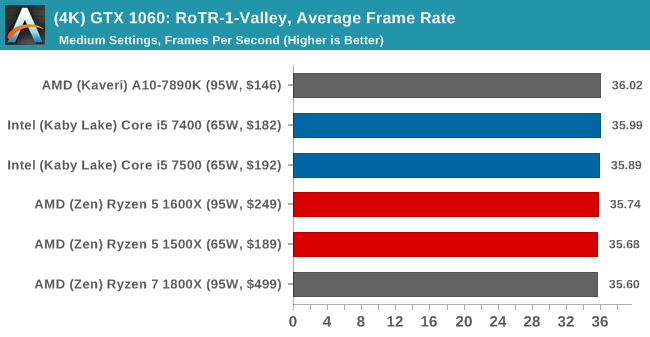
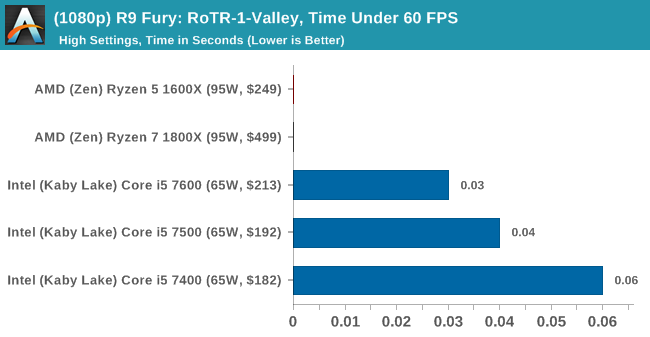
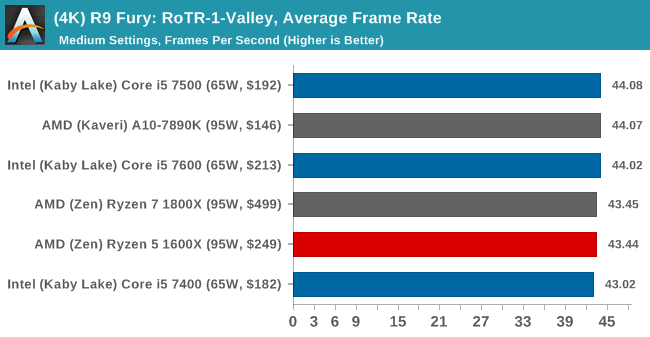
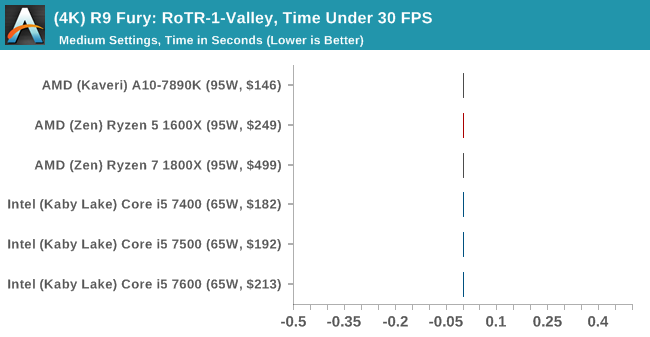
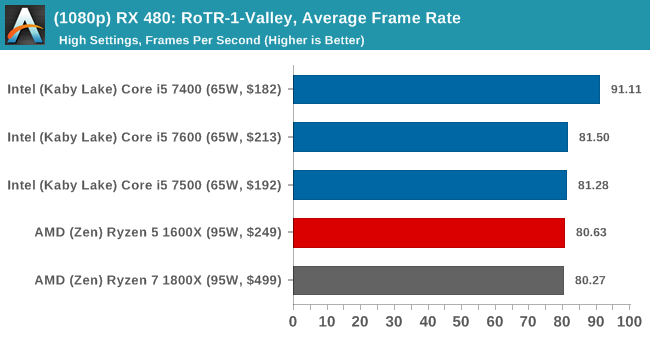
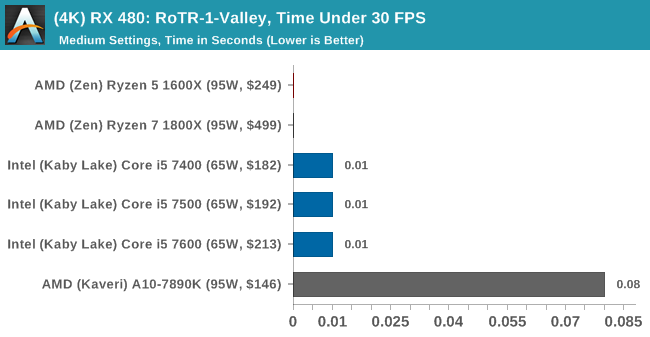
Rise of the Tomb Raider #1 - GeoValley (1080p High, 4K Medium)
Rise of the Tomb Raider #2 - Prophets (1080p High, 4K Medium)
Rise of the Tomb Raider #3 - Mountain (1080p High, 4K Medium)
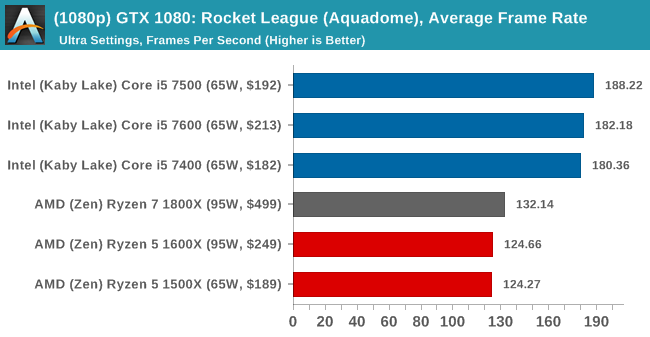
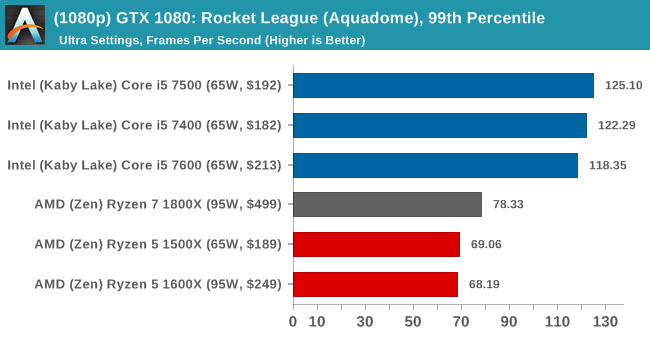
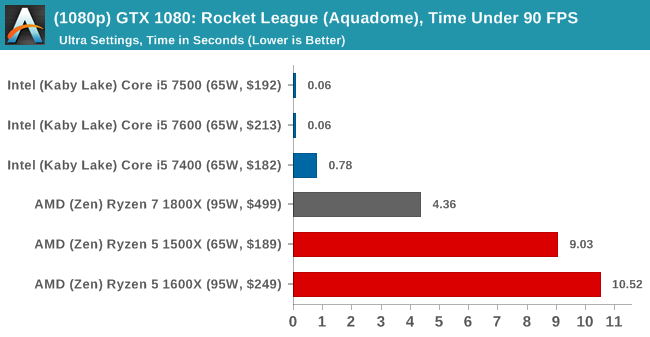
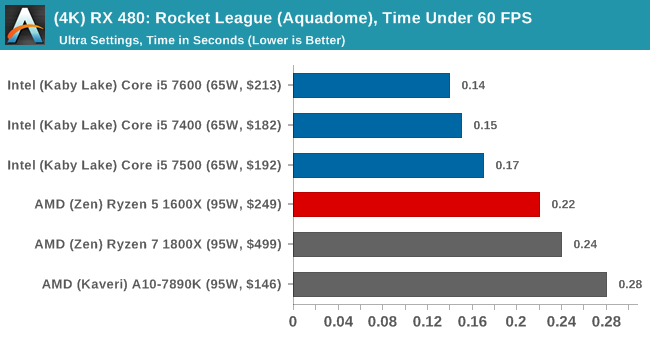
Rocket League (1080p Ultra, 4K Ultra)
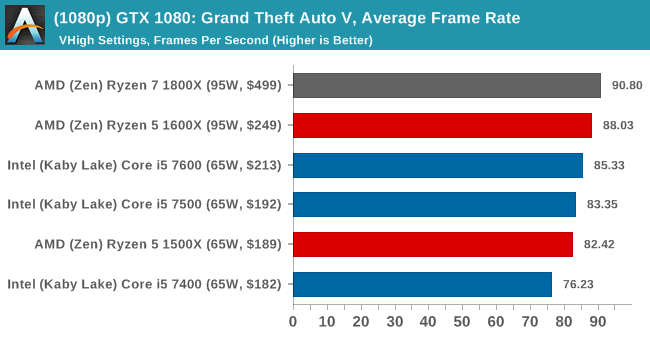
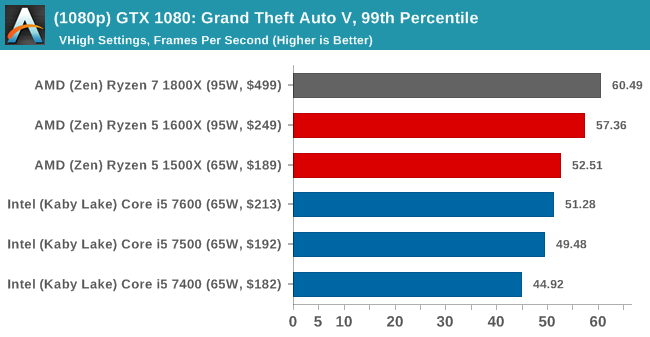
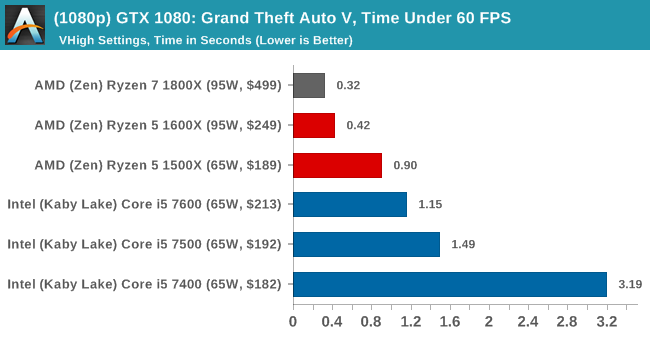
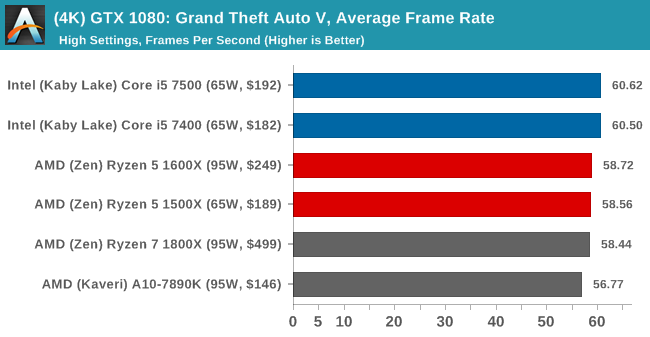
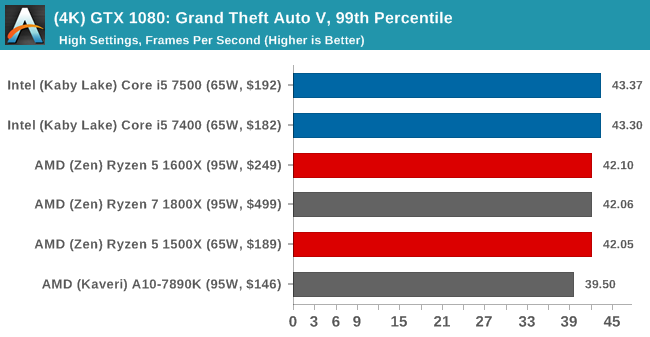
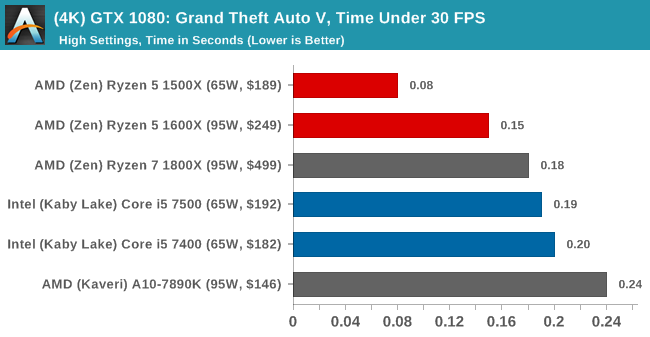
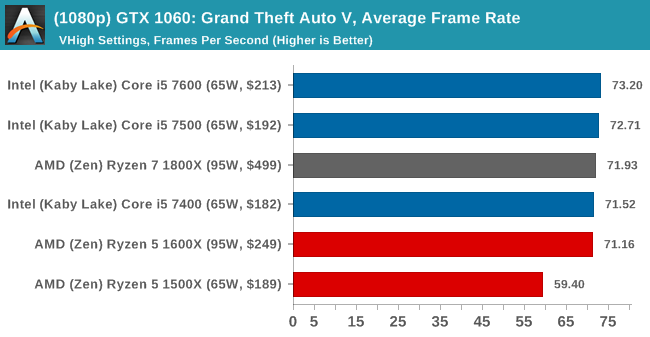
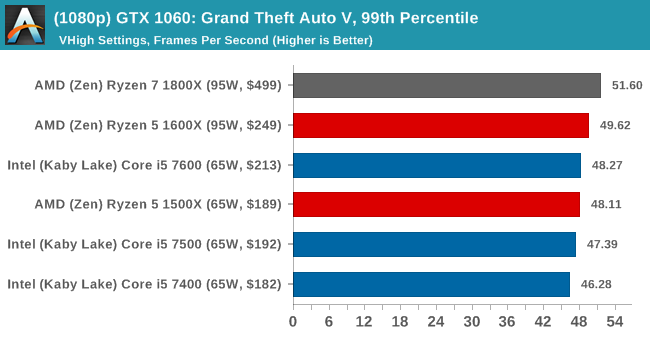
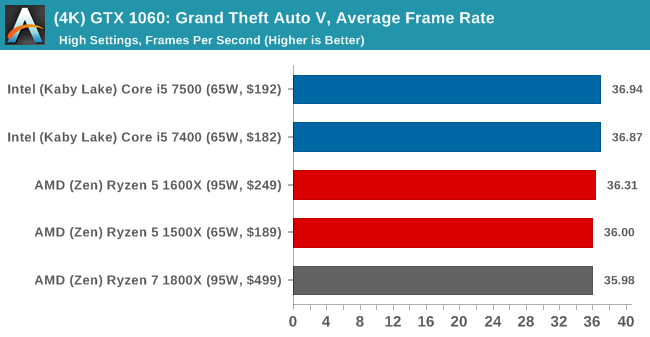
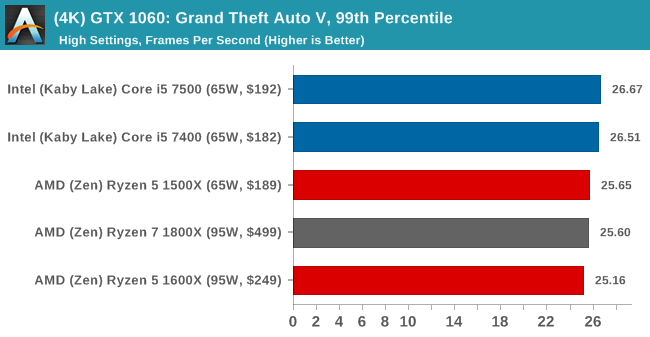
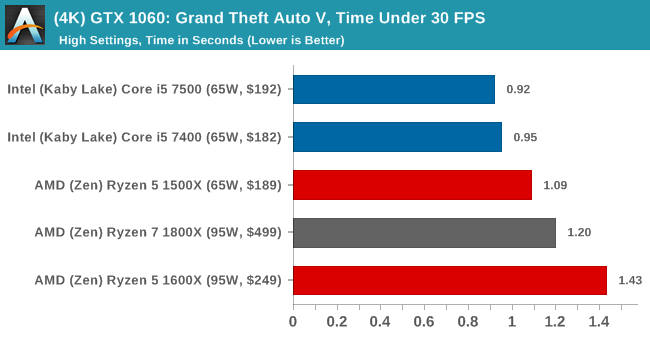
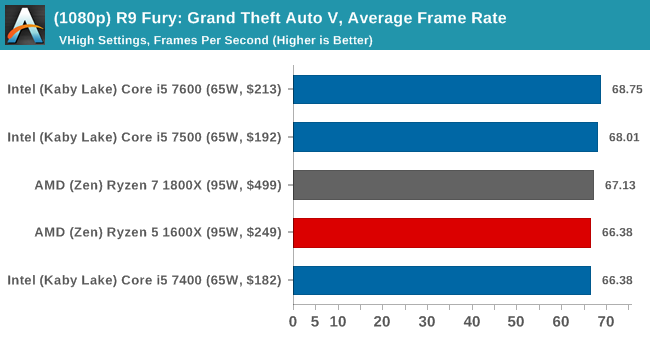
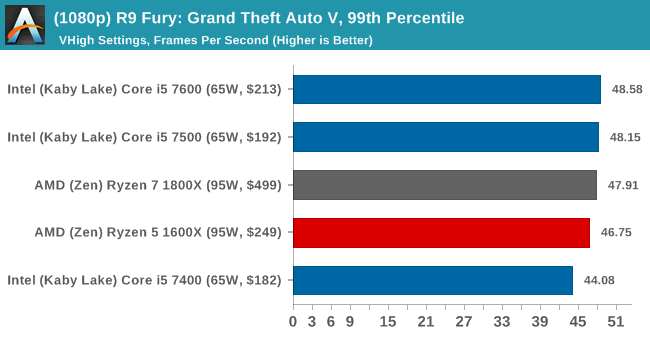
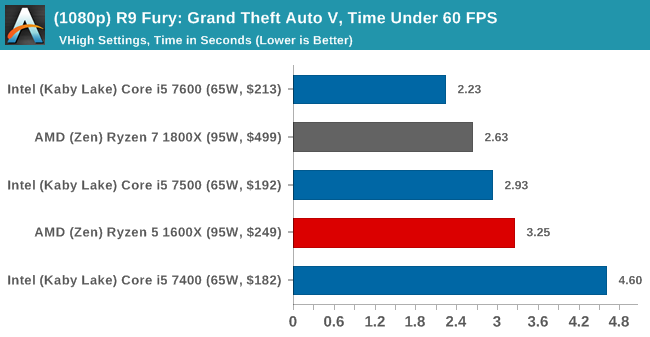
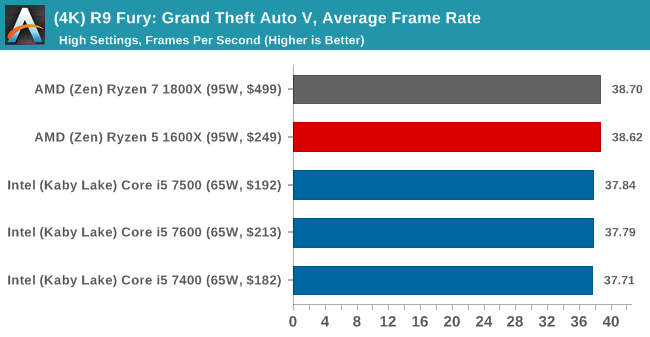
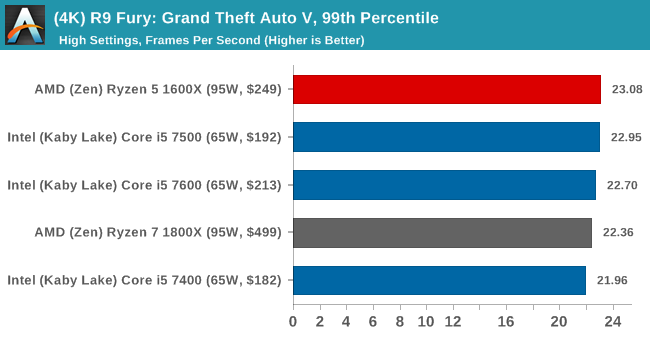
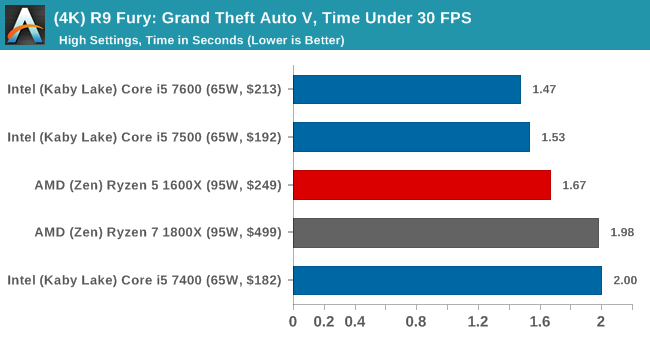
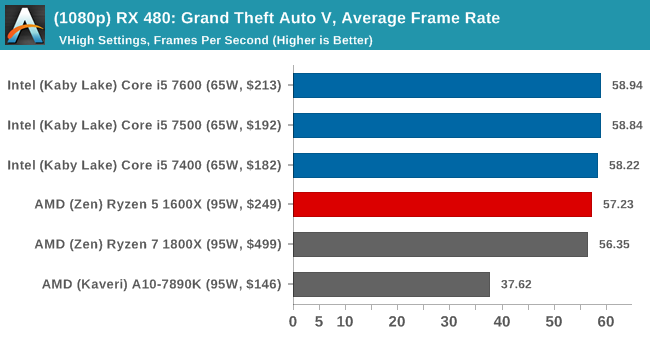
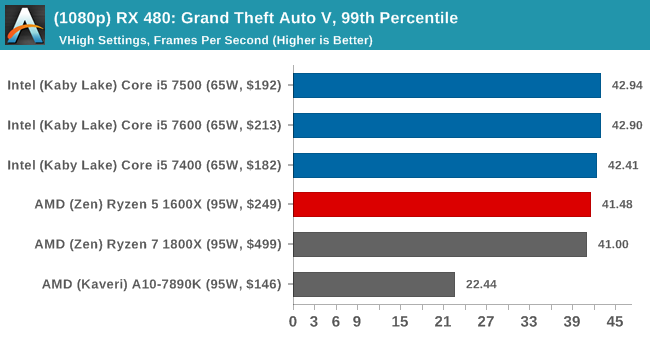
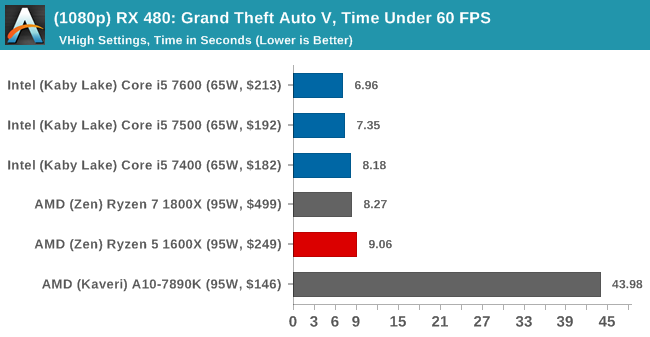
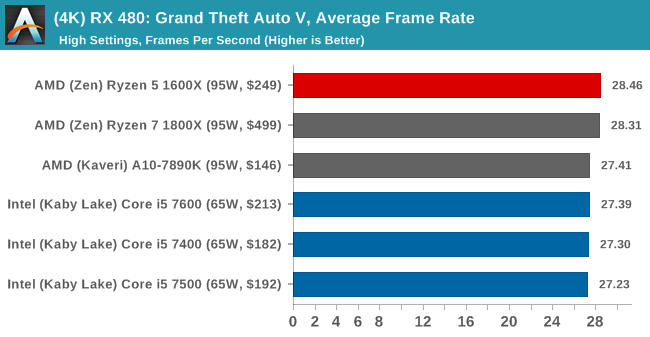
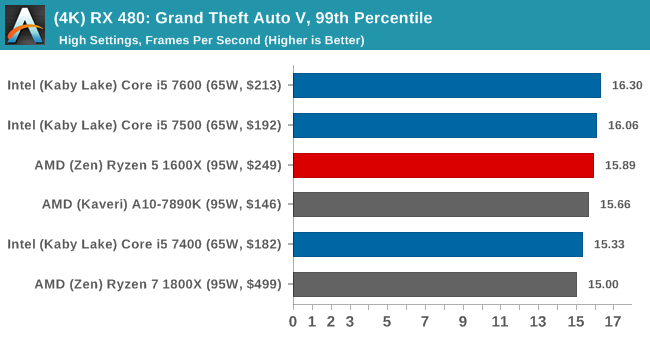
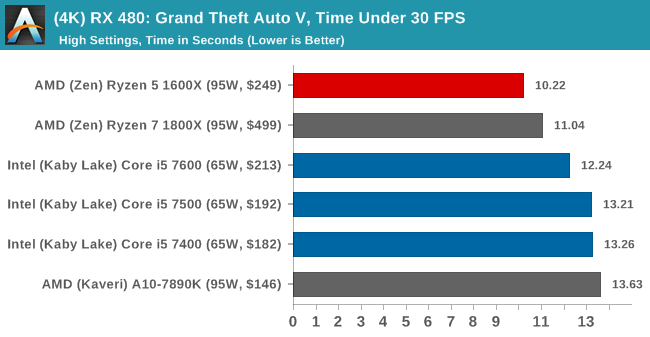
Grand Theft Auto V (1080p Very High, 4K High)
For each of the GPUs in our testing, these games (at each resolution/setting combination) are run four times each, with outliers discarded. Average frame rates, 99th percentiles and 'Time Under x FPS' data is sorted, and the raw data is archived.
The four GPUs we've managed to obtain for these tests are:

MSI GTX 1080 Gaming X 8G
ASUS GTX 1060 Strix 6G
Sapphire Nitro R9 Fury 4GB
Sapphire Nitro RX 480 8GB
In our testing script, we save a couple of special things for the GTX 1080 here. The following tests are also added:
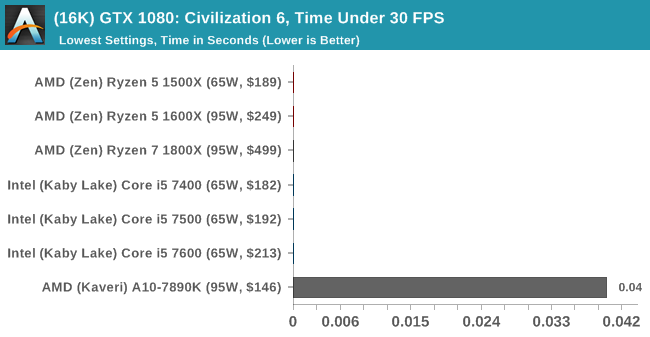
Civilization 6 (8K Ultra, 16K Lowest)
Ashes of the Singularity: Escalation* (8K Extreme, 16K Extreme)
These two benchmarks, with a little coercion, are able to be run beyond the specifications of the monitor being used, allowing for 'future' testing of GPUs at 8K and 16K with some amusing results. We are only running these tests on the GTX 1080, because there's no point watching a slideshow more than once.
*A note on Ashes. During our testing, the 2.2 update came through automatically, and broke our scripting methods due to a new splashscreen/popup. We worked to find a solution that worked one minute, and then stopped working 30 minutes later, and it was decided due to time limits that we'd look into the matter after the review.
Benchmarking Performance: CPU System Tests
Our first set of tests is our general system tests. These set of tests are meant to emulate more about what people usually do on a system, like opening large files or processing small stacks of data. This is a bit different to our office testing, which uses more industry standard benchmarks, and a few of the benchmarks here are relatively new and different.
PDF Opening
First up is a self-penned test using a monstrous PDF we once received in advance of attending an event. While the PDF was only a single page, it had so many high-quality layers embedded it was taking north of 15 seconds to open and to gain control on the mid-range notebook I was using at the time. This put it as a great candidate for our 'let's open an obnoxious PDF' test. Here we use Adobe Reader DC, and disable all the update functionality within. The benchmark sets the screen to 1080p, opens the PDF to in fit-to-screen mode, and measures the time from sending the command to open the PDF until it is fully displayed and the user can take control of the software again. The test is repeated ten times, and the average time taken. Results are in milliseconds.
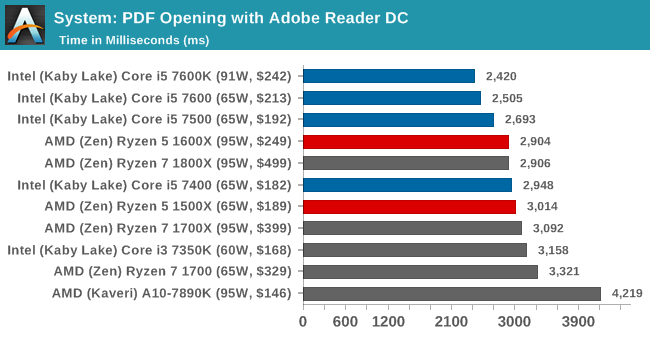
Opening PDFs using Adobe is significantly single threaded, hence why Intel takes the win here for the most part - the 7400 is slightly lower on frequency, enough for the 4.0 GHz Ryzen parts to push ahead.
FCAT Processing
One of the more interesting workloads that has crossed our desks in recent quarters is FCAT - the tool we use to measure stuttering in gaming due to dropped or runt frames. The FCAT process requires enabling a color-based overlay onto a game, recording the gameplay, and then parsing the video file through the analysis software. The software is mostly single-threaded, however because the video is basically in a raw format, the file size is large and requires moving a lot of data around. For our test, we take a 90-second clip of the Rise of the Tomb Raider benchmark running on a GTX 980 Ti at 1440p, which comes in around 21 GB, and measure the time it takes to process through the visual analysis tool.
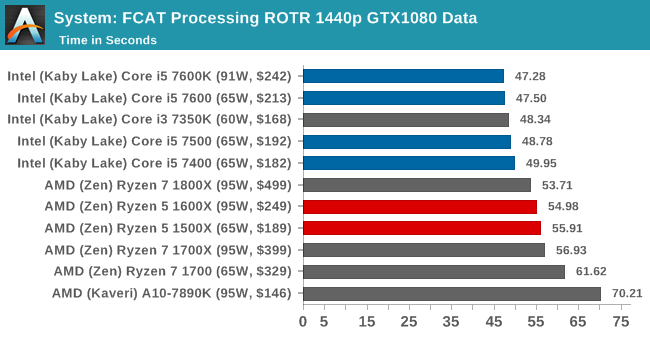
Similarly, FCAT is single threaded as it analyzes frame-by-frame. The extra frequency helps Intel here.
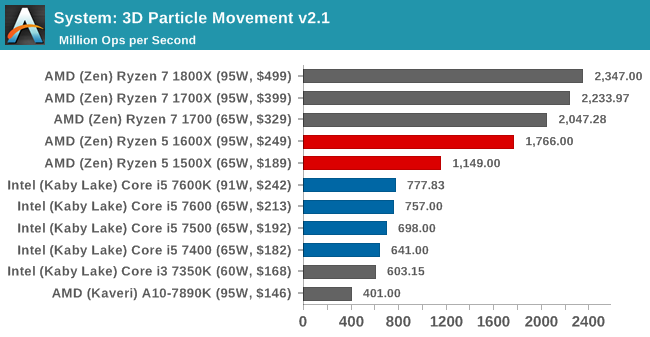
3D Particle Movement v2.1
This is the latest version of the self-penned 3DPM benchmark. The goal of 3DPM is to simulate semi-optimized scientific algorithms taken directly from my doctorate thesis. Version 2.1 improves over 2.0 by passing the main particle structs by reference rather than by value, and decreasing the amount of double->float->double recasts the compiler was adding in. It affords a ~25% speed-up over v2.0, which means new data.
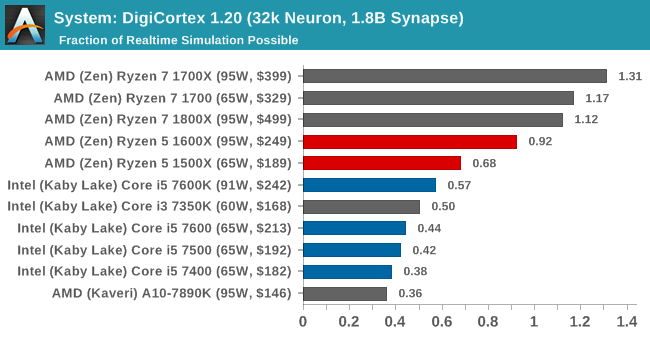
DigiCortex 1.20
Despite being a couple of years old, the DigiCortex software is a pet project for the visualization of neuron and synapse activity in the brain. The software comes with a variety of benchmark modes, and we take the small benchmark which runs a 32k neuron/1.8B synapse simulation. The results on the output are given as a fraction of whether the system can simulate in real-time, so anything above a value of one is suitable for real-time work. The benchmark offers a 'no firing synapse' mode, which in essence detects DRAM and bus speed, however we take the firing mode which adds CPU work with every firing.
Agisoft Photoscan 1.0
Photoscan stays in our benchmark suite from the previous version, however now we are running on Windows 10 so features such as Speed Shift on the latest processors come into play. The concept of Photoscan is translating many 2D images into a 3D model - so the more detailed the images, and the more you have, the better the model. The algorithm has four stages, some single threaded and some multi-threaded, along with some cache/memory dependency in there as well. For some of the more variable threaded workload, features such as Speed Shift and XFR will be able to take advantage of CPU stalls or downtime, giving sizeable speedups on newer microarchitectures.
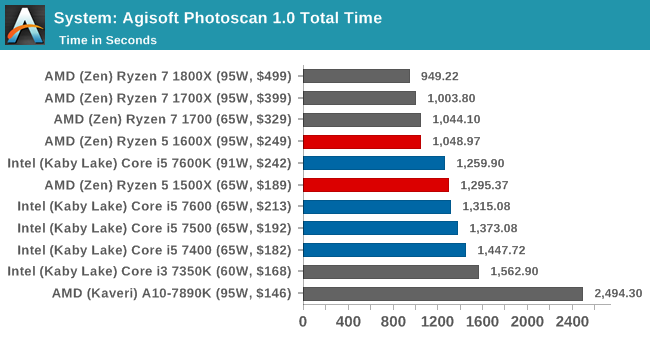
Because parts of Photoscan are very multithreaded, such as the first stage, there's plenty of scope for the Ryzen CPUs to pull ahead here.
Benchmarking Performance: CPU Rendering Tests
Rendering tests are a long-time favorite of reviewers and benchmarkers, as the code used by rendering packages is usually highly optimized to squeeze every little bit of performance out. Sometimes rendering programs end up being heavily memory dependent as well - when you have that many threads flying about with a ton of data, having low latency memory can be key to everything. Here we take a few of the usual rendering packages under Windows 10, as well as a few new interesting benchmarks.
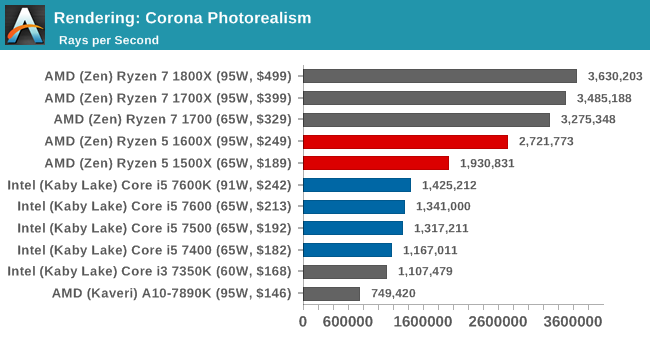
Corona 1.3
Corona is a standalone package designed to assist software like 3ds Max and Maya with photorealism via ray tracing. It's simple - shoot rays, get pixels. OK, it's more complicated than that, but the benchmark renders a fixed scene six times and offers results in terms of time and rays per second. The official benchmark tables list user submitted results in terms of time, however I feel rays per second is a better metric (in general, scores where higher is better seem to be easier to explain anyway). Corona likes to pile on the threads, so the results end up being very staggered based on thread count.
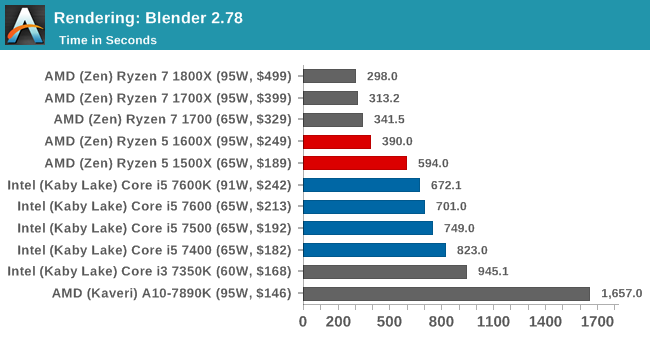
Blender 2.78
For a render that has been around for what seems like ages, Blender is still a highly popular tool. We managed to wrap up a standard workload into the February 5 nightly build of Blender and measure the time it takes to render the first frame of the scene. Being one of the bigger open source tools out there, it means both AMD and Intel work actively to help improve the codebase, for better or for worse on their own/each other's microarchitecture.
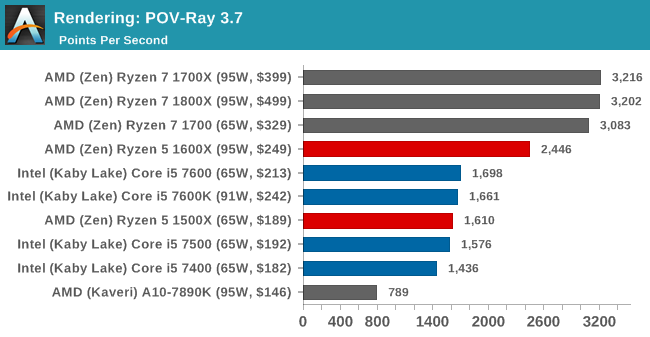
POV-Ray 3.7.1
Another regular benchmark in most suites, POV-Ray is another ray-tracer but has been around for many years. It just so happens that during the run up to AMD's Ryzen launch, the code base started to get active again with developers making changes to the code and pushing out updates. Our version and benchmarking started just before that was happening, but given time we will see where the POV-Ray code ends up and adjust in due course.
Cinebench R15
The latest version of CineBench has also become one of those 'used everywhere' benchmarks, particularly as an indicator of single thread performance. High IPC and high frequency gives performance in ST, whereas having good scaling and many cores is where the MT test wins out.


Benchmarking Performance: CPU Web Tests
One of the issues when running web-based tests is the nature of modern browsers to automatically install updates. This means any sustained period of benchmarking will invariably fall foul of the 'it's updated beyond the state of comparison' rule, especially when browsers will update if you give them half a second to think about it. Despite this, we were able to find a series of commands to create an un-updatable version of Chrome 56 for our 2017 test suite. While this means we might not be on the bleeding edge of the latest browser, it makes the scores between CPUs comparable.
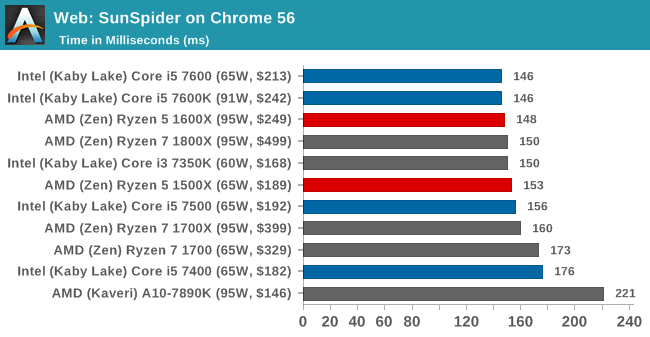
SunSpider 1.0.2 [link]
The oldest web-based benchmark in this portion of our test is SunSpider. This is a very basic javascript algorithm tool, and ends up being more a measure of IPC and latency than anything else, with most high performance CPUs scoring around about the same. The basic test is looped 10 times and the average taken. We run the basic test 4 times.
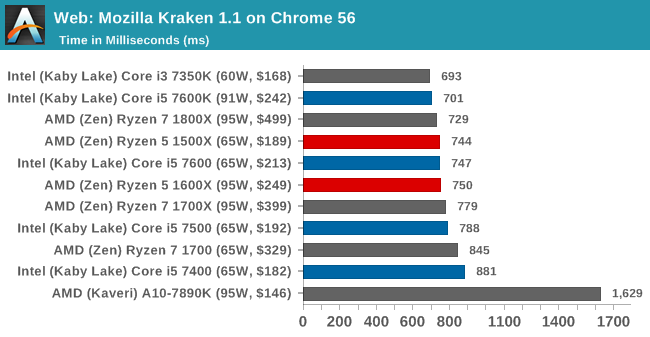
Mozilla Kraken 1.1 [link]
Kraken is another Javascript based benchmark, using the same test harness as SunSpider, but focusing on more stringent real-world use cases and libraries, such as audio processing and image filters. Again, the basic test is looped ten times, and we run the basic test four times.
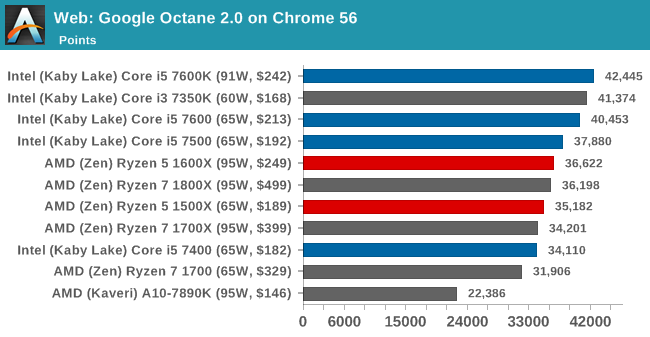
Google Octane 2.0 [link]
Along with Mozilla, as Google is a major browser developer, having peak JS performance is typically a critical asset when comparing against the other OS developers. In the same way that SunSpider is a very early JS benchmark, and Kraken is a bit newer, Octane aims to be more relevant to real workloads, especially in power constrained devices such as smartphones and tablets.
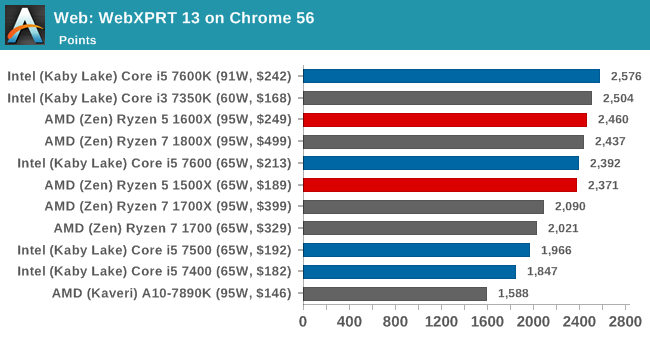
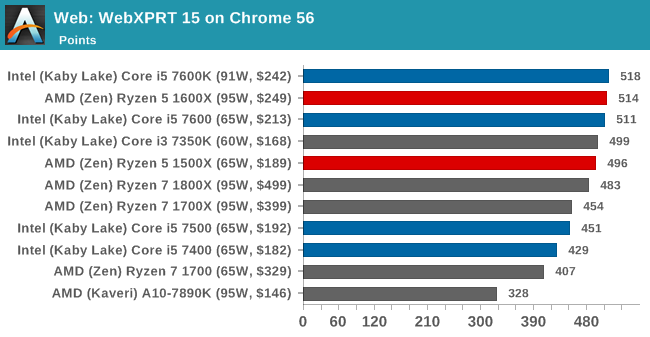
WebXPRT 2013 and 2015 [link]
While the previous three benchmarks do calculations in the background and represent a score, WebXPRT is designed to be a better interpretation of visual workloads that a professional user might have, such as browser based applications, graphing, image editing, sort/analysis, scientific analysis and financial tools. Web2013 is the older tool, superceded by Web2015, however both still are highly relevant for high-performance web applications today.
Benchmarking Performance: CPU Encoding Tests
One of the interesting elements on modern processors is encoding performance. This includes encryption/decryption, as well as video transcoding from one video format to another. In the encrypt/decrypt scenario, this remains pertinent to on-the-fly encryption of sensitive data - a process by which more modern devices are leaning to for software security. Video transcoding as a tool to adjust the quality, file size and resolution of a video file has boomed in recent years, such as providing the optimum video for devices before consumption, or for game streamers who are wanting to upload the output from their video camera in real-time. As we move into live 3D video, this task will only get more strenuous, and it turns out that the performance of certain algorithms is a function of the input/output of the content.
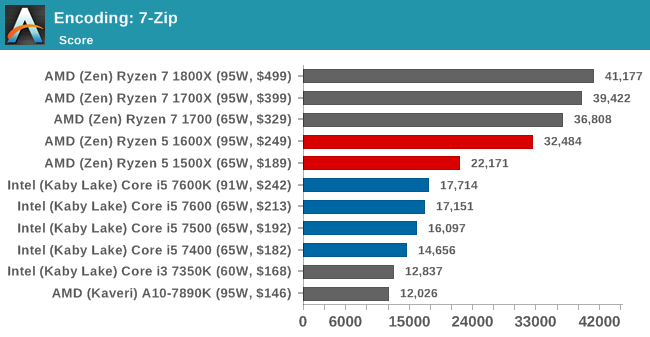
7-Zip
One of the freeware compression tools that offers good scaling performance between processors is 7-Zip. It runs under an open-source licence, is fast, and easy to use tool for power users. We run the benchmark mode via the command line for four loops and take the output score.
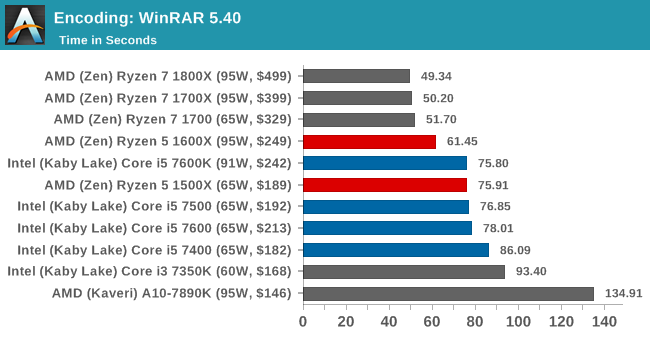
WinRAR 5.40
For the 2017 test suite, we move to the latest version of WinRAR in our compression test. WinRAR in some quarters is more user friendly that 7-Zip, hence its inclusion. Rather than use a benchmark mode as we did with 7-Zip, here we take a set of files representative of a generic stack (33 video files in 1.37 GB, 2834 smaller website files in 370 folders in 150 MB) of compressible and incompressible formats. The results shown are the time taken to encode the file. Due to DRAM caching, we run the test 10 times and take the average of the last five runs when the benchmark is in a steady state.
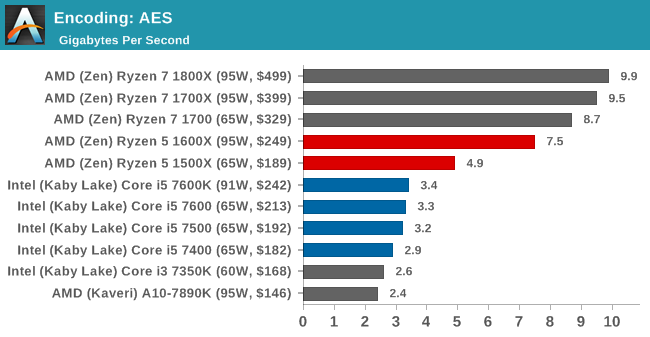
AES Encoding
Algorithms using AES coding have spread far and wide as a ubiquitous tool for encryption. Again, this is another CPU limited test, and modern CPUs have special AES pathways to accelerate their performance. We often see scaling in both frequency and cores with this benchmark. We use the latest version of TrueCrypt and run its benchmark mode over 1GB of in-DRAM data. Results shown are the GB/s average of encryption and decryption.
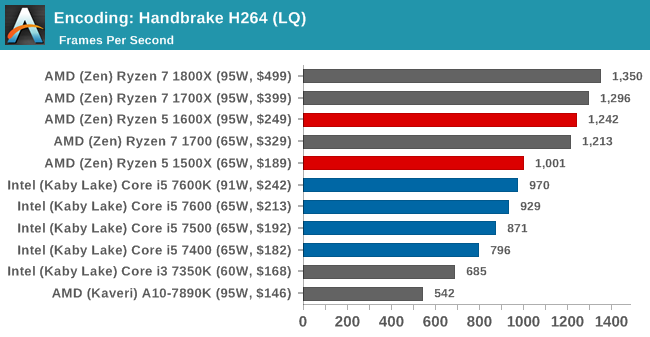
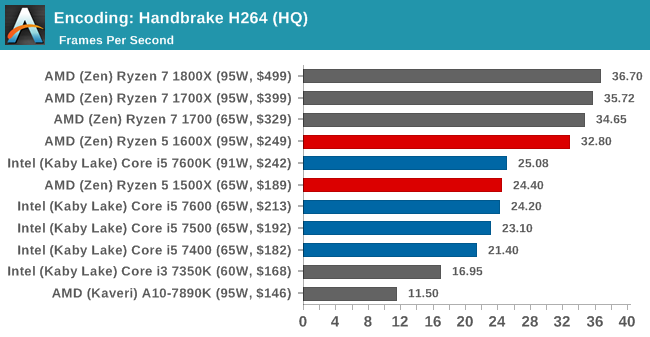
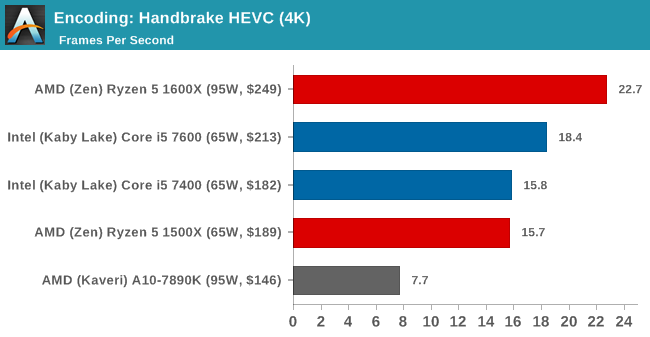
HandBrake H264 and HEVC
As mentioned above, video transcoding (both encode and decode) is a hot topic in performance metrics as more and more content is being created. First consideration is the standard in which the video is encoded, which can be lossless or lossy, trade performance for file-size, trade quality for file-size, or all of the above can increase encoding rates to help accelerate decoding rates. Alongside Google's favorite codec, VP9, there are two others that are taking hold: H264, the older codec, is practically everywhere and is designed to be optimized for 1080p video, and HEVC (or H265) that is aimed to provide the same quality as H264 but at a lower file-size (or better quality for the same size). HEVC is important as 4K is streamed over the air, meaning less bits need to be transferred for the same quality content.
Handbrake is a favored tool for transcoding, and so our test regime takes care of three areas.
Low Quality/Resolution H264: He we transcode a 640x266 H264 rip of a 2 hour film, and change the encoding from Main profile to High profile, using the very-fast preset.
High Quality/Resolution H264: A similar test, but this time we take a ten-minute double 4K (3840x4320) file running at 60 Hz and transcode from Main to High, using the very-fast preset.
HEVC Test: Using the same video in HQ, we change the resolution and codec of the original video from 4K60 in H264 into 4Kp30 HEVC. This causes a dramatic reduction in filesize (this is a different test to the Ryzen 7 review).
Benchmarking Performance: CPU Office Tests
The office programs we use for benchmarking aren't specific programs per-se, but industry standard tests that hold weight with professionals. The goal of these tests is to use an array of software and techniques that a typical office user might encounter, such as video conferencing, document editing, architectural modelling, and so on and so forth. At present we have two such tools to use.
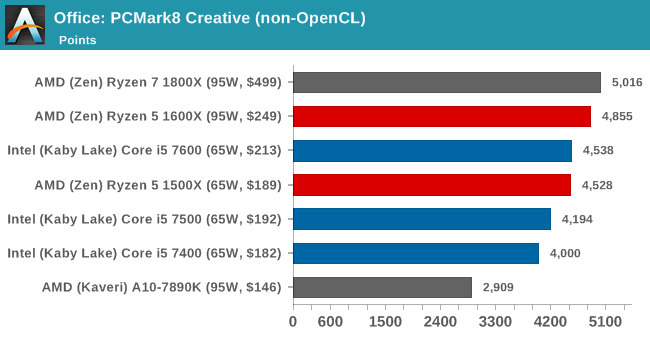
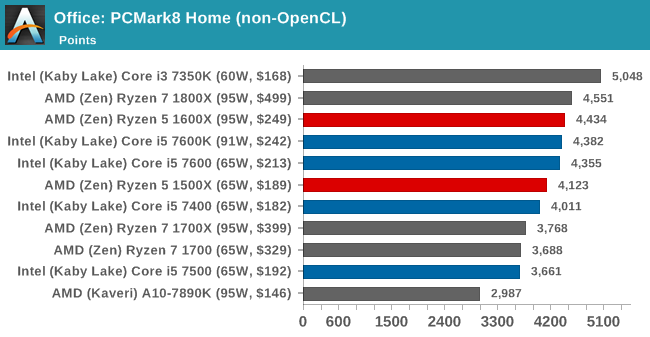
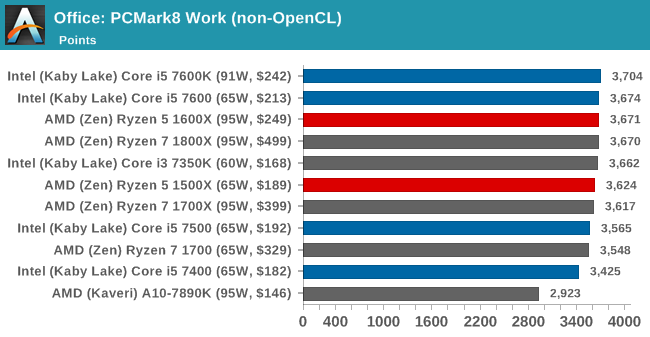
PCMark8
Despite originally coming out in 2008/2009, Futuremark has maintained PCMark8 to remain relevant in 2017. On the scale of complicated tasks, PCMark focuses more on the low-to-mid range of professional workloads, making it a good indicator for what people consider 'office' work. We run the benchmark from the commandline in 'conventional' mode, meaning C++ over OpenCL, to remove the graphics card from the equation and focus purely on the CPU. PCMark8 offers Home, Work and Creative workloads, with some software tests shared and others unique to each benchmark set.
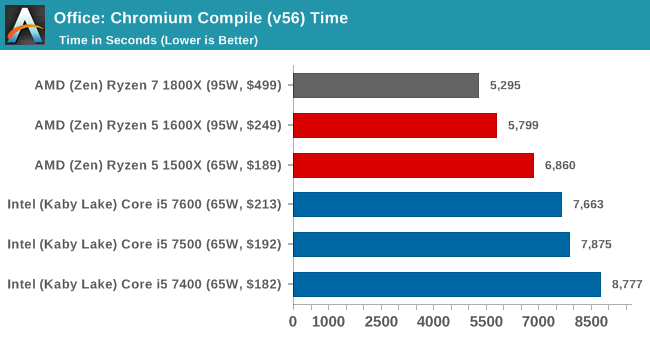
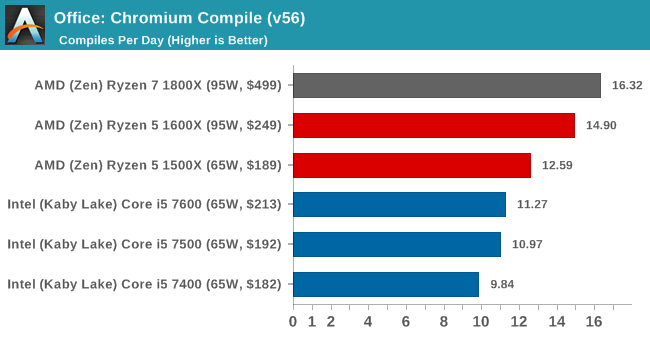
Chromium Compile (v56)
Our new compilation test uses Windows 10 Pro, VS Community 2015.3 with the Win10 SDK to combile a nightly build of Chromium. We've fixed the test for a build in late March 2017, and we run a fresh full compile in our test. Compilation is the typical example given of a variable threaded workload - some of the compile and linking is linear, whereas other parts are multithreaded.
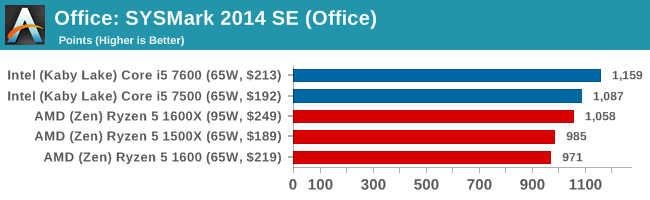
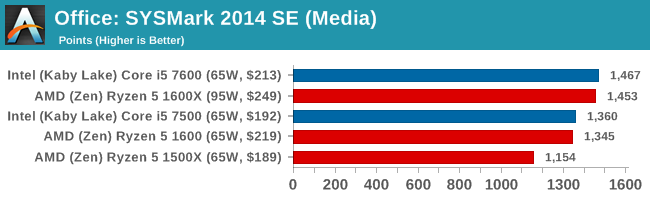
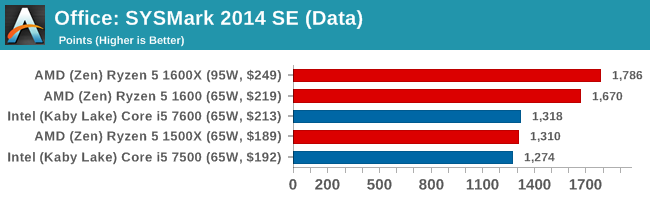
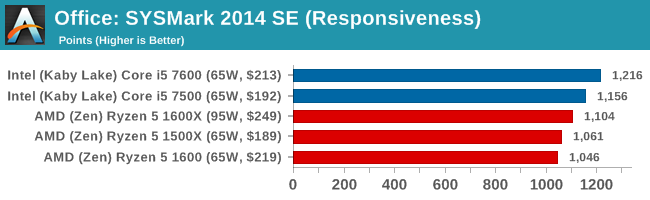
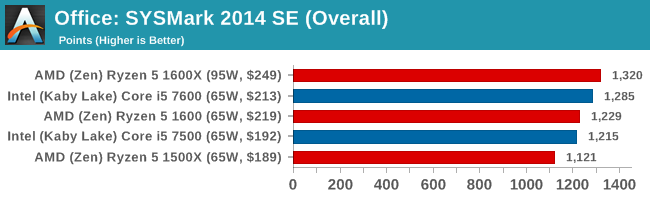
SYSmark 2014 SE
SYSmark is developed by Bapco, a consortium of industry CPU companies. The goal of SYSmark is to take stripped down versions of popular software, such as Photoshop and Onenote, and measure how long it takes to process certain tasks within that software. The end result is a score for each of the three segments (Office, Media, Data) as well as an overall score. Here a reference system (Core i3-6100, 4GB DDR3, 256GB SSD, Integrated HD 530 graphics) is used to provide a baseline score of 1000 in each test.
A note on contect for these numbers. AMD left Bapco in the last two years, due to differences of opinion on how the benchmarking suites were chosen and AMD believed the tests are angled towards Intel processors and had optimizations to show bigger differences than what AMD felt was present. The following benchmarks are provided as data, but the conflict of opinion between the two companies on the validity of the benchmark is provided as context for the following numbers.
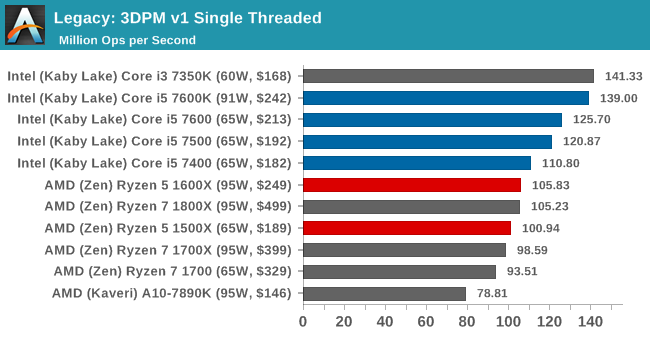
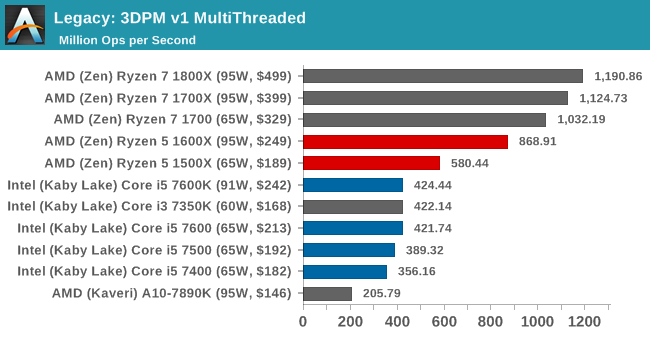
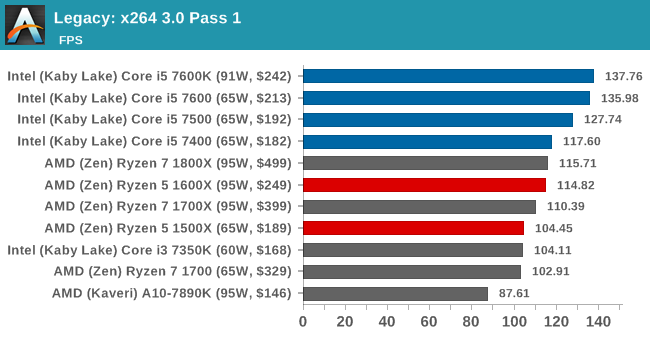
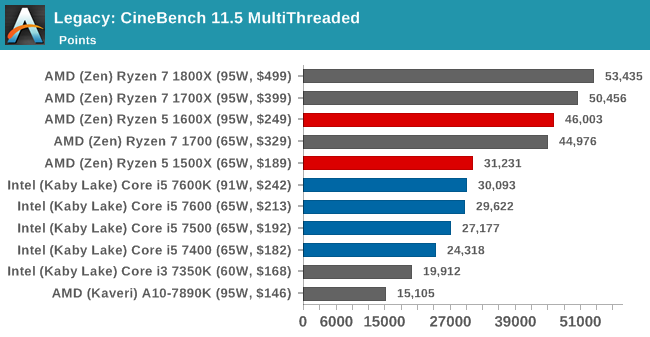
Benchmarking Performance: CPU Legacy Tests
Our legacy tests represent benchmarks that were once at the height of their time. Some of these are industry standard synthetics, and we have data going back over 10 years. All of the data here has been rerun on Windows 10, and we plan to go back several generations of components to see how performance has evolved.
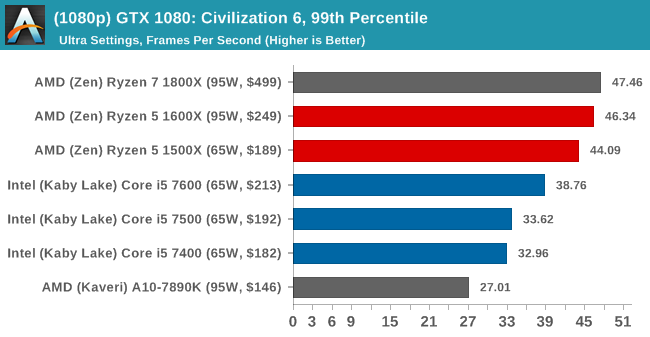
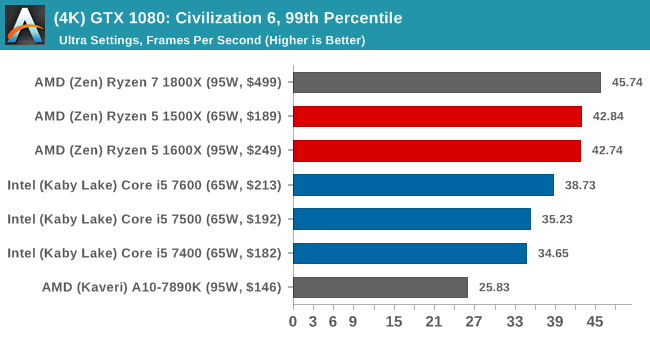
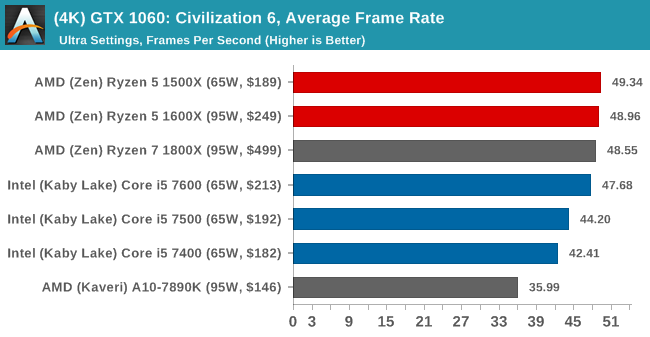
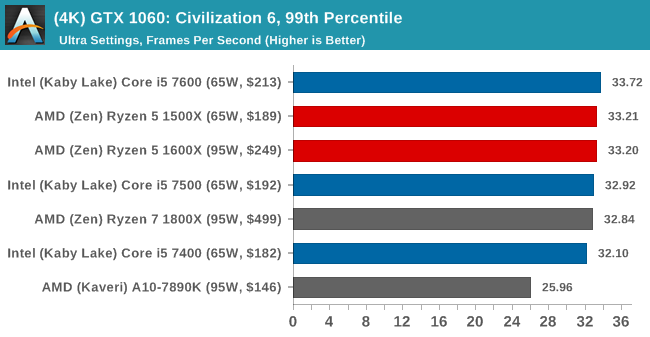
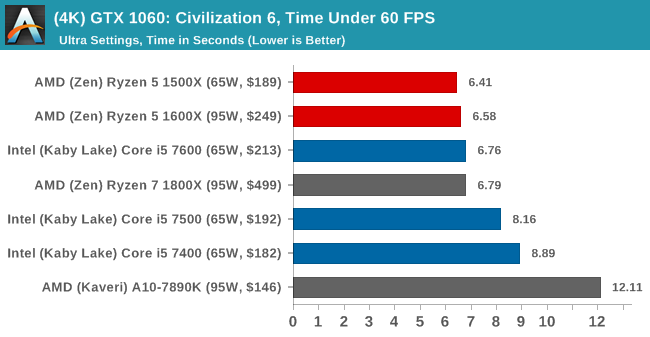
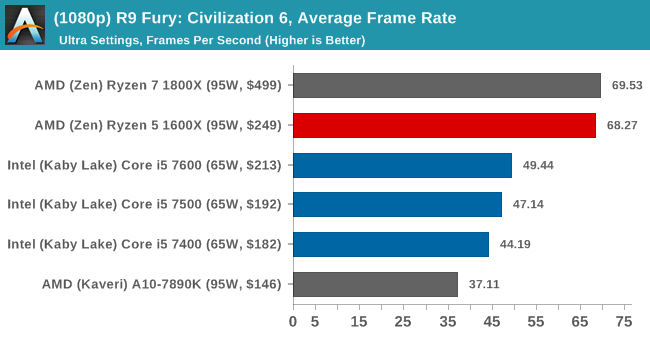
GPU Tests: Civilization 6 (1080p, 4K)
First up in our CPU gaming tests is Civilization 6. Originally penned by Sid Meier and his team, the Civ series of turn-based strategy games are a cult classic, and many an excuse for an all-nighter trying to get Gandhi to declare war on you due to an integer overflow. Truth be told I never actually played the first version, but every edition from the second to the sixth, including the fifth as voiced by the late Leonard Nimoy, it a game that is easy to pick up, but hard to master.

Benchmarking Civilization has always been somewhat of an oxymoron – for a turn based strategy game, the frame rate is not necessarily the important thing here and even in the right mood, something as low as 5 frames per second can be enough. With Civilization 6 however, Firaxis went hardcore on visual fidelity, trying to pull you into the game. As a result, Civilization can taxing on graphics and CPUs as we crank up the details, especially in DirectX 12.
Perhaps a more poignant benchmark would be during the late game, when in the older versions of Civilization it could take 20 minutes to cycle around the AI players before the human regained control. The new version of Civilization has an integrated ‘AI Benchmark’, although it is not currently part of our benchmark portfolio yet, due to technical reasons which we are trying to solve. Instead, we run the graphics test, which provides an example of a mid-game setup at our settings.
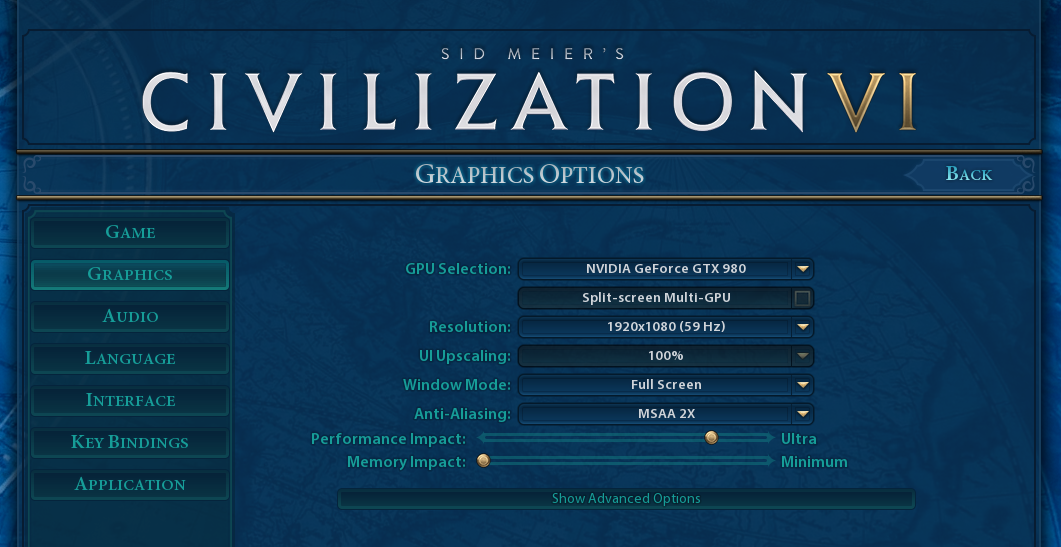
At both 1920x1080 and 4K resolutions, we run the same settings. Civilization 6 has sliders for MSAA, Performance Impact and Memory Impact. The latter two refer to detail and texture size respectively, and are rated between 0 (lowest) to 5 (extreme). We run our Civ6 benchmark in position four for performance (ultra) and 0 on memory, with MSAA set to 2x.
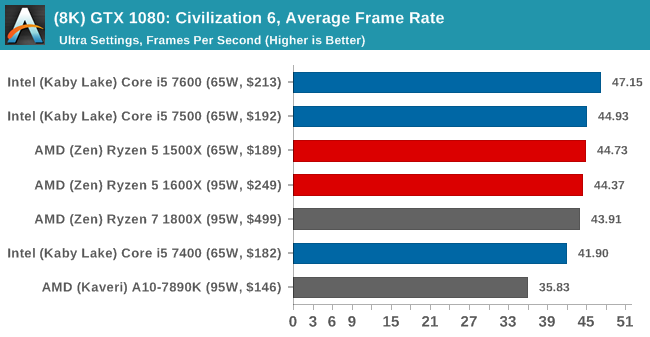
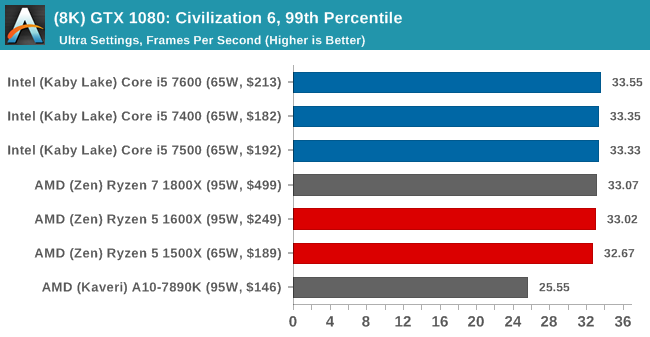
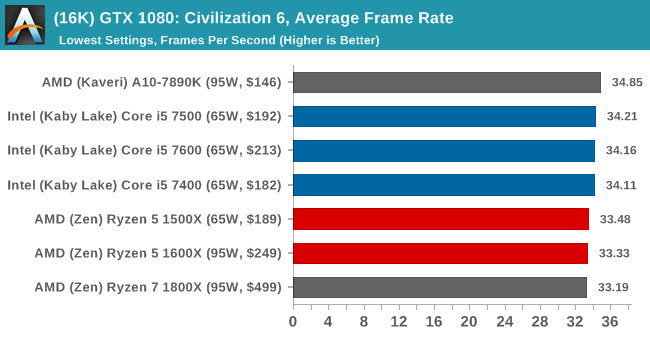
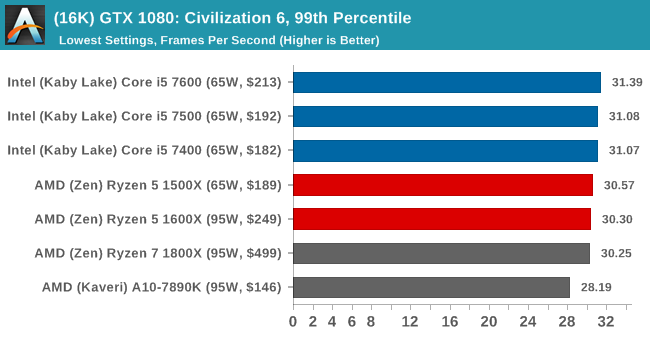
For reviews where we include 8K and 16K benchmarks (Civ6 allows us to benchmark extreme resolutions on any monitor) on our GTX 1080, we run the 8K tests similar to the 4K tests, but the 16K tests are set to the lowest option for Performance.
MSI GTX 1080 at 1920x1080


MSI GTX 1080 at 4K

 >
>
ASUS GTX 1060 at 1920x1080
ASUS GTX 1060 at 4K
Sapphire R9 Fury at 1920x1080
Sapphire R9 Fury at 4K
Sapphire RX 480 at 1920x1080
Sapphire RX 480 at 4K
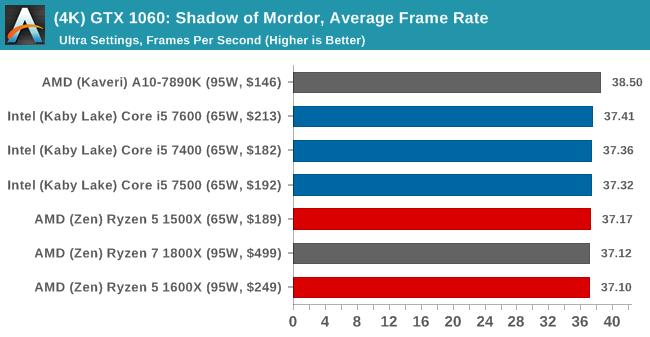
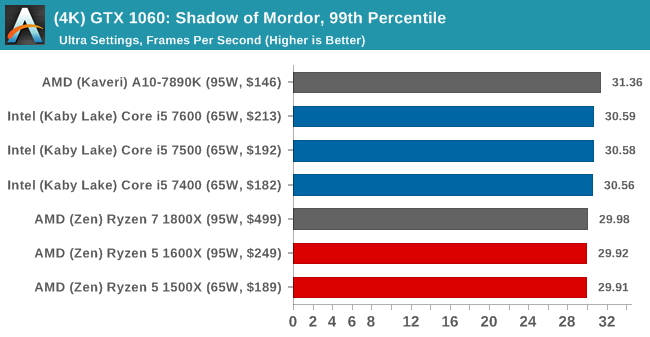
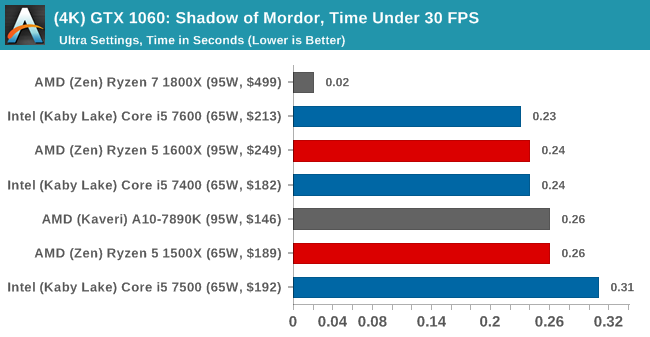
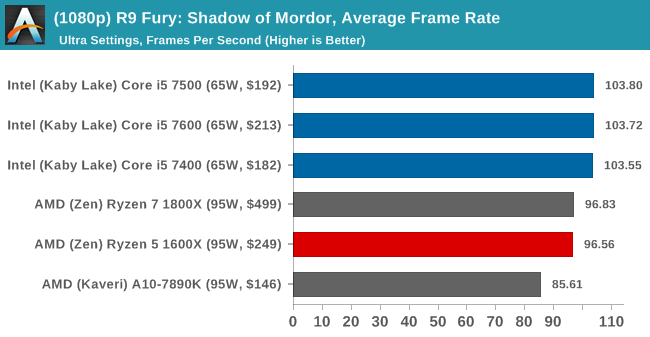
GPU Tests: Shadow of Mordor (1080p, 4K)
GTX 1080
GTX 1060
R9 Fury

RX 480
GPU Tests: Rise of the Tomb Raider DX12 (1080p, 4K)
Part 1 - Valley
GTX 1080
1060
R9 Fury

RX 480
2-Prophets
3-Mountain
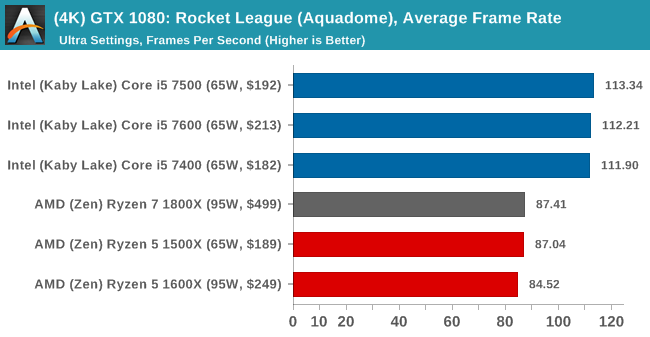
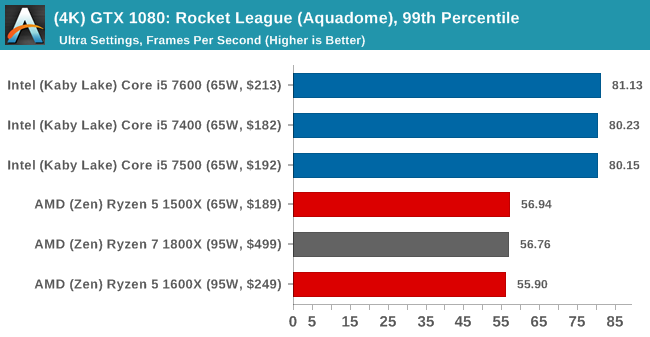
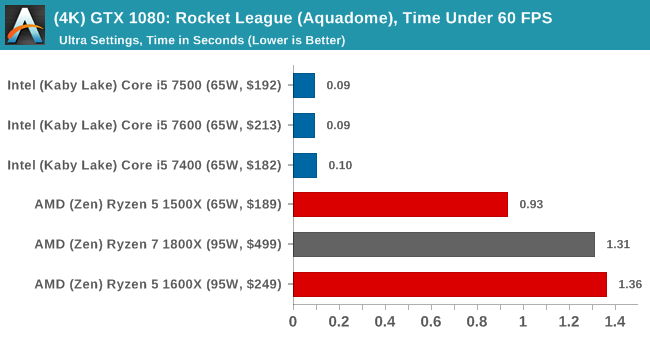
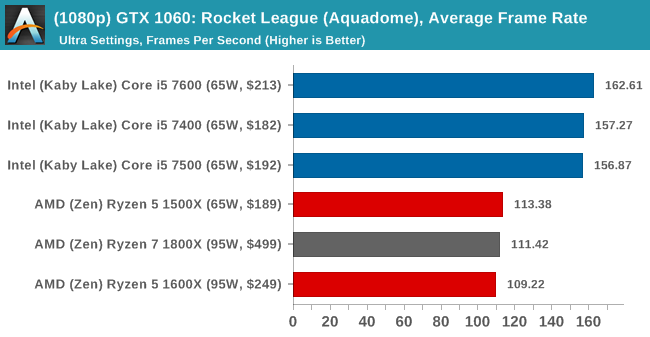
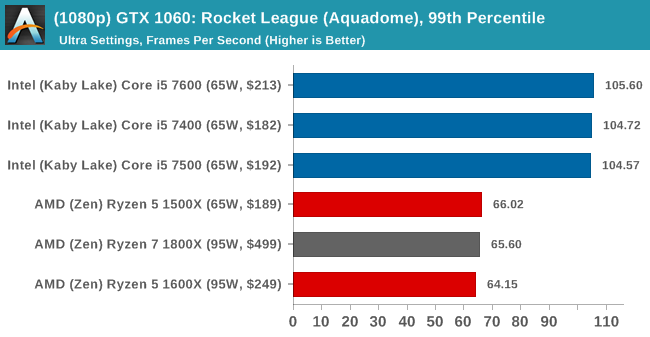
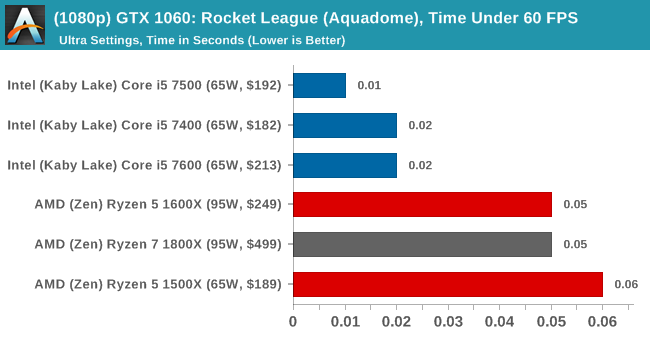
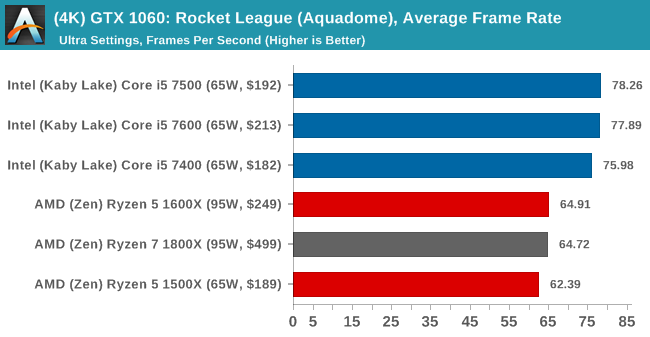
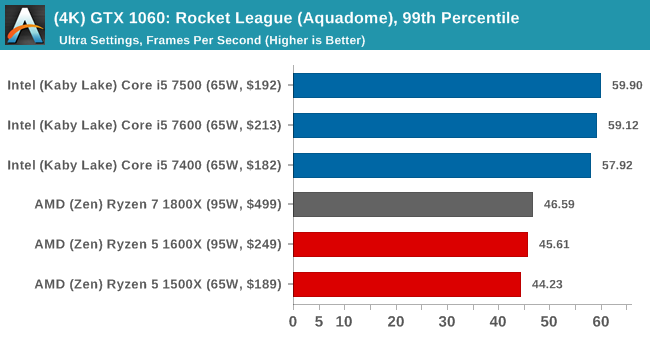
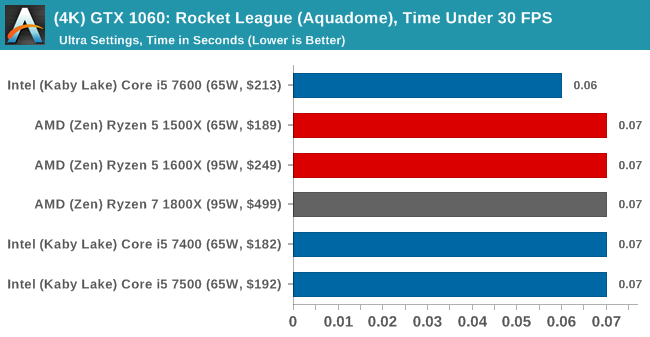
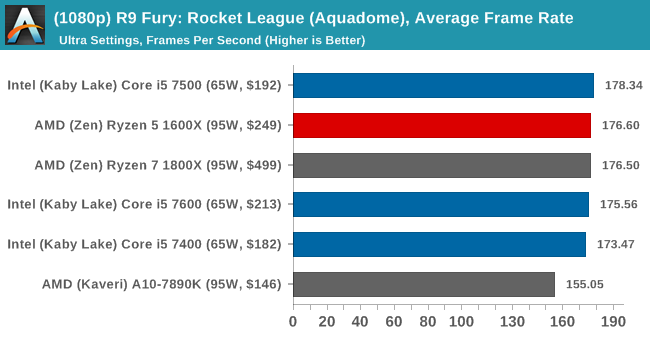
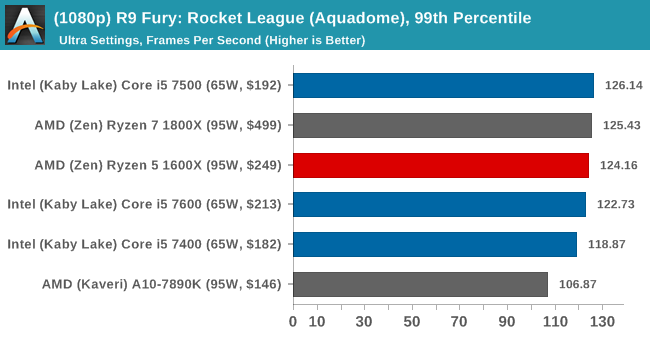
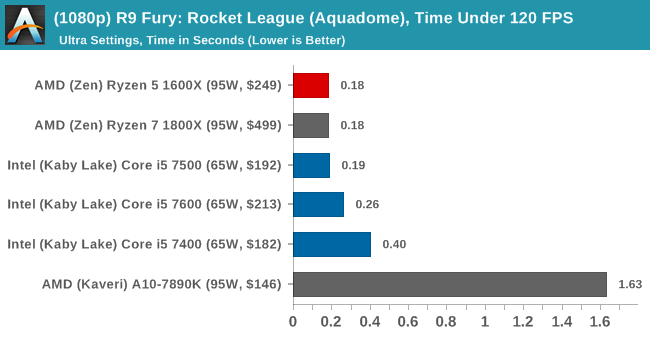
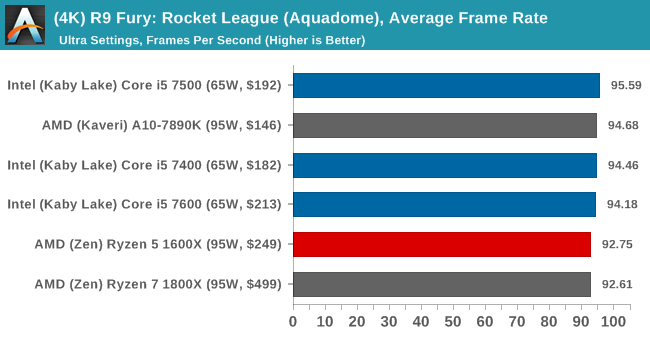
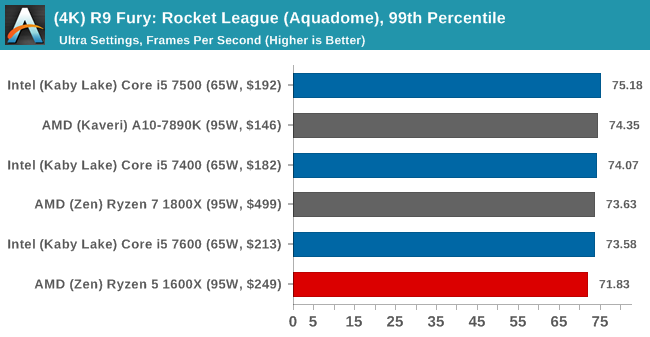
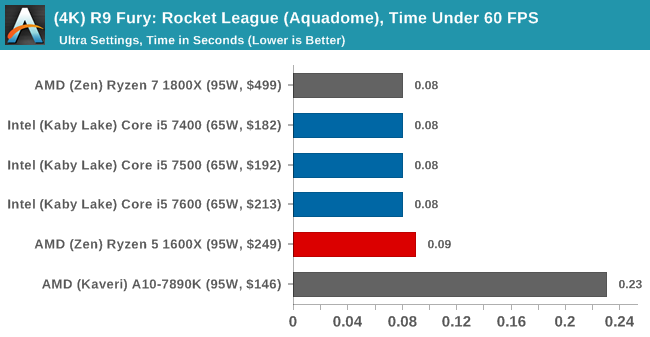
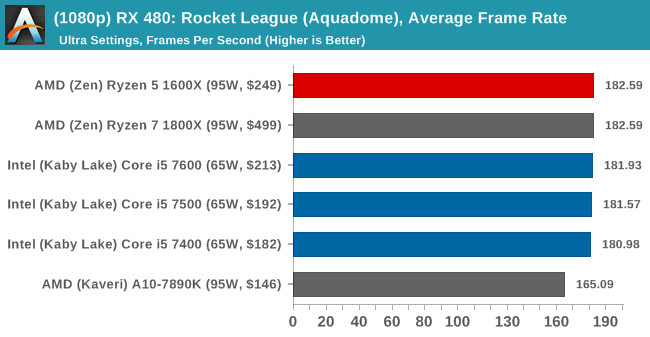
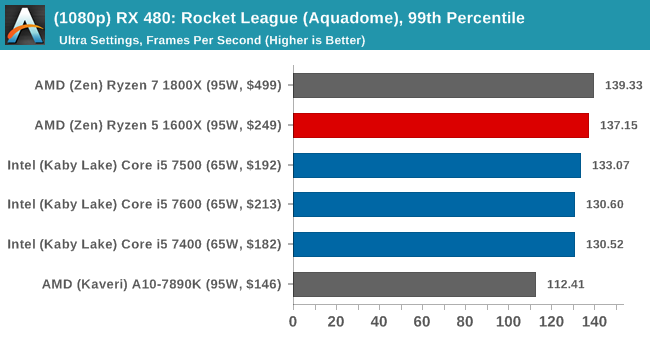
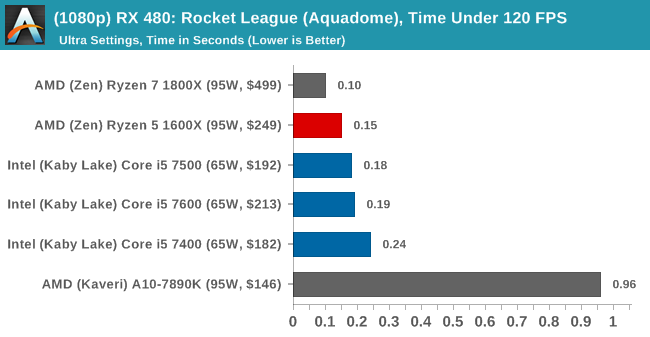
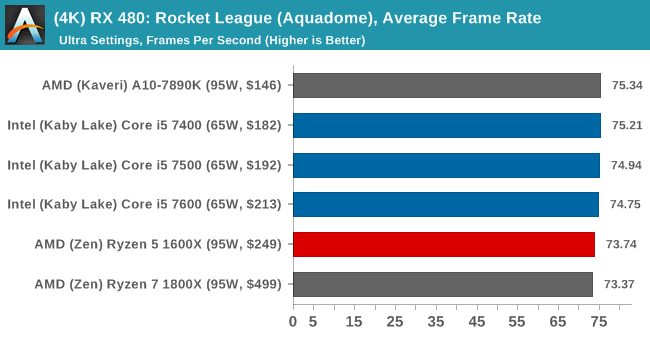
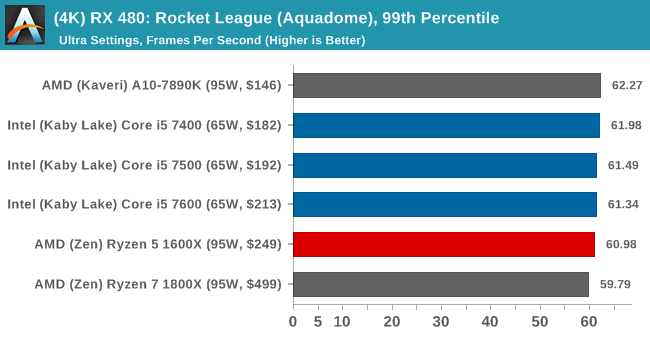
GPU Tests: Rocket League (1080p, 4K)
GTX 1080
1060
R9 Fury
RX 480
GPU Tests: Grand Theft Auto DX11 (1080p, 4K)
GTX 1080
1060

R9 Fury
RX 480
GPU Tests: GTX 1080 at 8K and 16K
Civilization 6

AMD Ryzen 5
We mentioned at the top of the review that AMD’s Ryzen 7 launch last month benefited in a market where the competition was extremely expensive – being able to offer equivalent performance in most tasks and then undercut the competition by 50% is a difficult task, but the opening was always there due to a lack of competition in this space. When it comes to the mainstream market, the Ryzen 5 processors are actually competing on price with Intel’s processors directly, and thus has to offer something more to compete.
We have already shown in previous reviews that the Zen microarchitecture from AMD is around the equivalent of Intel’s Broadwell microarchitecture, but at this lower price point we have AMD’s Zen against Intel’s Kaby Lake, which is two generations newer than Broadwell and affords a comfortable IPC uplift over Broadwell. Given AMD’s monolithic design strategy of a single silicon die catering for most of their product line (well, all of it so far), the way AMD is tackling this is through more cores.
Before the debate about cores from AMD’s past rears its head (Vishera/Bulldozer designs in that case), given that AMD’s single thread performance is not too far behind, having a big set of cores as an alternative is something interesting for end-users, especially as more work flows and gaming titles rely on multithreading to scale. As a result, where Intel offer four cores and four threads, AMD is now offering six cores and twelve threads – a potential +200% uptick in the number of threads and +50% in cores, albeit at 10-15% lower instructions per clock.
(There’s also a side argument here about die sizes and wafer costs to each company to consider, but we will leave that for a different piece.)
For this review, based on time and available parts, we tested the Ryzen 5 1600X six-core processor against a set of Intel Core i5 parts that users might also be considering. We have some Ryzen 5 1500X quad-core numbers in here as well, and that might be spun out into a separate review at a later date. We also demonstrated our new 2017 CPU gaming tests, with four GPUs, six tests, two resolutions per test, and a couple of extra extreme resolution tests.
On The Benchmark Results
Looking at the results, it’s hard to notice the effect that 12 threads has on multithreaded CPU tests. The usual culprits show big wins for AMD here: 2D to 3D photo conversion, ray tracing, Blender, Cinebench, Encryption and video transcoding are all sizable wins. This is the sort of workload in which moving up to the Ryzen 7 CPUs, budget permitting, also do well on.
A new test in our suite for this review is a Compile Chromium test on Windows. As part of our testing suite, we have a fixed nightly download from mid-March and set this to compile, taking the final time and converting it into how many compiles per day. For around $250, Ryzen is the only way to go:
As you would expect, AMD still lags in IPC to Intel, so a 4.0 GHz AMD chip can somewhat compete in single threaded tests when the Intel CPU is around 3.5-3.6 GHz, and the single thread web tests/Cinebench results show that.
On The Gaming
Our gaming tests are a mix of Full-HD and 4K testing, some of which ends up being more CPU limited than we expected.
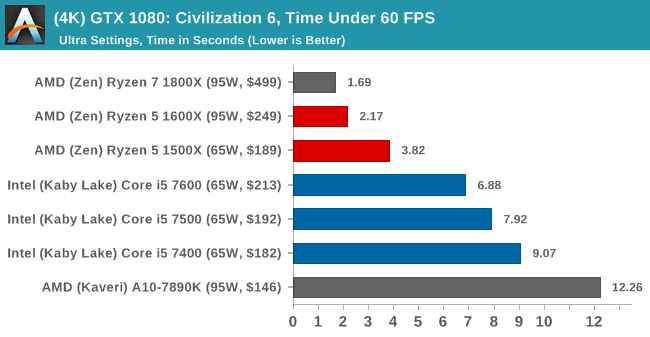
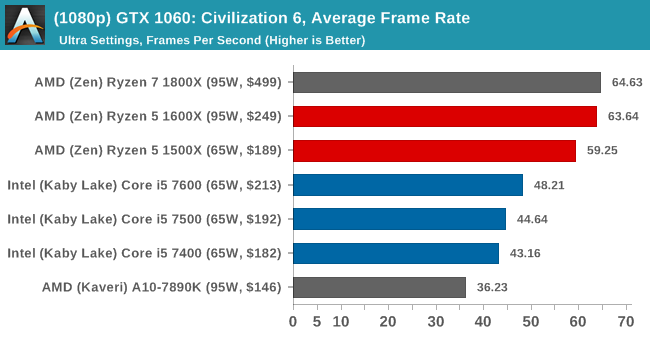
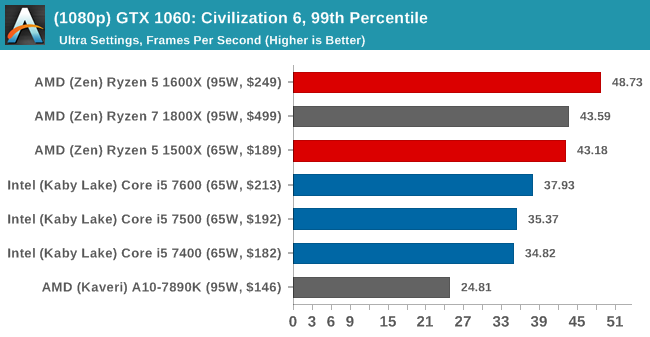
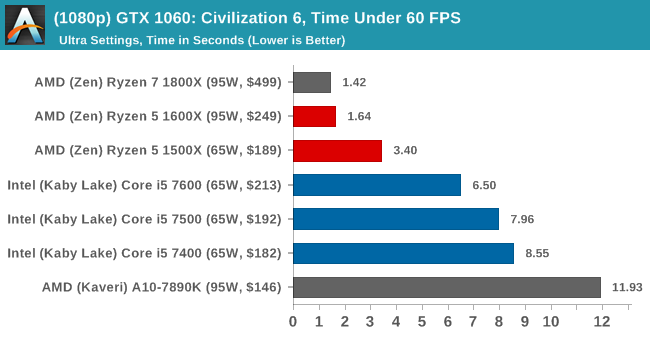
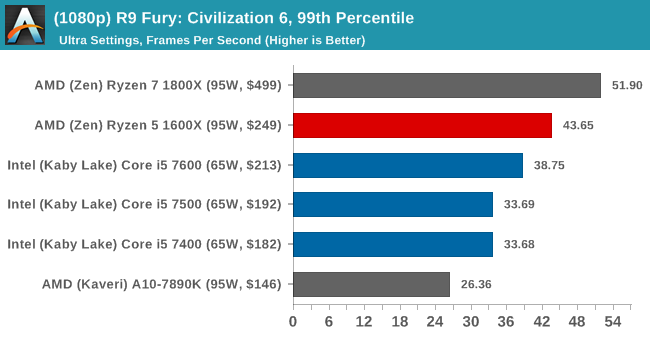
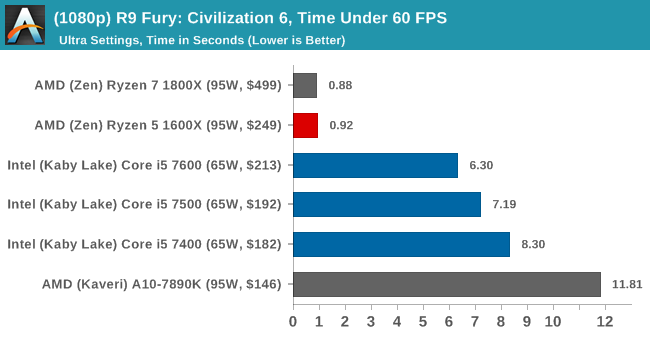
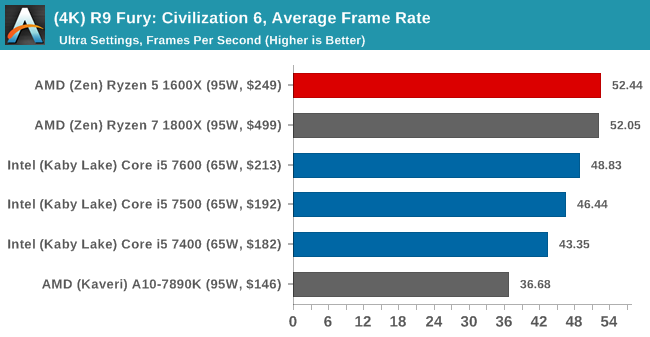
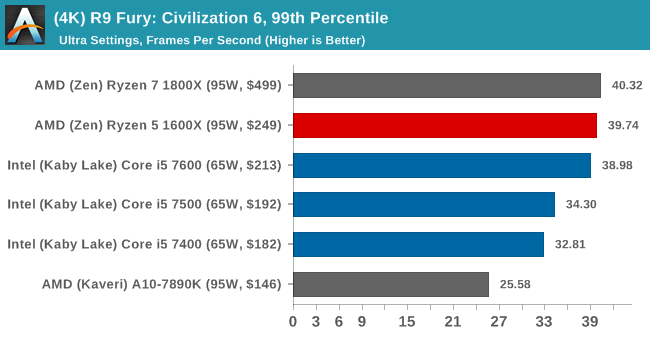
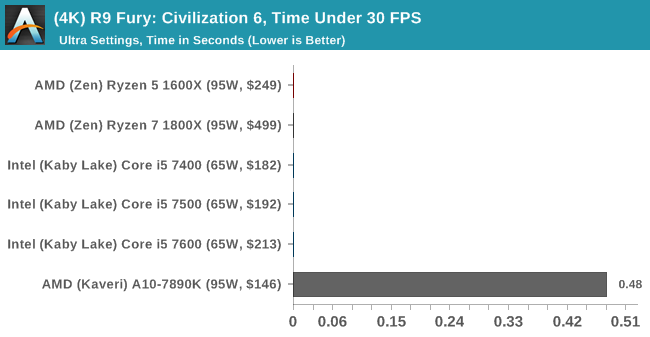
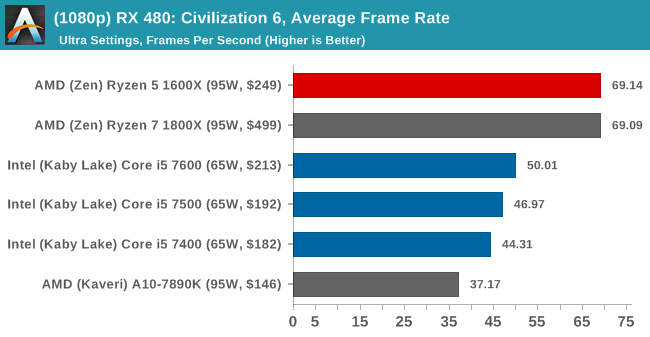
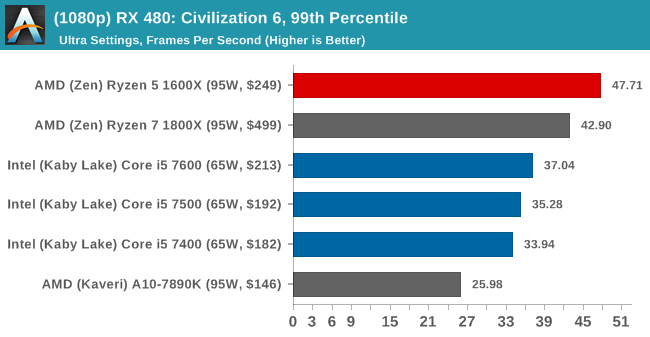
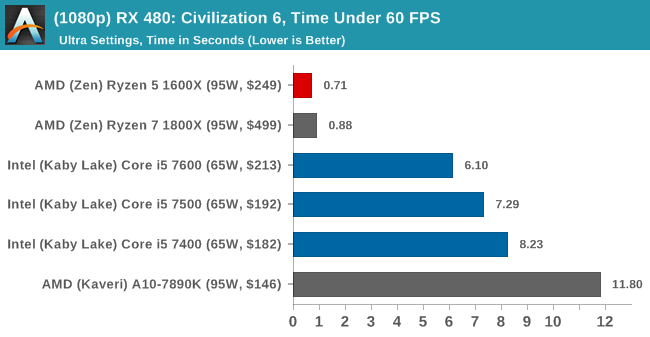
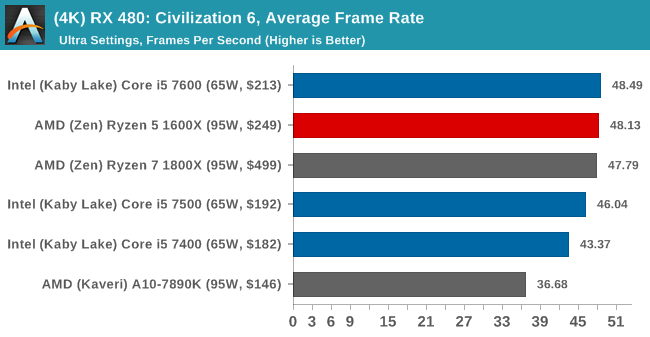
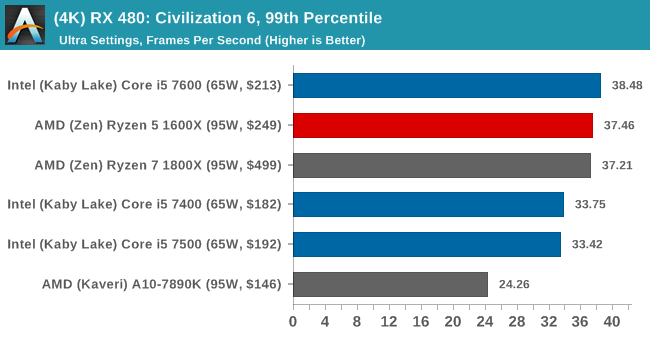
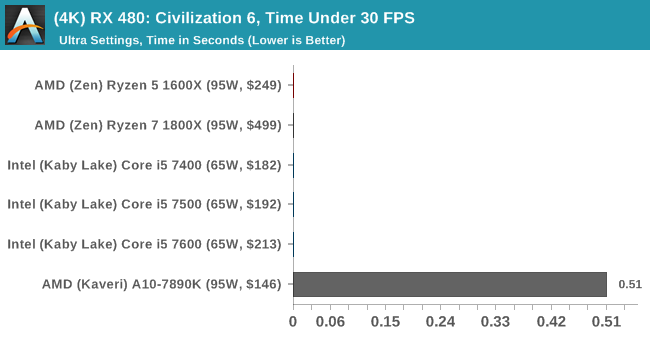
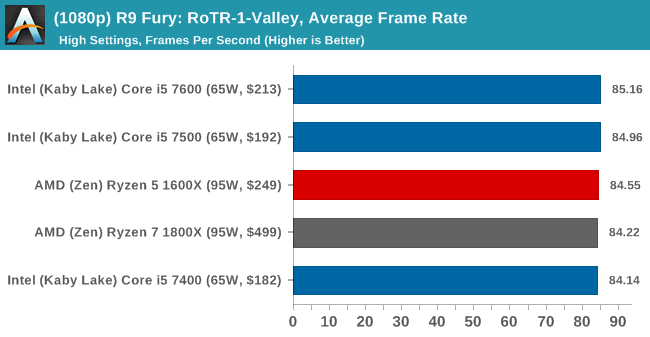
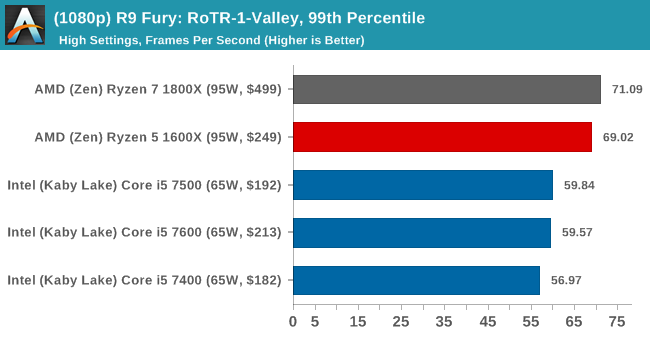
Civilization, at both 1080p and 4K Ultra settings, seem to scale quite happily with more cores on all GPUs, except the GTX 1060 at 4K. It’s worth noting situations such as the R9 Fury at 1080p Ultra only has 920ms under 60 FPS on the 1600X, compared to 6300 milliseconds on the Core i5-7600.
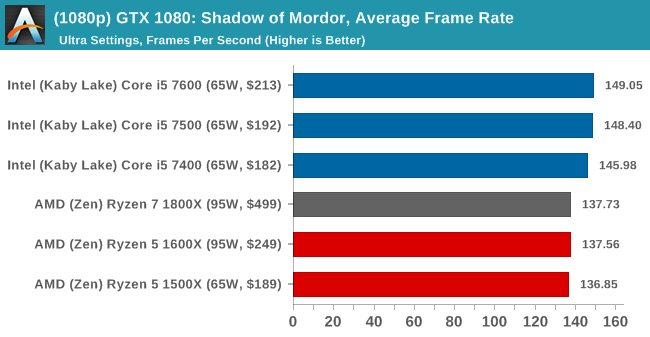
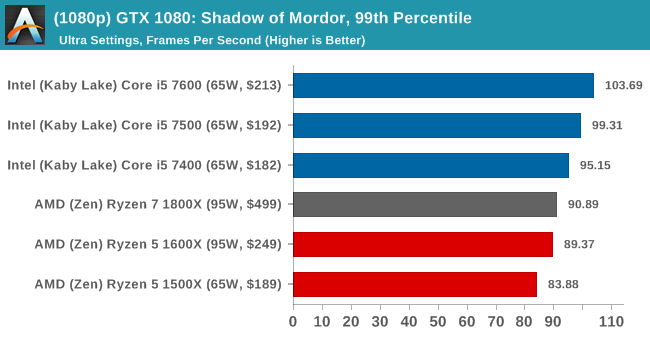
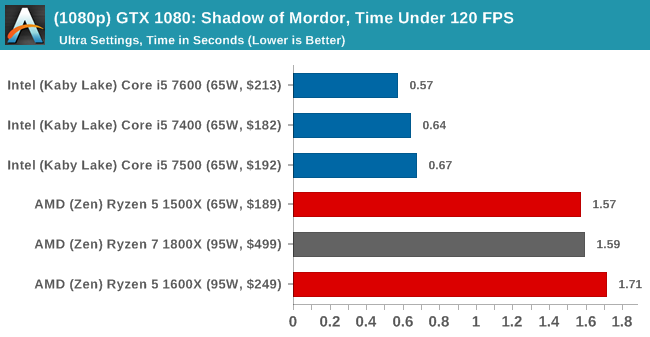
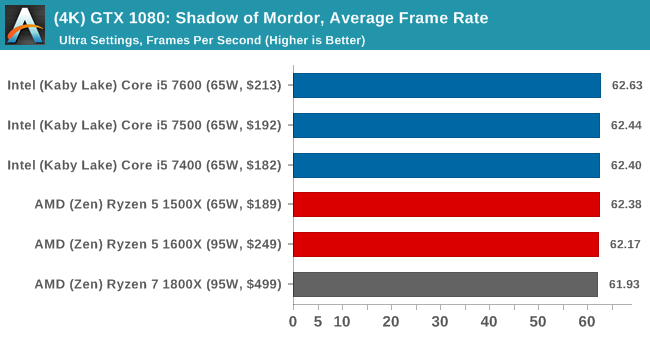
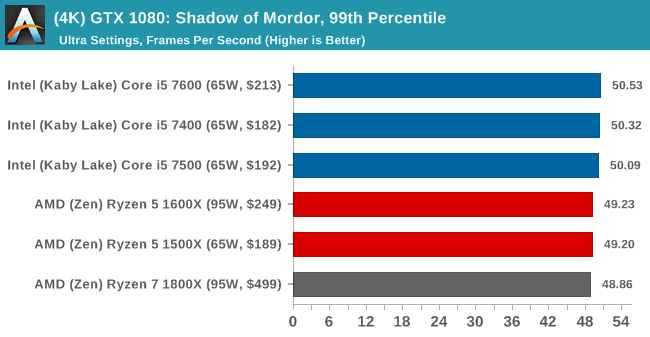
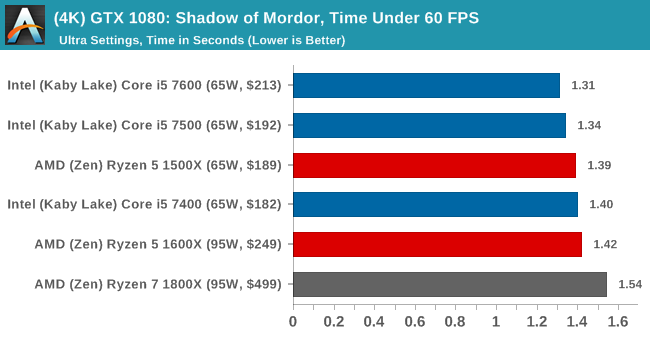
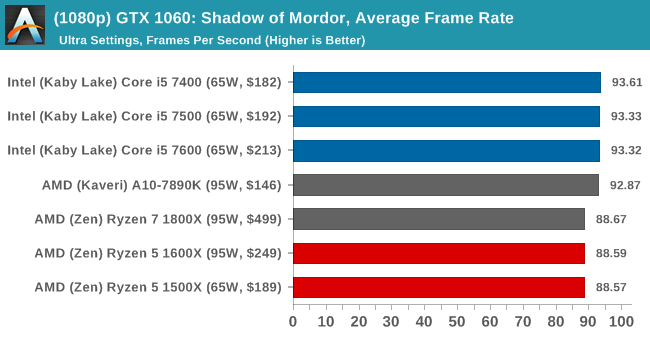
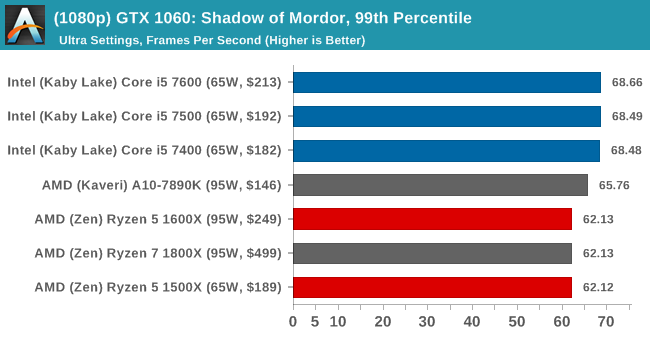
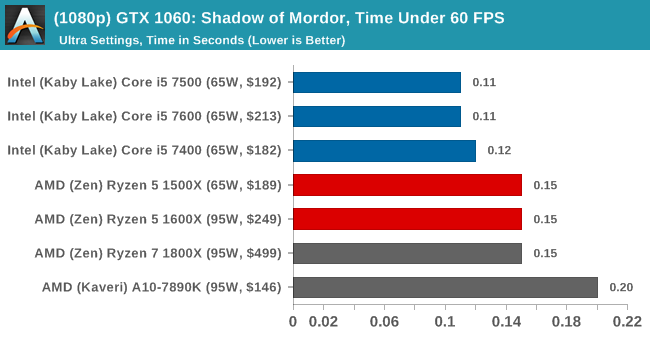
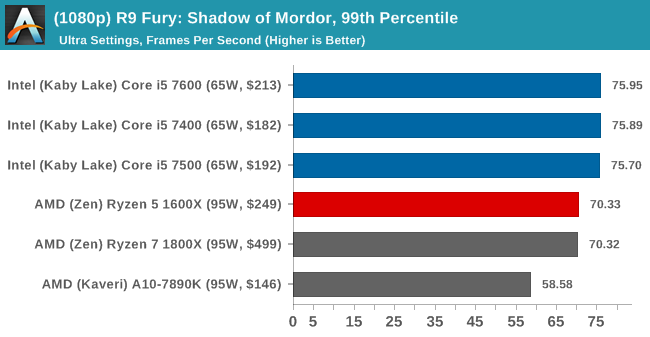
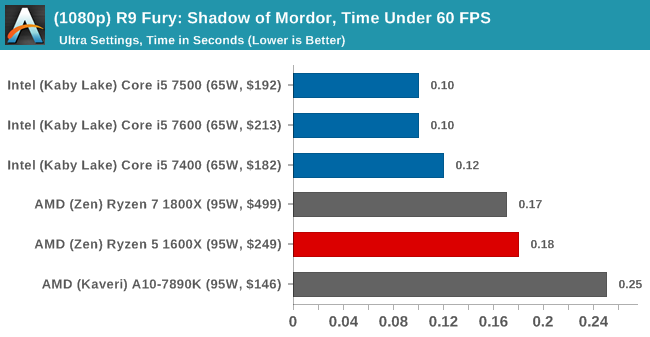
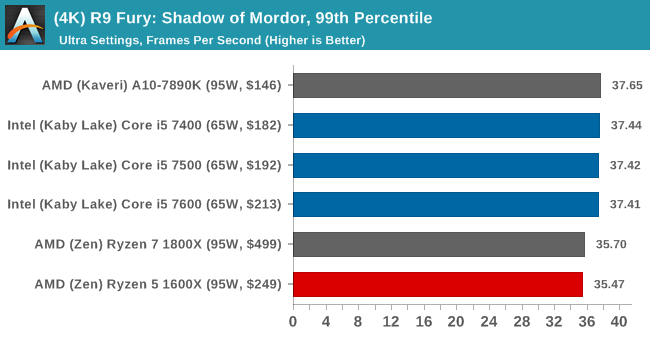
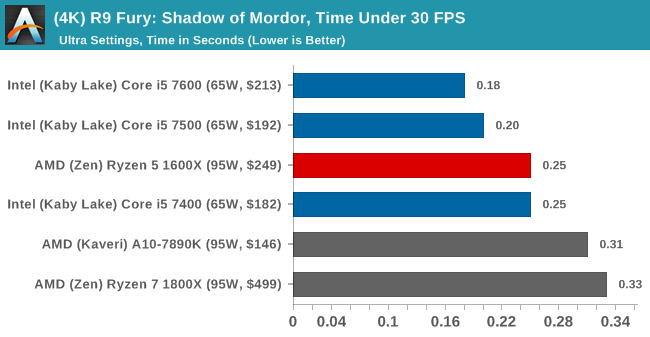
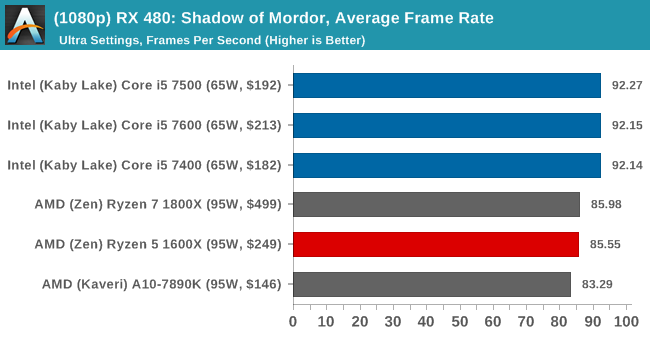
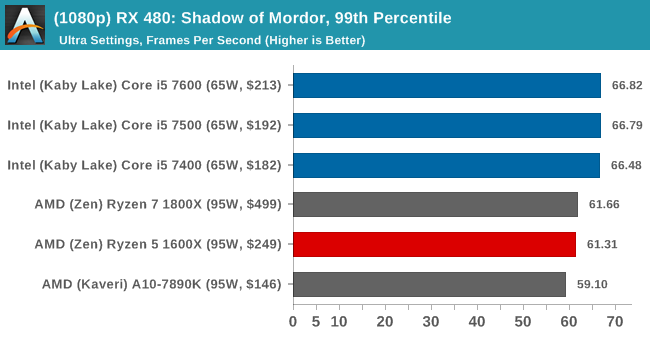
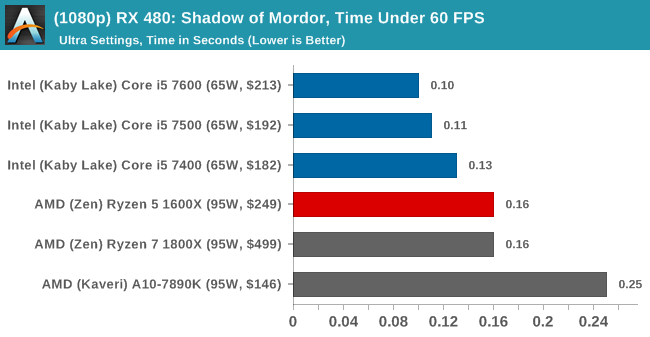
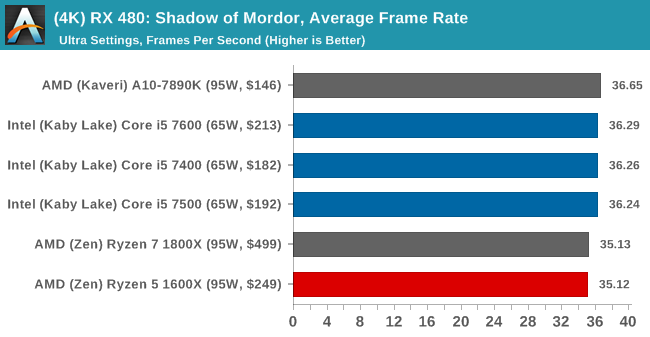
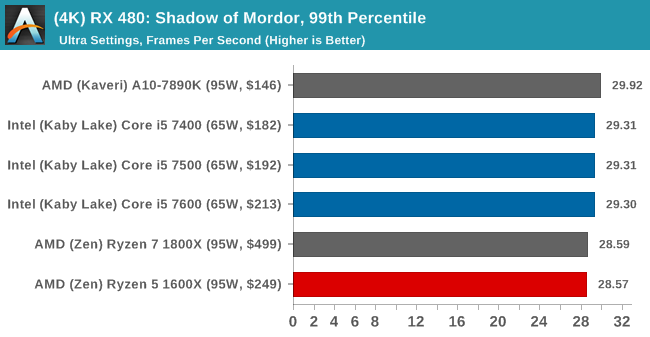
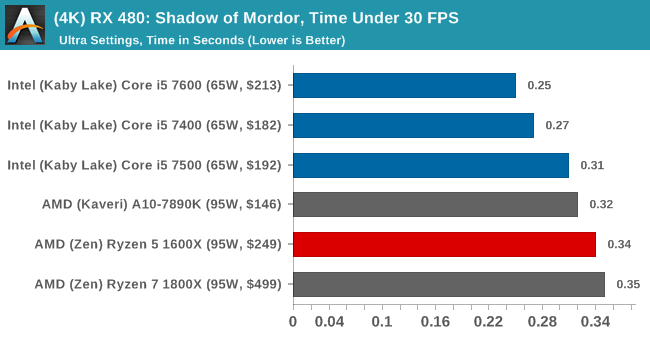
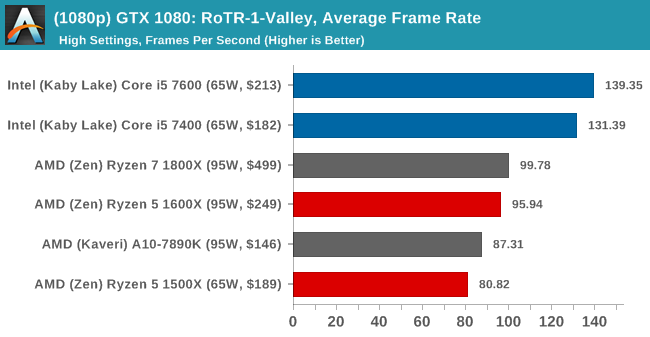
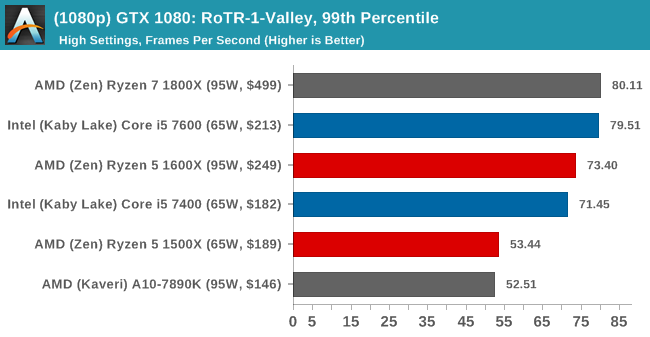
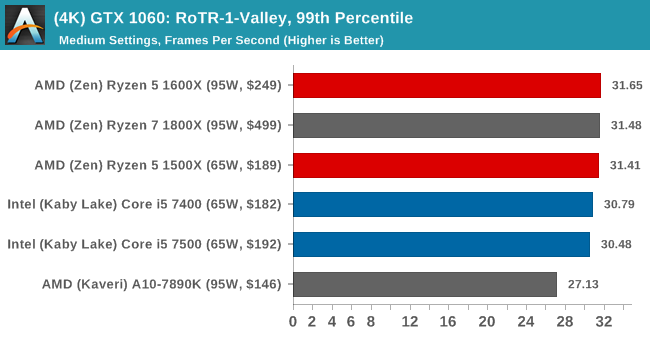
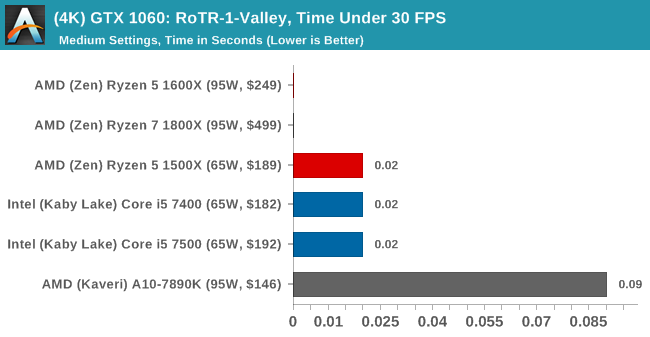
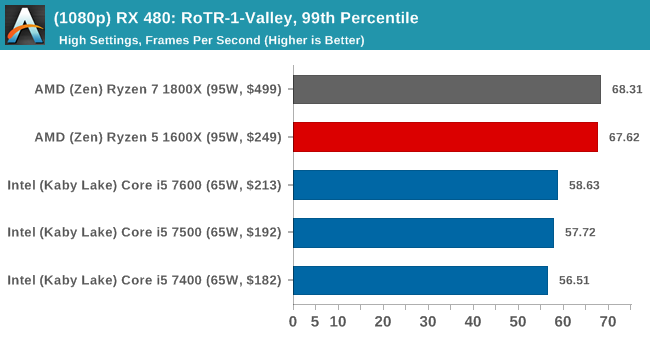
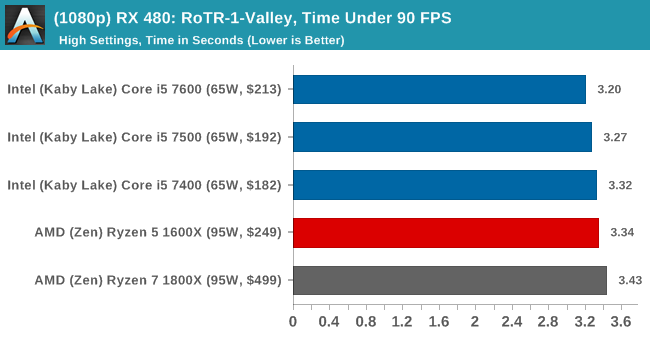
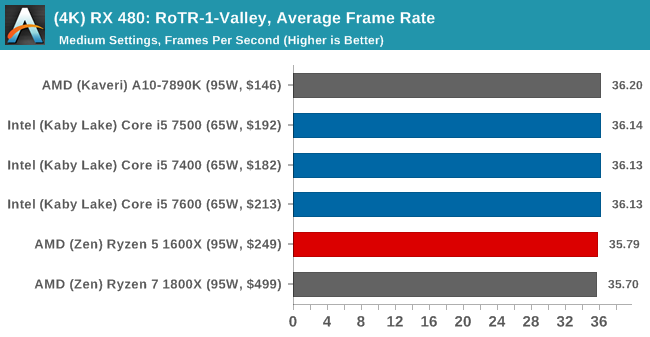
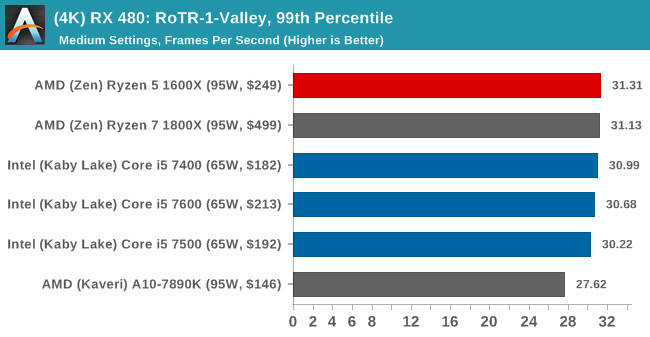
Shadow of Mordor leans towards the higher IPC of Intel, as the DX11 title cannot take advantage of the cores as much. Rise of the Tomb Raider’s benchmark is notorious for having each of its three seconds perform differently with respect to CPU scaling, with the Prophets scene being more CPU limited than the rest of the stage in the game.
Rocket League using an AMD CPU + AMD GPU actually provides more equal results with NVIDIA GPUs, however there's a performance drop using Ryzen + NVIDIA, which potentially correlates towards a driver bug but we're not 100% sure what is going on. Grand Theft Auto is a mixed bag, despite being a DX11 title – in some situations the Ryzen 5 is ahead of the Intel CPUs, or they all perform about the same, or the Intel CPUs pull ahead.
I have $250, What Should I Get – the Core i5 7600/7600K or the Ryzen 5 1600X?
Platform wise, the Intel side can offer more features on Z270 over AM4, however AMD would point to the lower platform cost of B350 that could be invested elsewhere in a system.
On performance, for anyone wanting to do intense CPU work, the Ryzen gets a nod here. Twelve threads are hard to miss at this price point. For more punchy work, you need a high frequency i5 to take advantage of the IPC differences that Intel has.
For gaming, our DX12 titles show a plus for AMD in any CPU limited scenario, such as Civilization or Rise of the Tomb Raider in certain scenes. For e-Sports, and most games based on DX9 or DX11, the Intel CPU is still a win here.


