Original Link: https://www.anandtech.com/show/10543/the-skylake-core-i3-51w-cpu-review-i3-6320-6300-6100-tested
The Skylake Core i3 (51W) CPU Review: i3-6320, i3-6300 and i3-6100 Tested
by Ian Cutress on August 8, 2016 9:00 AM EST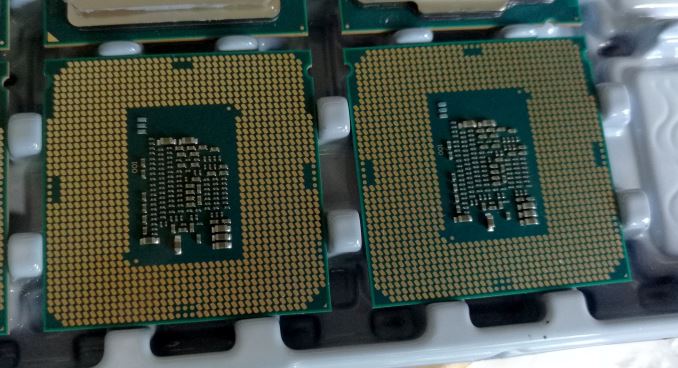
Out of every generation of Intel processors, the headline acts are the high core count parts, the ones with a high-frequency or the most expensive models. Of course, any manufacturer that has a high performing halo product will want that story out of the door on day one, but for typical user sales, it is the mid-range that is more relevant. The Intel Core i3 line comes without any Turbo, offering a flat frequency at load, and is synonymous with dual-core configurations with hyperthreading. In this review, we test three of the Core i3 processors, the i3-6100, the i3-6300 and i3-6320, all of which are set at a 51W thermal design power.
The Skylake Core i3 (51W) Review
Intel’s mainstream desktop processor line, using the latest Skylake microarchitecture, currently sits at 30 different socketable processors. Most of these are available for purchase for system builds, although some of the lower power/specialized parts will be found in OEM systems only or select customers. These processors are subdivided into five ‘families’, with broad ranging feature sets designed to increase as we move through the stack.
| Intel's Mainstream Consumer Skylake Product Segments | ||||||
| Core i7 | Core i5 | Core i3 | Pentium | Celeron | ||
| TDP Options | 35W 65W 91W |
35W 65W 91W |
35W 51W 54W |
35W 51W 54W |
35W 51W |
|
| Price | $303 to $339 |
$182 to $242 |
$117 to $158 |
$64 to $85 |
$42 to $52 |
|
| Cores | 4 | 4 | 2 | 2 | 2 | |
| Hyperthreading | Yes | No | Yes | No | No | |
| L3 Cache | 8 MB | 6 MB | 4MB: 62/63 3MB: 61/60 |
3 MB | 2 MB | |
| Base Freq | 2.4-4.0 GHz | 2.2-3.5 GHz | 2.7-3.9 GHz | 3.4-3.6 GHz | 2.3-2.9 GHz | |
| Turbo Freq | 3.4-4.2 GHz | 2.9-3.9 GHz | - | - | - | |
| DRAM Support | DDR4-2133 DDR3L-1600 |
|||||
| ECC | No | No | Yes | Yes | Yes | |
| IGP | HD 530 | All | All but P | All but P | G45 | - |
| HD 510 | - | 6402P | 6098P | G44 | All | |
| AVX | Yes | Yes | Yes | No | No | |
| TSX | Yes | Yes on 65/66 No on 64 |
No | No | No | |
| SGX | Yes | Yes | Yes | Yes | Yes | |
| MPX | Yes | Yes | Yes | No | No | |
The Core i3 line sits in the middle, with two cores and hyperthreading enabled. There are three variants of Core i3 processor: the regular non-lettered models at 51W (e.g. i3-6300), the low power models at 35W (i3-6100T, i3-6100TE) and a single downgraded graphics SKU at 54W (i3-6098P).
The Core i3 processors are the lowest specification of the range to enable AVX 2.0, indicating that AVX is a ‘Core’ feature, over a Pentium or Celeron. Similarly, MPX (Memory Protection Extensions) is only on Core i3 and up. By contrast, transactional extensions are not on the Core i3 models, and are only available on Core i5 and above.
What makes the i3 line a little different to most is the L3 cache variation within the family. Typically the more cache a processor has (or the higher associativity of the cache), and the more cache that a processor has at lower levels, the less important the speed of higher cache/memory levels become. Low levels of cache are typically expensive SRAMs that also take up die area that might be better suited for lower latency logic, hence why we have a tiered cache system rather than just gigabytes of L1 cache.
Core i3 processors either come with 3 MB or 4 MB of L3 cache. This will mean that, as a general rule of thumb, the processors with 4 MB will have to access main memory fewer times, and can hold more data closer to the core logic. This keeps the processors working as much as possible, and should afford obvious benefits in benchmarks where the data cannot fit as easily into cache.
Processors with names that start i3-63xx will have 4MB of L3 cache, whereas the i3-61xx variants only have 3MB, except the Core i3-6100TE which has 4 MB. As confusing as that is, here’s a full table of every LGA1151 socketable Skylake processor released/announced:
| Intel's Skylake LGA1151 CPUs CPUs in Bold have been Tested (some not written up, yet) |
||||||||
| C/T | L3 | Base | Turbo | HD | HD Turbo | TDP | MSRP (OEM) |
|
| Core i7-6700K | 4/8 | 8 MB | 4.0 | 4.2 | 530 | 1150 | 91W | $339 |
| Core i7-6700 | 4/8 | 8 MB | 3.4 | 4.0 | 530 | 1150 | 65W | $303 |
| Core i7-6700T | 4/8 | 8 MB | 2.8 | 3.6 | 530 | 1100 | 35W | $303 |
| Core i7-6700TE | 4/8 | 8 MB | 2.4 | 3.4 | 530 | 1000 | 35W | $303 |
| Core i5-6600K | 4/4 | 6 MB | 3.5 | 3.9 | 530 | 1150 | 91W | $242 |
| Core i5-6600 | 4/4 | 6 MB | 3.3 | 3.9 | 530 | 1150 | 65W | $213 |
| Core i5-6500 | 4/4 | 6 MB | 3.2 | 3.6 | 530 | 1050 | 65W | $192 |
| Core i5-6400 | 4/4 | 6 MB | 2.7 | 3.3 | 530 | 950 | 65W | $182 |
| Core i5-6600T | 4/4 | 6 MB | 2.7 | 3.5 | 530 | 1100 | 35W | $213 |
| Core i5-6500T | 4/4 | 6 MB | 2.5 | 3.1 | 530 | 1100 | 35W | $192 |
| Core i5-6400T | 4/4 | 6 MB | 2.2 | 2.8 | 530 | 950 | 35W | $192 |
| Core i5-6500TE | 4/4 | 6 MB | 2.3 | 3.3 | 530 | 1000 | 35W | $192 |
| Core i5-6402P | 4/4 | 6 MB | 2.8 | 3.4 | 510 | 950 | 65W | $182 |
| Core i3-6320 | 2/4 | 4 MB | 3.9 | - | 530 | 1150 | 51W | $149 |
| Core i3-6300 | 2/4 | 4 MB | 3.8 | - | 530 | 1150 | 51W | $138 |
| Core i3-6100 | 2/4 | 3 MB | 3.7 | - | 530 | 1050 | 51W | $117 |
| Core i3-6300T | 2/4 | 4 MB | 3.3 | - | 530 | 950 | 35W | $138 |
| Core i3-6100T | 2/4 | 3 MB | 3.2 | - | 530 | 950 | 35W | $117 |
| Core i3-6100TE | 2/4 | 4 MB | 2.7 | - | 530 | 1000 | 35W | $117 |
| Core i3-6098P | 2/4 | 3 MB | 3.6 | - | 510 | 1050 | 54W | $117 |
| Pentium G4520 | 2/2 | 3 MB | 3.6 | - | 530 | 1050 | 51W | $85 |
| Pentium G4500 | 2/2 | 3 MB | 3.5 | - | 530 | 1050 | 51W | $75 |
| Pentium G4400 | 2/2 | 3 MB | 3.3 | - | 510 | 1000 | 54W | $64 |
| Pentium G4500T | 2/2 | 3 MB | 3.0 | - | 530 | 950 | 35W | $75 |
| Pentium G4400T | 2/2 | 3 MB | 2.9 | - | 510 | 950 | 35W | $64 |
| Pentium G4500TE | 2/2 | 3 MB | 2.4 | - | 510 | 950 | 35W | $70 |
| Celeron G3920 | 2/2 | 2 MB | 2.9 | - | 510 | 950 | 51W | $52 |
| Celeron G3900 | 2/2 | 2 MB | 2.8 | - | 510 | 950 | 51W | $42 |
| Celeron G3900T | 2/2 | 2 MB | 2.6 | - | 510 | 950 | 35W | - |
| Celeron G3900TE | 2/2 | 2 MB | 2.3 | - | 510 | 950 | 35W | $42 |
Originally Turbo mode was introduced in order to be able to push the frequency of a single core (or two) when the software only uses a small number of threads. This allows for extra performance while still keeping within the TDP of the processor. The Core i3 processors do not have a turbo mode by design: when any of the possible threads are in action, the processor will run the cores at the rated base frequency on the box. This should allow for more repeatable results in benchmarks, as long as background tasks do not interfere with the CPU time of a small number of cores.
The pricing of the Skylake processors is such that moving up from a lower family to a higher family is a sufficient jump in price, and there is no overlap. Moving from a Core i3 to a Core i5 for example, is a minimum $23 (from $158 for a boxed i3-6320 to $182 for the i5-6400) for more cache and more physical cores, albeit with the same number of threads and lower core frequencies.
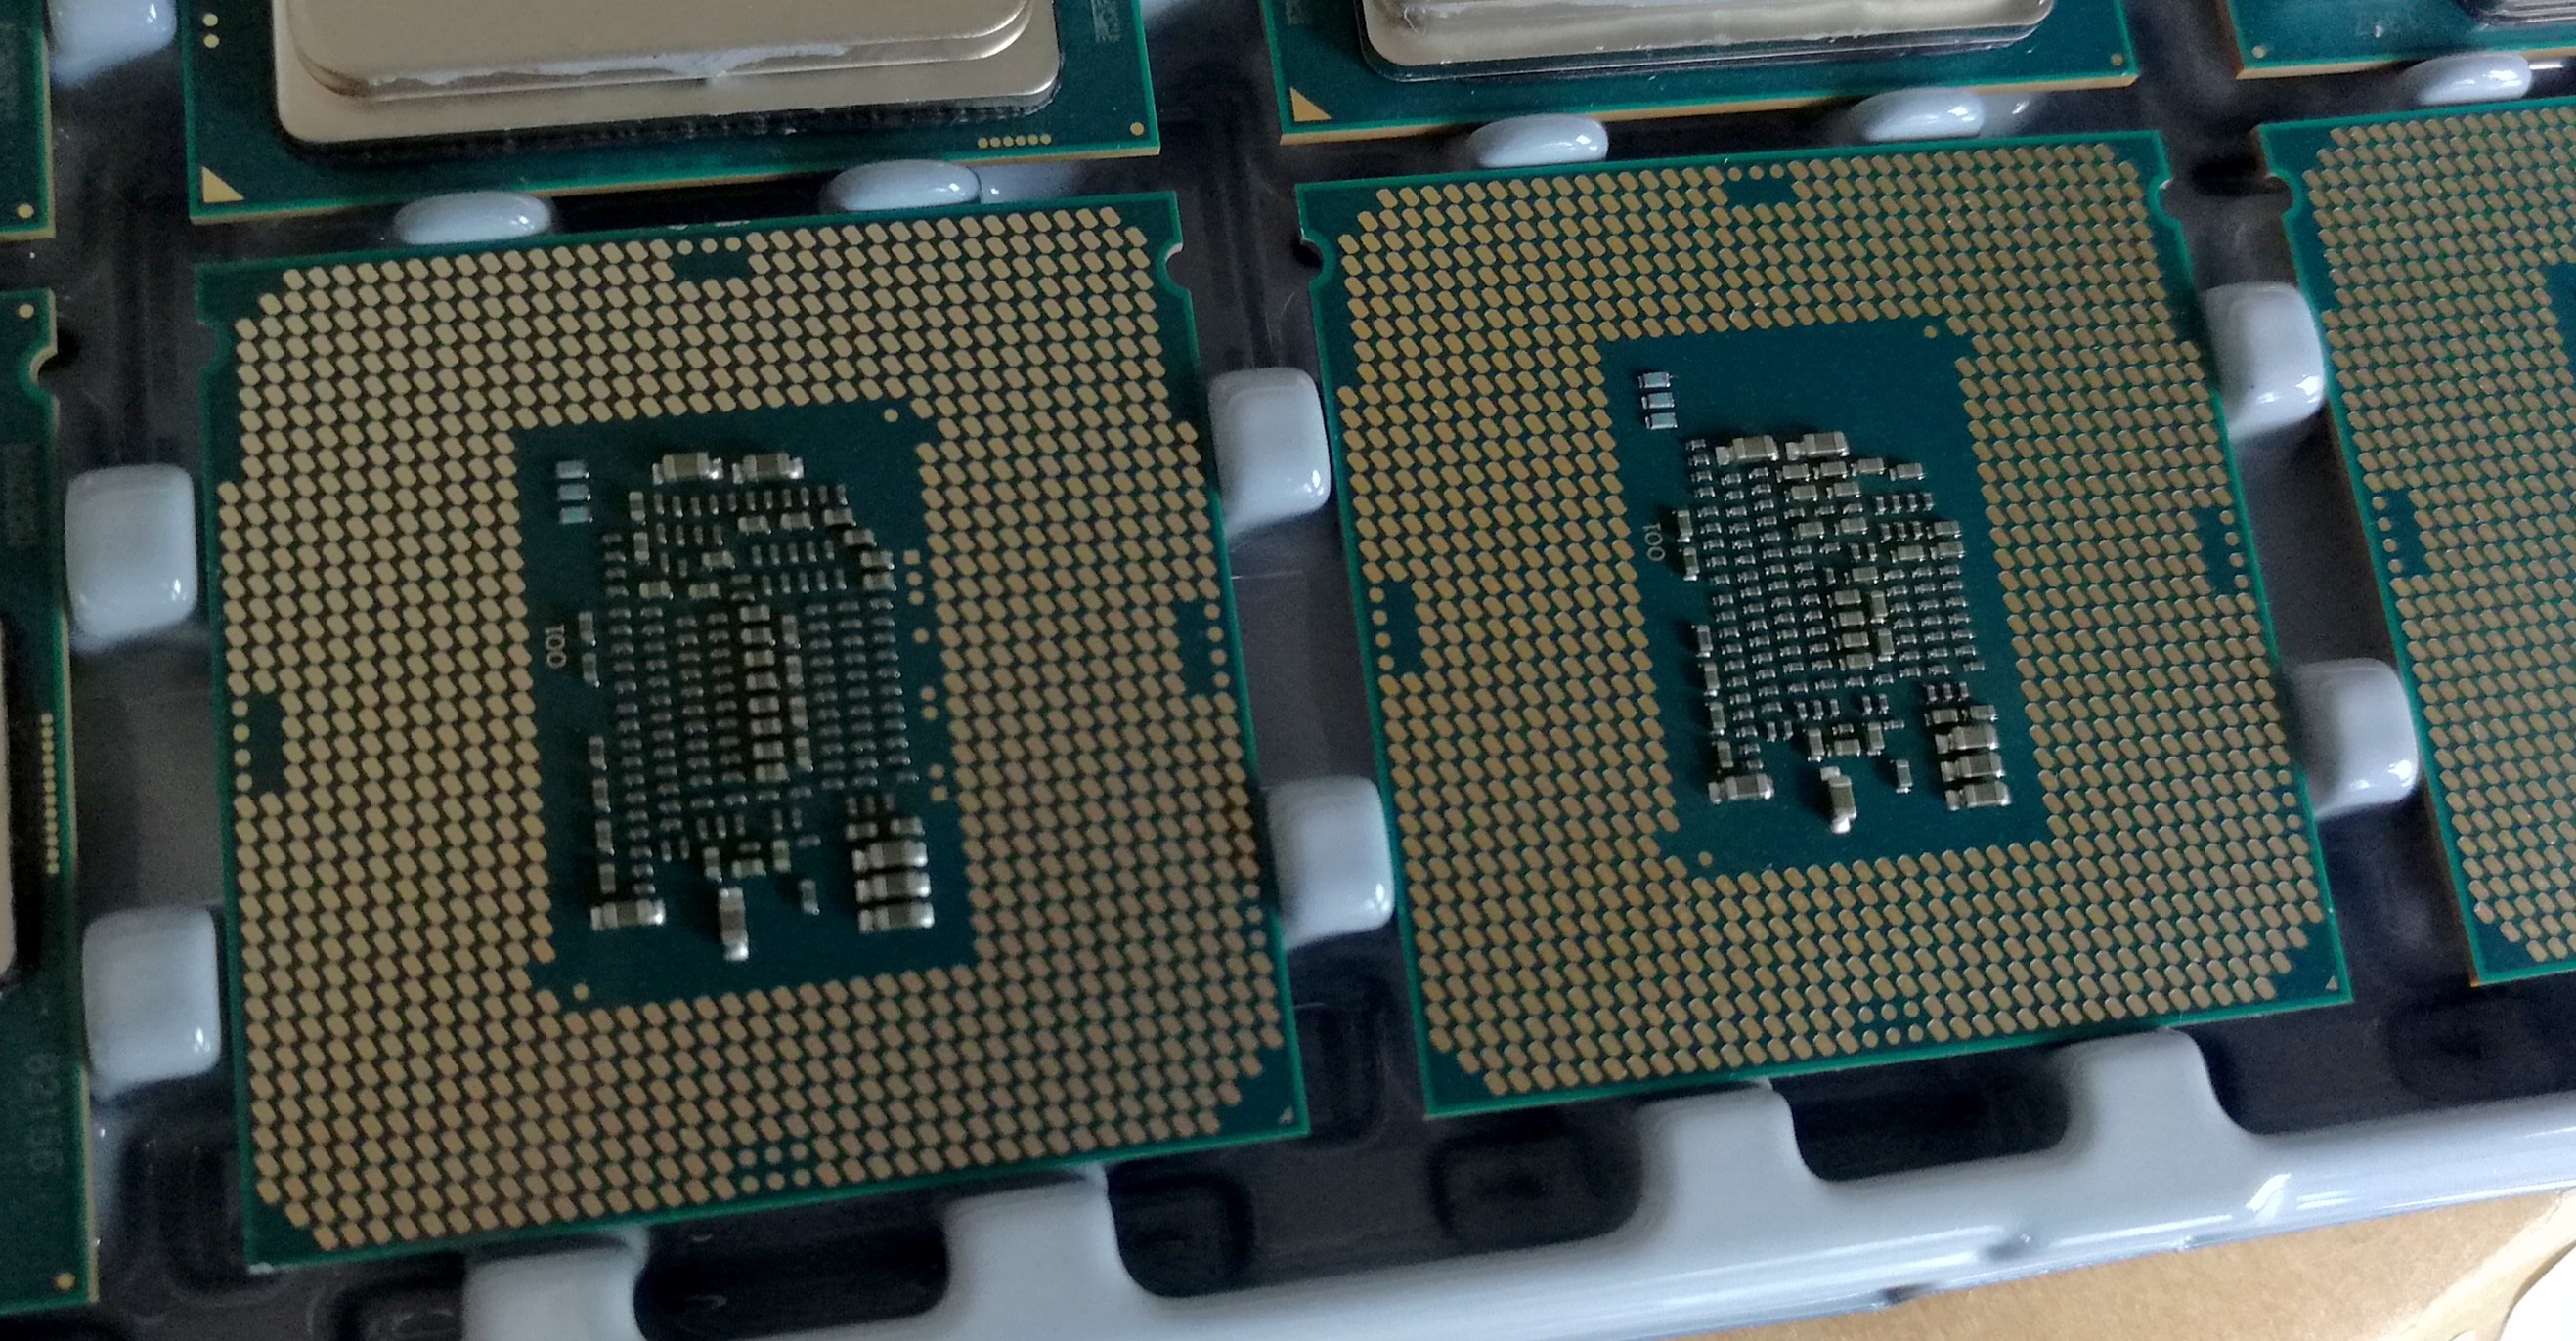
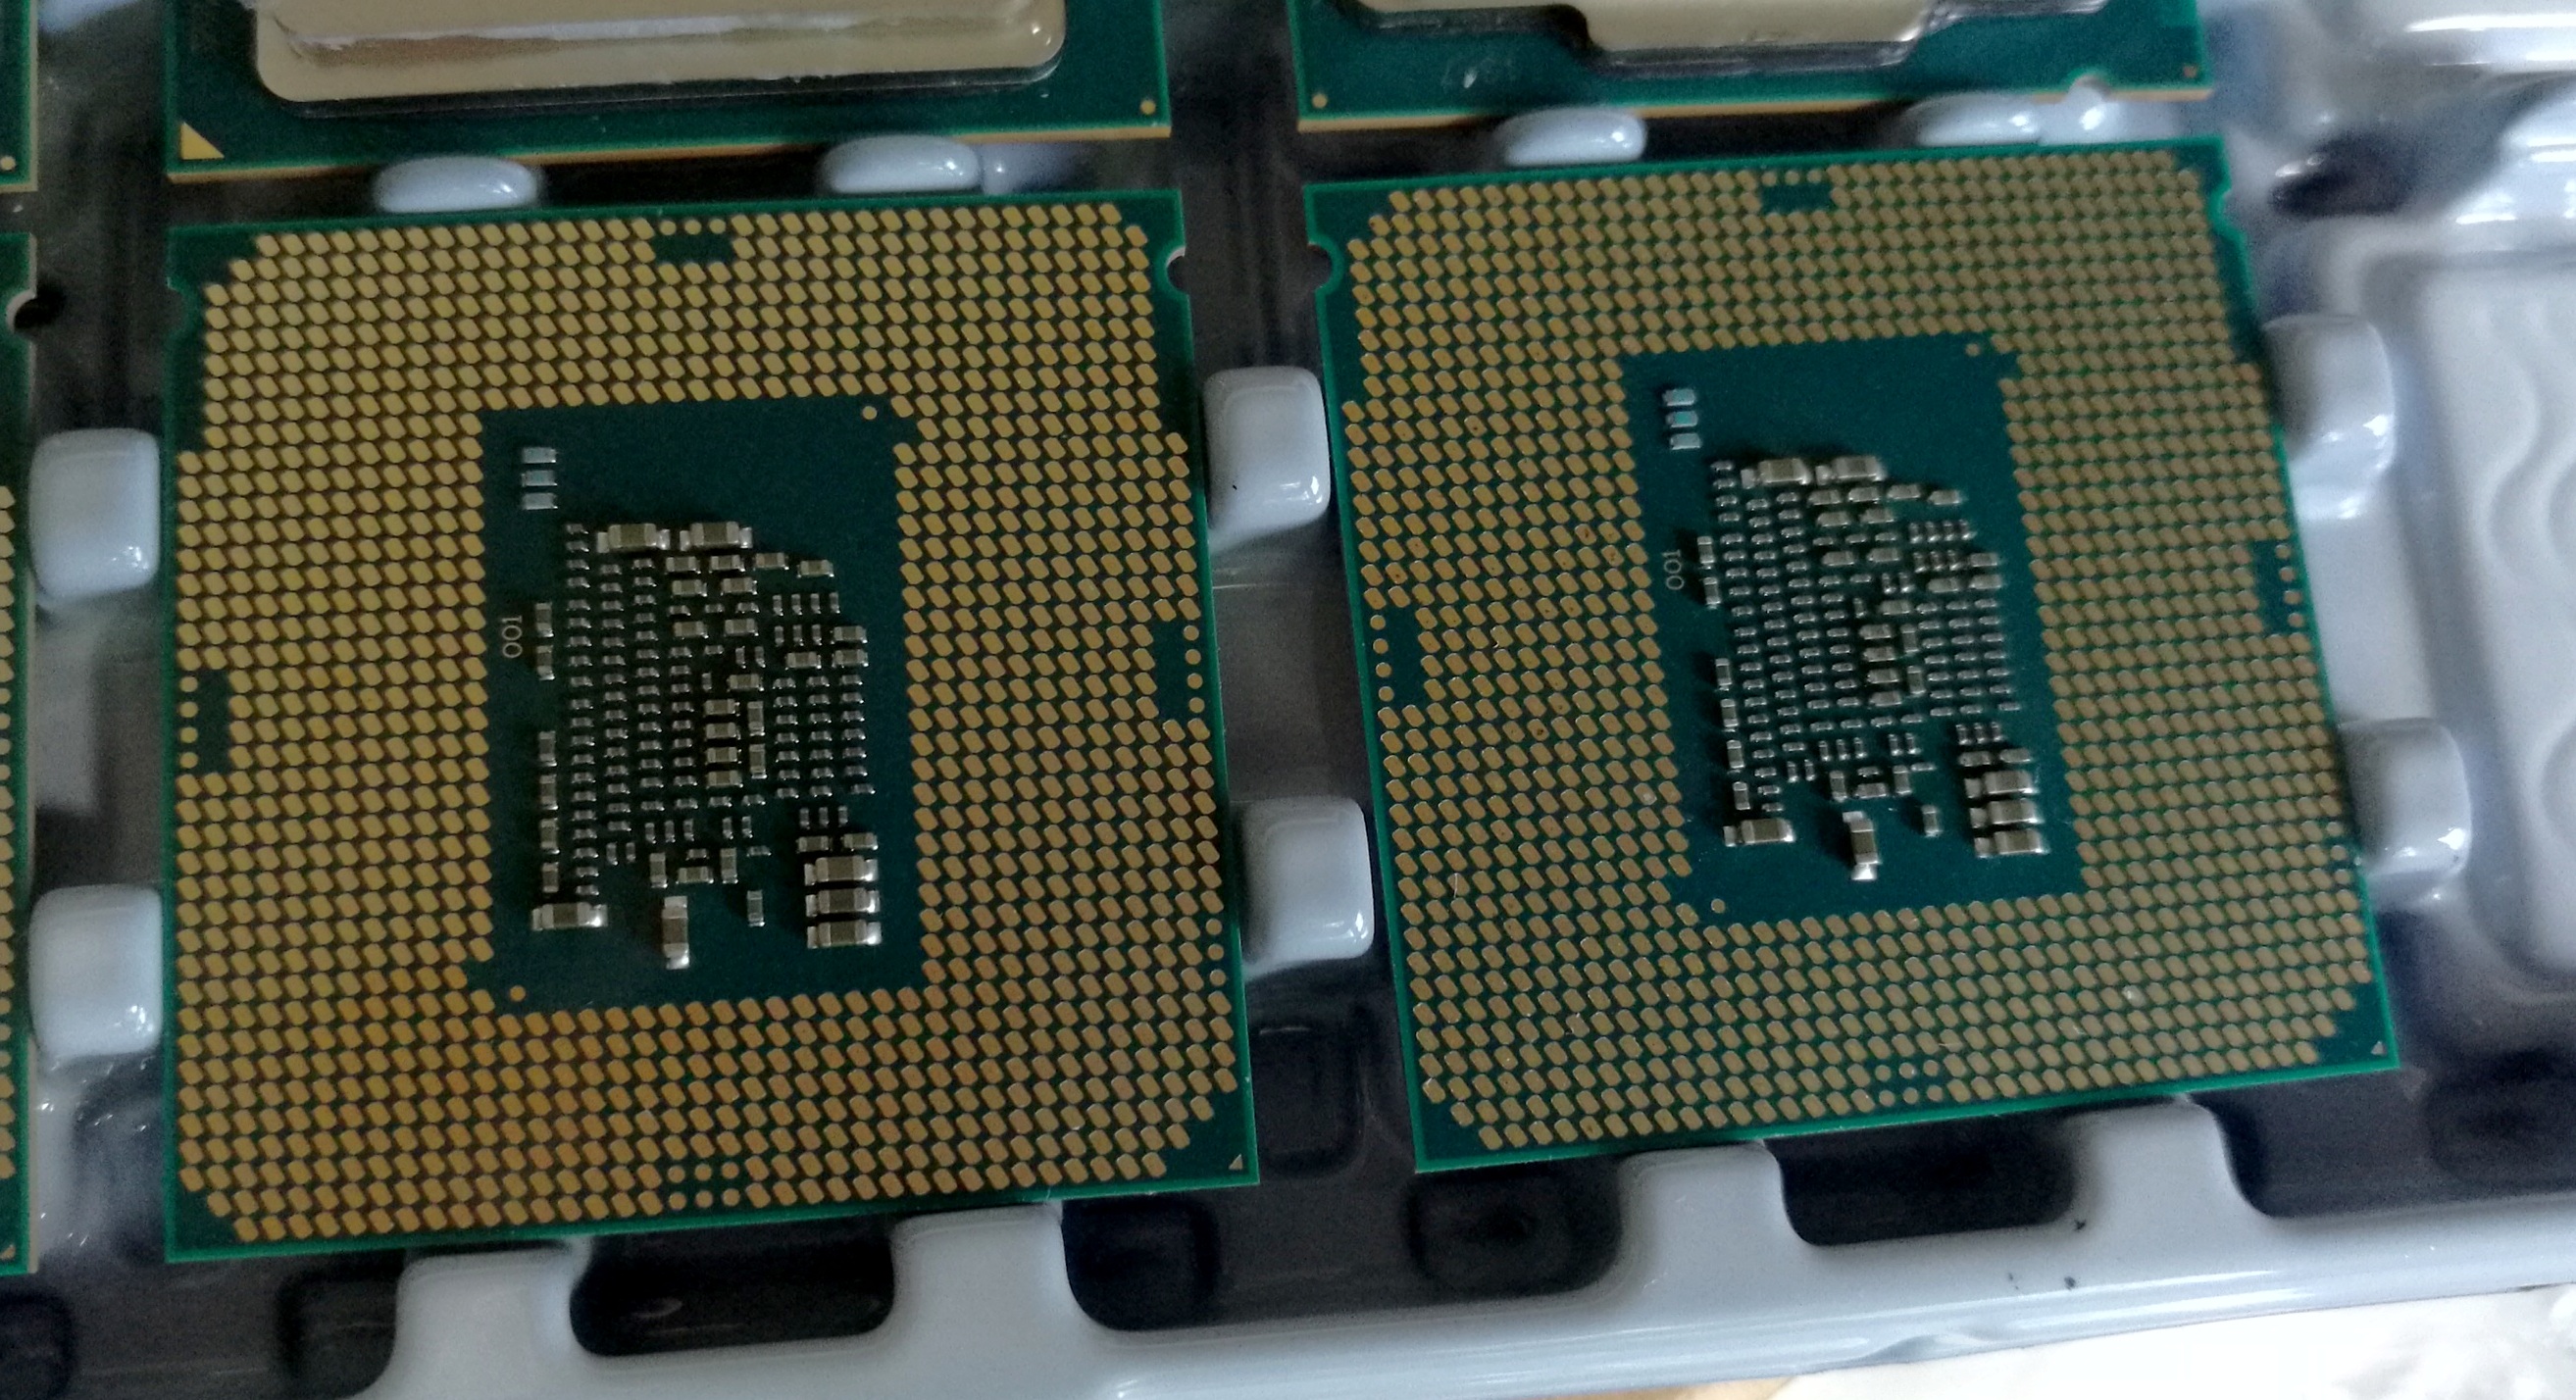
Core i3-6100TE vs Core i3-6100
Looking at the rear of the processors, the lower power Core i3-6100TE, compared to the others (6100/6300/6320 are all the same), has extra capacitors and transistors on the bottom which presumably assist with lower power operation. As the i3-6100TE has a lower frequency to assist with power consumption, the extra components may help shift the efficiency of the processor to nearer the 35W mode. The T/TE variants are typically slightly more expensive than the standard versions, and part of this may be from the additional hardware required.
Competition and Market
One could argue that the Core i3 line is aimed at bulk system production where fast response times are important but high compute functions such as video editing are not. The Core i3 is often earmarked as a processor for entry level gaming, providing enough horsepower to drive medium graphics cards at reasonable resolutions without being a bottleneck. This becomes important if more game development engines and studios adapt their programming models to go beyond 2-4 threads or cores.
Users coming into the Core i3 arena may be updating from an older machine, or looking at a fixed budget and trying to get bang-for-buck. Going back to entry level gaming and sub-$800 systems, users will pull out the Core i3 as an example. What will be interesting here is to see if that L3 cache difference between the Core i3-6100 and Core i3-6300 will be significant.
On the other side of the x86 fence is AMD’s A10-7000 and FX-8000 processor lines. As the Core i3 processors are available for $117-$158, this fits in with the several AMD options. Some of the AMD options have the recently released and updated AMD CPU cooler, which we reviewed recently in a stock cooler roundup. Based on our extensive testing, this 'free' cooler adds value to the AMD offerings, which is not always apparent in benchmark data or when comparing price for performance.
From AMD’s dual-module APUs with superior integrated graphics:
- A10-7860K at $117, free $30 CPU cooler,
- A10-7890K at $165, free $30 CPU cooler
And AMD’s slightly older FX line with either six or eight threads, but no IGP:
- FX-8350 at $199 (launch price)
- FX-8320E at $147
- FX-6350 at $132
Putting these together gives the following table:
| CPU Competition at $115-$150 | |||||||
| Intel Core i3 | AMD A10 | AMD FX | |||||
| i3-6100 | i3-6300 | i3-6320 | A10 7860K |
A10 7890K |
FX 6350 |
FX 8320E |
|
| TDP | 51W | 51W | 51W | 65W | 95W | 125W | 95W |
| Cores/Modules | 2 | 2 | 2 | 2 | 2 | 3 | 4 |
| Threads | 4 | 4 | 4 | 4 | 4 | 6 | 8 |
| Base Freq | 3700 | 3800 | 3900 | 3600 | 4100 | 3900 | 3200 |
| Turbo Freq | - | - | - | 4000 | 4300 | 4200 | 4000 |
| IGP | HD 530 | HD 530 | HD 530 | R7-512 | R7-512 | - | - |
| IGP GFLOPs | 403.2 | 441.6 | 441.6 | 900.0 | 1029.6 | - | - |
| DRAM | DDR4-2133 | DDR4-2133 | DDR4-2133 | DDR3-2133 | DDR3-2133 | DDR3-1866 | DDR3-1866 |
| Released | Sep '15 | Sep '15 | Sep '15 | Feb '16 | Mar '16 | Oct '12 | Sep '14 |
| Price (box) | $117 | $147 | $158 | $117 | $165 | $132 | $147 |
The FX parts, with more threads, have the deficit of being substantially older parts based on AMD’s Steamroller microarchitecture, while all the AMD parts suffer in terms of power consumption. However, for the extra TDP, there’s an uptick in integrated graphics for the APUs. Also, the AMD parts suffer a noticeable single thread performance deficit, so it will be interesting to see how this plays out on our benchmark suite.
As part of a series of reviews this quarter, we have recently retested a small number of FX processors, as well as the newer A10 processors. The data for these is available in our benchmark database, Bench.
CPUs in this Review
For this review we have tested the Core i3-6100, Core i3-6300 and Core i3-6320 processors from Intel. This builds on our review of the Core i3-6100TE, where we explored overclocking on Core i3. As was apparent in that review, trying to get a motherboard with an older microcode to allow overclocking on a Core i3 is somewhat difficult, and results were not over the moon, so we won’t be producing overclocking numbers for these parts here (and I might have broken the OC motherboard accidentally trying some out-of-the-box thinking).
Intel Core i3-6320

Intel Core i3-6300
Intel Core i3-6100 (with lower L3 Cache)
Nonetheless, the landscape for Core i3 should be very interesting. We put these CPUs through our long-form CPU 2015 tests, including our Real World, Office and Professional tests, while the 2016 suite is still being built. The CPUs were also used with five high-caliber gaming titles, with low, mid and high-end GPUs. We then end with the final countdown analysis. Any of the links below will jump straight to the respective page.
Pages In This Review
Skylake Core i3 (51W) Analysis
Test Bed and Setup
Benchmark Overview
Stock Comparison: Real World
Stock Comparison: Office
Stock Comparison: Linux
Stock Comparison: Legacy
Gaming Comparison: Alien Isolation
Gaming Comparison: Total War: Attila
Gaming Comparison: Grand Theft Auto
Gaming Comparison: Grid Autosport
Gaming Comparison: Shadow of Mordor
Test Bed
As per our processor testing policy, we take a premium category motherboard suitable for the socket, and equip the system with a suitable amount of memory running at the manufacturer's maximum supported frequency. This is also typically run at JEDEC subtimings where possible. It is noted that some users are not keen on this policy, stating that sometimes the maximum supported frequency is quite low, or faster memory is available at a similar price, or that the JEDEC speeds can be prohibitive for performance. While these comments make sense, ultimately very few users apply memory profiles (either XMP or other) as they require interaction with the BIOS, and most users will fall back on JEDEC supported speeds - this includes home users as well as industry who might want to shave off a cent or two from the cost or stay within the margins set by the manufacturer. Where possible, we will extend out testing to include faster memory modules either at the same time as the review or a later date.
| Test Setup | |
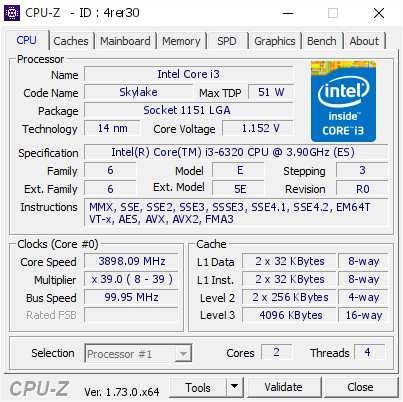
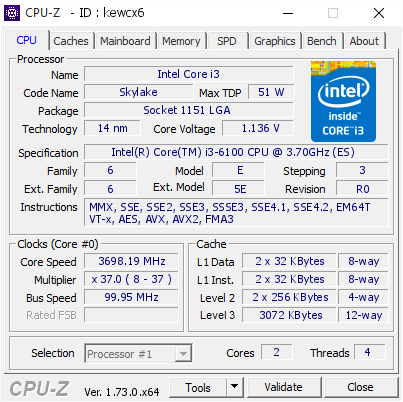
| Processor | Intel Core i3-6320, 2C/4T, 4MB L3, 3.9 GHz Intel Core i3-6300, 2C/4T, 4MB L3, 3.8 GHz Intel Core i3-6100, 2C/4T, 3MB L3, 3.7 GHz |
| Motherboards | ASUS Maximus VIII Extreme |
| Cooling | Cooler Master Nepton 140XL |
| Power Supply | Antec 1200W High Current Pro |
| Memory | Crucial DDR4-2133 C15 4x8 1.35V |
| Memory Settings | JEDEC |
| Video Cards | ASUS GTX 980 Strix 4GB MSI R9 290X Gaming 4G MSI GTX 770 Lightning 2GB MSI R9 285 Gaming 2G ASUS R7 240 2GB |
| Hard Drive | Crucial MX200 1TB |
| Monitor | Viewsonic VX2270XMH-LED 22-inch FHD |
| Case | Open Test Bed |
| Operating System | Windows 7 64-bit SP1 |
We must thank the following companies for kindly providing hardware for our multiple test beds. Some of this hardware is not in this test bed specifically, but they are used in other testing.
Many thanks to...
Thank you to AMD for providing us with the R9 290X 4GB GPUs. These are MSI branded 'Gaming' models, featuring MSI's Twin Frozr IV dual-fan cooler design and military class components. Bundled with the cards is MSI Afterburner for additional overclocking, as well as MSI's Gaming App for easy frequency tuning.
The R9 290X is a second generation GCN card from AMD, under the Hawaii XT codename, and uses their largest Sea Islands GPU die at 6.2 billion transistors at 438mm2 built at TSMC using a 28nm process. For the R9 290X, that means 2816 streaming processors with 64 ROPs using a 512-bit memory bus to GDDR5 (4GB in this case). The official power rating for the R9 290X is 250W.
The MSI R9 290X Gaming 4G runs the core at 1000 MHz to 1040 MHz depending on what mode it is in (Silent, Gaming or OC), and the memory at 5 GHz. Displays supported include one DisplayPort, one HDMI 1.4a, and two dual-link DVI-D connectors.
Further Reading: AnandTech's AMD R9 290X Review

Thank you to ASUS for providing us with GTX 980 Strix GPUs. At the time of release, the STRIX brand from ASUS was aimed at silent running, or to use the marketing term: '0dB Silent Gaming'. This enables the card to disable the fans when the GPU is dealing with low loads well within temperature specifications. These cards equip the GTX 980 silicon with ASUS' Direct CU II cooler and 10-phase digital VRMs, aimed at high-efficiency conversion. Along with the card, ASUS bundles GPU Tweak software for overclocking and streaming assistance.
The GTX 980 uses NVIDIA's GM204 silicon die, built upon their Maxwell architecture. This die is 5.2 billion transistors for a die size of 298 mm2, built on TMSC's 28nm process. A GTX 980 uses the full GM204 core, with 2048 CUDA Cores and 64 ROPs with a 256-bit memory bus to GDDR5. The official power rating for the GTX 980 is 165W.
The ASUS GTX 980 Strix 4GB (or the full name of STRIX-GTX980-DC2OC-4GD5) runs a reasonable overclock over a reference GTX 980 card, with frequencies in the range of 1178-1279 MHz. The memory runs at stock, in this case 7010 MHz. Video outputs include three DisplayPort connectors, one HDMI 2.0 connector and a DVI-I.
Further Reading: AnandTech's NVIDIA GTX 980 Review

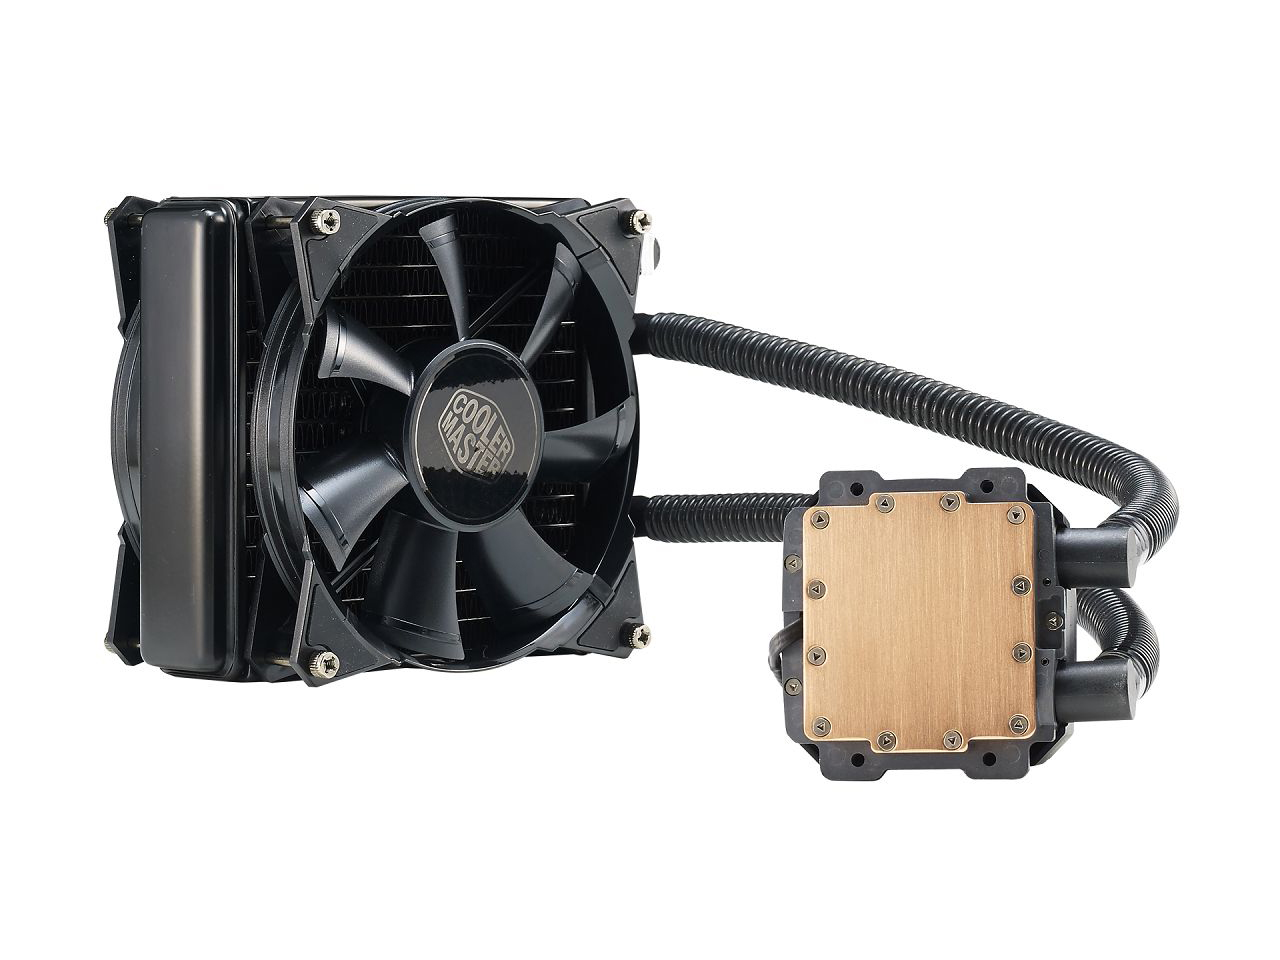
Thank you to Cooler Master for providing us with Nepton 140XL CLCs. The Nepton 140XL is Cooler Master's largest 'single' space radiator liquid cooler, and combines with dual 140mm 'JetFlo' fans designed for high performance, from 0.7-3.5mm H2O static pressure. The pump is also designed to be faster, more efficient, and uses thicker pipes to assist cooling with a rated pump noise below 25 dBA. The Nepton 140XL comes with mounting support for all major sockets, as far back as FM1, AM2 and 775.
Further Reading: AnandTech's Cooler Master Nepton 140XL Review
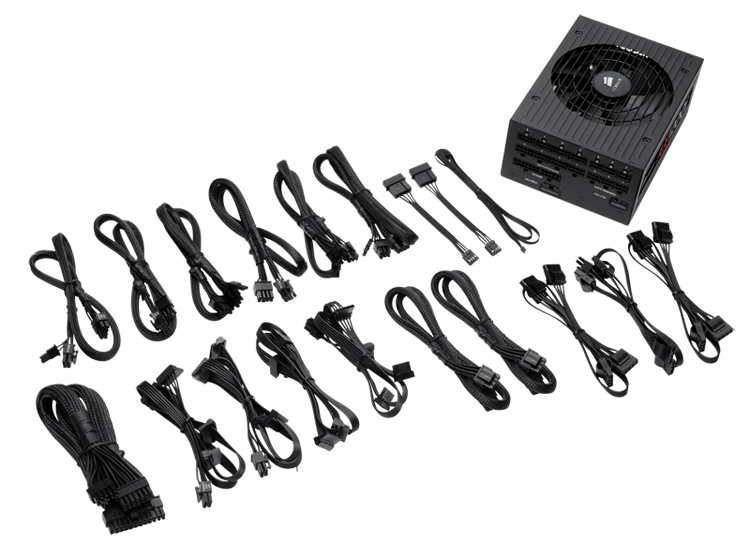
Thank you to Corsair for providing us with an AX1200i PSU. The AX1200i was the first power supply to offer digital control and management via Corsair's Link system, but under the hood it commands a 1200W rating at 50C with 80 PLUS Platinum certification. This allows for a minimum 89-92% efficiency at 115V and 90-94% at 230V. The AX1200i is completely modular, running the larger 200mm design, with a dual ball bearing 140mm fan to assist high-performance use. The AX1200i is designed to be a workhorse, with up to 8 PCIe connectors for suitable four-way GPU setups. The AX1200i also comes with a Zero RPM mode for the fan, which due to the design allows the fan to be switched off when the power supply is under 30% load.
Further Reading: AnandTech's Corsair AX1500i Power Supply Review
Thank you to Crucial for providing us with MX200 SSDs. Crucial stepped up to the plate as our benchmark list grows larger with newer benchmarks and titles, and the 1TB MX200 units are strong performers. Based on Marvell's 88SS9189 controller and using Micron's 16nm 128Gbit MLC flash, these are 7mm high, 2.5-inch drives rated for 100K random read IOPs and 555/500 MB/s sequential read and write speeds. The 1TB models we are using here support TCG Opal 2.0 and IEEE-1667 (eDrive) encryption and have a 320TB rated endurance with a three-year warranty.
Further Reading: AnandTech's Crucial MX200 (250 GB, 500 GB & 1TB) Review

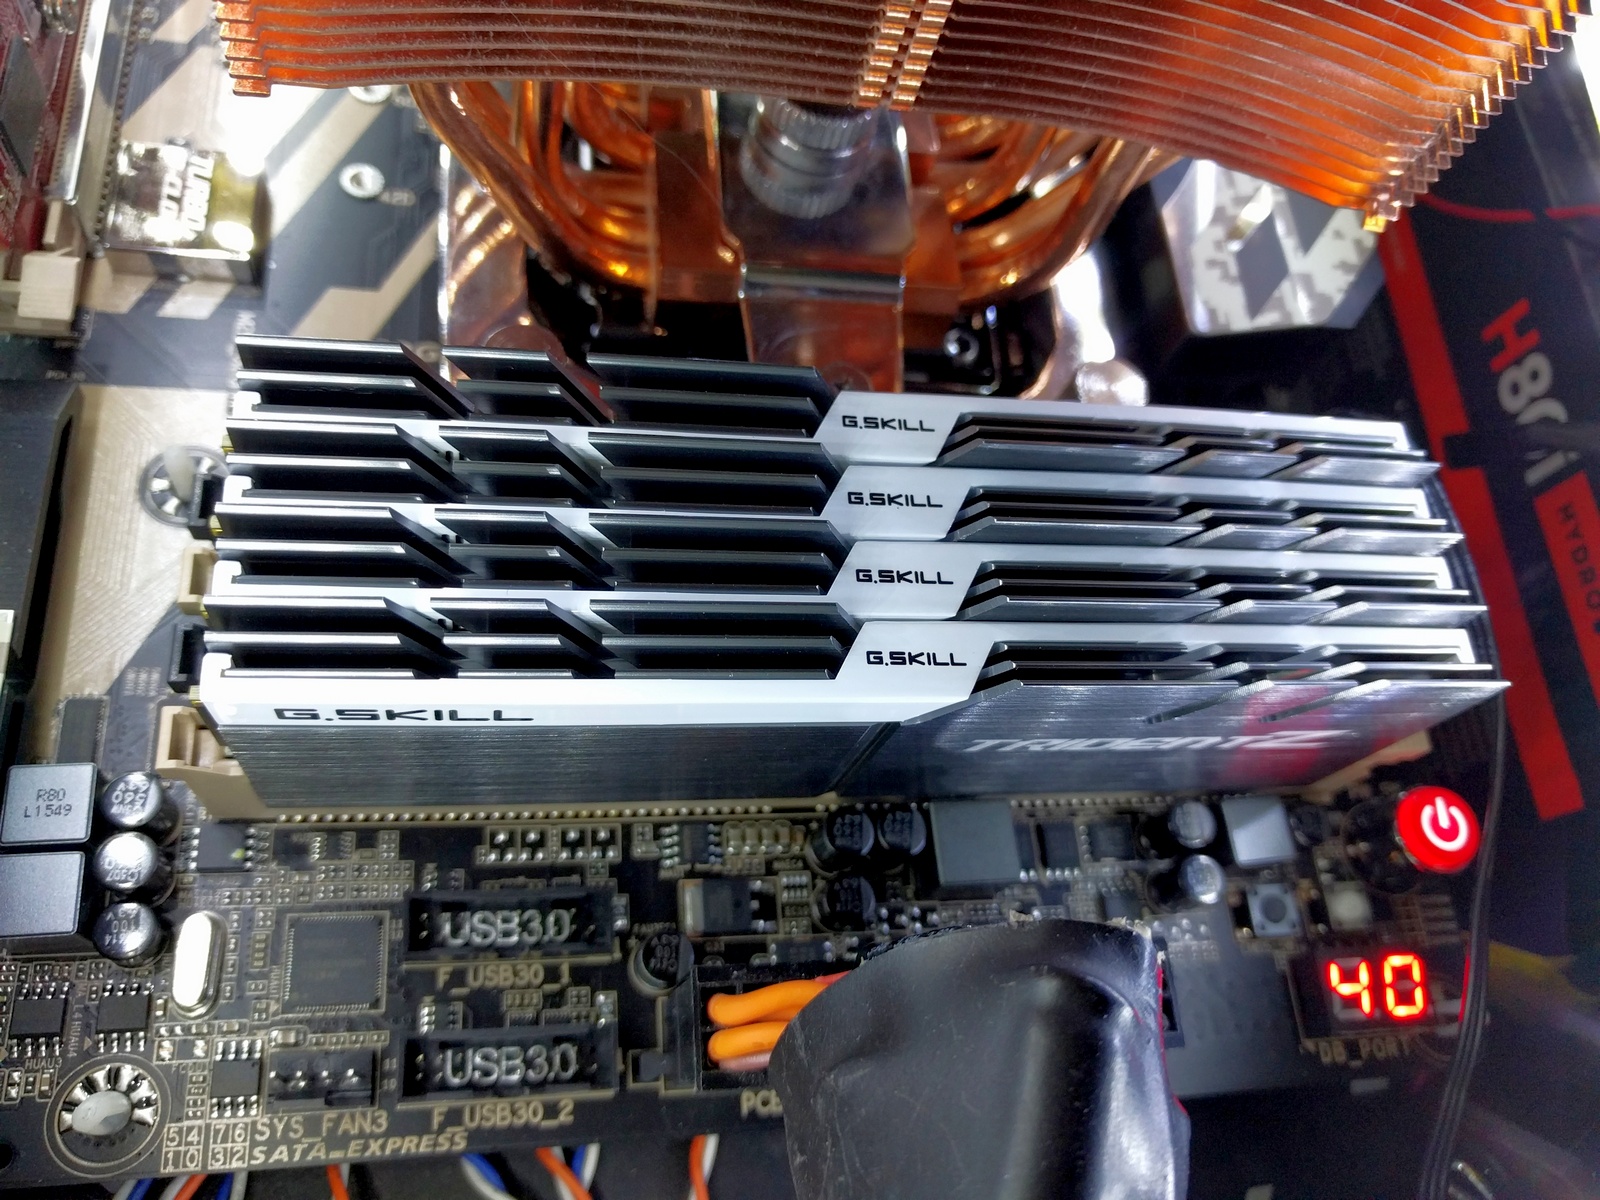
Thank you to G.Skill for providing us with memory. G.Skill has been a long-time supporter of AnandTech over the years, for testing beyond our CPU and motherboard memory reviews. We've reported on their high capacity and high-frequency kits, and every year at Computex G.Skill holds a world overclocking tournament with liquid nitrogen right on the show floor. One of the most recent deliveries from G.Skill was their 4x16 GB DDR4-3200 C14 Kit, which we are planning for an upcoming review.
Further Reading: AnandTech's Memory Scaling on Haswell Review, with G.Skill DDR3-3000
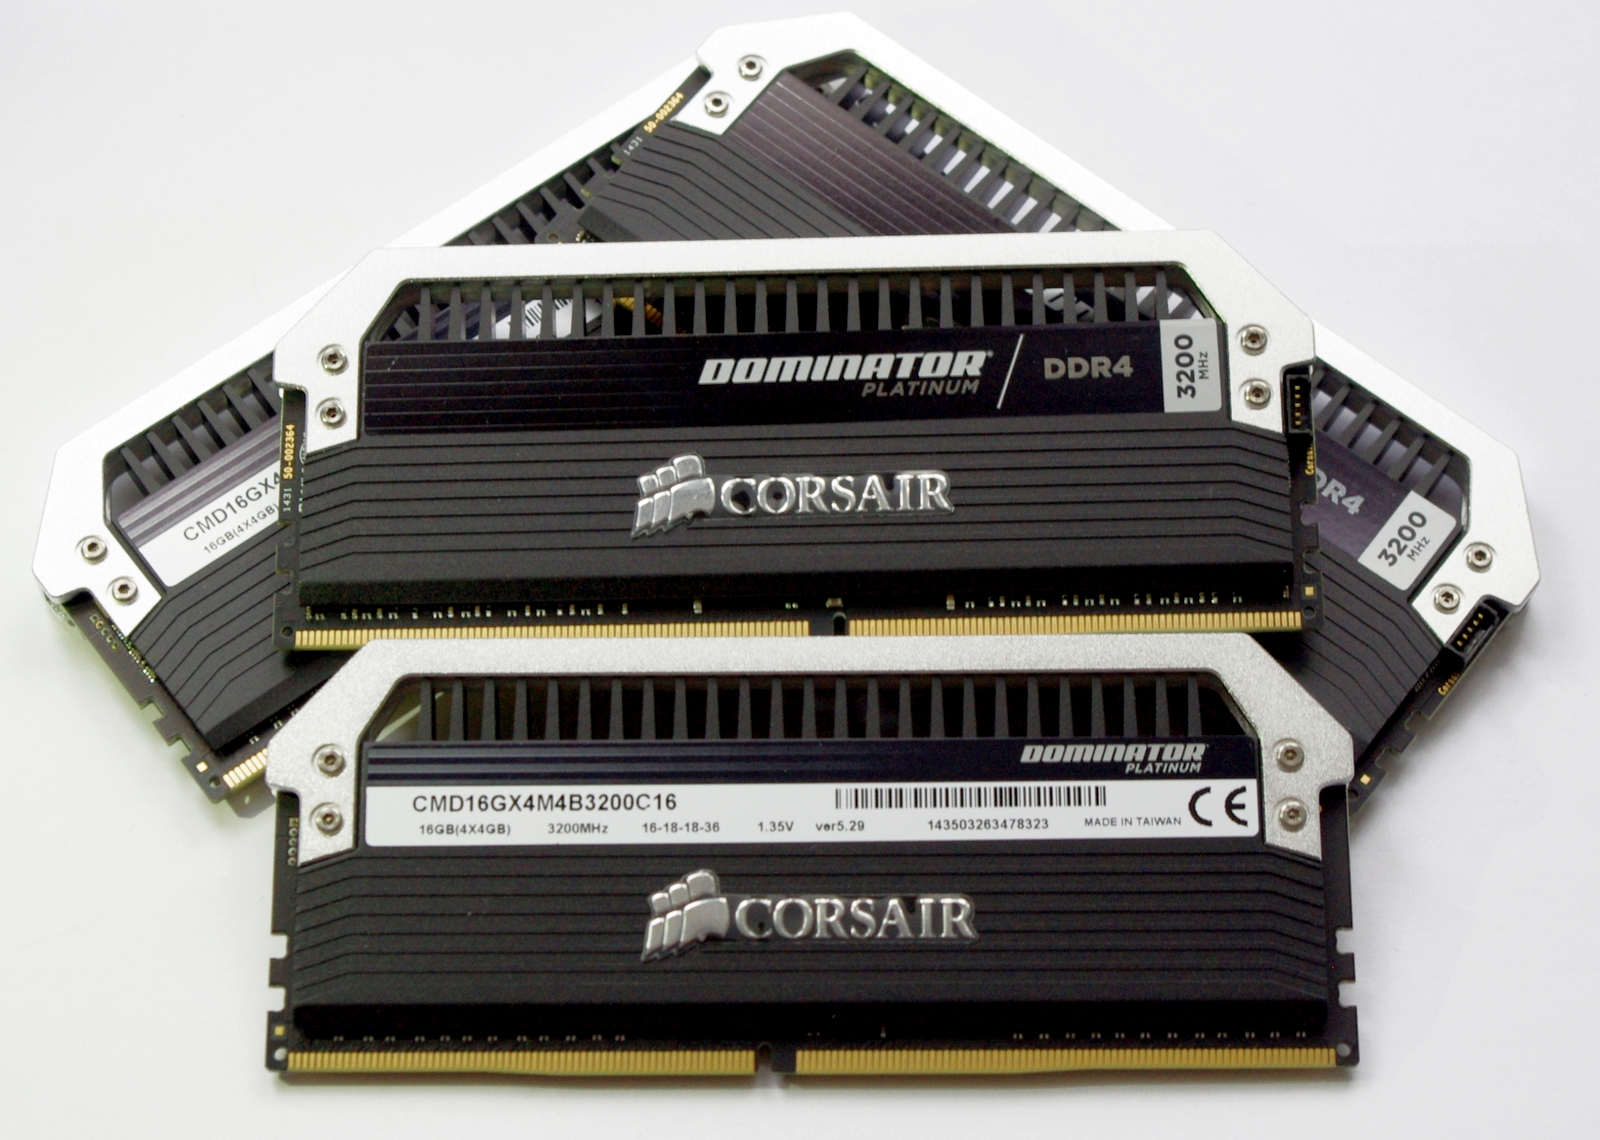
Thank you to Corsair for providing us with memory. Similarly, Corsair (along with PSUs) is also a long-time supporter of AnandTech. Being one of the first vendors with 16GB modules for DDR4 was a big deal, and now Corsair is re-implementing LEDs back on its memory after a long hiatus along with supporting specific projects such as ASUS ROG versions of the Dominator Platinum range. We're currently looking at our review pipeline to see when our next DRAM round-up will be, and Corsair is poised to participate.
Further Reading: AnandTech's Memory Scaling on Haswell-E Review
Benchmark Overview
For our testing, depending on the product, we attempt to tailor the presentation of our global benchmark suite down into what users who would buy this hardware might actually want to run. Barring abnormalities, our full test suite is typically used to gather data and all the results are placed into Bench, our benchmark database for users that want to look at non-typical benchmarks or legacy data.
The benchmarks fall into several areas:
Short Form CPU
Our short form testing script uses a straight run through of a mixture of known apps or workloads, and requires about four hours. These are typically the CPU tests we run in our motherboard suite, to identify any performance anomolies.
| CPU Short Form Benchmarks | ||
| Three Dimensional Particle Movement (3DPM) | v1 | 3DPM is a self-penned benchmark, derived from my academic research years looking at particle movement parallelism. The coding for this tool was rough, but emulates the real world in being non-CompSci trained code for a scientific endeavor. The code is unoptimized, but the test uses OpenMP to move particles around a field using one of six 3D movement algorithms in turn, each of which is found in the academic literature. This test is performed in single thread and multithreaded workloads, and uses purely floating point numbers. The code was written in Visual Studio 2008 in Release mode with all optimizations (including fast math and -Ox) enabled. We take the average of six runs in each instance. |
| v2 | The second version of this benchmark is similar to the first, however it has been re-written in VS2012 with one major difference: the code has been written to address the issue of false sharing. If data required by multiple threads, say four, is in the same cache line, the software cannot read the cache line once and split the data to each thread - instead it will read four times in a serial fashion. The new software splits the data to new cache lines so reads can be parallelized and stalls minimized. As v2 is fairly new, we are still gathering data and results are currently limited. |
|
| WinRAR 5.01 | WinRAR is a compression based software to reduce file size at the expense of CPU cycles. We use the version that has been a stable part of our benchmark database through 2015, and run the default settings on a 1.52GB directory containing over 2800 files representing a small website with around thirty half-minute videos. We take the average of several runs in this instance. | |
| POV-Ray 3.7 beta | POV-Ray is a common ray-tracing tool used to generate realistic looking scenes. We've used POV-Ray in its various guises over the years as a good benchmark for performance, as well as a tool on the march to ray-tracing limited immersive environments. We use the built-in multithreaded benchmark. | |
| HandBrake | HandBrake is a freeware video conversion tool. We use the tool in to process two different videos - first a 'low quality' two hour video at 640x388 resolution to x264, then a 'high quality' ten minute video at 4320x3840. The low quality video scales at lower performance hardware, whereas the buffers required for high-quality can stretch even the biggest processors. At current, this is a CPU only test. | |
| 7-Zip | 7-Zip is a freeware compression/decompression tool that is widely deployed across the world. We run the included benchmark tool using a 50MB library and take the average of a set of fixed-time results. | |
Web, Synthetic and Legacy
The web tests are a usual mix of Octane/Kraken with WebXPRT in the mix. Synthetic and Legacy CPU testing relates to our long-term data under CineBench and x264.
| Web and Synthetic Benchmarks | |
| Google Octane 2.0 | Lots of factors go into web development, including the tools used and the browser those tools play in. One of the common and widely used benchmarks to judge performance is Google Octane, now in version 2.0. To quote: 'The updated Octane 2.0 benchmark includes four new tests to measure new aspects of JavaScript performance, including garbage collection / compiler latency and asm.js-style JavaScript performance.' |
| Mozilla Kraken 1.1 | Kraken is a similar tool to Google, focusing on web tools and processing power. Kraken's tools include searching algorithms, audio processing, image filtering, flexible database parsing and cryptographic routines. |
| WebXPRT 2013/2015 | WebXPRT aims to be a souped up version of Octane and Kraken, using these tools in real time to display data in photograph enhancement, sorting, stock options, local storage manipulation, graphical enterfaces and even filtering algorithms on scientific datasets. We run the 2013 and 2015 versions of the benchmark. |
| Cinebench | Cinebench is a widely known benchmarking tool for measuring performance relative to MAXON's animation software Cinema 4D. Cinebench has been optimized over a decade and focuses on purely CPU horsepower, meaning if there is a discrepancy in pure throughput characteristics, Cinebench is likely to show that discrepancy. Arguably other software doesn't make use of all the tools available, so the real world relevance might purely be academic, but given our large database of data for Cinebench it seems difficult to ignore a small five minute test. We run the modern version 15 in this test, as well as the older 11.5 due to our back data. |
| x264 HD 3.0 | Similarly, the x264 HD 3.0 package we use here is also kept for historic regressional data. The latest version is 5.0.1, and encodes a 1080p video clip into a high quality x264 file. Version 3.0 only performs the same test on a 720p file, and in most circumstances the software performance hits its limit on high end processors, but still works well for mainstream and low-end. Also, this version only takes a few minutes, whereas the latest can take over 90 minutes to run. |
| TrueCrypt 7.1 | Before its discontinuation, TrueCrypt was a popular tool for WindowsXP to offer software encryption to a file system. The near-latest version, 7.1, is still widely used however the developers have stopped supporting it since the introduction of encrypted disk support in Windows 8/7/Vista from 5/2014, and as such any new security issues are unfixed. |
Long Form and Professional Benchmarks
For reviews that require a little more depth, we invoke our long form CPU tests. These scripts include the short form tests, the web tests, and bundle some real-world tests that are influenced by processor frequency, core count, cache sizes and memory support. Generational advances between CPU microarchitectures show up here as well. Our professional tests involve a 2D to 3D image and model conversion tool used by archivists and modelers as well as Linux Bench. We are currently looking into expanding our professional testing suite to include code compilation as well as FPGA workflows.
| Long Form and Professional Benchmarks | |
| Dolphin 4.0 (Wii Emulation) |
Many emulators are often bound by single thread CPU performance, and general reports tended to suggest that Haswell provided a significant boost to emulator performance. This benchmark runs a Wii program that raytraces a complex 3D scene inside the Dolphin Wii emulator. Performance on this benchmark is a good proxy of the speed of Dolphin CPU emulation, which is an intensive single core task using most aspects of a CPU. |
| Agisoft Photoscan 1.0 | Photoscan is professional software that takes a series of 2D images (as little as 50, usually 250+) and 'performs calculations' to determine where the pictures were taken and if it can create a 3D model and textures of what the images are of. This model can then be exported to other software for touch-ups or implementation in physics engines/games or, as the reader that directed me to it, national archiving. The tool has four phases, one of which can be OpenCL accelerated, while the other three are a mix of single thread and variable thread workloads. |
| Linux Bench | Linux Bench is a collection of Linux based benchmarks compiled together by ServeTheHome. The idea for this is to have some non-windows based tools that are easy enough to run with a USB key, an internet connection and three lines of code in a terminal. The tests in Linux Bench include standard synthetic compute, compression, matrix manipulation, database tools and key-value storage. |
Gaming
Our Gaming test suite is still our 2015 implementation, which remains fairly solid over gaming title updates. We are still working on a 2016 suite update, with a move to Windows 10. This will allow most of the titles to be replaced with DirectX 12, indie and eSports games.
| Gaming Benchmarks | |
| Alien: Isolation | If first person survival mixed with horror is your sort of thing, then Alien: Isolation, based off of the Alien franchise, should be an interesting title. Developed by The Creative Assembly and released in October 2014, Alien: Isolation has won numerous awards from Game Of The Year to several top 10s/25s and Best Horror titles, ratcheting up over a million sales by February 2015. Alien: Isolation uses a custom built engine which includes dynamic sound effects and should be fully multi-core enabled. |
| Total War: Attila | The Total War franchise moves on to Attila, another The Creative Assembly development, and is a stand-alone strategy title set in 395AD where the main story line lets the gamer take control of the leader of the Huns in order to conquer parts of the world. Graphically the game can render hundreds/thousands of units on screen at once, all with their individual actions and can put some of the big cards to task. |
| Grand Theft Auto V | The highly anticipated iteration of the Grand Theft Auto franchise finally hit the shelves on April 14th 2015, with both AMD and NVIDIA in tow to help optimize the title. GTA doesn’t provide graphical presets, but opens up the options to users and extends the boundaries by pushing even the hardest systems to the limit using Rockstar’s Advanced Game Engine. Whether the user is flying high in the mountains with long draw distances or dealing with assorted trash in the city, when cranked up to maximum it creates stunning visuals but hard work for both the CPU and the GPU. |
| GRID: Autosport | No graphics tests are complete without some input from Codemasters and the EGO engine, which means for this round of testing we point towards GRID: Autosport, the next iteration in the GRID and racing genre. As with our previous racing testing, each update to the engine aims to add in effects, reflections, detail and realism, with Codemasters making ‘authenticity’ a main focal point for this version. |
| Middle-Earth: Shadow of Mordor | The final title in our testing is another battle of system performance with the open world action-adventure title, Shadow of Mordor. Produced by Monolith using the LithTech Jupiter EX engine and numerous detail add-ons, SoM goes for detail and complexity to a large extent, despite having to be cut down from the original plans. The main story itself was written by the same writer as Red Dead Redemption, and it received Zero Punctuation’s Game of The Year in 2014. |
Real World Performance
The dynamics of CPU Turbo modes, both Intel and AMD, can cause concern during environments with a variable threaded workload. There is also an added issue of the motherboard remaining consistent, depending on how the motherboard manufacturer wants to add in their own boosting technologies over the ones that Intel would prefer they used. In order to remain consistent, we implement an OS-level unique high performance mode on all the CPUs we test which should override any motherboard manufacturer performance mode.
All of our benchmark results can also be found in our benchmark engine, Bench.
Dolphin Benchmark: link
Many emulators are often bound by single thread CPU performance, and general reports tended to suggest that Haswell provided a significant boost to emulator performance. This benchmark runs a Wii program that raytraces a complex 3D scene inside the Dolphin Wii emulator. Performance on this benchmark is a good proxy of the speed of Dolphin CPU emulation, which is an intensive single core task using most aspects of a CPU. Results are given in minutes, where the Wii itself scores 17.53 minutes.
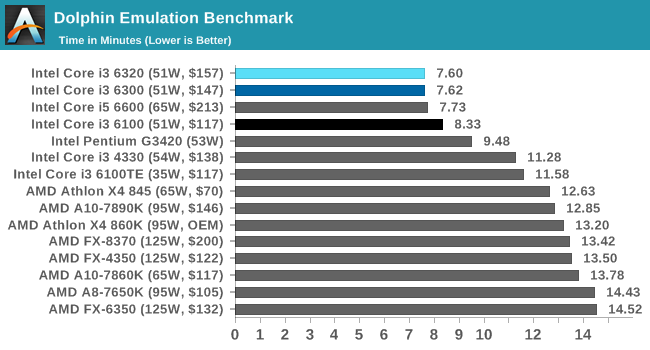
Skylake saw a good boost with our Dolphin benchmark, and it remains a single-thread driven event. The 100 MHz difference between the i3-6320 and i3-6300 amounts to just over a second difference, but one step back to the i3-6100 is another 42 seconds. This is one of the few instances where the 3 MB of L3 cache on the i3-6100 makes a significant difference. The i5-6600 sits in the middle of our i3 parts due to its lower CPU frequency but higher cache.
WinRAR 5.0.1: link
Our WinRAR test from 2013 is updated to the latest version of WinRAR at the start of 2014. We compress a set of 2867 files across 320 folders totaling 1.52 GB in size – 95% of these files are small typical website files, and the rest (90% of the size) are small 30 second 720p videos.
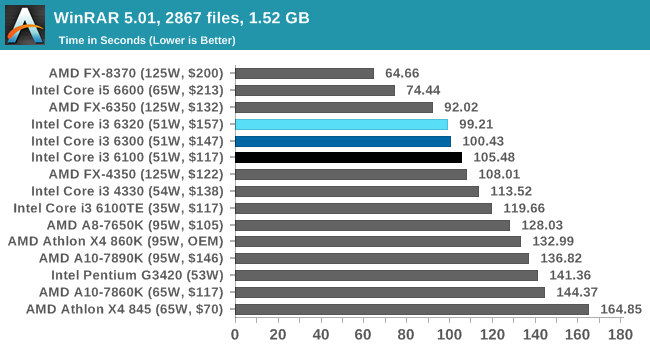
WinRAR is a variable thread test, so the CPUs with more threads all pull ahead of the i3 parts. Again, we see a crescendo from the i3-6320 to the i3-6300 and the i3-6100, with the i3-6100 being slightly further out due to its reduced L3.
3D Particle Movement v2
The second version of this benchmark is similar to the first, however it has been re-written in VS2012 with one major difference: the code has been written to address the issue of false sharing. If data required by multiple threads, say four, is in the same cache line, the software cannot read the cache line once and split the data to each thread - instead it will read four times in a serial fashion. The new software splits the data to new cache lines so reads can be parallelized and stalls minimized. As v2 is fairly new, we are still gathering data and results are currently limited.
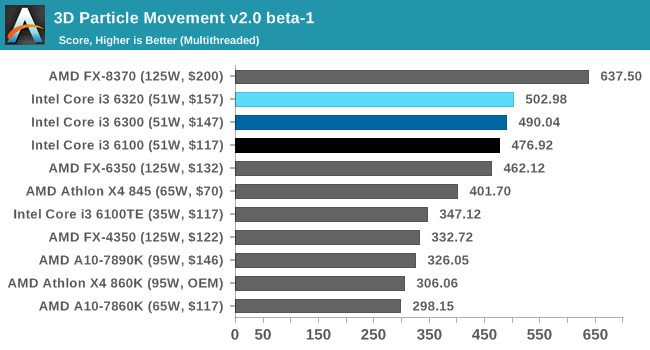
The updated 3DPM benchmark likes good cache management and a high frequency with lots of threads. As from our Carrizo review, the AMD X4 845 does really well here, beating the i3-6100TE which has a much lower frequency. For the i3 parts, we see a regular staircase between the three, outpacing the much older FX-6350.
Web Benchmarks
On the lower end processors, general usability is a big factor of experience, especially as we move into the HTML5 era of web browsing.
Mozilla Kraken
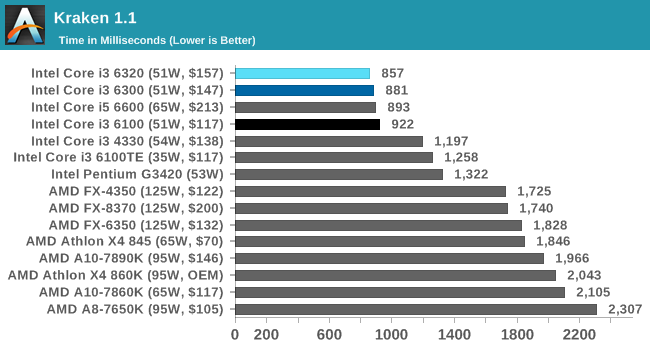
Kraken also enjoys Skylake CPUs, with a preference for high frqeuency parts as well. The regular staircase is in effect between the three, showing how L3 cache makes little difference here.
Google Octane v2
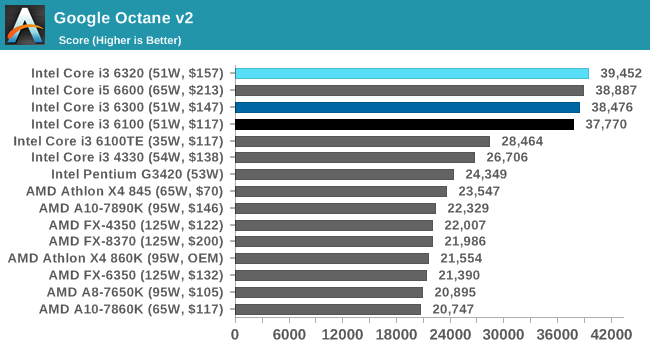
Octane has a similar performance to Kraken, with the Skylake CPUs out in top with the staircase results. The i5-6600 sits in the middle, despite having four physical cores, but restrained to four threads. Because of this and our regular staircase, we can see that the L3 cache plays little role here and the threads are very lightweight. The resources on the FX CPUs unfortunately do not do well here.
Office Performance
All of our benchmark results can also be found in our benchmark engine, Bench.
Agisoft Photoscan – 2D to 3D Image Manipulation: link
Agisoft Photoscan creates 3D models from 2D images, a process which is very computationally expensive. The algorithm is split into four distinct phases, and different phases of the model reconstruction require either fast memory, fast IPC, more cores, or even OpenCL compute devices to hand. Agisoft supplied us with a special version of the software to script the process, where we take 50 images of a stately home and convert it into a medium quality model. This benchmark typically takes around 15-20 minutes on a high end PC on the CPU alone, with GPUs reducing the time.
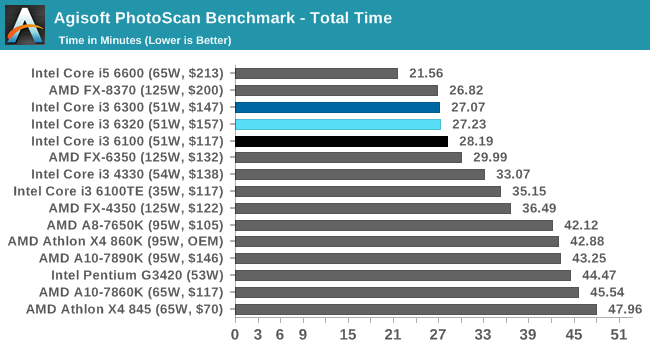
The different stages of Photoscan have different preferences for frequency and threads, but all the results are in Bench. In this case having threads matters, with the old 8-thread FX CPU barely getting ahead of the Core i3 parts. The i5 takes the lead, showing that having physical cores helps with cache management. This is further reinforced by our results staircase, which put the i3-6320 and i3-6300 at roughly equal timings but the i3-6100 almost 4% behind.
Cinebench R15
Cinebench is a benchmark based around Cinema 4D, and is fairly well known among enthusiasts for stressing the CPU for a provided workload. Results are given as a score, where higher is better.
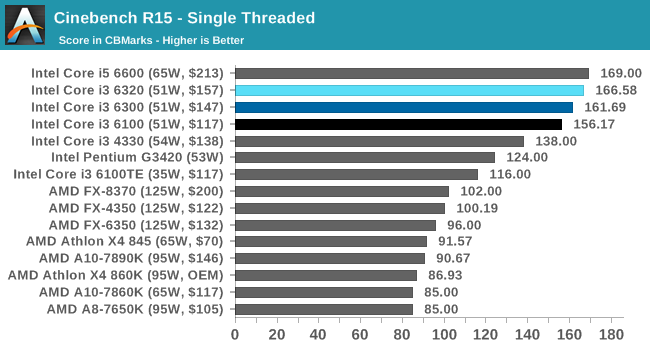
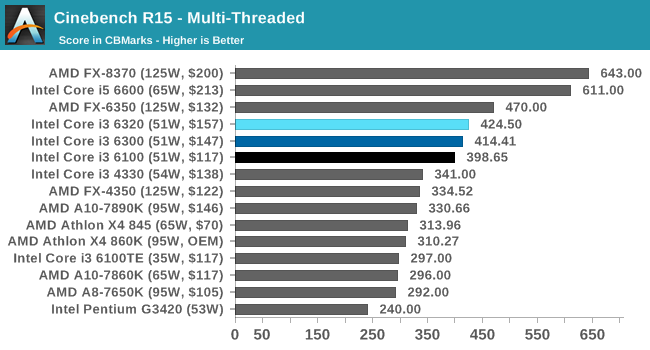
Cinebench eats threads, high IPC and high frequency for breakfast. In the single thread test, the high Intel IPC shines through, and our i3 parts sit in unison with AMD behind by up to 40%. In multithreaded land, the 6/8 thread FX processors go ahead of the i3s as expected, and our staircase slightly deviates for the i3-6100 showing that L3 cache creep is slowly coming in.
HandBrake v0.9.9: link
For HandBrake, we take two videos (a 2h20 640x266 DVD rip and a 10min double UHD 3840x4320 animation short) and convert them to x264 format in an MP4 container. Results are given in terms of the frames per second processed, and HandBrake uses as many threads as possible.
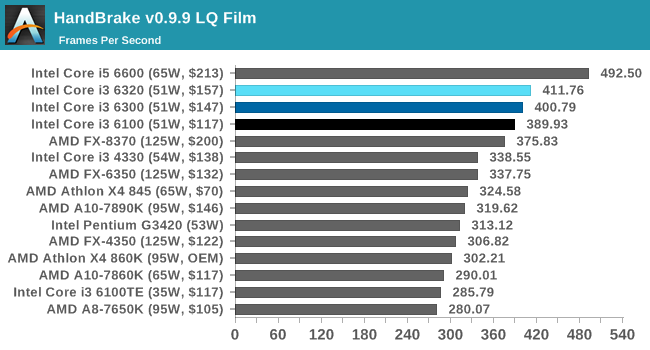
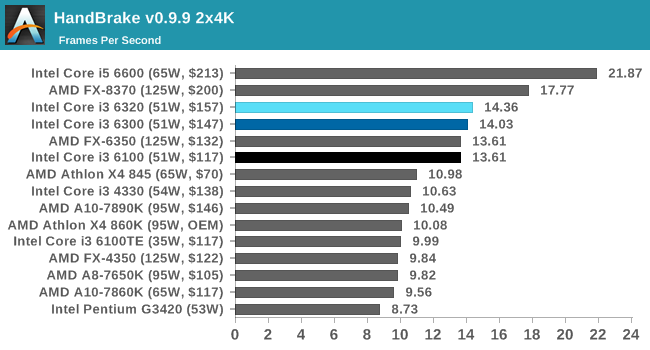
The high IPC of the Skylake parts makes a difference for the smaller frame conversion, while threads come into play for the larger resolution frames. In both cases, the regular staircase shows a lack of issues with the L3 cache differences, but it is interesting to see the X4 845 hot on the heels for the high resolution frames despite its cache arrangement. The FX-6350 sits on par with the i3-6100, showcasing the difference between a six-thread much older processor and a four thread latest process part.
Hybrid x265
Hybrid is a new benchmark, where we take a 4K 1500 frame video and convert it into an x265 format without audio. Results are given in frames per second.
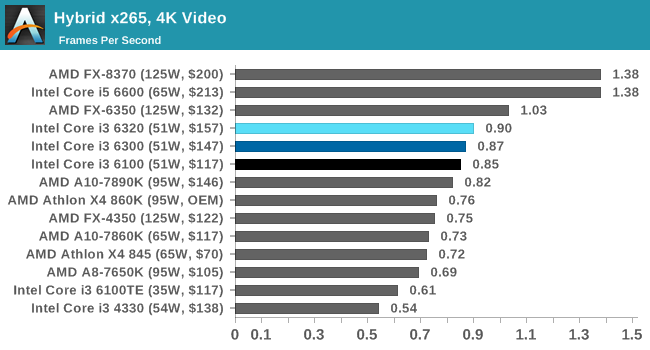
Hybrid is similar to HandBrake, and we again have a regular staircase.
Linux Performance
Built around several freely available benchmarks for Linux, Linux-Bench is a project spearheaded by Patrick at ServeTheHome to streamline about a dozen of these tests in a single neat package run via a set of three commands using an Ubuntu 11.04 LiveCD. These tests include fluid dynamics used by NASA, ray-tracing, OpenSSL, molecular modeling, and a scalable data structure server for web deployments. We run Linux-Bench and have chosen to report a select few of the tests that rely on CPU and DRAM speed.
All of our benchmark results can also be found in our benchmark engine, Bench.
C-Ray: link
C-Ray is a simple ray-tracing program that focuses almost exclusively on processor performance rather than DRAM access. The test in Linux-Bench renders a heavy complex scene offering a large scalable scenario.
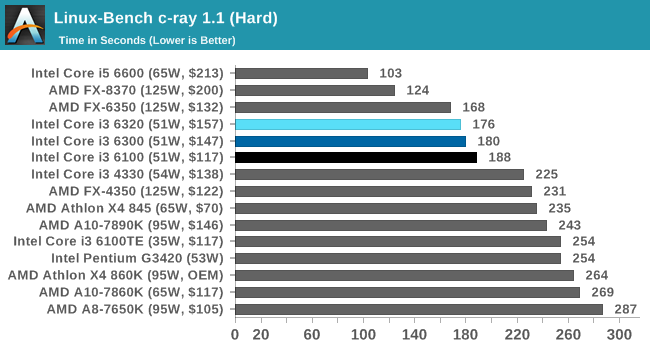
C-Ray is another bench that likes threads and high IPC cores, hence the i5-6600 sits out ahead followed by the FX-8350. At a lower price bracket, the FX-6350 with six threads wins out against the set of Core i3s, which follow their regular staircase pattern. The difference in frequency accounts for 4 seconds difference, and it seems the L3 cache difference accounts for another 4, or about 2%.
NAMD, Scalable Molecular Dynamics: link
Developed by the Theoretical and Computational Biophysics Group at the University of Illinois at Urbana-Champaign, NAMD is a set of parallel molecular dynamics codes for extreme parallelization up to and beyond 200,000 cores. The reference paper detailing NAMD has over 4000 citations, and our testing runs a small simulation where the calculation steps per unit time is the output vector.
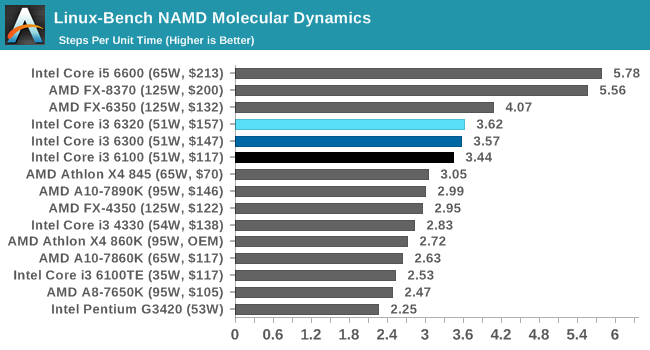
Similarly with NAMD, cores and IPC matter most. The Athlon X4 845 gets a good showing here for a $70 chip, beating the price/performance ratio of the Core i3s. Again, the AMD FX-6350 is ahead of the Core i3s, and the lopsided staircase means that the L3 cache difference accounts for another 2% loss in performance.
NPB, Fluid Dynamics: link
Aside from LINPACK, there are many other ways to benchmark supercomputers in terms of how effective they are for various types of mathematical processes. The NAS Parallel Benchmarks (NPB) are a set of small programs originally designed for NASA to test their supercomputers in terms of fluid dynamics simulations, useful for airflow reactions and design.
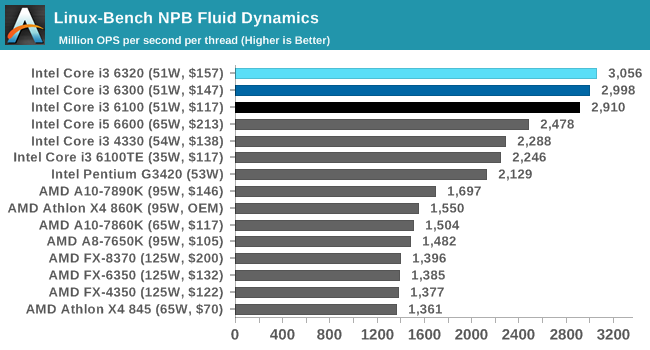
NPB clearly favors Intel CPUs, and the name of the game is IPC and frequency due to the i5 being behind the Core i3 parts. On the AMD side, the highest frequency part takes the lead and the thread count doesn't seem to matter much; neither does the microarchitecture, indicating that NPB is likely tuned for Intel.
Redis: link
Many of the online applications rely on key-value caches and data structure servers to operate. Redis is an open-source, scalable web technology with a strong developer base, but also relies heavily on memory bandwidth as well as CPU performance.
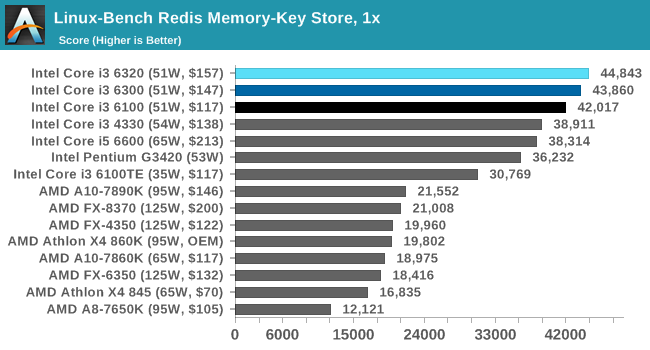
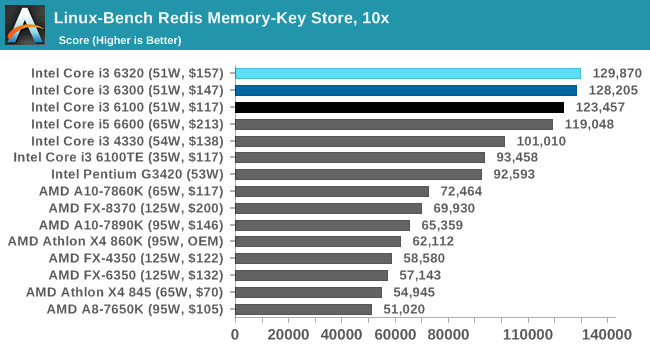
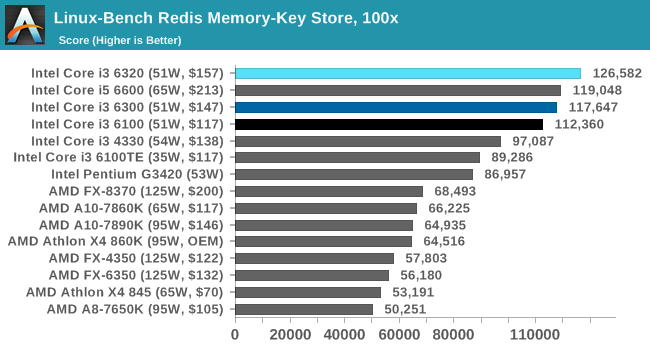
Redis is similar - high IPC and lots of fast cache are needed, and again it seems to be Intel tuned. The i5 sits below the set of Core i3s until the 100x loading comes along, where having physical cores and more cache seems to help. Despite saying more cache seems to help, the effect of the lower L3 cache on the i3-6100 seems to matter more in the 1x and 10x tests, but less in the 100x test, which is somewhat odd.
Legacy Benchmarks
Some of our legacy benchmarks have followed AnandTech for over a decade, showing how performance changes when the code bases stay the same in that period. Some of this software is still in common use today.
All of our benchmark results can also be found in our benchmark engine, Bench.
3D Particle Movement v1
3DPM is a self-penned benchmark, taking basic 3D movement algorithms used in Brownian Motion simulations and testing them for speed. High floating point performance, MHz and IPC wins in the single thread version, whereas the multithread version has to handle the threads and loves more cores. This is the original version, written in the style of a typical non-computer science student coding up an algorithm for their theoretical problem, and comes without any non-obvious optimizations not already performed by the compiler, such as false sharing.
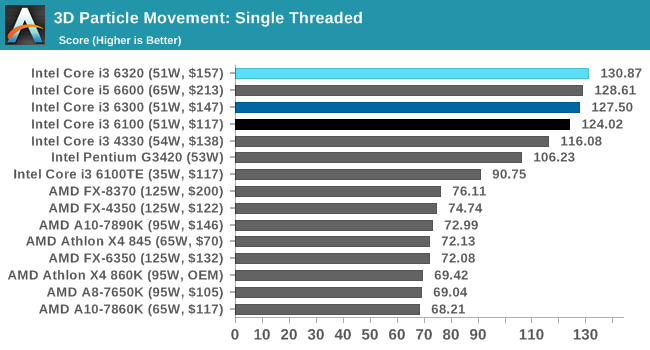
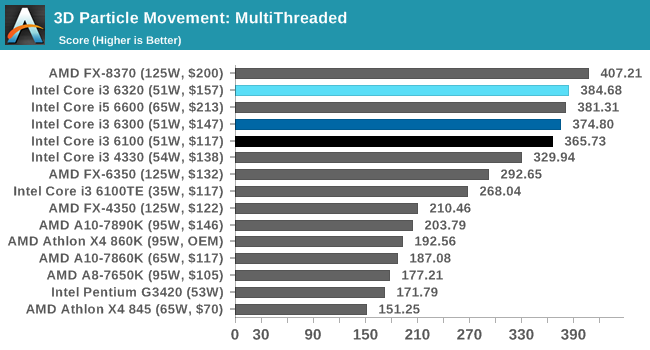
With un-trained programming skills comes a myriad of results. 3DPMv1 is not cache bound, but highly affected by false sharing and IPC. Our Core i3 staircase is in effect, and AMD is badly affected requiring 8 threads to match/beat an i3. In our v2 results, the spread is a more believable, which goes to show that having the right programming paradigm (even just a couple of lines of code) can make a large difference.
CineBench 11.5 and 10
Cinebench is a widely known benchmarking tool for measuring performance relative to MAXON's animation software Cinema 4D. Cinebench has been optimized over a decade and focuses on purely CPU horsepower, meaning if there is a discrepancy in pure throughput characteristics, Cinebench is likely to show that discrepancy. Arguably other software doesn't make use of all the tools available, so the real world relevance might purely be academic, but given our large database of data for Cinebench it seems difficult to ignore a small five minute test. We run the modern version 15 in this test, as well as the older 11.5 and 10 due to our back data.
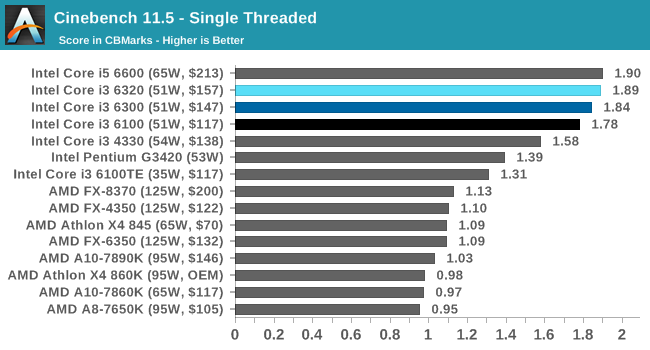
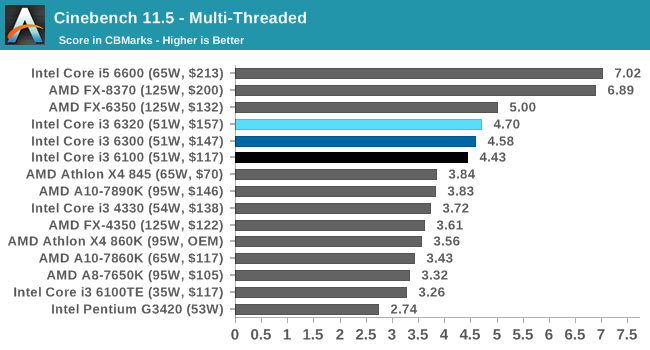
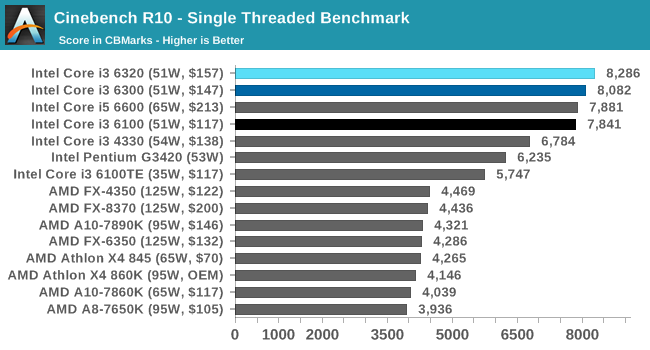
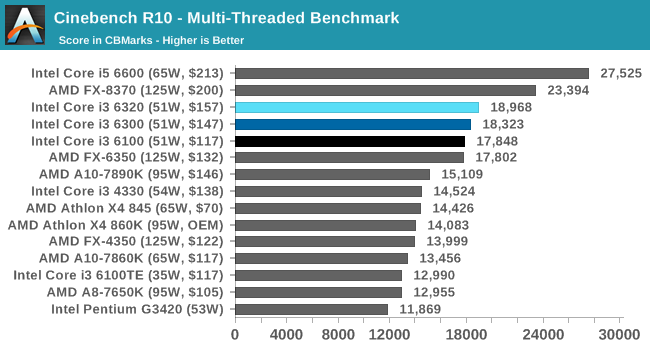
The older CB results mirror the CB15 test, albeit more compressed.
POV-Ray 3.7
POV-Ray is a common ray-tracing tool used to generate realistic looking scenes. We've used POV-Ray in its various guises over the years as a good benchmark for performance, as well as a tool on the march to ray-tracing limited immersive environments. We use the built-in multithreaded benchmark.
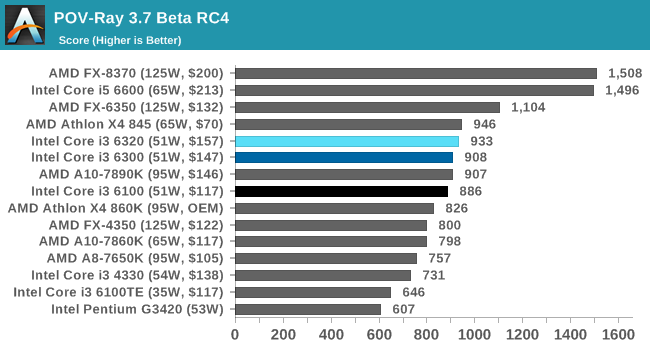
AMD gets a better showing in POV-Ray, with the $70 X4 845 going ahead of all of our Core i3 parts, and the older A10 sitting in between them. The older FX parts, despite their age, take advantage of the multi-threaded nature of the benchmark.
TrueCrypt 7.1
Before its discontinuation, TrueCrypt was a popular tool for WindowsXP to offer software encryption to a file system. The almost latest version, 7.1, is still widely used however the developers have stopped supporting it since the introduction of encrypted disk support in Windows 8/7/Vista from 5/2014, and as such any new security issues are unfixed.
x264 HD 3.0
Similarly, the x264 HD 3.0 package we use here is also kept for historic regressional data. The latest version is 5.0.1, and encodes a 1080p video clip into a high quality x264 file. Version 3.0 only performs the same test on a 720p file, and in most circumstances the software performance hits its limit on high end processors, but still works well for mainstream and low-end. Also, this version only takes a few minutes, whereas the latest can take over 90 minutes to run.
7-zip
7-Zip is a freeware compression/decompression tool that is widely deployed across the world. We run the included benchmark tool using a 50MB library and take the average of a set of fixed-time results.
Alien: Isolation
If first person survival mixed with horror is your sort of thing, then Alien: Isolation, based off of the Alien franchise, should be an interesting title. Developed by The Creative Assembly and released in October 2014, Alien: Isolation has won numerous awards from Game Of The Year to several top 10s/25s and Best Horror titles, ratcheting up over a million sales by February 2015. Alien: Isolation uses a custom built engine which includes dynamic sound effects and should be fully multi-core enabled. We take the average frame rate as our marker with a scripted version of the built-in benchmark.
For this test we used the following settings with our graphics cards:
| Alien Isolation Settings | |||
| Resolution | Quality | ||
| Low GPU | Integrated Graphics | 1280x720 | Ultra |
| ASUS R7 240 1GB DDR3 | |||
| Medium GPU | MSI GTX 770 Lightning 2GB | 1920x1080 | Ultra |
| MSI R9 285 Gaming 2G | |||
| High GPU | ASUS GTX 980 Strix 4GB | 1920x1080 | Ultra |
| MSI R9 290X Gaming 4G | |||
Alien Isolation seems to have recently had an update that affects low powered GPUs, pushing our new results to be very different to the results in our database. It only seems to affect the IGP and R7 240 results, so for now we'll focus on the other data.
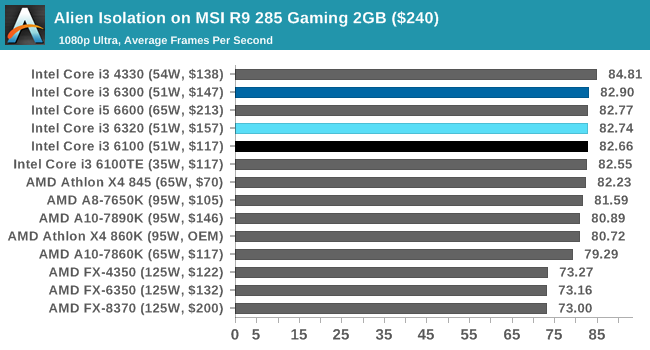

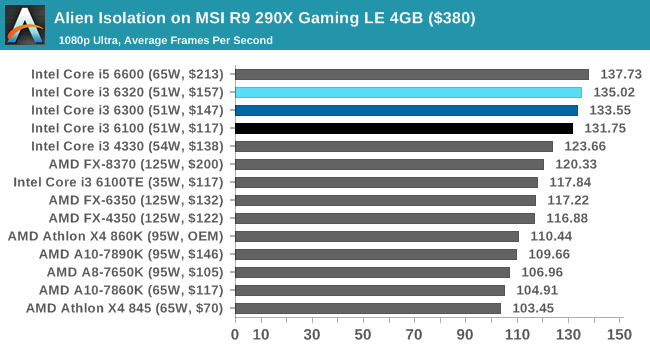
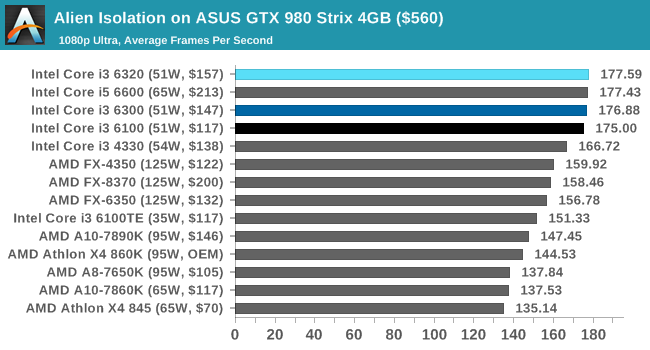
In each case the Core i3s perform at the top or near the top, with the higher frame rates being with the higher frequency parts. However, for our mid-range GPUs (R9 285, GTX 770), that doesn't seem to matter that much, and the $70 AMD Athlon X4 845, along with the A10 parts, are within shouting distance. However, the effect gets worse with higher power GPUs, with the graphs taking an Intel/AMD split almost. The 8-thread AMD FX part sits as close as it can, but the Skylake parts pull a 10+ FPS advantage, which equates to an 8% or better difference.
Total War: Attila
The Total War franchise moves on to Attila, another The Creative Assembly development, and is a stand-alone strategy title set in 395AD where the main story line lets the gamer take control of the leader of the Huns in order to conquer parts of the world. Graphically the game can render hundreds/thousands of units on screen at once, all with their individual actions and can put some of the big cards to task. In our benchmark, the in-game scripted benchmark is used with the option for ‘unlimited video memory’ enabled.
For this test we used the following settings with our graphics cards:
| Total War: Attila Settings | |||
| Resolution | Quality | ||
| Low GPU | Integrated Graphics | 1280x720 | Performance |
| ASUS R7 240 1GB DDR3 | |||
| Medium GPU | MSI GTX 770 Lightning 2GB | 1920x1080 | Quality |
| MSI R9 285 Gaming 2G | |||
| High GPU | ASUS GTX 980 Strix 4GB | 1920x1080 | Quality |
| MSI R9 290X Gaming 4G | |||

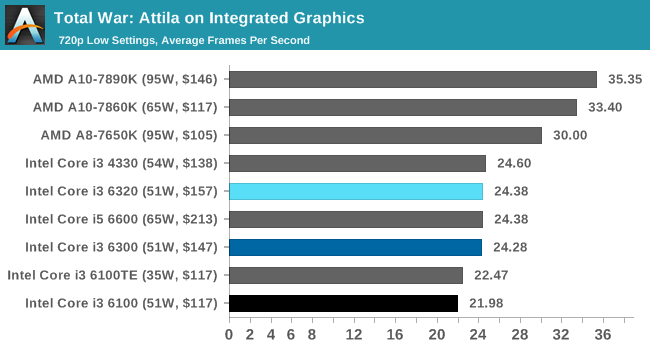
For the integrated graphics, despite the difference between the APUs and Core parts, we can see the effect of 10% GPU frequency and a smaller L3 cache has on the i3-6100 (which has 3MB). The i3-6100TE is an oddball of the group, by actually having 4MB of L3 cache, which nudges it ahead of the regular i3-6100 by a small amout. Either way, the Intel GPUs aren't great for Attila gaming at 720p Low.
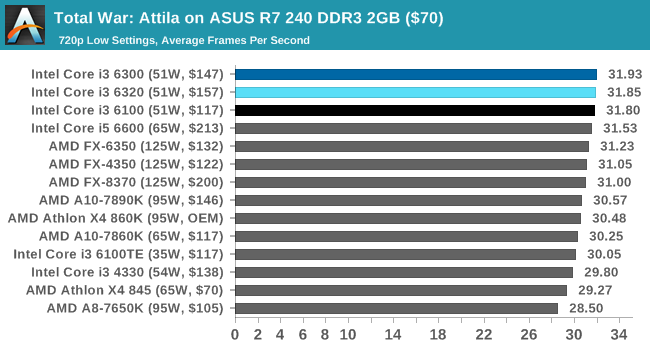
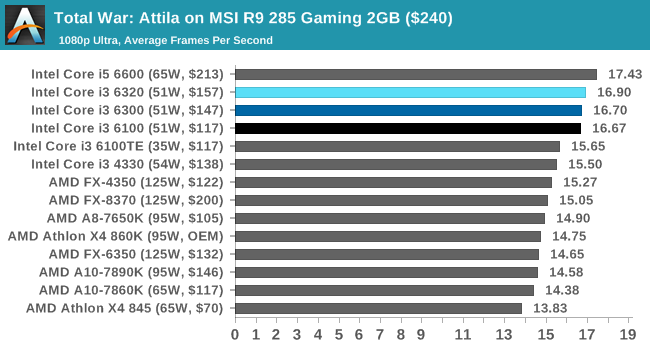

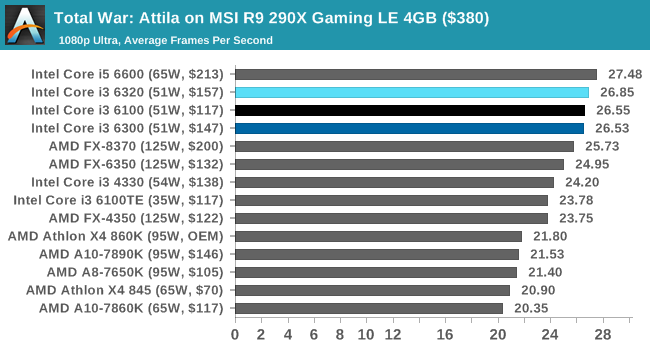
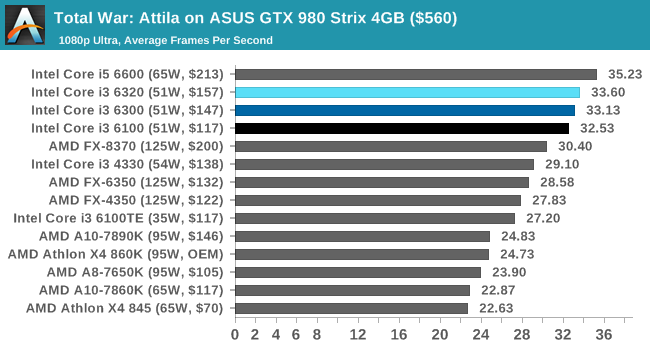
With the discrete graphics cards, the Core i3s again sit at the top or near the top in a regular staircase. Attila still seems to be a bit of a hog for frame rates at 1080p Ultra, barely scraping 30 FPS average on the GTX 980 with the Core i3 parts.
Grand Theft Auto V
The highly anticipated iteration of the Grand Theft Auto franchise finally hit the shelves on April 14th 2015, with both AMD and NVIDIA in tow to help optimize the title. GTA doesn’t provide graphical presets, but opens up the options to users and extends the boundaries by pushing even the hardest systems to the limit using Rockstar’s Advanced Game Engine. Whether the user is flying high in the mountains with long draw distances or dealing with assorted trash in the city, when cranked up to maximum it creates stunning visuals but hard work for both the CPU and the GPU.
For our test we have scripted a version of the in-game benchmark, relying only on the final part which combines a flight scene along with an in-city drive-by followed by a tanker explosion. We record both the average frame rate and the percentage of frames under 60 FPS (16.6ms).
For this test we used the following settings with our graphics cards:
| Grand Theft Auto Settings | |||
| Resolution | Quality | ||
| Low GPU | Integrated Graphics | 1280x720 | Lowest |
| ASUS R7 240 1GB DDR3 | |||
| Medium GPU | MSI GTX 770 Lightning 2GB | 1920x1080 | Very High |
| MSI R9 285 Gaming 2G | |||
| High GPU | ASUS GTX 980 Strix 4GB | 1920x1080 | Very High |
| MSI R9 290X Gaming 4G | |||
Integrated Graphics
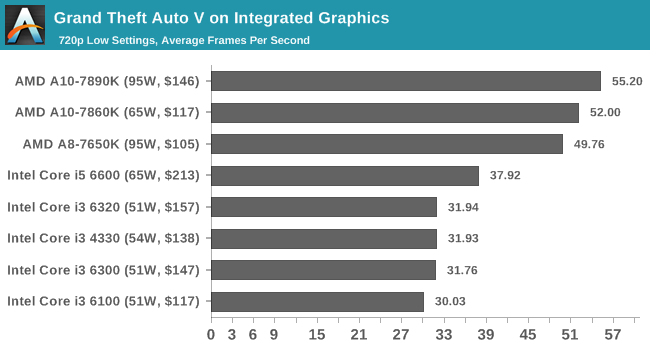
![Grand Theft Auto V on Integrated Graphics [Under 60 FPS]](https://images.anandtech.com/graphs/graph10543/83071.png)
The APUs take a large, almost double FPS lead for average frame rates, and again the Core i3 staircase shows that the L3 cache makes a difference. On the Low FPS graph, we see that none of the Intel CPUs make it above 60 FPS at any point, whereas the APUs can expect to see 15-30% of their time at or above 60 FPS.
Discrete Graphics
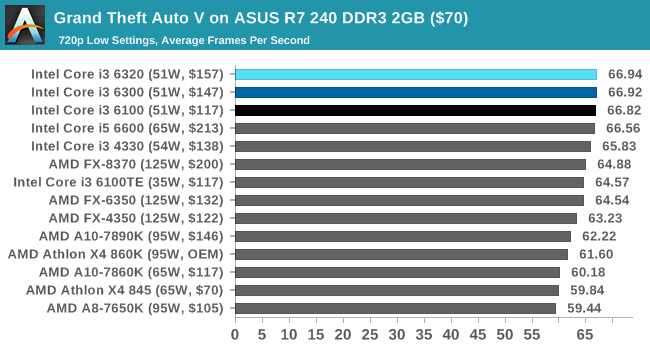
![Grand Theft Auto V on ASUS R7 240 DDR3 2GB ($70) [Under 60 FPS]](https://images.anandtech.com/graphs/graph10543/83079.png)
![Grand Theft Auto V on MSI R9 285 Gaming 2GB ($240) [Under 60 FPS]](https://images.anandtech.com/graphs/graph10543/83087.png)
![Grand Theft Auto V on MSI GTX 770 Lightning 2GB ($245) [Under 60 FPS]](https://images.anandtech.com/graphs/graph10543/83095.png)
![Grand Theft Auto V on MSI R9 290X Gaming LE 4GB ($380) [Under 60 FPS]](https://images.anandtech.com/graphs/graph10543/83103.png)
![Grand Theft Auto V on ASUS GTX 980 Strix 4GB ($560) [Under 60 FPS]](https://images.anandtech.com/graphs/graph10543/83113.png)
It's an onslaught of data, but clicking through to each graph will expand it in finer detail.
Again, with a discrete GPU, the Core i3s sit very pretty at the top of our graphs. In most cases, against similarly priced AMD CPUs, they can be from 5% to 20% quicker in average frame rates - the higher power the GPU, the more that it matters.
An interesting graph is the final one, with the GTX 980 and lookng at the percentage of frames over 16.6ms (i.e., the percentage time the game spends under 60 FPS). With the Core i3 parts, the game spends at least 50% of its time above 60 FPS running at 1080p Very High settings, however with similarly priced AMD APUs, this drops down to 15-25%. While running at V-Sync, this will be noticable. The FX CPUs get a better showing with the GTX 980, with the FX-6350 and the FX-8350 straddling the Core i3s for average frame rates and the 60 FPS metric.
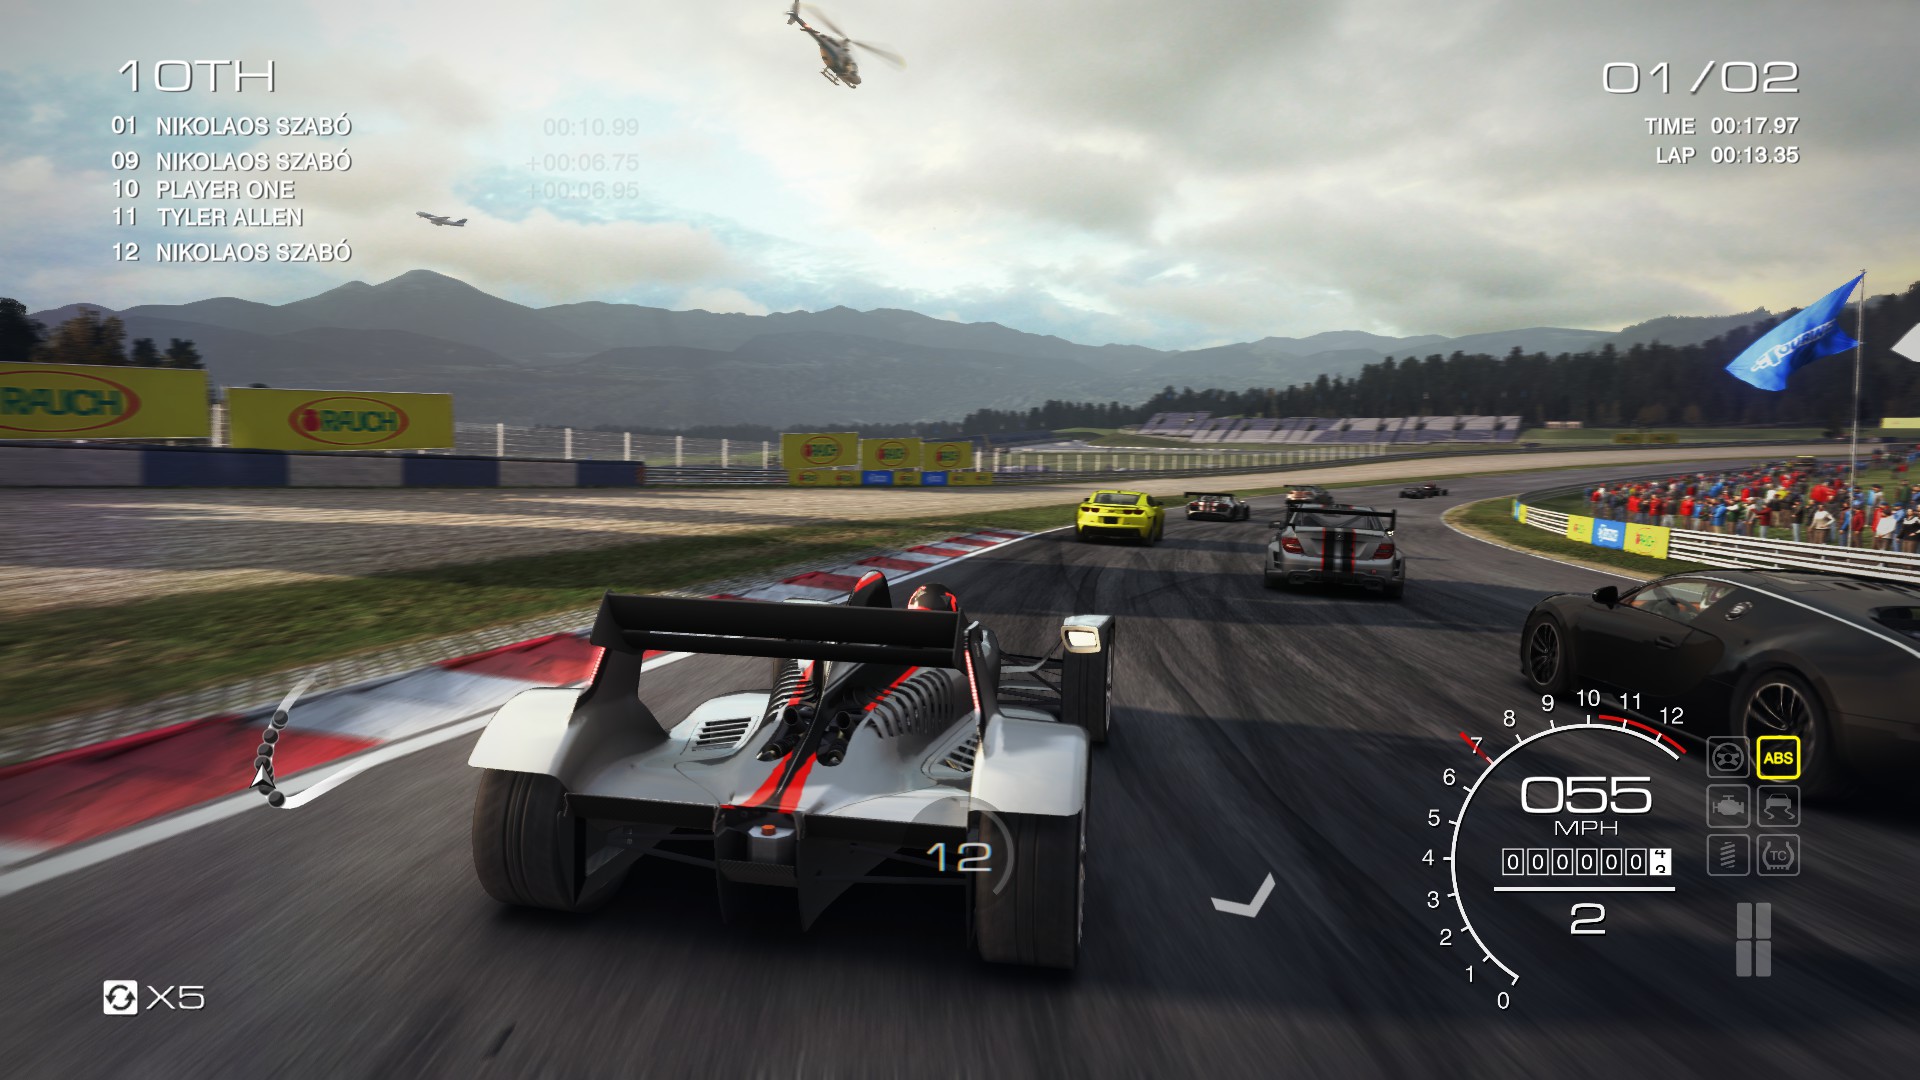
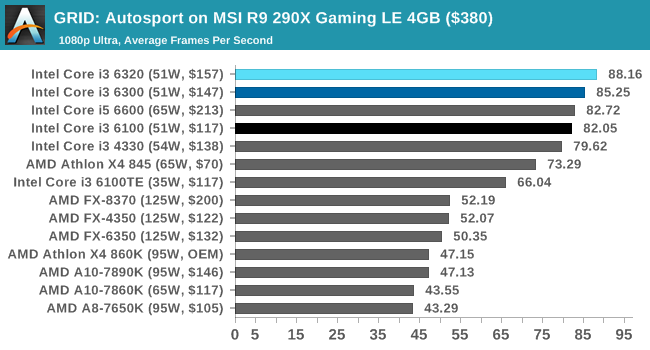
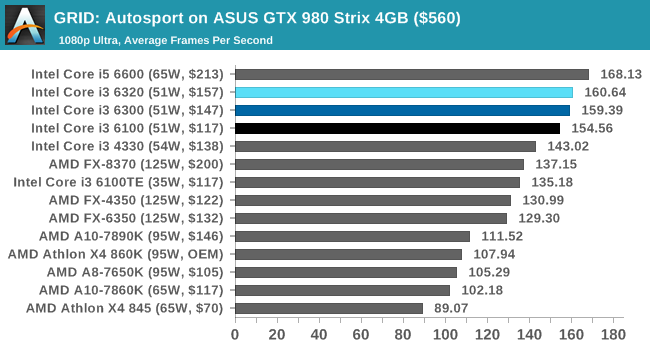
GRID: Autosport
No graphics tests are complete without some input from Codemasters and the EGO engine, which means for this round of testing we point towards GRID: Autosport, the next iteration in the GRID and racing genre. As with our previous racing testing, each update to the engine aims to add in effects, reflections, detail and realism, with Codemasters making ‘authenticity’ a main focal point for this version.
GRID’s benchmark mode is very flexible, and as a result we created a test race using a shortened version of the Red Bull Ring with twelve cars doing two laps. The car is focus starts last and is quite fast, but usually finishes second or third. Both the average and minimum frame rates are recorded.
For this test we used the following settings with our graphics cards:
| GRID: Autosport Settings | |||
| Resolution | Quality | ||
| Low GPU | Integrated Graphics | 1920x1080 | Medium |
| ASUS R7 240 1GB DDR3 | |||
| Medium GPU | MSI GTX 770 Lightning 2GB | 1920x1080 | Maximum |
| MSI R9 285 Gaming 2G | |||
| High GPU | ASUS GTX 980 Strix 4GB | 1920x1080 | Maximum |
| MSI R9 290X Gaming 4G | |||
Integrated Graphics
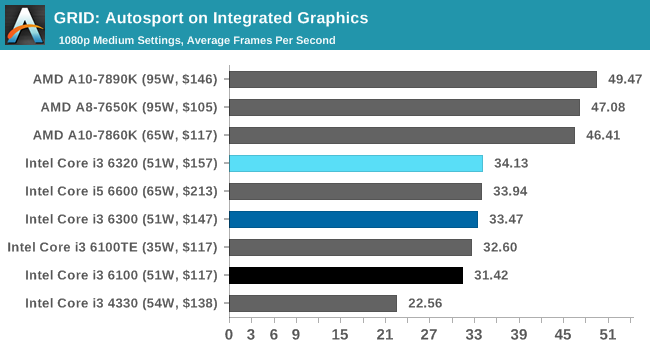
![GRID: Autosport on Integrated Graphics [Minimum FPS]](https://images.anandtech.com/graphs/graph10543/83073.png)
The difference between the APUs and Intel CPUs again shows up to a 33-50% difference in frame rates, to the point where at 1080p medium the integrated graphics do not break the minimum 30 FPS barrier. The GPU frequency and L3 cache again shows up the i3-6100 compared to the i3-6300.
Discrete Graphics
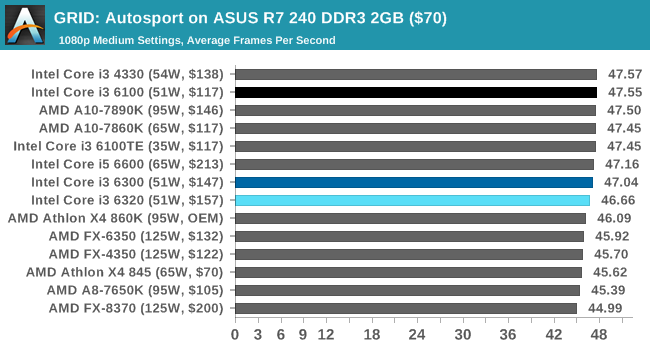
![GRID: Autosport on ASUS R7 240 DDR3 2GB ($70) [Minimum FPS]](https://images.anandtech.com/graphs/graph10543/83081.png)
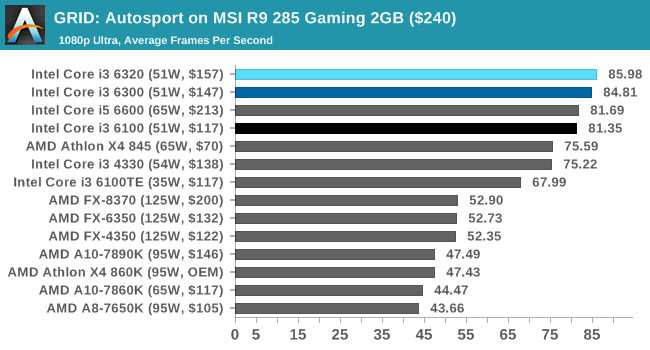
![GRID: Autosport on MSI R9 285 Gaming 2GB ($240) [Minimum FPS]](https://images.anandtech.com/graphs/graph10543/83089.png)

![GRID: Autosport on MSI GTX 770 Lightning 2GB ($245) [Minimum FPS]](https://images.anandtech.com/graphs/graph10543/83097.png)
![GRID: Autosport on MSI R9 290X Gaming LE 4GB ($380) [Minimum FPS]](https://images.anandtech.com/graphs/graph10543/83105.png)
![GRID: Autosport on ASUS GTX 980 Strix 4GB ($560) [Minimum FPS]](https://images.anandtech.com/graphs/graph10543/83115.png)
With the discrete GPUs, there are multiple avenues to take with this analysis.
On the low-end cards, the choice of CPU makes little difference in our tests.
On the mid-range and high-end cards, the power of the CPU makes more of an effect with AMD discrete cards than NVIDIA discrete cards, except with the AMD Athlon X4 845 in play. When using an AMD discrete card with a mid-range GPU, the X4 845 plays well enough with the i3 parts for its price, but falls away a bit more on the high-end AMD discrete GPU. With NVIDIA GPUs, the Athlon X4 845 sits at the bottom and the main challengers are the FX parts.
So for EGO engine rules, it would seem to be:
AMD Carrizo CPU + AMD discrete GPU is OK, the lower powered the GPU the better.
AMD FX CPU + NVIDIA discrete GPU is OK
Intel CPU + any discrete GPU works well.
One could attest the differences between the discrete GPU choices to driver implementation, IPC, or how each GPU company focuses in optimizing for each game at hand (frequency vs threads vs caches).
Middle-Earth: Shadow of Mordor
The final title in our testing is another battle of system performance with the open world action-adventure title, Shadow of Mordor. Produced by Monolith using the LithTech Jupiter EX engine and numerous detail add-ons, SoM goes for detail and complexity to a large extent, despite having to be cut down from the original plans. The main story itself was written by the same writer as Red Dead Redemption, and it received Zero Punctuation’s Game of The Year in 2014.
For testing purposes, SoM gives a dynamic screen resolution setting, allowing us to render at high resolutions that are then scaled down to the monitor. As a result, we get several tests using the in-game benchmark, taking results as the average and minimum frame rates. Minimum frame rate results can be found in Bench.
For this test we used the following settings with our graphics cards:
| Shadow of Mordor Settings | |||
| Resolution | Quality | ||
| Low GPU | Integrated Graphics | 1280x720 | Low |
| ASUS R7 240 1GB DDR3 | |||
| Medium GPU | MSI GTX 770 Lightning 2GB | 1920x1080 | Ultra |
| MSI R9 285 Gaming 2G | |||
| High GPU | ASUS GTX 980 Strix 4GB | 1920x1080 3840x2160 |
Ultra Ultra |
| MSI R9 290X Gaming 4G | |||

Integrated Graphics
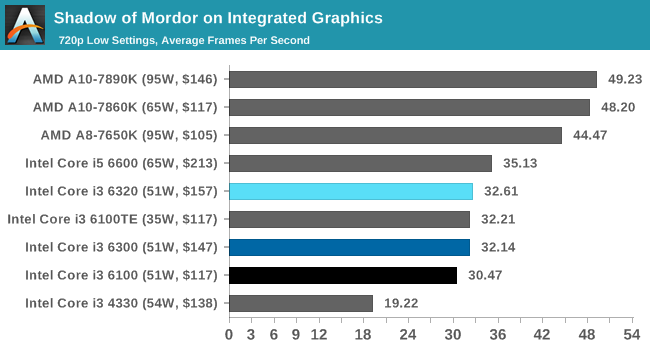
As with the other IGP tests, the APU solution gets significantly better results.
Discrete Graphics
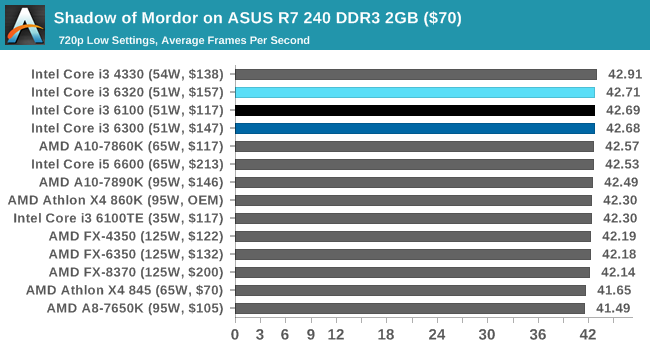
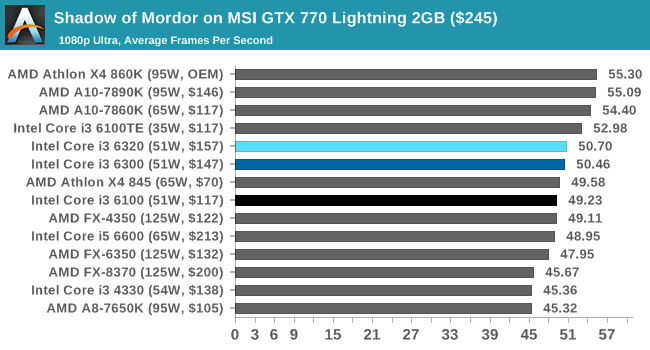
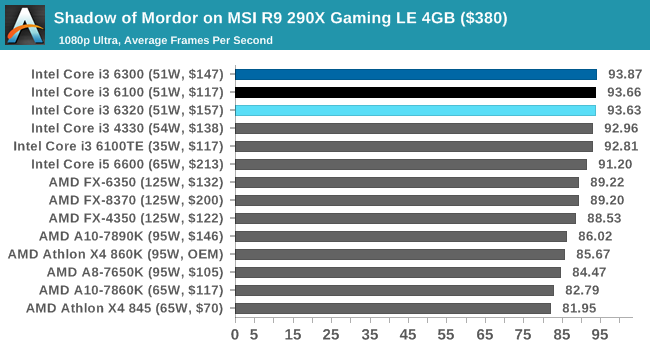
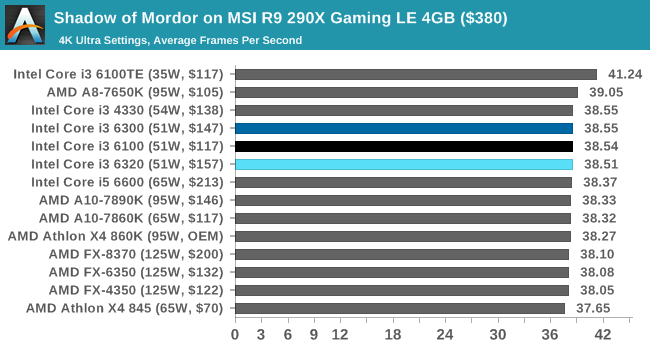
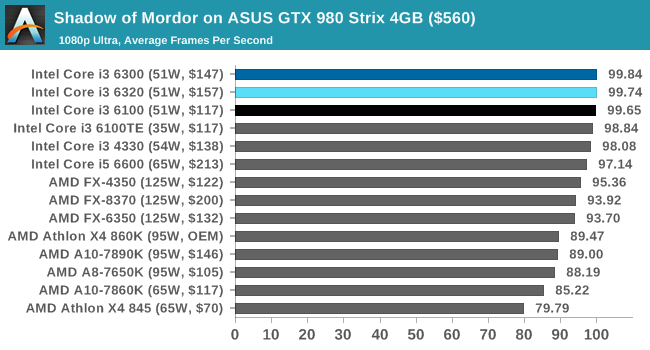
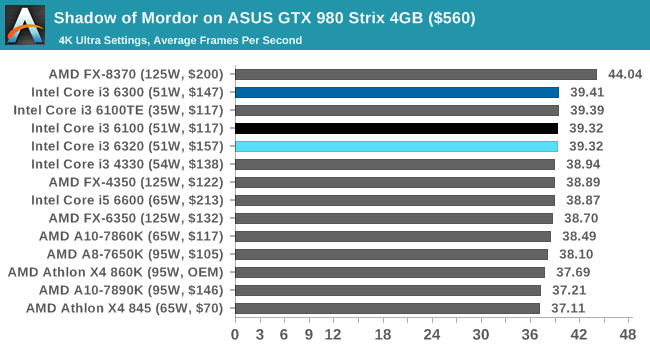
SoM is our most CPU agnostic benchmark of the set, such that as you increase the GPU power and the resolution, the CPU matters less to the performance. This is why at 4K Ultra, with both the AMD and NVIDIA discrete GPUs, the $70 CPU from AMD is within 2-3% for average frame rates.
However, it should be noted that the CPU power matters more when (a) an AMD discrete GPU is being used, or (b) lower resolutions. In both cases, the AMD FX CPUs are more likely to match up with Intel's Core i3, which sit at the top of the pack.
Conclusion
In this review we were able to source the three 6th Generation Intel Core i3 processors with a thermal design power of 51W. These three are the main focus of the 6th Gen Core i3 range, which also features lower power T/TE parts and a reduced graphics P SKU. The Core i3 line are characterized by their design: two cores with Hyperthreading, no Turbo boost, no overclocking, support of ECC and SGX/MPX, but no support for TSX. Prices for the Core i3 processors range from $117 to $149-$157, making them an interesting choice for ~$800 gaming PC builds.
| Intel's Skylake i3 LGA1151 CPUs | ||||||||
| C/T | L3 | Base | Turbo | HD | HD Turbo | TDP | MSRP | |
| Core i3-6320 | 2/4 | 4 MB | 3.9 | - | 530 | 1150 | 51W | $149 OEM $157 box |
| Core i3-6300 | 2/4 | 4 MB | 3.8 | - | 530 | 1150 | 51W | $138 OEM $147 box |
| Core i3-6100 | 2/4 | 3 MB | 3.7 | - | 530 | 1050 | 51W | $117 |
| Core i3-6300T | 2/4 | 4 MB | 3.3 | - | 530 | 950 | 35W | $138 |
| Core i3-6100T | 2/4 | 3 MB | 3.2 | - | 530 | 950 | 35W | $117 |
| Core i3-6100TE | 2/4 | 4 MB | 2.7 | - | 530 | 1000 | 35W | $117 |
| Core i3-6098P | 2/4 | 3 MB | 3.6 | - | 510 | 1050 | 54W | $117 |
This review tested the Core i3-6320, the i3-6300 and the i3-6100. All three differ in their base frequency in a regular fashion, going from 3.9 GHz to 3.8 GHz and 3.7 GHz respectively. The Core i3-6100 also has another two adjustments: the integrated graphics also comes down by 100 MHz, and it only has 3 MB of L3 cache rather than 4 MB like the other two. This cache deficit affects several benchmarks in our test, although it is workload dependent and most of the time acts similar to another 100 Mhz CPU frequency decline. But, at $19 less than the step up to the Core i3-6300, it sits higher on the price/performance ratio.
Core i3-6100 and Core i3-6320
The main competition for these processors comes from three directions.
First, Intel is its own competition - while we typically talk about people upgrading from the previous generation to the new generation, the Core i3 isn't necessarily a part that has a similar refresh cycle, but Intel still has to convince users on the 2-5 year upgrade cycle that moving from i3 to i3 is a worthy pursuit.
The next two directions come from AMD, in the form of the FX CPUs and A10 APUs. The FX-6300 and FX-8300 families of CPUs are several years old in terms of microarchitecture, but offer six and eight threads respectively at nearly similar price points (the FX-6350 is more in line with the Core i3s than the FX-8350). On the APU side, the A10-7860K and A10-7890K are both in the right price range and come with AMD's upgraded CPU cooler, which we recently reviewed and gave an award as the best bundled stock CPU cooler on the market. The APUs, while fairly newer than the FX parts, are known for their strong integrated graphics performance that easily surpasses Intel's gaming performance at this price point. It is worth noting that the older Intel CPUs and the AMD competition both use the higher powered DDR3 memory interface, while the Skylake-based Core i3 CPUs in this review are on the newer DDR4.
From our results, we can track whether the Core i3 parts have the best price/performance:
In our web tests using Chrome, Intel CPUs seem to have a significant advantage here which might be a deal breaker for users who spend a lot of time online.
On our updated 3DPMv2 scientific benchmark, good cache management, a high IPC, and a high thread count is key to the results here. The Core i3 parts sit above the much older FX-6350 despite having two fewer threads, but AMD's latest microarchitecture in the Athlon X4 845 is close and gets a better price/performance rating.
WinRAR is a variable threaded workload that requires large caches, high IPC and preferably a high frequency as well. The higher thread CPUs sit at the top here, followed closely by the set of Core i3 parts.
For integrated graphics, the Core i3 parts have no answer to what AMD offers at this price point. This is an important aspect, as Intel struggles to offer a part that can cope with year-old premium games at 30 FPS average at super low resolution and settings, let alone 30 FPS minimum (eSports may be a different story). The AMD parts are sole solution for premium gaming on integrated graphics at this price.
For discrete gaming, the results are particularly game and GPU dependent. In some cases, such as GRID with a mid-range AMD GPU, the Intel CPUs take the top spots with the latest Carrizo CPU from AMD coming up close behind. However, in other cases such as GTA on a high-end NVIDIA GPU, having more cache and physical cores in a modern game can push ahead of the Core i3, albeit at a higher price, and the Carrizo CPU comes in at the bottom due to its 2 MB of last-level cache.
Final Words
The Skylake Core i3 parts represent the best 'all-round' CPUs at their price. Choosing one for a system guarantees a good return in performance, and while it might not always be the best for specific applications, it's certainly near the top for almost everything. There were no circumstances where the Core i3-6100 is playing significant catchup to the other two, or that the lower cache was more of a hindrance. For ~$800 gaming builds that $30 difference between the i3-6100 and the i3-6320 could be spent elsewhere in the system. In our gaming tests the i3-6100 was only 2-4 FPS down (~5%).
Out of the three we've tested today, I would have to go for the Core i3-6100 as the processor of choice. For price and performance, the lower frequency and less cache only amounts to a 2-4% deficit at best compared to the next CPU up. The savings for 2-4% performance comes in at $30, or 20% cheaper, when we compare boxed versions.


