Original Link: https://www.anandtech.com/show/10436/amd-carrizo-tested-generational-deep-dive-athlon-x4-845
AMD Carrizo Part 2: A Generational Deep Dive into the Athlon X4 845 at $70
by Ian Cutress on July 14, 2016 9:00 AM EST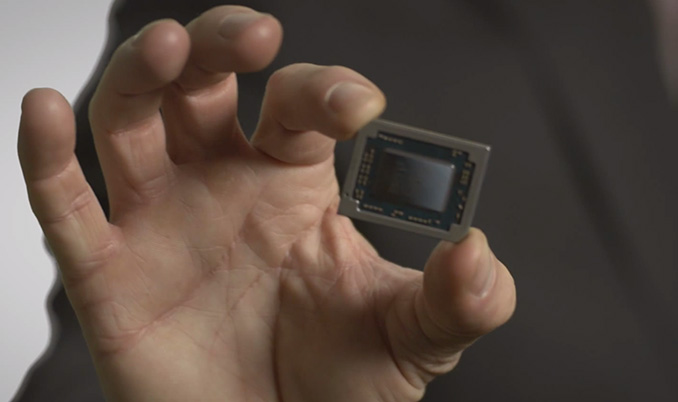
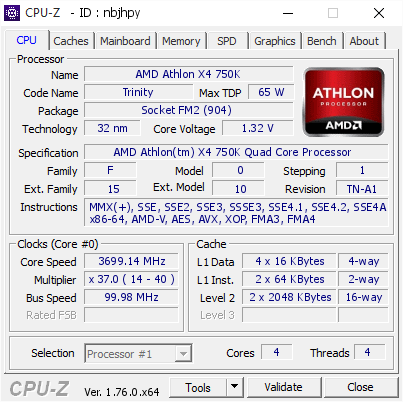
The latest microarchitecture from AMD based on the x86 instruction set was given the codename Excavator, using the fourth generation of AMD's Bulldozer cores, called Carrizo cores. Carrizo and Excavator were primarily aimed at laptops and is an important part of the efficiency goals AMD has set itself. We tested some 15W laptops earlier in the year, but when AMD announced a 65W part was coming to desktop, we actively sourced a part to compare generational performance improvements in a like-for-like setting. This is that review, and we're testing the Athlon X4 845 and its microarchitectural counterparts through the years: the Athlon X4 860K with Kaveri cores and the Steamroller µArch, the Athlon X4 760K with Richland cores and an improved Piledriver µArch, and the Athlon X4 750K with Trinity cores using the original Piledriver µArch.
AMD's Future in Mainstream
Both of the main x86 processor manufacturers, AMD and Intel, broadly arrange their consumer processors into three segments: high-performance, mainstream and entry level. As one might expect, these processor lines differ in terms of performance, price and power (and a few quirks therein). The story from AMD's side over the past several years has been one where the high-performance line has drifted away, but still present in parts originally released in October 2012, and the mainstream line is AMD's current source of revenue and market share for CPUs. Whereas the high-performance processors focus on being pure CPUs, designed for general purpose function, the mainstream integrates both processing and graphics parts into a single silicon die such that a system does not need a discrete graphics card in order to provide an output (and AMD calls this an APU, an Accelerated Processing Unit; Intel has no specific name). Both AMD and Intel have made this their bedrock for the mainstream platform, allowing users to invest in a component and rely on integrated graphics if they only need that level of performance, or moving up to a graphics card when budget allows or performance is required. The current level of performance with some high-end AMD APUs matches a graphics performance similar to that of a $50-80 graphics card, making them target purchases for budget machines. Processors with integrated graphics feature heavily in laptop and notebook designs as well, where saving space, power and cost are often priorities.
Some users who rely on mainstream components but want a discrete graphics platform are sometimes felt hard done by with the integrated graphics design being the main option at the price point. For these users, who are buying a processor and then a $150+ discrete graphics card, paying for an integrated graphics portion of the CPU that goes unused feels unhelpful: the silicon area becomes excess baggage, and they don't want to pay for it. AMD has had features such as Dual Graphics in the past, where the APU and discrete GPU work together which can work well, but relies on good driver and game support to do so. It also focuses on improving low-to-mid range hardware, rather than going for peak performance. DirectX 12 may change this, with the new graphics API allowing developers to use integrated graphics in different ways, but again it relies on game developer support and might still be a few years out from becoming common place. So why pay the extra for integrated graphics when you do not need it? Intel does not offer much of an option here, aside from spending a minimum of $450 on their high-end desktop platform. However AMD has you covered in the Athlon line of CPUs.
The APU line accounts for a bulk of AMD's mainstream desktop processor sales, with a dozen APUs released each generation. Alongside these designs, AMD also releases the CPU-only Athlon line. These are the same silicon designs as the APUs but are cut down versions without the integrated graphics. Technically they still have the internal silicon for the graphics cores, but due to silicon defects or stock management, it is physically disabled and the price is subsequently reduced. This method of binning is not new, and happens with many silicon processor designs - when processors are made, they have a natural defect rate (a manufacturing process with a low defect rate is said to be more 'mature'). If these defects are in areas that can be disabled in the binning process, it allows a company like AMD to still sell the processor cheap rather than completely throw it away. For users intending to have discrete graphics, the Athlon line can thus be a significantly cheaper option when building a mainstream AMD PC. The saving made can then be funneled into other upgrades, such as double memory, a bigger SSD, or even another stage up on a graphics card performance list.
The AMD Athlon X4
So while the APU, with the integrated processor and graphics, is AMD's main focus for mainstream sales, the Athlon line is present as a way to throw away less silicon and offer a component with a given feature set to users who want it. For users who have building PCs for many years, the Athlon name in AMD's history has been a steadfast reminder of when AMD was winning the x86 wars. Before APUs were becoming a reality, most of the mainstream parts from AMD were labelled Athlon, from single core up to four cores in the Athlon X4 family (which we retested recently for a future review), with K10 based parts being called Phenom, high-performance segment parts moving to 'FX', and a number of Sempron parts as well.
When moving to the Bulldozer based microarchitecture in Q4 2012, and the launch of the Trinity core design, AMD has kept a small number of Athlon X2/X4 parts around each generation, often being very price competitive with the APUs. For this review, we've taken one of each generation and tested accordingly.
The following table shows every AMD CPU-only processor from 2012. The information comes from a variety of sources, mostly CPU-World and the AMD CPU Wiki, but surprisingly no central source of information (like Intel's ARK) exists. The information in the table is quite dense (there's only so much you can fit into 666 pixels wide), but the poignant parts to keep track of are the PCIe counts, release dates and the cache sizes.
| AMD CPU-only Processors From 2012 | |||||||||||||
| µArch / Core |
Release | Cores | Base Turbo |
TDP / PCIe |
Socket DDR3 |
L1 (I) Cache |
L1 (D) Cache |
L2 Cache |
|||||
| Athlon X4 845 |
Excavator Carrizo |
2/2016 | 4 | 3500 3800 |
65 W 3.0 x8 |
FM2+ 2133 |
192KB 3-way |
128KB 8-way |
2 MB 16-way |
||||
| Athlon X4 880K |
Steamroller Kaveri v2 |
3/2016 | 4 | 4000 4200 |
95 W 3.0 x16 |
FM2+ 2133 |
192KB 3-way |
64KB 4-way |
4 MB 16-way |
||||
| Athlon X4 870K |
12/2015 | 3900 4100 |
FM2+ 1866 |
||||||||||
| Athlon X4 860K |
Steamroller Kaveri |
8/2014 | 3700 4000 |
||||||||||
| Athlon X4 840 |
8/2014 | 3100 3800 |
65 W 3.0 x16 |
||||||||||
| Athlon X4 830 |
2014? | 3000 3400 |
|||||||||||
| Athlon X2 450 |
8/2014 | 2 | 3500 3900 |
96KB 3-way |
32KB 4-way |
1 MB 16-way |
|||||||
| FX-770K (OEM) |
12/2014 | 4 | 3500 3900 |
FM2+ 2133 |
192KB 3-way |
64KB 4-way |
4 MB 16-way |
||||||
| Athlon X4 760K |
Piledriver.v2 Richland |
7/2013 | 4 | 3800 4100 |
100 W 3.0 x16 |
FM2 1866 |
128KB 2-way |
64KB 4-way |
4 MB 16-way |
||||
| Athlon X4 750 |
10/2012 | 3400 3900 |
65 W 3.0 x16 |
||||||||||
| Athlon X2 370K |
6/2013 | 2 | 4000 4200 |
64KB 2-way |
32KB 4-way |
1 MB 16-way |
|||||||
| Athlon X2 350 |
2013? | 3500 3900 |
|||||||||||
| Sempron X2 250 |
2013? | 3200 3600 |
FM2 ? |
||||||||||
| FX-670 (OEM) |
3/2014 | 4 | 3700 4300 |
FM2 1866 |
128KB 2-way |
64KB 4-way |
4 MB 16-way |
||||||
| Athlon X4 750K |
Piledriver Trinity |
10/2012 | 4 | 3400 4000 |
100 W 3.0 x16 |
FM2 1866 |
128KB 2-way |
64KB 4-way |
4 MB 16-way |
||||
| Athlon X4 740 |
10/2012 | 3200 3700 |
65 W 3.0 x16 |
||||||||||
| Athlon X2 340 |
10/2012 | 2 | 3200 3600 |
FM2 1600 |
64KB 2-way |
32KB 4-way |
1 MB 16-way |
||||||
| Sempron X2 240 |
2012? | 2900 3300 |
FM2 ? |
||||||||||
There are some things to note here, in case anyone is following:
- The Athlon X4 845 is the only part (CPU or APU) that will be released using Carrizo cores for the desktop using DDR3. There are reports of an X4 835 (lower frequency) codename being used, but there is no confirmation this part will exist/be released in any form. However, there will be no APU desktop versions of Carrizo with DDR3, for the reasons below.
- The Athlon X4 845 is actually a laptop APU in desktop clothing, and as such has some limitations in having eight PCIe 3.0 lanes.
- Moving from Richland to Kaveri gives 50% more L1 (I) cache, moving from 64KB/module to 96KB/module and from 2-way to 3-way associativity.
- Moving from Kaveri to Carrizo gives 100% more L1 (D) cache, moving from 32KB/module to 64KB module and from 4-way to 8-way associativity.
- There is a Trinity CPU called the Athlon X4 750K, and a newer Richland CPU called the Athlon X4 750. In researching this review, trying to find the latter was tough, as this was an OEM only part, but it does exist.
- Every dual core/single module design from AMD has 1 MB of L2, whereas every quad core/dual module design has 4 MB of L2. The exception to this is the Carrizo based Athlon X4 845.
A Brief Update on Carrizo
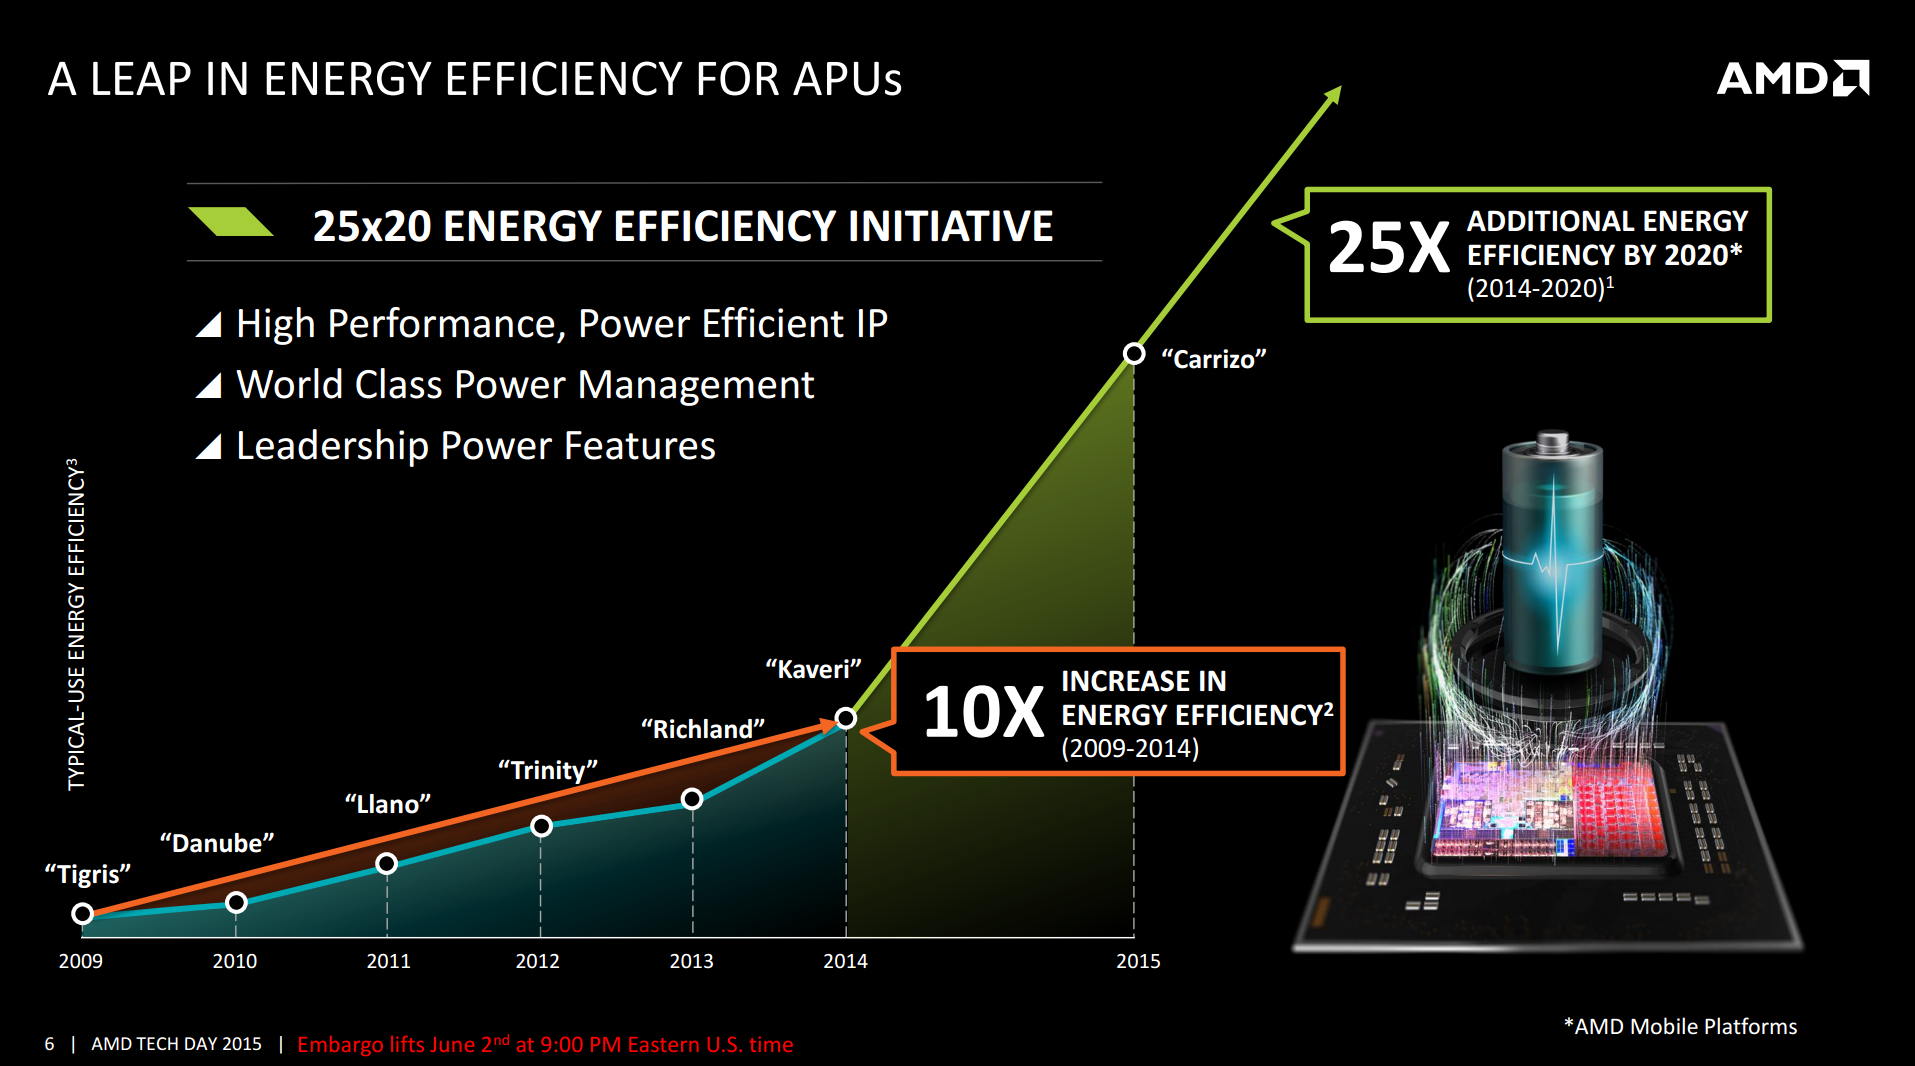
Back at AMD's Tech Day in 2015, AMD gave us a look into their new core design, Carrizo, using the updated Excavator microarchitecture. That link is worth a read to understand Carrizo as it stood at that time, with a brief recap here. As part of the discussions, we were shown a plethora of ways in which AMD had upgraded their core design. One of the major drivers for this was the march towards their goal of achieving 25x better energy efficiency by 2020 (counting from 2014/Kaveri).
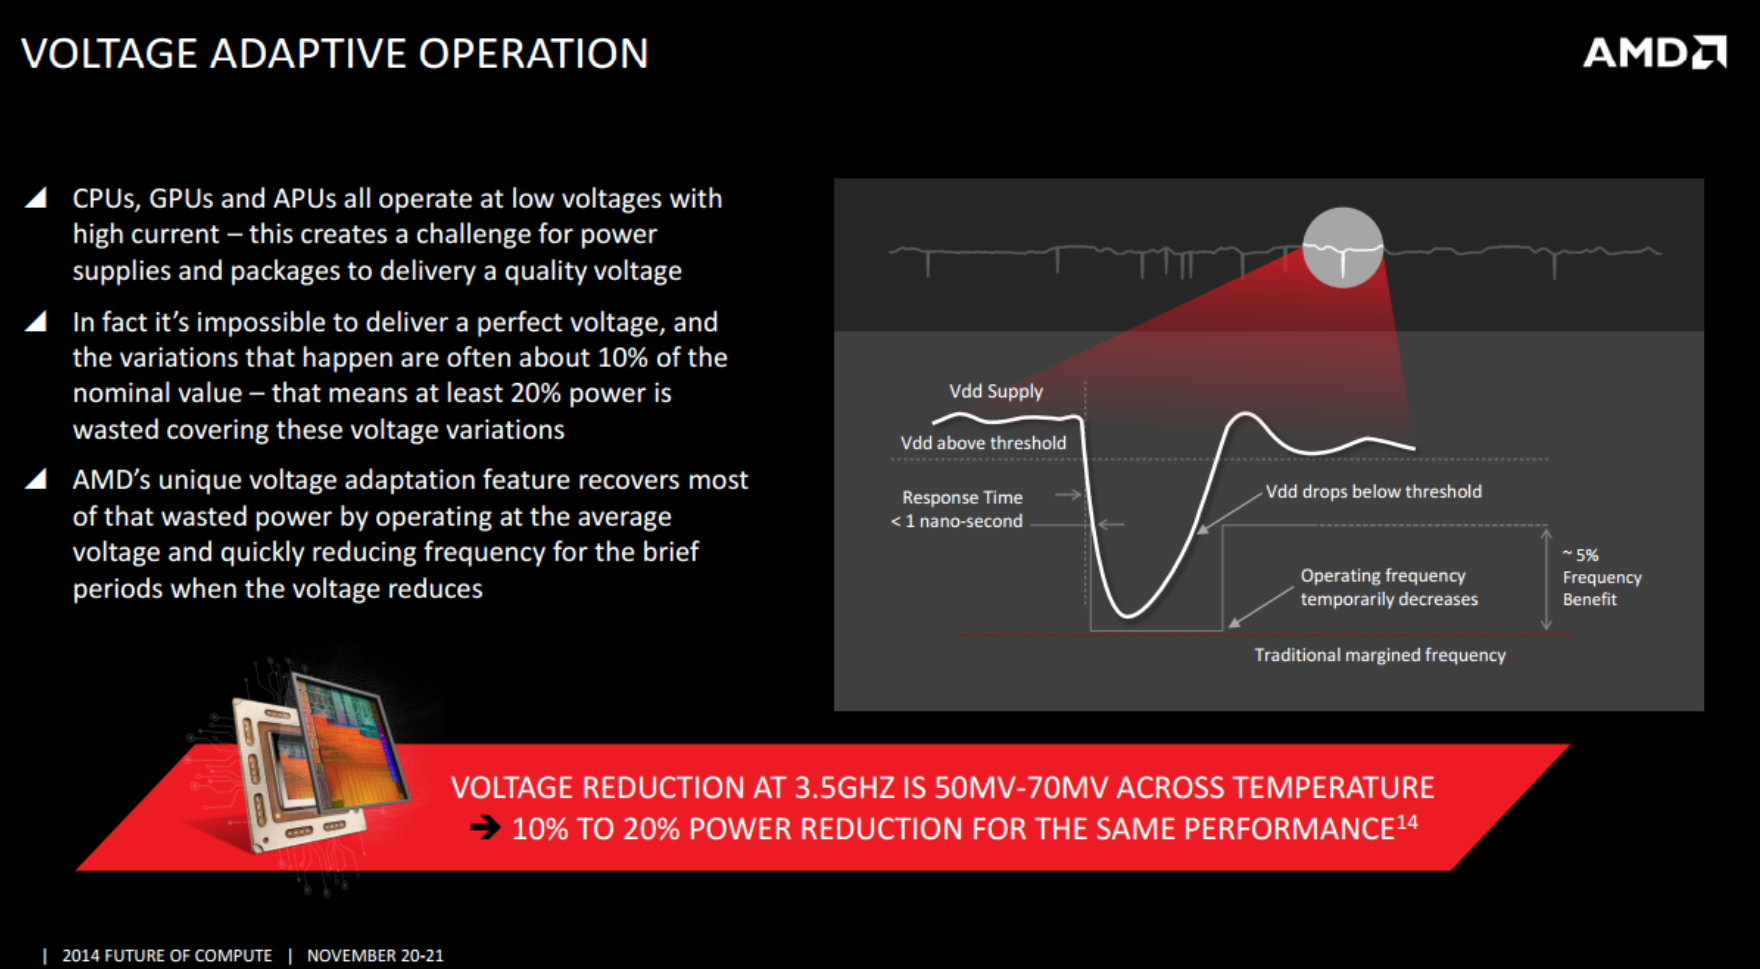
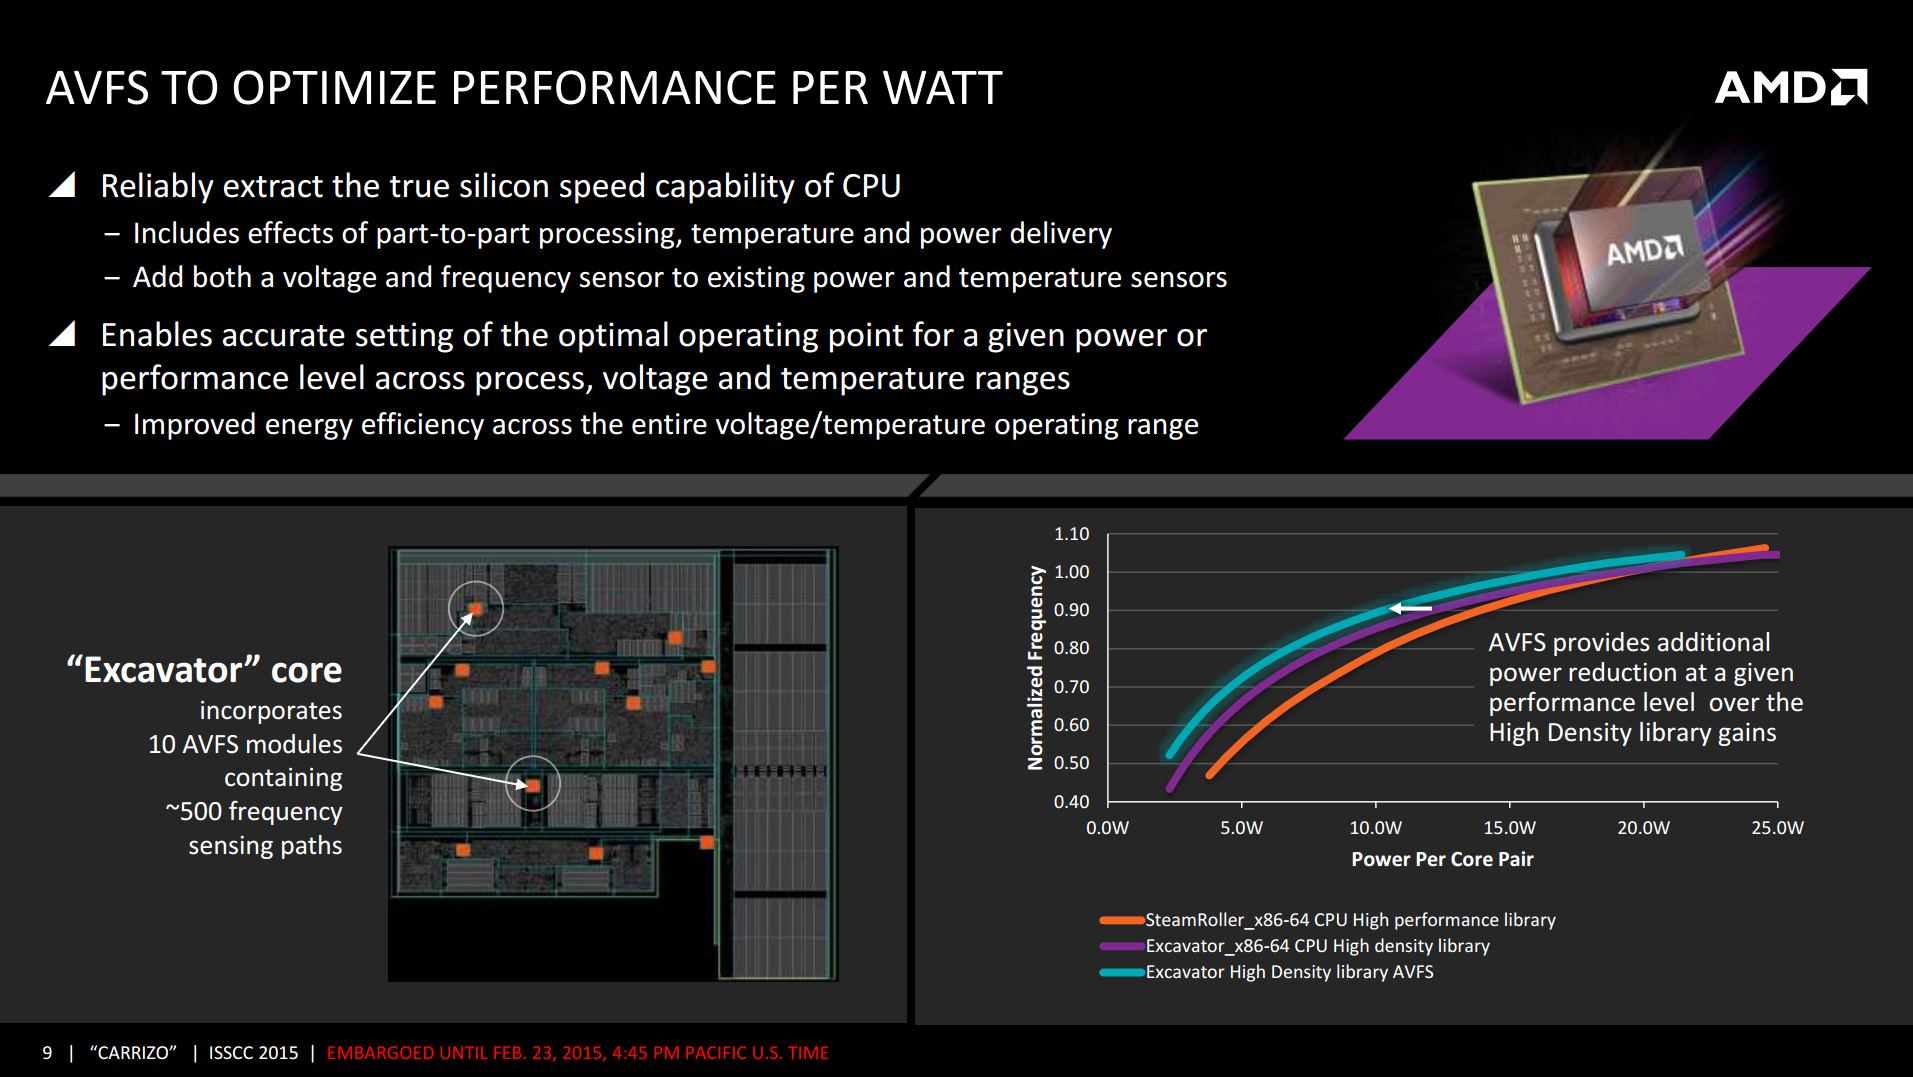
Among the changes was better core scheduling for threads, and a better frequency/voltage scaling mechanism to deal with power spikes and droops to keep overall power consumption lower.
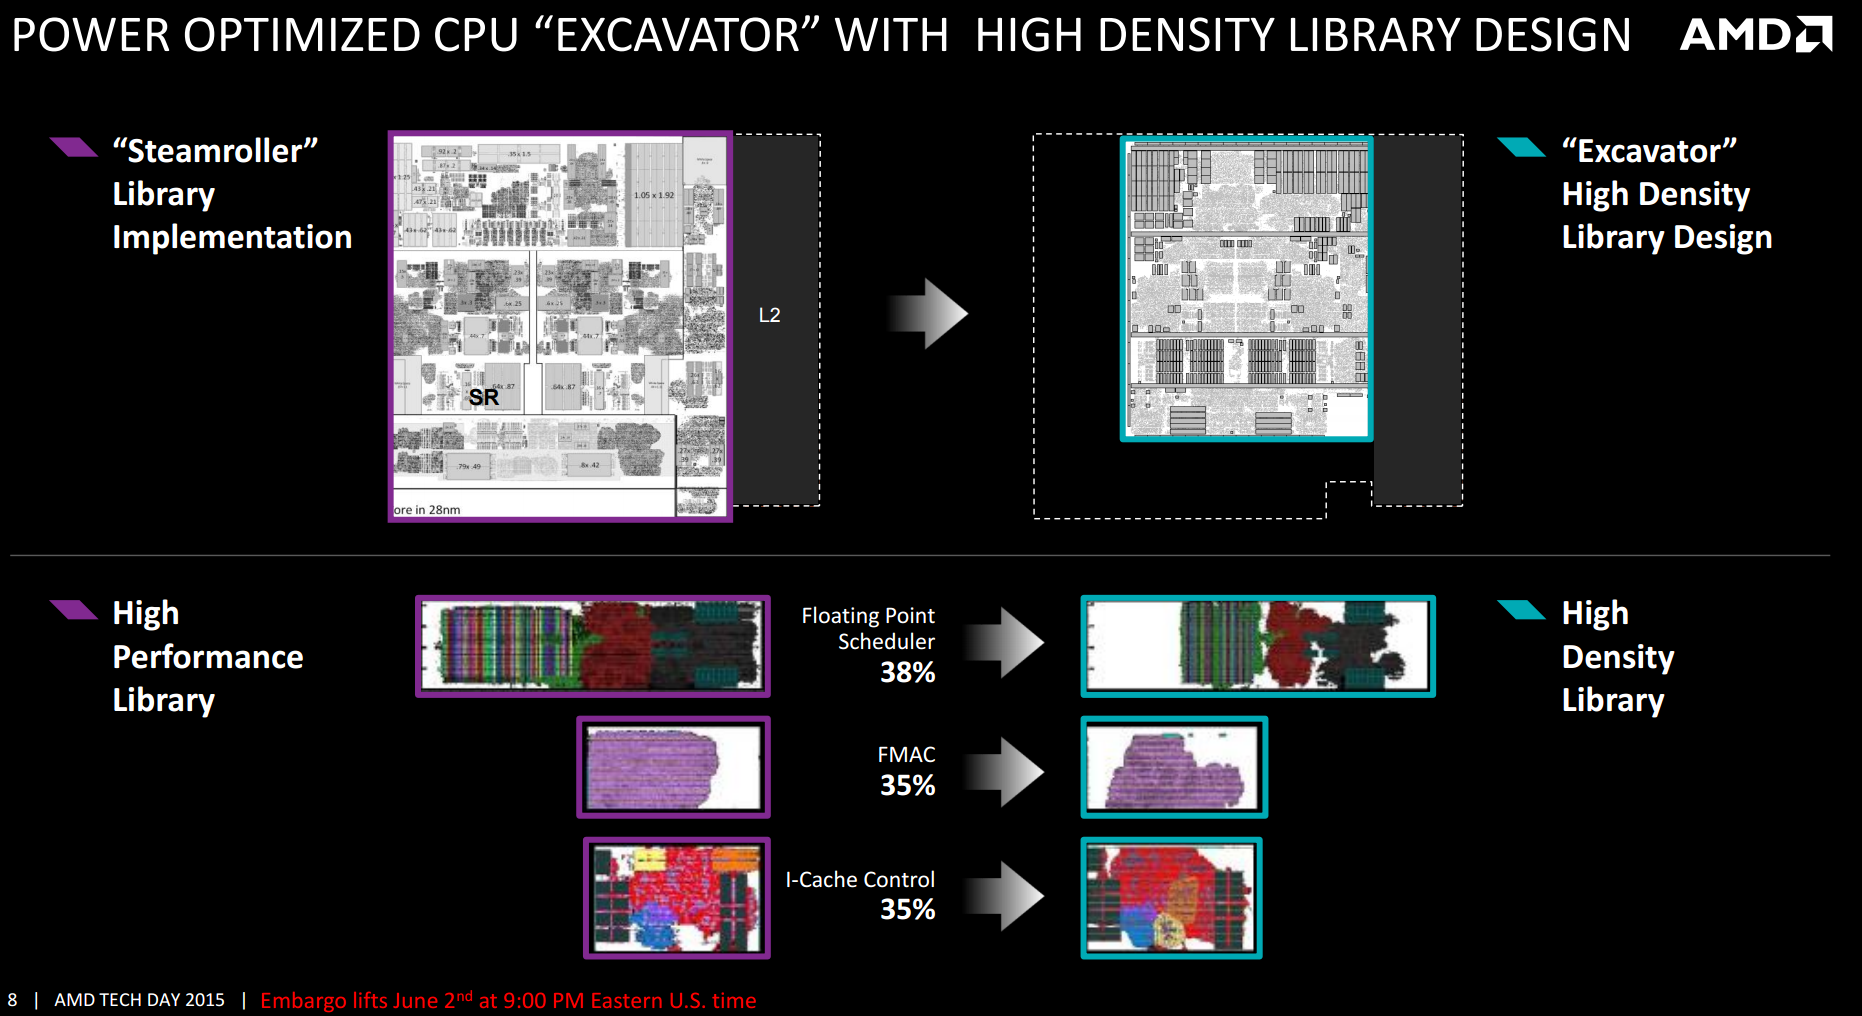
A change in the metal stack layers making the whole piece of silicon more GPU like in the design, affording higher density and power efficiency characteristics.
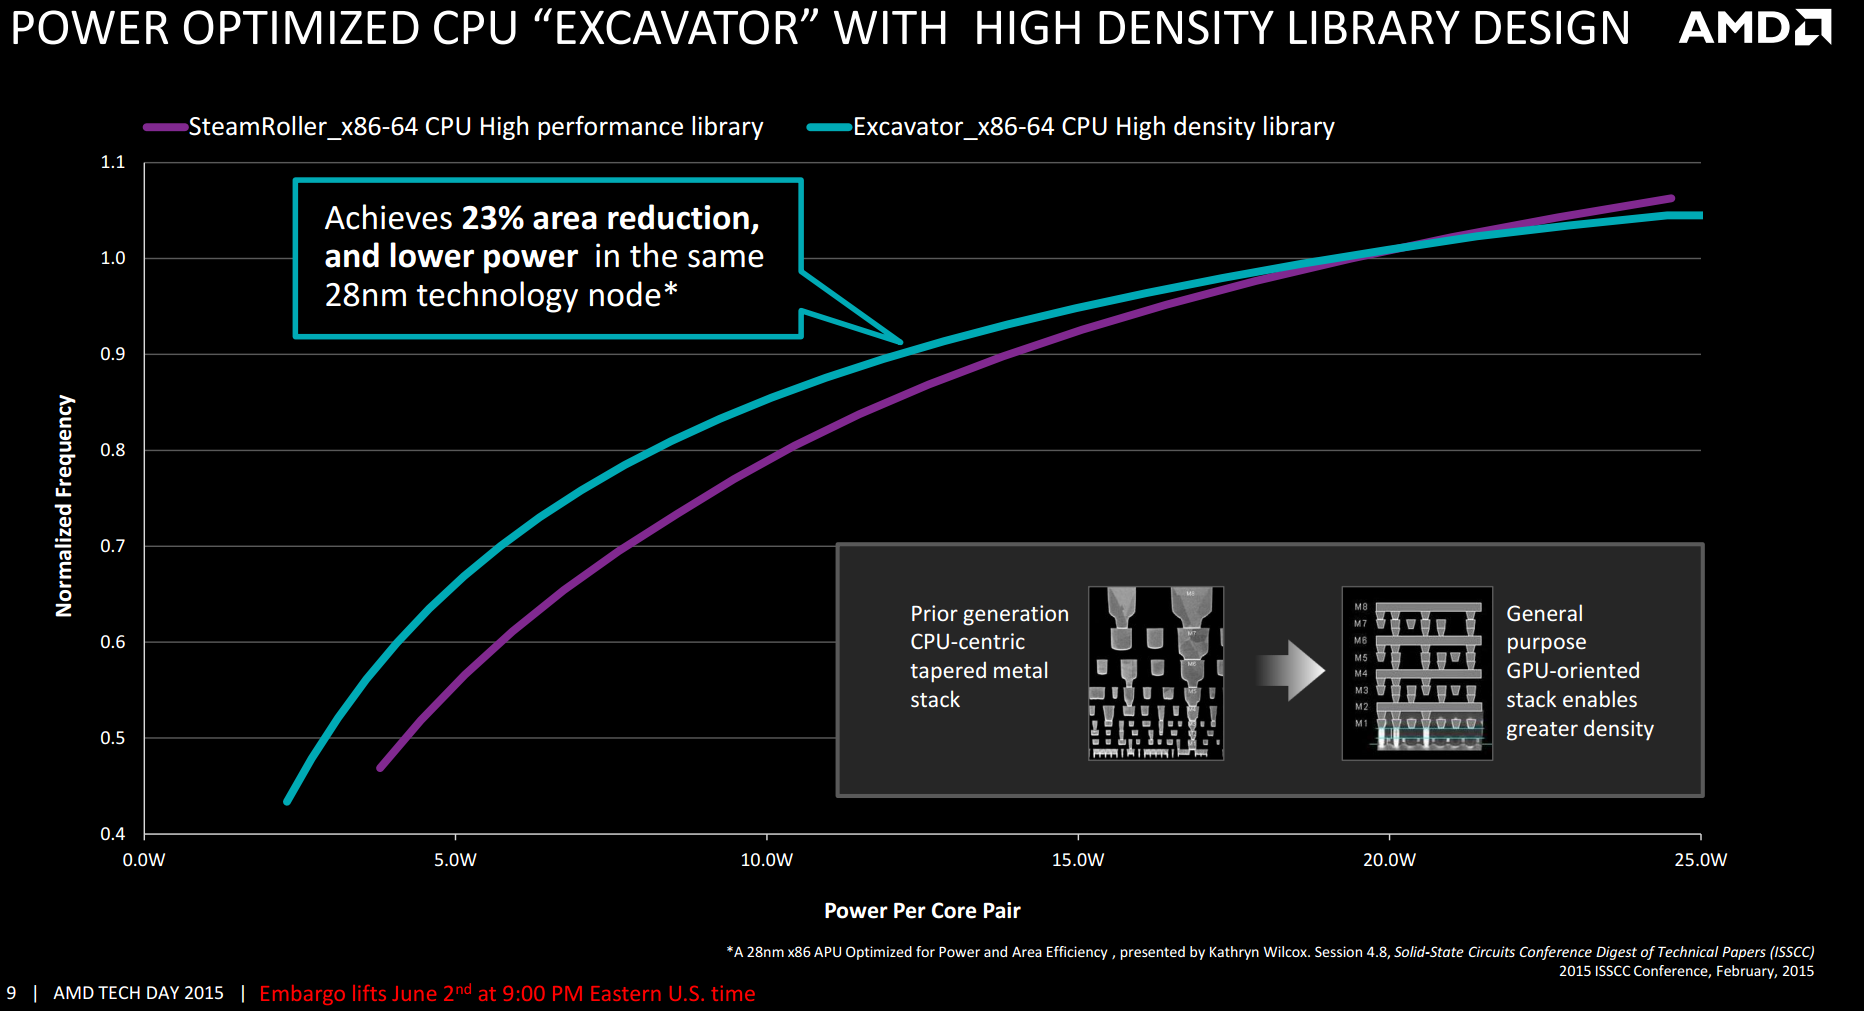
Excavator, and by extention Carrizo, was touted in the press as being the biggest upgrade to the base Bulldozer design since the introduction of Bulldozer itself. This sentiment came from the redesigned high density silicon libraries for various logic operations. Rather than optimize the libraries for performance, AMD redesigned them almost from scratch, shifting the paradigm of continual optimization to size. This led to a significant decrease in die area at the cost of only a little headroom in frequency but also a power saving.
The other caveat is that a processor core is typically designed for a certain power window. So a 4-core CPU design that ends up in 35W and 90w processors must run between 8W and 22W per core in perfect operation. The wider the window, the more compromises that have to be made to the design to cope with high frequency/power units in order to get regular deterministic operation. AMD aimed their dual module Carrizo design squarely at 15W for laptops and mobile devices, although the high-end parts could also offer a 35W boost mode, depending on the device manufacturer.
At the tech day, AMD were careful to point out that at 35W, the efficiency of Carrizo will be on par in terms of performance with the previous generation Kaveri, meaning the only benefits would be the improved power saving (and video playback capabilities for parts with the integrated graphics). If the graphical representation of this from AMD is anything to go by, it would even suggest a performance regression with higher power consumption. To put that in terms of today's review, the Athlon X4 845 runs at 65W.
What This Means
Despite the mobile focused design, AMD decided to release a single Carrizo core based part (using DDR3) for the desktop. The Athlon X4 845 comes with a lot of caveats compared to the mobile parts: no integrated graphics in exchange for a much higher 65W TDP and a small bump in frequency. Desktop owners will be careful as well, given the mobile parts only had eight lanes of PCIe 3.0 for graphics, and this continues for the desktop part. This limits the X4 845 to single GPU configurations as a focal point.
So all in all, the X4 845 should be heading in the bin: a high powered, low efficiency Carrizo that should perform on par or worse with similarly rated Kaveri APUs. Unfortunately we weren't able to source identical TDP units for this review, but as the IPC comparison will show, Carrizo and the Excavator microarchitecture is a big step forward in the Bulldozer family of microarchitectures over the Steamroller core and the Kaveri design.
This Review
I wanted to test a number of degrees of freedom with this review, especially as it becomes a precursor of what many people are expecting to see before Zen is released on the AM4 platform. First of all, we look at the generational performance of four Athlon going through the years.
- The Athlon X4 845, Carrizo cores with Excavator micro-architecture
- The Athlon X4 860K, Kaveri cores with Steamroller micro-architecture
- The Athlon X4 760K, Richland cores with Piledriver v2 micro-architecture
- The Athlon X4 750K, Trinity cores with Piledriver micro-architecture
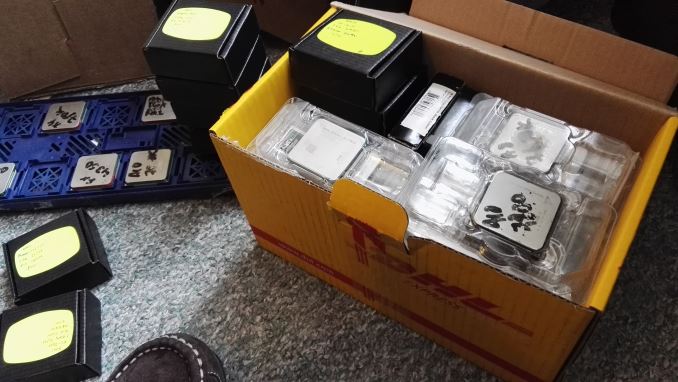
Some of these parts were sampled, others were purchased for the review.
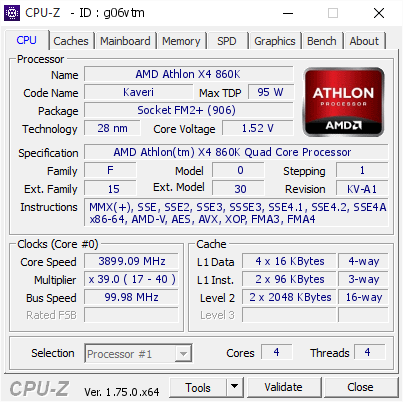
AMD Athlon X4 845, Carrizo (left)
AMD Athlon X4 860K, Kaveri (right)
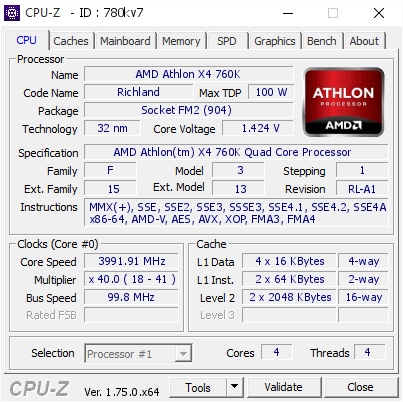
AMD Athlon X4 760K, Richland (left)
AMD Athlon X4 750K, Trinity (right)
To start, we deep dive into the performance of the architecture. For this, all four processors are set to a fixed 3 GHz for our tests, including games with our set of GPUs. The goal here is to see how the core logic adapts in single threaded benchmarks, or do adequate operation and memory allocation in multithreaded workloads. One of the main goals with the new iterations of the Bulldozer floorplan has been to actively use the right cores with the right scheduling to avoid stalls and provide better prediction methods for future memory requirements.
Then we move on to how the Athlon X4 845 overclocking section. As this is not a K processor, we are rather limited in what we can do, but given that this is a mobile-focused part we can test to see if as AMD is near the limit of the core power design or if there is still room at the top.
To finish off, we'll have a number of benchmark results showing the X4 845 against processors from our database that cost a similar amount. The obvious competition here is the dual-core Intel Pentium G3258, which is an overclocking focused part that has a retail price of $72. We will also add in a high-cost APU to determine the performance differential. This doesn't take into account system to system costs, such as additional $ for coolers or motherboards, as these can be variable.
Pages In This Review
AMD's Carrizo Thoroughly Tested Part 2: Introduction
Test Bed and Setup
Benchmark Overview
Performance at 3 GHz: Real World
Performance at 3 GHz: Office
Performance at 3 GHz: Linux
Performance at 3 GHz: Legacy
Gaming at 3 GHz: Alien Isolation
Gaming at 3 GHz: Total War Attila
Gaming at 3 GHz: Grand Theft Auto
Gaming at 3 GHz: Grid Autosport
Gaming at 3 GHz: Shadow of Mordor
Analyzing The Improvements
AMD Athlon X4 845 Overclocking: A Non-Starter
Stock Comparison: Real World
Stock Comparison: Office
Stock Comparison: Linux Bench
Stock Comparison: Legacy and Synthetic
Gaming Comparison: Alien Isolation
Gaming Comparison: Total War: Attila
Gaming Comparison: Grand Theft Auto
Gaming Comparison: Grid Autosport
Gaming Comparison: Shadow of Mordor
Power Consumption
AMD's Desktop Future: AM4, Bristol Ridge and Summit Ridge
Test Bed and Setup
As per our processor testing policy, we take a premium category motherboard suitable for the socket, and equip the system with a suitable amount of memory running at the manufacturer's maximum supported frequency. This is also typically run at JEDEC subtimings where possible. It is noted that some users are not keen on this policy, stating that sometimes the maximum supported frequency is quite low, or faster memory is available at a similar price, or that the JEDEC speeds can be prohibitive for performance. While these comments make sense, ultimately very few users apply memory profiles (either XMP or other) as they require interaction with the BIOS, and most users will fall back on JEDEC supported speeds - this includes home users as well as industry who might want to shave off a cent or two from the cost or stay within the margins set by the manufacturer. Where possible, we will extend out testing to include faster memory modules either at the same time as the review or a later date.
| Test Setup | |
| Processor | AMD Athlon X4 845: 2M/4T, 3.5 GHz, 65W, Carrizo Cores AMD Athlon X4 860K: 2M/4T, 3.7 GHz, 95W, Kaveri Cores AMD Athlon X4 760K: 2M/4T, 3.8 GHz, 100W, Richland Cores AMD Athlon X4 750K: 2M/4T, 3.4 GHz, 100W, Trinity Cores |
| Motherboards | ASUS A88X-Pro |
| Cooling | Cooler Master Nepton 140XL |
| Power Supply | Antec 1200W High Current Pro |
| Memory | GeIL Super Veloce 2x8GB DDR3-2400 C11 Kit |
| Memory Settings | JEDEC @ 2133 C10 for X4 845 JEDEC @ 1866 C9 for X4 860K/X4 760K/X4 750K |
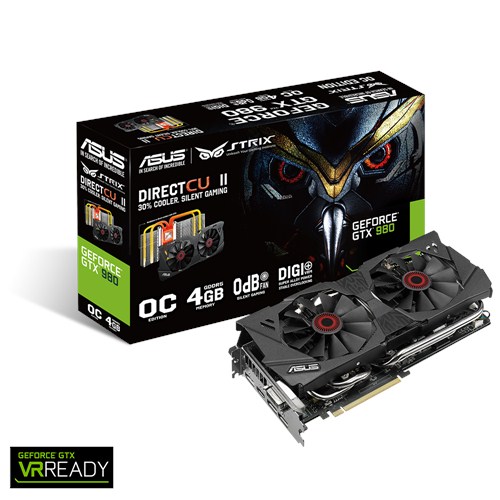
| Video Cards | ASUS GTX 980 Strix 4GB MSI R9 290X Gaming 4G MSI GTX 770 Lightning 2GB MSI R9 285 Gaming 2G ASUS R7 240 2GB |
| Hard Drive | Crucial MX200 1TB |
| Optical Drive | Viewsonic VX2270XMH-LED 22-inch FHD |
| Case | Open Test Bed |
| Operating System | Windows 7 64-bit SP1 |
Many thanks to...
We must thank the following companies for kindly providing hardware for our multiple test beds. Some of this hardware is not in this test bed specifically, but is used in other testing.
Thank you to AMD for providing us with the R9 290X 4GB GPUs. These are MSI branded 'Gaming' models, featuring MSI's Twin Frozr IV dual-fan cooler design and military class components. Bundled with the cards is MSI Afterburner for additional overclocking, as well as MSI's Gaming App for easy frequency tuning.
The R9 290X is a second generation GCN card from AMD, under the Hawaii XT codename, and uses their largest Sea Islands GPU die at 6.2 billion transistors at 438mm2 built at TSMC using a 28nm process. For the R9 290X, that means 2816 streaming processors with 64 ROPs using a 512-bit memory bus to GDDR5 (4GB in this case). The official power rating for the R9 290X is 250W.
The MSI R9 290X Gaming 4G runs the core at 1000 MHz to 1040 MHz depending on what mode it is in (Silent, Gaming or OC), and the memory at 5 GHz. Displays supported include one DisplayPort, one HDMI 1.4a, and two dual-link DVI-D connectors.
Further Reading: AnandTech's AMD R9 290X Review

Thank you to ASUS for providing us with GTX 980 Strix GPUs. At the time of release, the STRIX brand from ASUS was aimed at silent running, or to use the marketing term: '0dB Silent Gaming'. This enables the card to disable the fans when the GPU is dealing with low loads well within temperature specifications. These cards equip the GTX 980 silicon with ASUS' Direct CU II cooler and 10-phase digital VRMs, aimed at high-efficiency conversion. Along with the card, ASUS bundles GPU Tweak software for overclocking and streaming assistance.
The GTX 980 uses NVIDIA's GM204 silicon die, built upon their Maxwell architecture. This die is 5.2 billion transistors for a die size of 298 mm2, built on TMSC's 28nm process. A GTX 980 uses the full GM204 core, with 2048 CUDA Cores and 64 ROPs with a 256-bit memory bus to GDDR5. The official power rating for the GTX 980 is 165W.
The ASUS GTX 980 Strix 4GB (or the full name of STRIX-GTX980-DC2OC-4GD5) runs a reasonable overclock over a reference GTX 980 card, with frequencies in the range of 1178-1279 MHz. The memory runs at stock, in this case 7010 MHz. Video outputs include three DisplayPort connectors, one HDMI 2.0 connector and a DVI-I.
Further Reading: AnandTech's NVIDIA GTX 980 Review
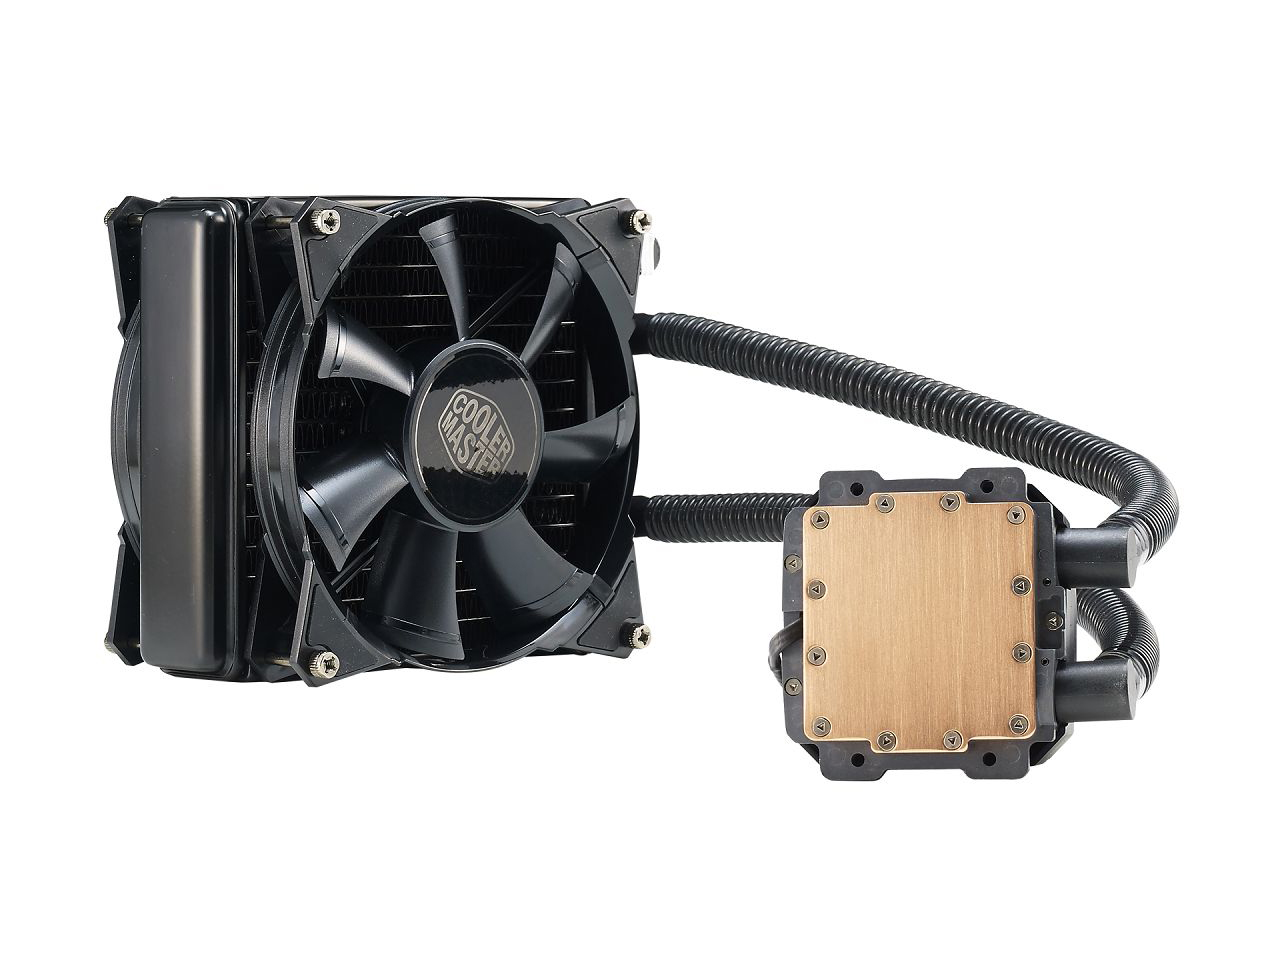
Thank you to Cooler Master for providing us with Nepton 140XL CLCs. The Nepton 140XL is Cooler Master's largest 'single' space radiator liquid cooler, and combines with dual 140mm 'JetFlo' fans designed for high performance, from 0.7-3.5mm H2O static pressure. The pump is also designed to be faster, more efficient, and uses thicker pipes to assist cooling with a rated pump noise below 25 dBA. The Nepton 140XL comes with mounting support for all major sockets, as far back as FM1, AM2 and 775.
Further Reading: AnandTech's Cooler Master Nepton 140XL Review
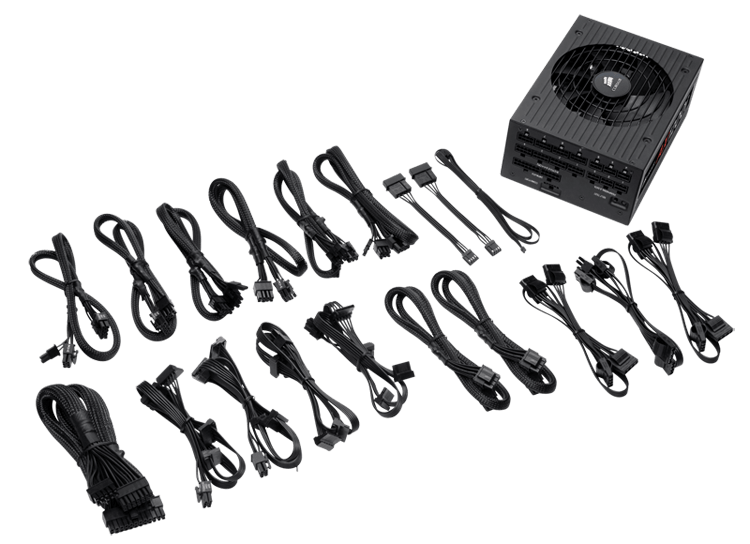
Thank you to Corsair for providing us with an AX1200i PSU. The AX1200i was the first power supply to offer digital control and management via Corsair's Link system, but under the hood it commands a 1200W rating at 50C with 80 PLUS Platinum certification. This allows for a minimum 89-92% efficiency at 115V and 90-94% at 230V. The AX1200i is completely modular, running the larger 200mm design, with a dual ball bearing 140mm fan to assist high-performance use. The AX1200i is designed to be a workhorse, with up to 8 PCIe connectors for suitable four-way GPU setups. The AX1200i also comes with a Zero RPM mode for the fan, which due to the design allows the fan to be switched off when the power supply is under 30% load.
Further Reading: AnandTech's Corsair AX1500i Power Supply Review
Thank you to Crucial for providing us with MX200 SSDs. Crucial stepped up to the plate as our benchmark list grows larger with newer benchmarks and titles, and the 1TB MX200 units are strong performers. Based on Marvell's 88SS9189 controller and using Micron's 16nm 128Gbit MLC flash, these are 7mm high, 2.5-inch drives rated for 100K random read IOPs and 555/500 MB/s sequential read and write speeds. The 1TB models we are using here support TCG Opal 2.0 and IEEE-1667 (eDrive) encryption and have a 320TB rated endurance with a three-year warranty.
Further Reading: AnandTech's Crucial MX200 (250 GB, 500 GB & 1TB) Review

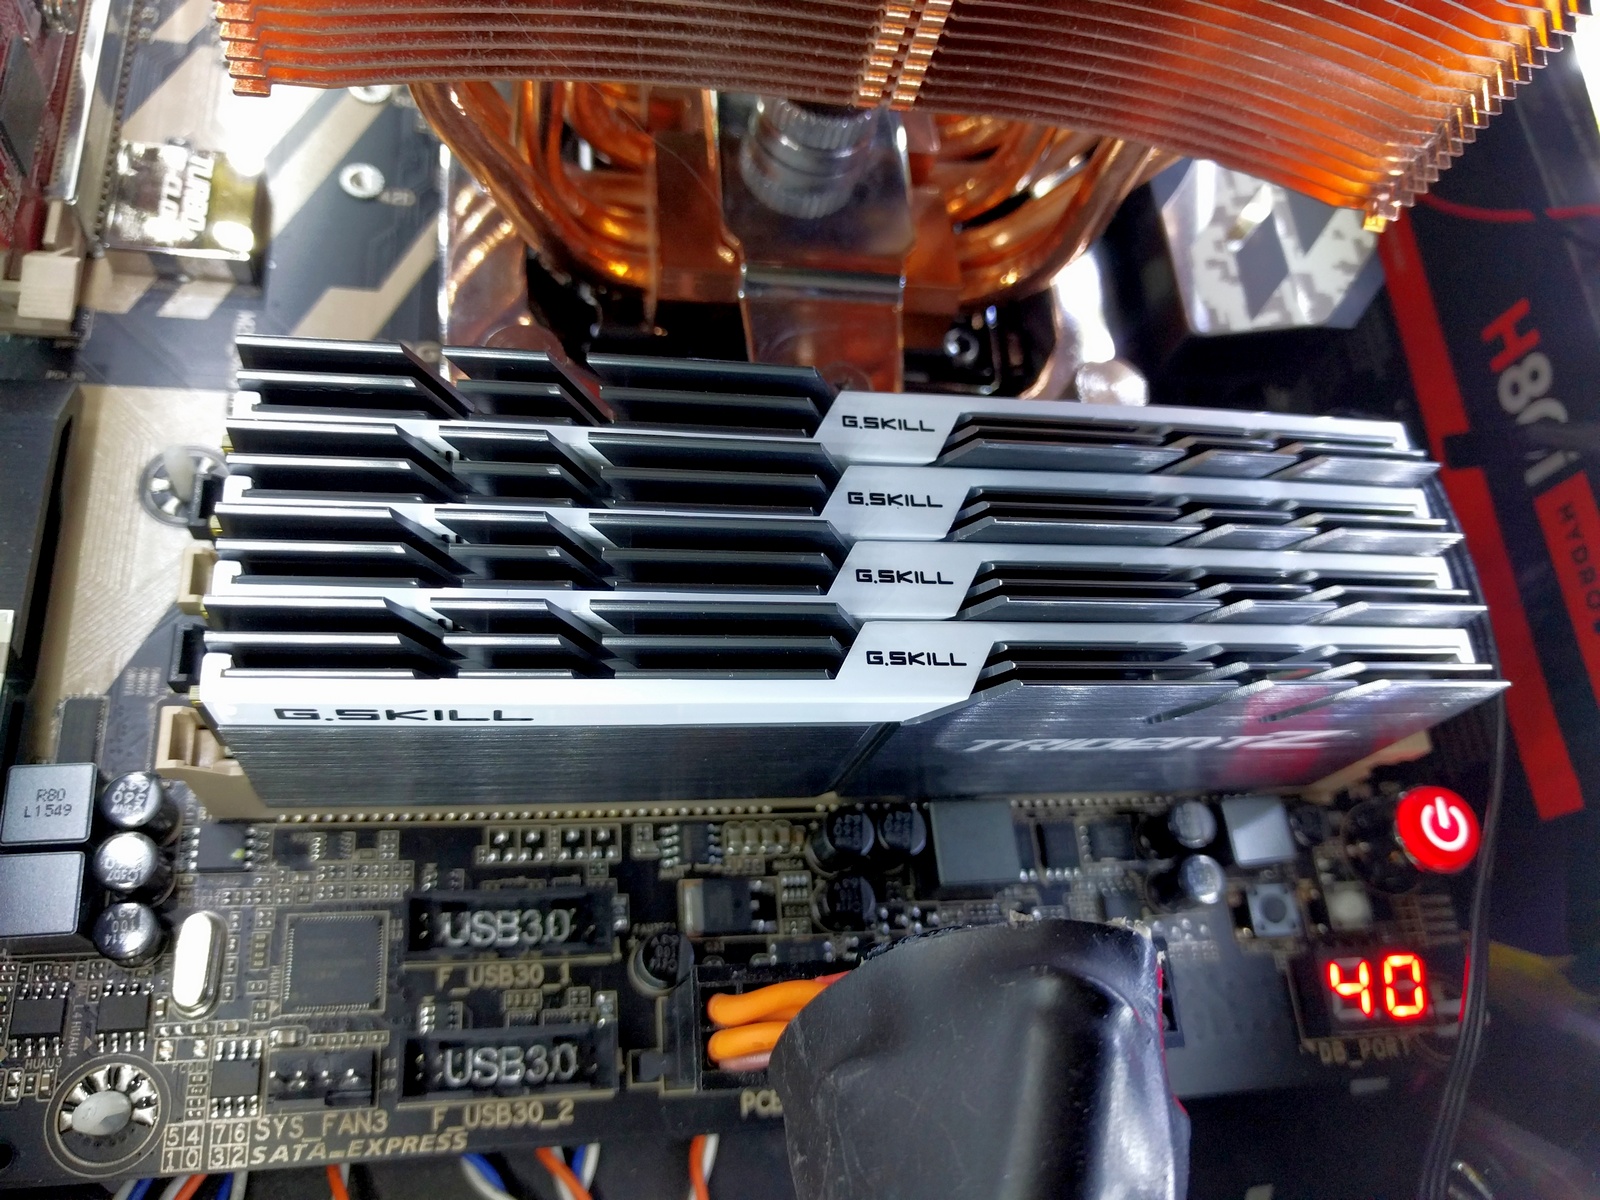
Thank you to G.Skill for providing us with memory. G.Skill has been a long-time supporter of AnandTech over the years, for testing beyond our CPU and motherboard memory reviews. We've reported on their high capacity and high-frequency kits, and every year at Computex G.Skill holds a world overclocking tournament with liquid nitrogen right on the show floor. One of the most recent deliveries from G.Skill was their 4x16 GB DDR4-3200 C14 Kit, which we are planning for an upcoming review.
Further Reading: AnandTech's Memory Scaling on Haswell Review, with G.Skill DDR3-3000
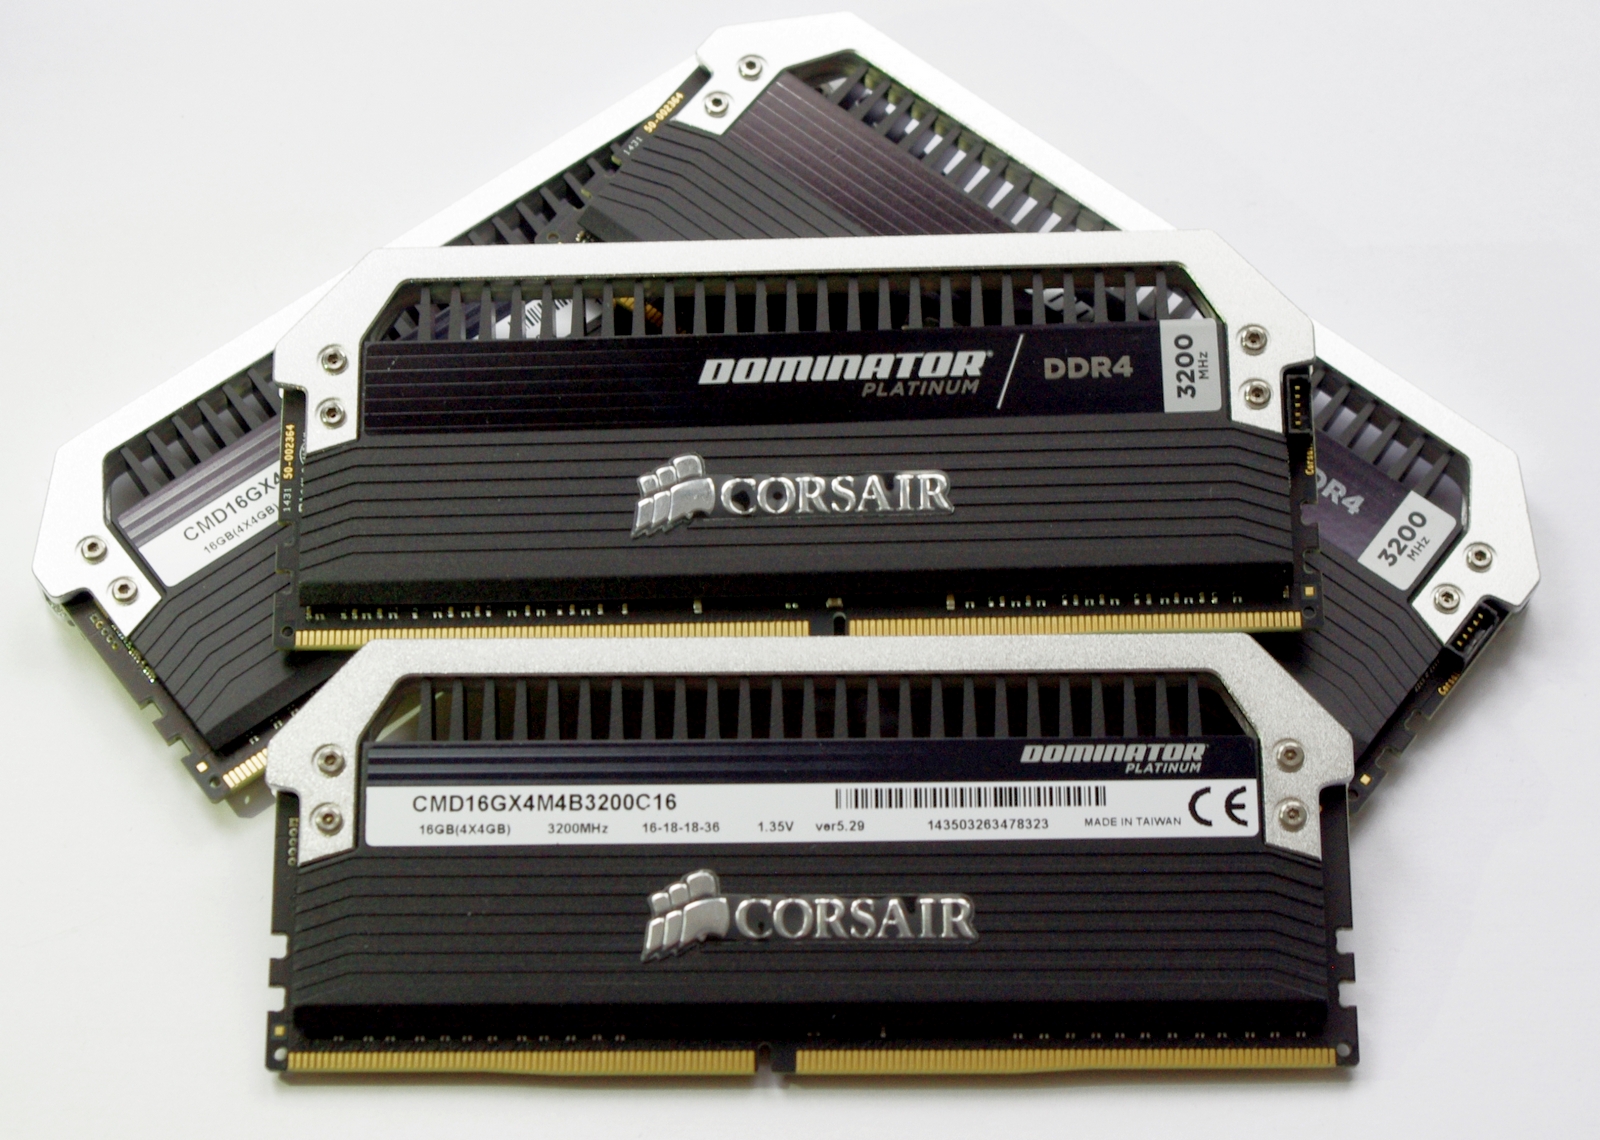
Thank you to Corsair for providing us with memory. Similarly, Corsair (along with PSUs) is also a long-time supporter of AnandTech. Being one of the first vendors with 16GB modules for DDR4 was a big deal, and now Corsair is re-implementing LEDs back on its memory after a long hiatus along with supporting specific projects such as ASUS ROG versions of the Dominator Platinum range. We're currently looking at our review pipeline to see when our next DRAM round-up will be, and Corsair is poised to participate.
Further Reading: AnandTech's Memory Scaling on Haswell-E Review
Benchmark Overview
For our testing, depending on the product, we attempt to tailor the presentation of our global benchmark suite down into what users who would buy this hardware might actually want to run. Barring abnormalities, our full test suite is typically used to gather data and all the results are placed into Bench, our benchmark database for users that want to look at non-typical benchmarks or legacy data.
The benchmarks fall into several areas:
Short Form CPU
Our short form testing script uses a straight run through of a mixture of known apps or workloads, and requires about four hours. These are typically the CPU tests we run in our motherboard suite, to identify any performance anomolies.
| CPU Short Form Benchmarks | ||
| Three Dimensional Particle Movement (3DPM) | v1 | 3DPM is a self-penned benchmark, derived from my academic research years looking at particle movement parallelism. The coding for this tool was rough, but emulates the real world in being non-CompSci trained code for a scientific endeavor. The code is unoptimized, but the test uses OpenMP to move particles around a field using one of six 3D movement algorithms in turn, each of which is found in the academic literature. This test is performed in single thread and multithreaded workloads, and uses purely floating point numbers. The code was written in Visual Studio 2008 in Release mode with all optimizations (including fast math and -Ox) enabled. We take the average of six runs in each instance. |
| v2 | The second version of this benchmark is similar to the first, however it has been re-written in VS2012 with one major difference: the code has been written to address the issue of false sharing. If data required by multiple threads, say four, is in the same cache line, the software cannot read the cache line once and split the data to each thread - instead it will read four times in a serial fashion. The new software splits the data to new cache lines so reads can be parallelized and stalls minimized. As v2 is fairly new, we are still gathering data and results are currently limited. |
|
| WinRAR 5.01 | WinRAR is a compression based software to reduce file size at the expense of CPU cycles. We use the version that has been a stable part of our benchmark database through 2015, and run the default settings on a 1.52GB directory containing over 2800 files representing a small website with around thirty half-minute videos. We take the average of several runs in this instance. | |
| POV-Ray 3.7 beta | POV-Ray is a common ray-tracing tool used to generate realistic looking scenes. We've used POV-Ray in its various guises over the years as a good benchmark for performance, as well as a tool on the march to ray-tracing limited immersive environments. We use the built-in multithreaded benchmark. | |
| HandBrake | HandBrake is a freeware video conversion tool. We use the tool in to process two different videos - first a 'low quality' two hour video at 640x388 resolution to x264, then a 'high quality' ten minute video at 4320x3840. The low quality video scales at lower performance hardware, whereas the buffers required for high-quality can stretch even the biggest processors. At current, this is a CPU only test. | |
| 7-Zip | 7-Zip is a freeware compression/decompression tool that is widely deployed across the world. We run the included benchmark tool using a 50MB library and take the average of a set of fixed-time results. | |
Web, Synthetic and Legacy
The web tests are a usual mix of Octane/Kraken with WebXPRT in the mix. Synthetic and Legacy CPU testing relates to our long-term data under CineBench and x264.
| Web and Synthetic Benchmarks | |
| Google Octane 2.0 | Lots of factors go into web development, including the tools used and the browser those tools play in. One of the common and widely used benchmarks to judge performance is Google Octane, now in version 2.0. To quote: 'The updated Octane 2.0 benchmark includes four new tests to measure new aspects of JavaScript performance, including garbage collection / compiler latency and asm.js-style JavaScript performance.' |
| Mozilla Kraken 1.1 | Kraken is a similar tool to Google, focusing on web tools and processing power. Kraken's tools include searching algorithms, audio processing, image filtering, flexible database parsing and cryptographic routines. |
| WebXPRT 2013/2015 | WebXPRT aims to be a souped up version of Octane and Kraken, using these tools in real time to display data in photograph enhancement, sorting, stock options, local storage manipulation, graphical enterfaces and even filtering algorithms on scientific datasets. We run the 2013 and 2015 versions of the benchmark. |
| Cinebench | Cinebench is a widely known benchmarking tool for measuring performance relative to MAXON's animation software Cinema 4D. Cinebench has been optimized over a decade and focuses on purely CPU horsepower, meaning if there is a discrepancy in pure throughput characteristics, Cinebench is likely to show that discrepancy. Arguably other software doesn't make use of all the tools available, so the real world relevance might purely be academic, but given our large database of data for Cinebench it seems difficult to ignore a small five minute test. We run the modern version 15 in this test, as well as the older 11.5 due to our back data. |
| x264 HD 3.0 | Similarly, the x264 HD 3.0 package we use here is also kept for historic regressional data. The latest version is 5.0.1, and encodes a 1080p video clip into a high quality x264 file. Version 3.0 only performs the same test on a 720p file, and in most circumstances the software performance hits its limit on high end processors, but still works well for mainstream and low-end. Also, this version only takes a few minutes, whereas the latest can take over 90 minutes to run. |
| TrueCrypt 7.1 | Before its discontinuation, TrueCrypt was a popular tool for WindowsXP to offer software encryption to a file system. The near-latest version, 7.1, is still widely used however the developers have stopped supporting it since the introduction of encrypted disk support in Windows 8/7/Vista from 5/2014, and as such any new security issues are unfixed. |
Long Form and Professional Benchmarks
For reviews that require a little more depth, we invoke our long form CPU tests. These scripts include the short form tests, the web tests, and bundle some real-world tests that are influenced by processor frequency, core count, cache sizes and memory support. Generational advances between CPU microarchitectures show up here as well. Our professional tests involve a 2D to 3D image and model conversion tool used by archivists and modelers as well as Linux Bench. We are currently looking into expanding our professional testing suite to include code compilation as well as FPGA workflows.
| Long Form and Professional Benchmarks | |
| Dolphin 4.0 (Wii Emulation) |
Many emulators are often bound by single thread CPU performance, and general reports tended to suggest that Haswell provided a significant boost to emulator performance. This benchmark runs a Wii program that raytraces a complex 3D scene inside the Dolphin Wii emulator. Performance on this benchmark is a good proxy of the speed of Dolphin CPU emulation, which is an intensive single core task using most aspects of a CPU. |
| Agisoft Photoscan 1.0 | Photoscan is professional software that takes a series of 2D images (as little as 50, usually 250+) and 'performs calculations' to determine where the pictures were taken and if it can create a 3D model and textures of what the images are of. This model can then be exported to other software for touch-ups or implementation in physics engines/games or, as the reader that directed me to it, national archiving. The tool has four phases, one of which can be OpenCL accelerated, while the other three are a mix of single thread and variable thread workloads. |
| Linux Bench | Linux Bench is a collection of Linux based benchmarks compiled together by ServeTheHome. The idea for this is to have some non-windows based tools that are easy enough to run with a USB key, an internet connection and three lines of code in a terminal. The tests in Linux Bench include standard synthetic compute, compression, matrix manipulation, database tools and key-value storage. |
Gaming
Our Gaming test suite is still our 2015 implementation, which remains fairly solid over gaming title updates. We are still working on a 2016 suite update, with a move to Windows 10. This will allow most of the titles to be replaced with DirectX 12, indie and eSports games.
| Gaming Benchmarks | |
| Alien: Isolation | If first person survival mixed with horror is your sort of thing, then Alien: Isolation, based off of the Alien franchise, should be an interesting title. Developed by The Creative Assembly and released in October 2014, Alien: Isolation has won numerous awards from Game Of The Year to several top 10s/25s and Best Horror titles, ratcheting up over a million sales by February 2015. Alien: Isolation uses a custom built engine which includes dynamic sound effects and should be fully multi-core enabled. |
| Total War: Attila | The Total War franchise moves on to Attila, another The Creative Assembly development, and is a stand-alone strategy title set in 395AD where the main story line lets the gamer take control of the leader of the Huns in order to conquer parts of the world. Graphically the game can render hundreds/thousands of units on screen at once, all with their individual actions and can put some of the big cards to task. |
| Grand Theft Auto V | The highly anticipated iteration of the Grand Theft Auto franchise finally hit the shelves on April 14th 2015, with both AMD and NVIDIA in tow to help optimize the title. GTA doesn’t provide graphical presets, but opens up the options to users and extends the boundaries by pushing even the hardest systems to the limit using Rockstar’s Advanced Game Engine. Whether the user is flying high in the mountains with long draw distances or dealing with assorted trash in the city, when cranked up to maximum it creates stunning visuals but hard work for both the CPU and the GPU. |
| GRID: Autosport | No graphics tests are complete without some input from Codemasters and the EGO engine, which means for this round of testing we point towards GRID: Autosport, the next iteration in the GRID and racing genre. As with our previous racing testing, each update to the engine aims to add in effects, reflections, detail and realism, with Codemasters making ‘authenticity’ a main focal point for this version. |
| Middle-Earth: Shadow of Mordor | The final title in our testing is another battle of system performance with the open world action-adventure title, Shadow of Mordor. Produced by Monolith using the LithTech Jupiter EX engine and numerous detail add-ons, SoM goes for detail and complexity to a large extent, despite having to be cut down from the original plans. The main story itself was written by the same writer as Red Dead Redemption, and it received Zero Punctuation’s Game of The Year in 2014. |
Real World Performance at 3 GHz
For our generational testing, we took each of the four main processors in this test and adjusted their CPU frequencies in the BIOS to 3 GHz. This was achieved through a 30x multiplier and 100 MHz base frequency, which for each processor is a reduction from the stock speeds. We set each CPU to perform at 3 GHz only to fix the frequency, and ran the memory in each case at the maximum supported frequency by the processor. Some benchmarks in the generational tests will probe the memory, and an upgrade in the memory controller to support higher frequencies (officially) than an older processor is, a generational upgrade, as important as the core or cache performance.
| AMD CPUs | ||||||||||||
| µArch / Core |
Cores | Base Turbo |
TDP | DDR3 | L1 (I) Cache |
L1 (D) Cache |
L2 Cache |
|||||
| Athlon X4 845 |
Excavator Carrizo |
4 | 3500 3800 |
65 W | 2133 | 192KB 3-way |
128KB 8-way |
2 MB 16-way |
||||
| Athlon X4 860K |
Steamroller Kaveri |
4 | 3700 4000 |
95 W | 1866 | 192KB 3-way |
64KB 4-way |
4 MB 16-way |
||||
| Athlon X4 760K |
Piledriver.v2 Richland |
4 | 3800 4100 |
100 W | 1866 | 128KB 2-way |
64KB 4-way |
4 MB 16-way |
||||
| Athlon X4 750K |
Piledriver Trinity |
4 | 3400 4000 |
100 W | 1866 | 128KB 2-way |
64KB 4-way |
4 MB 16-way |
||||
Speaking of cache, as mentioned at the beginning of this review, the Athlon X4 845 has a significant advantage in the L1 cache layout, affording a 2x size L1 data cache along with a move from 4-way to 8-way associativity. Each of these methods, as a broad rule of thumb, typically decreases the cache miss rate by a factor of 1.414 (square root of 2x). Combined should see a factor two decrease in cache misses overall, and this will affect a number of benchmarks when we compare each processor at a fixed frequency. On the other side of the equation, the L2 cache for the X4 845 is half that of the X4 860K, meaning that if the data is not in the L1, it is less likely to be in the L2, which will add additional latency.
Dolphin Benchmark: link
Many emulators are often bound by single thread CPU performance, and general reports tended to suggest that Haswell provided a significant boost to emulator performance. This benchmark runs a Wii program that raytraces a complex 3D scene inside the Dolphin Wii emulator. Performance on this benchmark is a good proxy of the speed of Dolphin CPU emulation, which is an intensive single core task using most aspects of a CPU. Results are given in minutes, where the Wii itself scores 17.53 minutes.
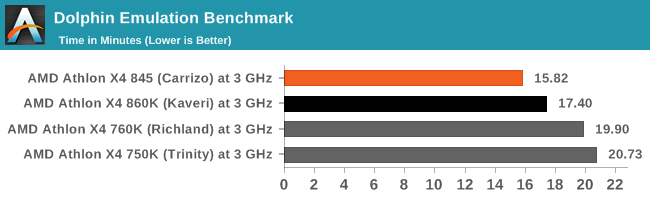
Emulation takes cues from a high IPC and base frequency, however for our generational testing it is all about the microarchitecture. The Carrizo has a 9% advantage here over the Kaveri.
WinRAR 5.0.1: link
Our WinRAR test from 2013 is updated to the latest version of WinRAR at the start of 2014. We compress a set of 2867 files across 320 folders totaling 1.52 GB in size – 95% of these files are small typical website files, and the rest (90% of the size) are small 30 second 720p videos.
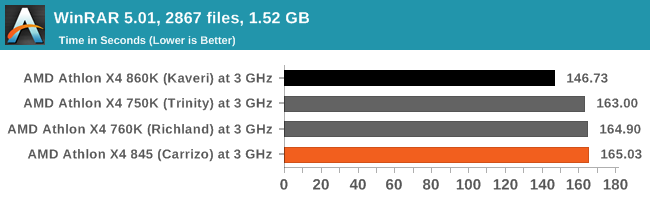
WinRAR enjoys memory bandwidth with its variable workload, and seemingly the Kaveri has a strong showing here. The Carrizo only has 2MB of L2 cache, which most likely puts it at a disadvantage.
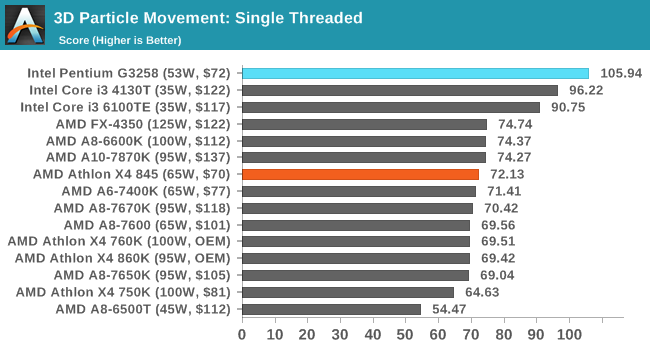
3D Particle Movement v2
The second version of this benchmark is similar to the first, however it has been re-written in VS2012 with one major difference: the code has been written to address the issue of false sharing. If data required by multiple threads, say four, is in the same cache line, the software cannot read the cache line once and split the data to each thread - instead it will read four times in a serial fashion. The new software splits the data to new cache lines so reads can be parallelized and stalls minimized. As v2 is fairly new, we are still gathering data and results are currently limited.
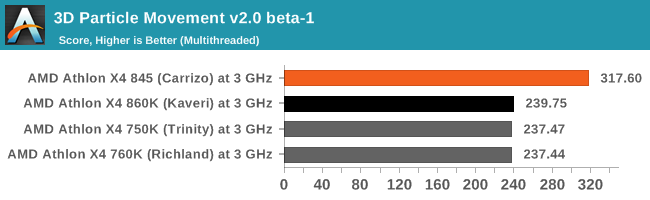
We saw this in our laptop Carrizo testing: if we adjust the software to avoid false sharing (which decreases performance), the Excavator microarchitecture pulls a significant lead in 3DPMv2. Part of this is most likely down to the larger L1 data cache as well.
Web Benchmarks
On the lower end processors, general usability is a big factor of experience, especially as we move into the HTML5 era of web browsing.
WebXPRT 2013
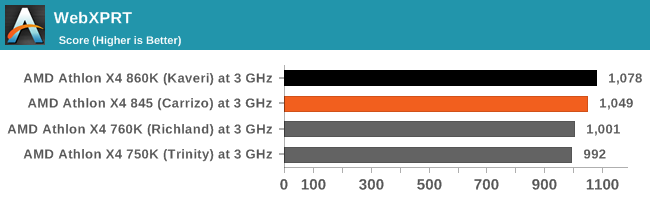
This benchmark can be memory intensive, as it draws various graphs and applies filters to pictures, among other things. The lower L2 cache hurts here.
Google Octane v2
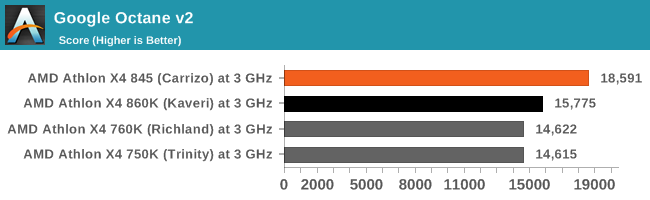
In contrast, Octane attempts to stay as close to the execution ports as possible, and the Carrizo cores take an 18% lead over Kaveri.
Office Performance at 3 GHz
All of our benchmark results can also be found in our benchmark engine, Bench.
Agisoft Photoscan – 2D to 3D Image Manipulation: link
Agisoft Photoscan creates 3D models from 2D images, a process which is very computationally expensive. The algorithm is split into four distinct phases, and different phases of the model reconstruction require either fast memory, fast IPC, more cores, or even OpenCL compute devices to hand. Agisoft supplied us with a special version of the software to script the process, where we take 50 images of a stately home and convert it into a medium quality model. This benchmark typically takes around 15-20 minutes on a high end PC on the CPU alone, with GPUs reducing the time.
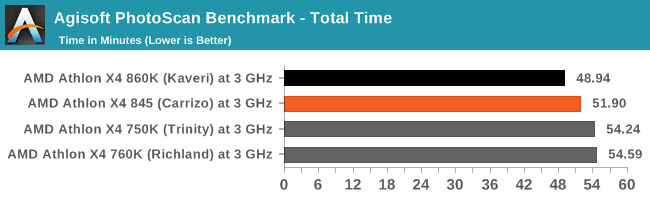
Looking at the subtests for Photoscan, Carrizo's biggest hiccup was in the first stage which loads images into memory and attempts to identify and compare similar points in the photograph and its location relative to the object. This requires a significant amount of memory management, and Carrizo loses 17% in the first stage to Kaveri. Stage 4 gets a bump with Carrizo over Kaveri, enough to bring it back over Trinity and Richland, but overall the Carrizo part is still 6% down.
Cinebench R15
Cinebench is a benchmark based around Cinema 4D, and is fairly well known among enthusiasts for stressing the CPU for a provided workload. Results are given as a score, where higher is better.
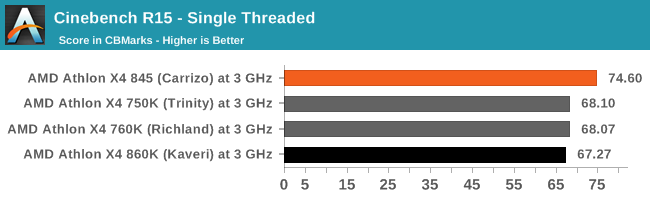
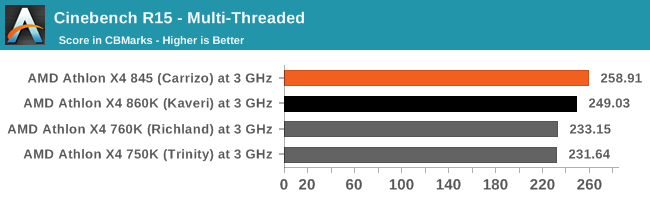
Similar to Dolphin and 3DPMv2, Carrizo's microarchitectural changes help with CineBench 15 as well. Kaveri appearing on the same level as Trinity/Richland for single threaded is as expected, with the better multithreading handling coming through in the second test.
HandBrake v0.9.9: link
For HandBrake, we take two videos (a 2h20 640x266 DVD rip and a 10min double UHD 3840x4320 animation short) and convert them to x264 format in an MP4 container. Results are given in terms of the frames per second processed, and HandBrake uses as many threads as possible.
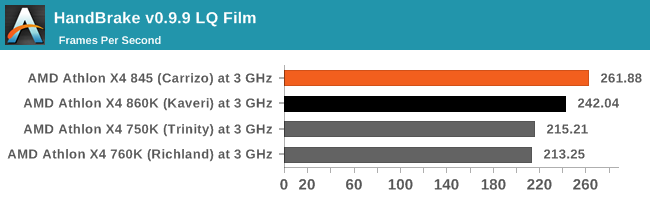
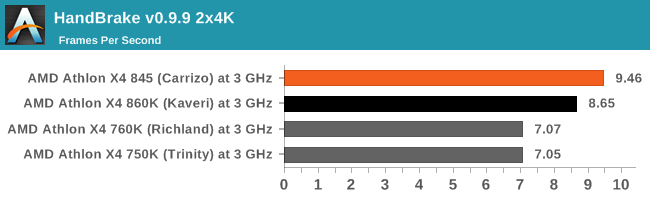
Typically we expect something like video conversion to be memory intensive, especially with codec decone/encode, however the base microarchitecture gives Carrizo an 8% lead and a 9% lead over Kaveri in our low quality and double UHD tests.
Hybrid x265
Hybrid is a new benchmark, where we take a 4K 1500 frame video and convert it into an x265 format without audio. Results are given in frames per second.
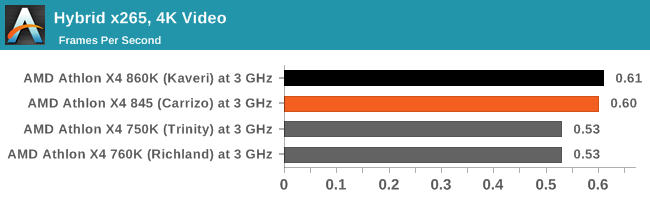
However, with x265. both Kaveri and Carrizo perform similarly.
Linux Performance at 3 GHz
Built around several freely available benchmarks for Linux, Linux-Bench is a project spearheaded by Patrick at ServeTheHome to streamline about a dozen of these tests in a single neat package run via a set of three commands using an Ubuntu 11.04 LiveCD. These tests include fluid dynamics used by NASA, ray-tracing, OpenSSL, molecular modeling, and a scalable data structure server for web deployments. We run Linux-Bench and have chosen to report a select few of the tests that rely on CPU and DRAM speed.
All of our benchmark results can also be found in our benchmark engine, Bench.
C-Ray: link
C-Ray is a simple ray-tracing program that focuses almost exclusively on processor performance rather than DRAM access. The test in Linux-Bench renders a heavy complex scene offering a large scalable scenario.
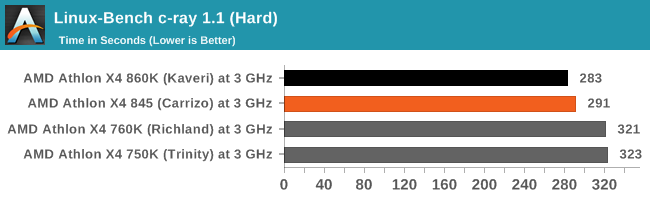
C-ray, while slowly fading in importance as a benchmark, shows a slight gain here for Kaveri despite the lack of DRAM accesses this benchmark uses. There may however still be some L2 use.
NAMD, Scalable Molecular Dynamics: link
Developed by the Theoretical and Computational Biophysics Group at the University of Illinois at Urbana-Champaign, NAMD is a set of parallel molecular dynamics codes for extreme parallelization up to and beyond 200,000 cores. The reference paper detailing NAMD has over 4000 citations, and our testing runs a small simulation where the calculation steps per unit time is the output vector.
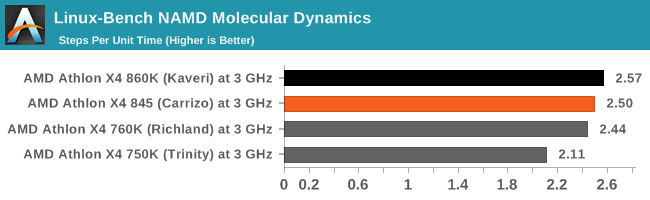
NAMD shows a small benefit for Kaveri here, with all three processors showing a +16% gain minimum over Trinity.
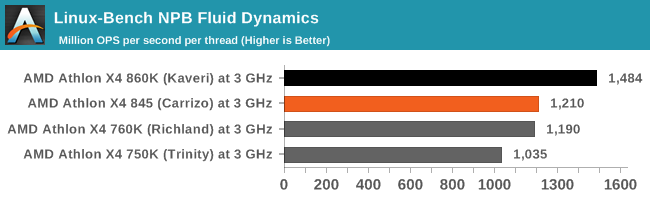
NPB, Fluid Dynamics: link
Aside from LINPACK, there are many other ways to benchmark supercomputers in terms of how effective they are for various types of mathematical processes. The NAS Parallel Benchmarks (NPB) are a set of small programs originally designed for NASA to test their supercomputers in terms of fluid dynamics simulations, useful for airflow reactions and design.
Redis: link
Many of the online applications rely on key-value caches and data structure servers to operate. Redis is an open-source, scalable web technology with a strong developer base, but also relies heavily on memory bandwidth as well as CPU performance.
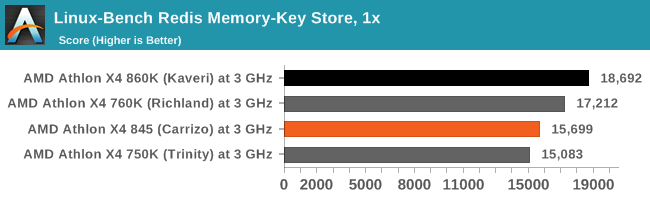
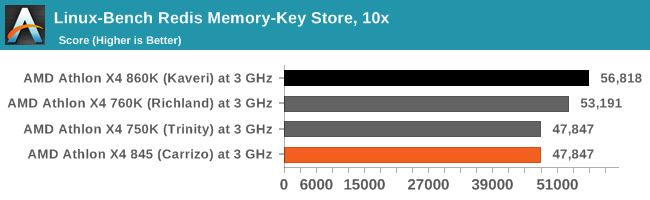

The 2MB of L2 cache, compared to the 4MB of the other parts, hurts Carrizo here.
Legacy Benchmarks at 3 GHz
Some of our legacy benchmarks have followed AnandTech for over a decade, showing how performance changes when the code bases stay the same in that period. Some of this software is still in common use today.
All of our benchmark results can also be found in our benchmark engine, Bench.
3D Particle Movement v1
3DPM is a self-penned benchmark, taking basic 3D movement algorithms used in Brownian Motion simulations and testing them for speed. High floating point performance, MHz and IPC wins in the single thread version, whereas the multithread version has to handle the threads and loves more cores. This is the original version, written in the style of a typical non-computer science student coding up an algorithm for their theoretical problem, and comes without any non-obvious optimizations not already performed by the compiler, such as false sharing.
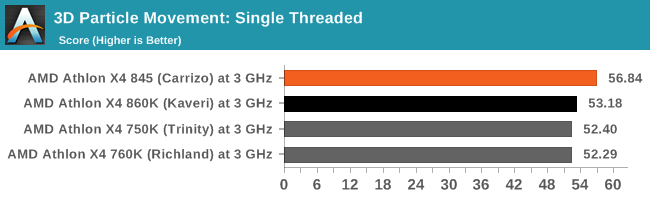
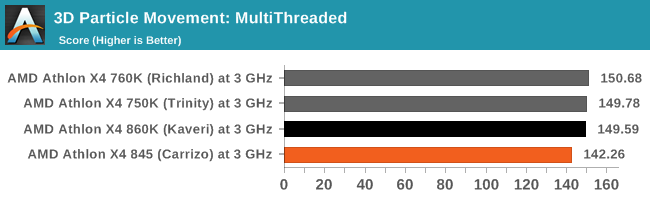
We ran 3DPM v2 earlier in the review, and it showed significant gains for Carrizo when running software that is not competing for data in shared cache lines. This older version of that benchmark still has those 'base CS' flaws that a non-CompSci science student might make, and while Carrizo has a small gain in single threaded mode, moving to multithreaded puts some strain on the caches, resulting in lower performance.
Cinebench 11.5 and 10
Cinebench is a widely known benchmarking tool for measuring performance relative to MAXON's animation software Cinema 4D. Cinebench has been optimized over a decade and focuses on purely CPU horsepower, meaning if there is a discrepancy in pure throughput characteristics, Cinebench is likely to show that discrepancy. Arguably other software doesn't make use of all the tools available, so the real world relevance might purely be academic, but given our large database of data for Cinebench it seems difficult to ignore a small five minute test. We run the modern version 15 in this test, as well as the older 11.5 and 10 due to our back data.
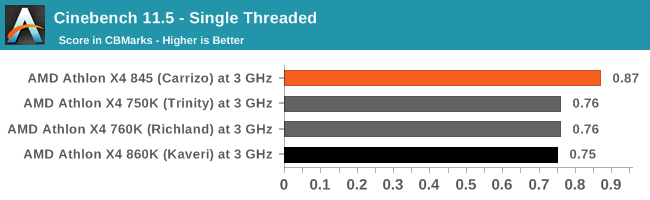
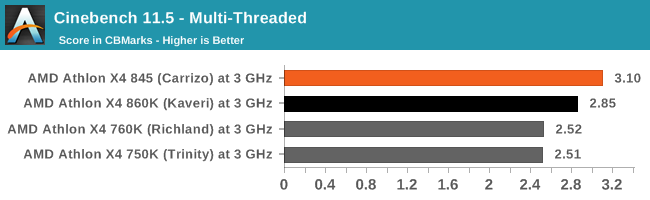
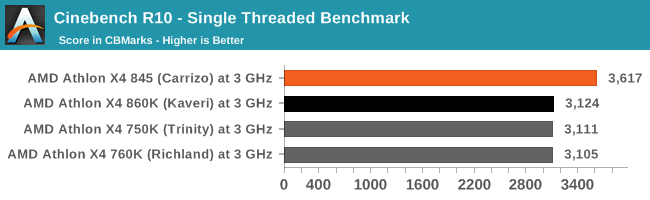
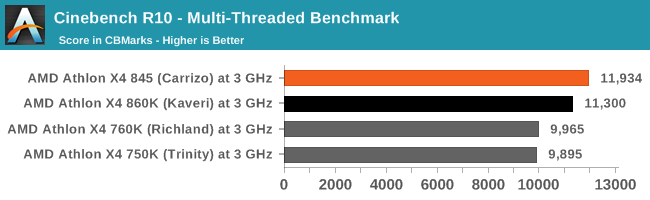
On the older versions of CineBench, like the newer ones, Carrizo has some notable microarchitectural advantages over Kaveri and previous versions of the Bulldozer microarchitecture.
POV-Ray 3.7
POV-Ray is a common ray-tracing tool used to generate realistic looking scenes. We've used POV-Ray in its various guises over the years as a good benchmark for performance, as well as a tool on the march to ray-tracing limited immersive environments. We use the built-in multithreaded benchmark.
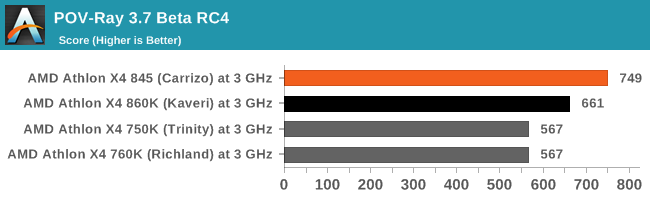
For our base ray tracing benchmark in Windows, again Carrizo pulls out a lead. This time it's around 13% over Kaveri or 32% over Trinity/Richland.
TrueCrypt 7.1
Before its discontinuation, TrueCrypt was a popular tool for WindowsXP to offer software encryption to a file system. The version we use for our tests, 7.1, is still widely used however the developers have stopped supporting it since the introduction of encrypted disk support in Windows 8/7/Vista from 5/2014, and as such any new security issues are unfixed. The benchmark itself is a good representation of microarchitectural advantages for base encryption methods.
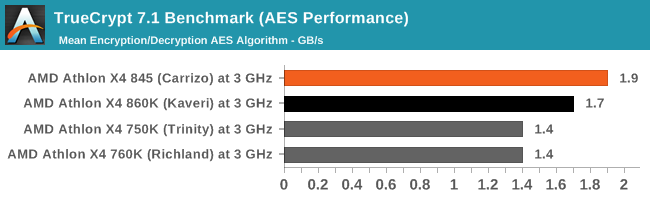
The AES performance for Carrizo is notably above Trinity/Richland, and pulls a 12% gain over Kaveri as well.
x264 HD 3.0
Similarly, the x264 HD 3.0 package we use here is also kept for historic regressional data. The latest version is 5.0.1, and encodes a 1080p video clip into a high quality x264 file. Version 3.0 only performs the same test on a 720p file, and in most circumstances the software performance hits its limit on high end processors, but still works well for mainstream and low-end. Also, this version only takes a few minutes, whereas the latest can take over 90 minutes to run.
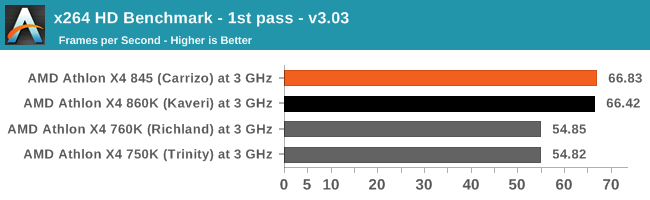

Using slightly older conversion tools shows that Carrizo and Kaveri, when the frames are small, are essentially neck and neck for performance (but still 20% over Trinity/Richland).
7-zip
7-Zip is a freeware compression/decompression tool that is widely deployed across the world. We run the included benchmark tool using a 50MB library and take the average of a set of fixed-time results.
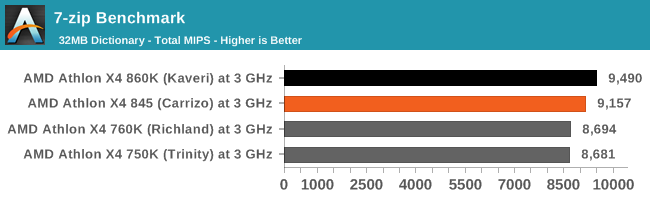
The 2MB of L2 cache for Carrizo hurts here. It makes we wonder how much more performance a 4MB cache would provide.
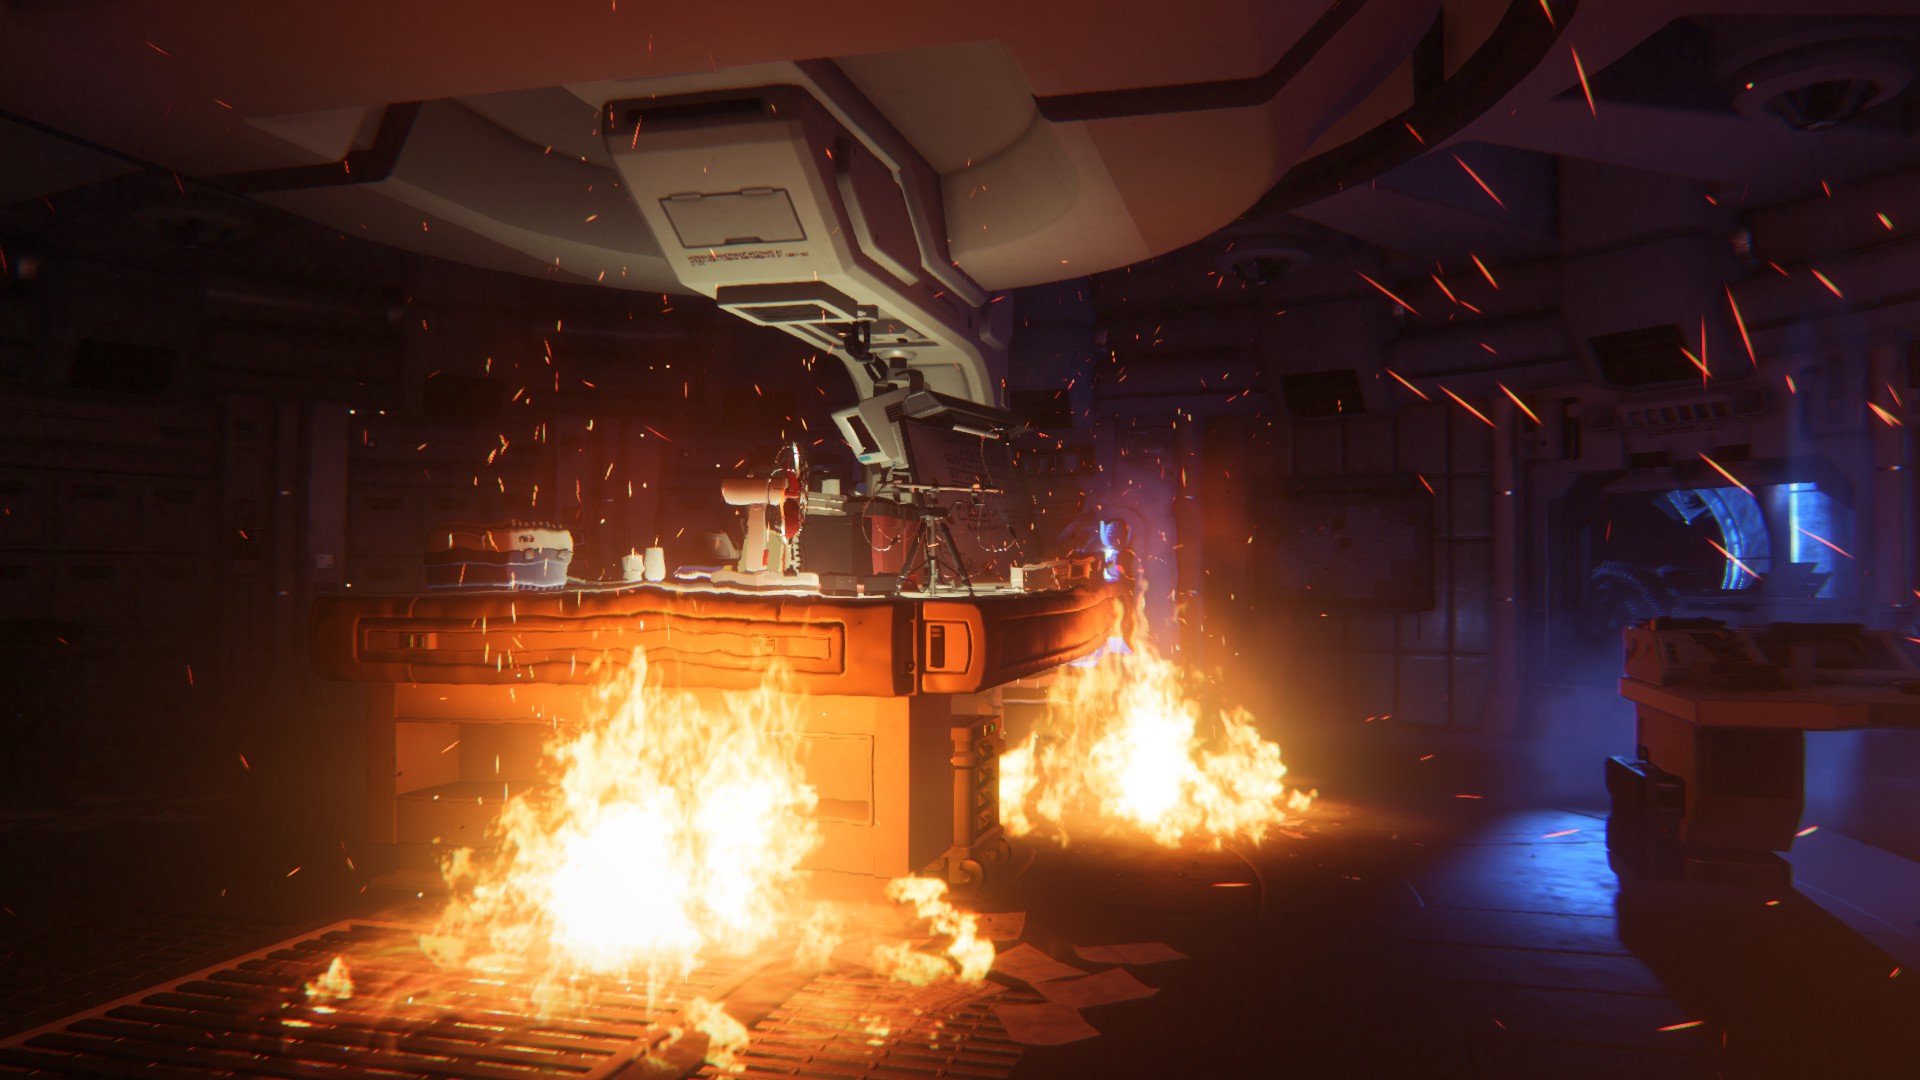
Alien: Isolation at 3 GHz
If first person survival mixed with horror is your sort of thing, then Alien: Isolation, based off of the Alien franchise, should be an interesting title. Developed by The Creative Assembly and released in October 2014, Alien: Isolation has won numerous awards from Game Of The Year to several top 10s/25s and Best Horror titles, ratcheting up over a million sales by February 2015. Alien: Isolation uses a custom built engine which includes dynamic sound effects and should be fully multi-core enabled. We take the average frame rate as our marker with a scripted version of the built-in benchmark.
For this test we used the following settings with our graphics cards:
| Alien Isolation Settings | |||
| Resolution | Quality | ||
| Low GPU | Integrated Graphics | 1280x720 | Ultra |
| ASUS R7 240 1GB DDR3 | |||
| Medium GPU | MSI GTX 770 Lightning 2GB | 1920x1080 | Ultra |
| MSI R9 285 Gaming 2G | |||
| High GPU | ASUS GTX 980 Strix 4GB | 1920x1080 | Ultra |
| MSI R9 290X Gaming 4G | |||
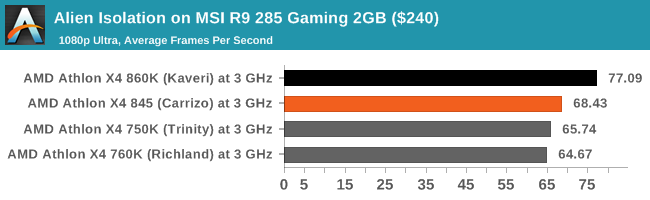
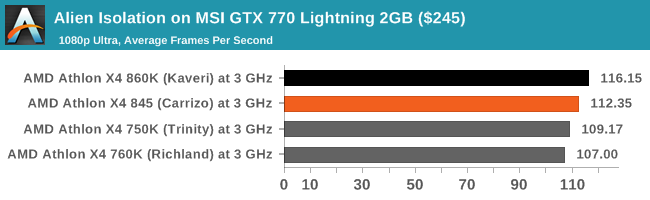

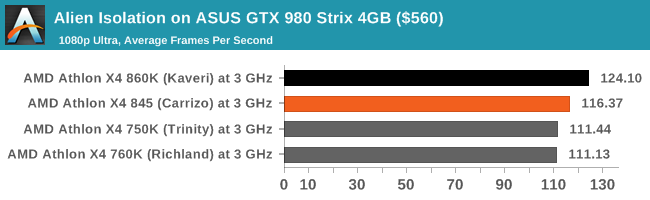
Unfortunately, Alien Isolation pushed a significant update for low-end AMD cards (like the R7 240) near the end of our benchmark suite, meaning that the 18 months of data with the card are now in the trash. Nevertheless, the rest of the results from our other cards show that Carrizo is comprehensively out performed by Kaveri in every test. It's worth remembering that the Carrizo part only has PCIe 3.0 x8 available, but the difference is mostly likely to do with data transfer through the L2 caches.
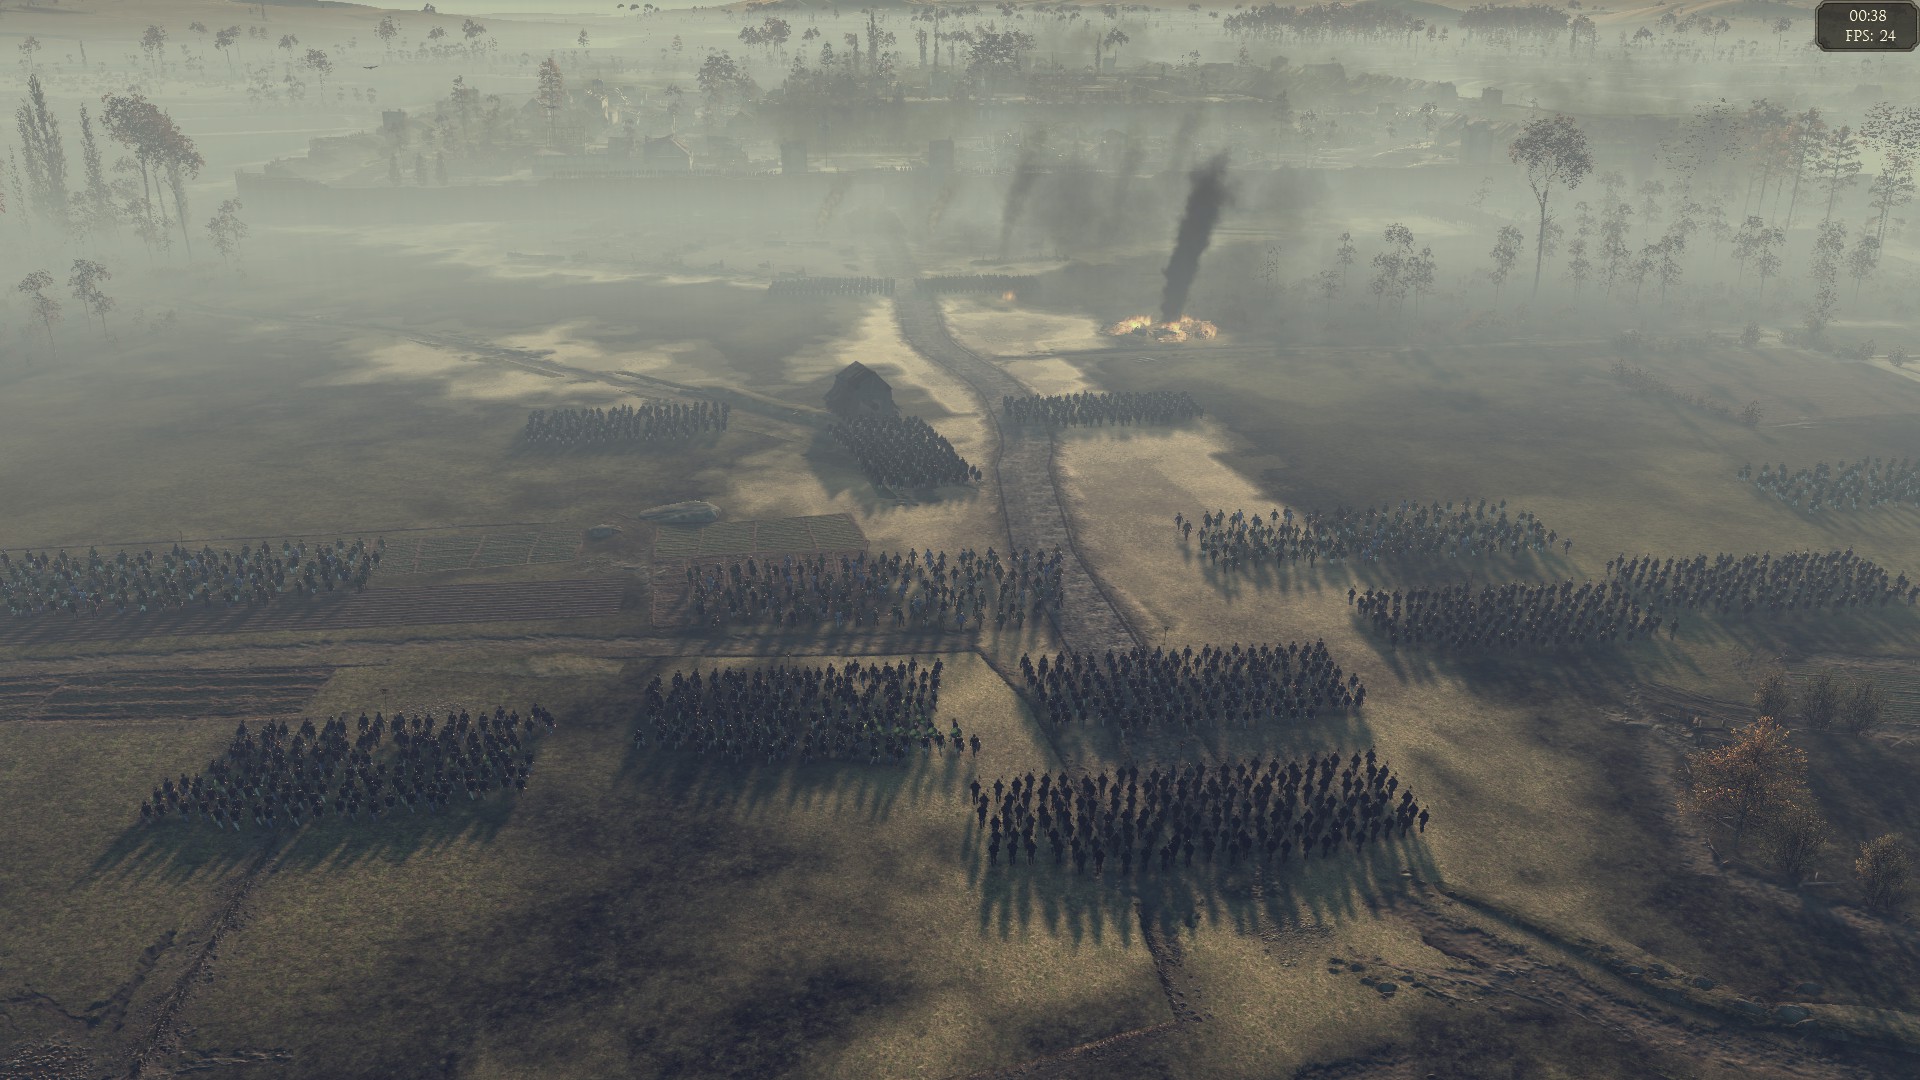
Total War: Attila at 3 GHz
The Total War franchise moves on to Attila, another The Creative Assembly development, and is a stand-alone strategy title set in 395AD where the main story line lets the gamer take control of the leader of the Huns in order to conquer parts of the world. Graphically the game can render hundreds/thousands of units on screen at once, all with their individual actions and can put some of the big cards to task. In our benchmark, the in-game scripted benchmark is used with the option for ‘unlimited video memory’ enabled.
For this test we used the following settings with our graphics cards:
| Total War: Attila Settings | |||
| Resolution | Quality | ||
| Low GPU | Integrated Graphics | 1280x720 | Performance |
| ASUS R7 240 1GB DDR3 | |||
| Medium GPU | MSI GTX 770 Lightning 2GB | 1920x1080 | Quality |
| MSI R9 285 Gaming 2G | |||
| High GPU | ASUS GTX 980 Strix 4GB | 1920x1080 | Quality |
| MSI R9 290X Gaming 4G | |||
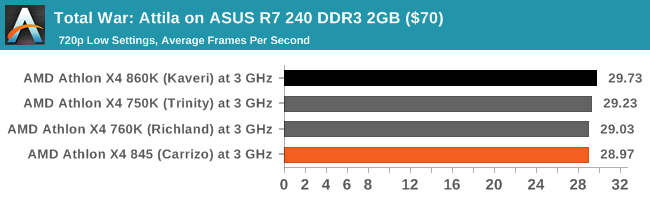


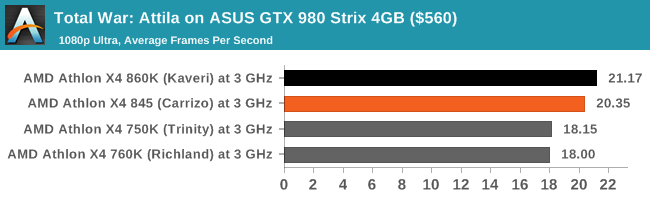
Again, similar to Alien Isolation, the Kaveri CPU takes the lead in all the tests with Carrizo being 3-4% behind.
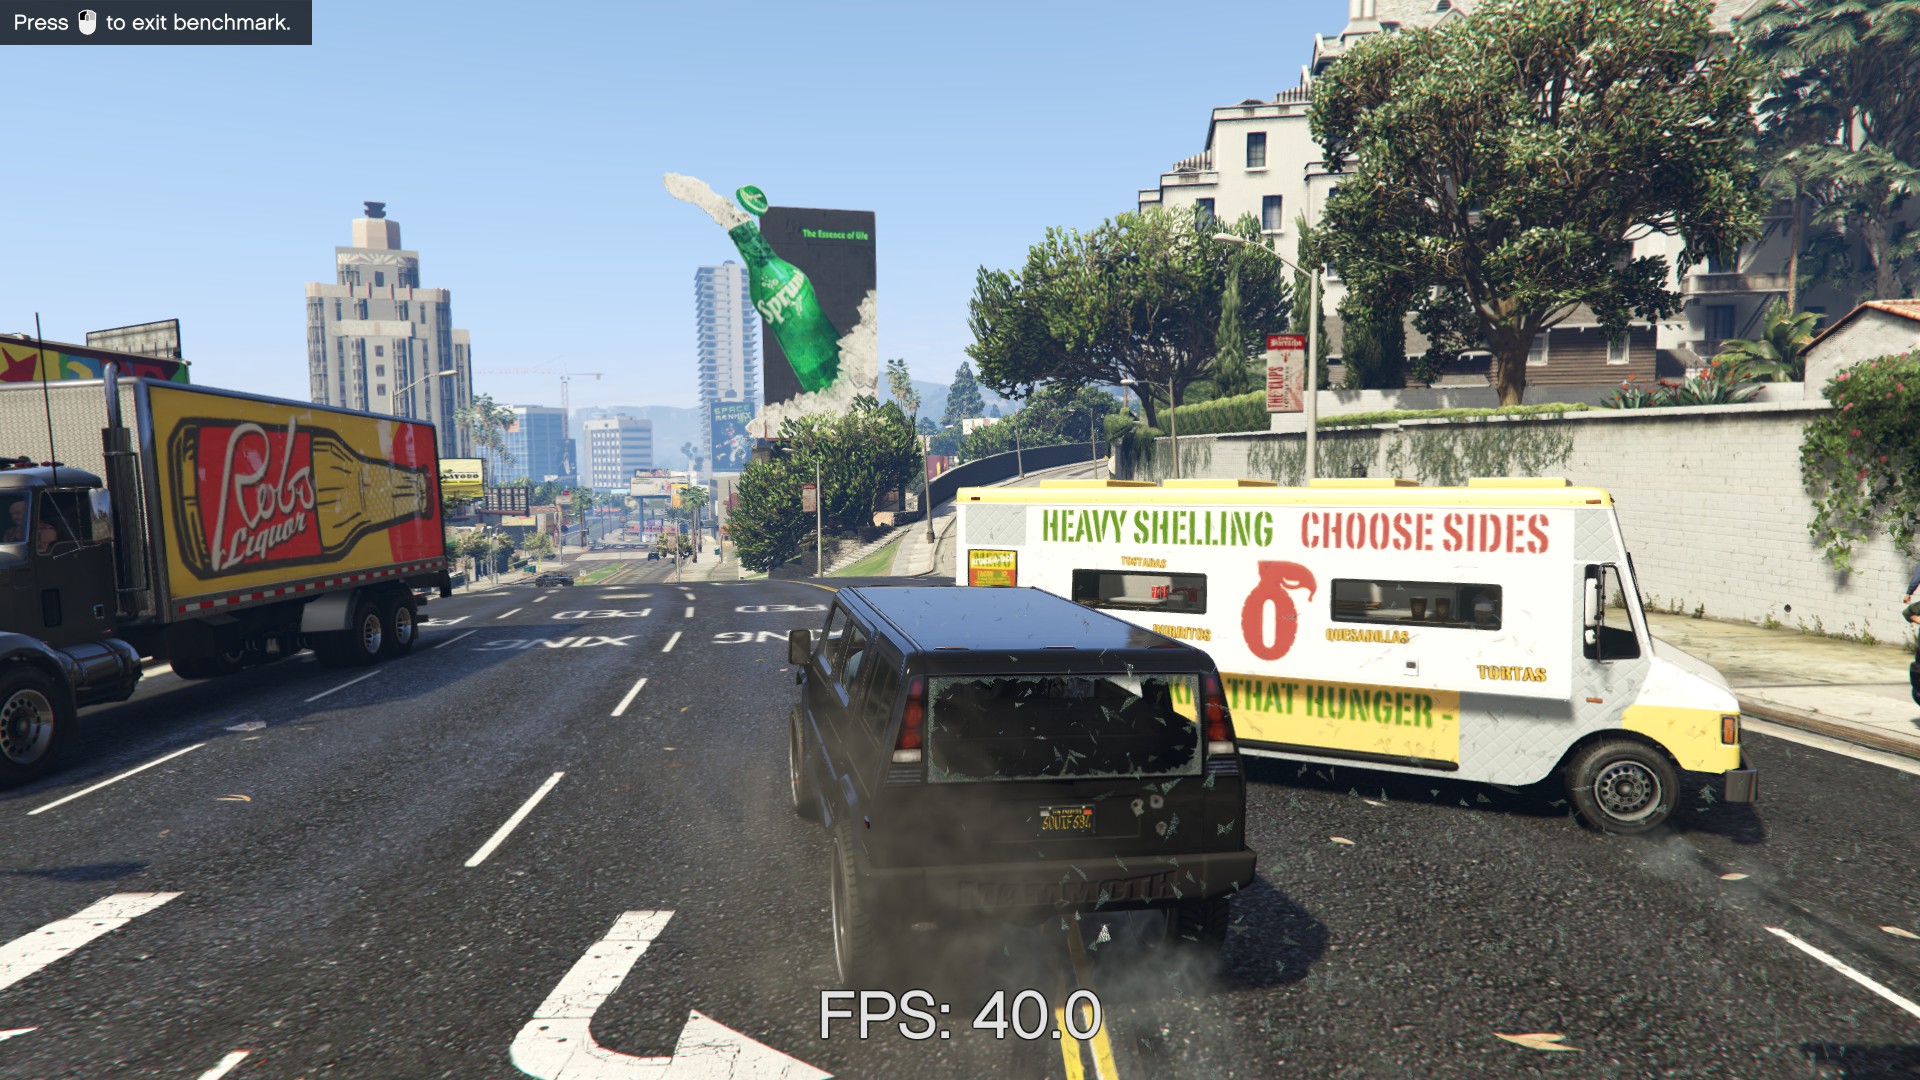
Grand Theft Auto V at 3 GHz
The highly anticipated iteration of the Grand Theft Auto franchise finally hit the shelves on April 14th 2015, with both AMD and NVIDIA in tow to help optimize the title. GTA doesn’t provide graphical presets, but opens up the options to users and extends the boundaries by pushing even the hardest systems to the limit using Rockstar’s Advanced Game Engine. Whether the user is flying high in the mountains with long draw distances or dealing with assorted trash in the city, when cranked up to maximum it creates stunning visuals but hard work for both the CPU and the GPU.
For our test we have scripted a version of the in-game benchmark, relying only on the final part which combines a flight scene along with an in-city drive-by followed by a tanker explosion. We record both the average frame rate and the percentage of frames under 60 FPS (16.6ms).
For this test we used the following settings with our graphics cards:
| Grand Theft Auto Settings | |||
| Resolution | Quality | ||
| Low GPU | Integrated Graphics | 1280x720 | Lowest |
| ASUS R7 240 1GB DDR3 | |||
| Medium GPU | MSI GTX 770 Lightning 2GB | 1920x1080 | Very High |
| MSI R9 285 Gaming 2G | |||
| High GPU | ASUS GTX 980 Strix 4GB | 1920x1080 | Very High |
| MSI R9 290X Gaming 4G | |||
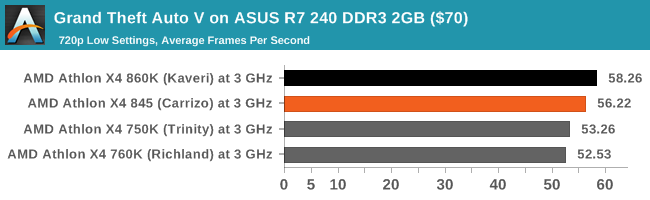
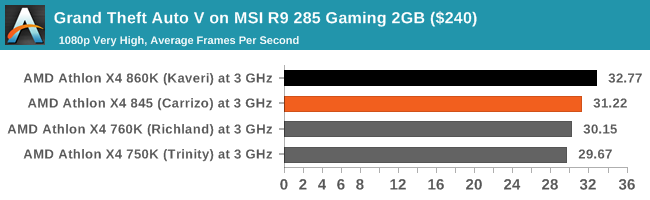
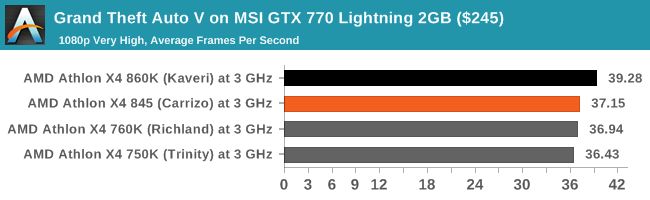
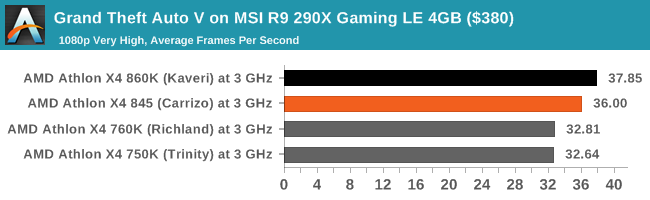

If we look purely at the average frame rates first, the same pattern as the other tests shows here. Carrizo sits between Kaveri and Trinity, anywhere from 3-7% behind Kaveri.
![Grand Theft Auto V on ASUS R7 240 DDR3 2GB ($70) [Under 60 FPS]](https://images.anandtech.com/graphs/graph10436/82553.png)
![Grand Theft Auto V on MSI R9 285 Gaming 2GB ($240) [Under 60 FPS]](https://images.anandtech.com/graphs/graph10436/82561.png)
![Grand Theft Auto V on MSI GTX 770 Lightning 2GB ($245) [Under 60 FPS]](https://images.anandtech.com/graphs/graph10436/82571.png)
![Grand Theft Auto V on ASUS GTX 980 Strix 4GB ($560) [Under 60 FPS]](https://images.anandtech.com/graphs/graph10436/82591.png)
If we compare the time spent under 60 FPS, again Kaveri takes the lead over Carrizo. The low end GPU is interesting, showing a good trend towards the newer microarchitectures, but still in favor of Kaveri with 4 MB of L2 cache over Carrizo with 2 MB of L2.
GRID: Autosport at 3 GHz
No graphics tests are complete without some input from Codemasters and the EGO engine, which means for this round of testing we point towards GRID: Autosport, the next iteration in the GRID and racing genre. As with our previous racing testing, each update to the engine aims to add in effects, reflections, detail and realism, with Codemasters making ‘authenticity’ a main focal point for this version.
GRID’s benchmark mode is very flexible, and as a result we created a test race using a shortened version of the Red Bull Ring with twelve cars doing two laps. The car is focus starts last and is quite fast, but usually finishes second or third. Both the average and minimum frame rates are recorded.
For this test we used the following settings with our graphics cards:
| GRID: Autosport Settings | |||
| Resolution | Quality | ||
| Low GPU | Integrated Graphics | 1920x1080 | Medium |
| ASUS R7 240 1GB DDR3 | |||
| Medium GPU | MSI GTX 770 Lightning 2GB | 1920x1080 | Maximum |
| MSI R9 285 Gaming 2G | |||
| High GPU | ASUS GTX 980 Strix 4GB | 1920x1080 | Maximum |
| MSI R9 290X Gaming 4G | |||
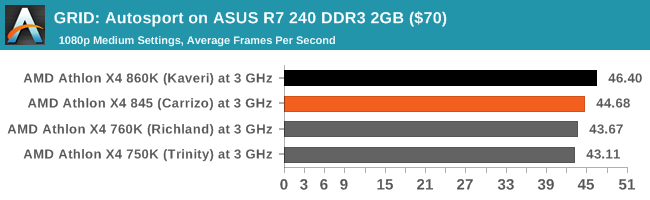


The EGO engine typically shows off any small changes in hardware configuration, which can be a good thing, and similar to the other tests the average frame rates favor Kaveri.
![GRID: Autosport on ASUS R7 240 DDR3 2GB ($70) [Minimum FPS]](https://images.anandtech.com/graphs/graph10436/82555.png)
![GRID: Autosport on MSI R9 285 Gaming 2GB ($240) [Minimum FPS]](https://images.anandtech.com/graphs/graph10436/82563.png)
![GRID: Autosport on MSI GTX 770 Lightning 2GB ($245) [Minimum FPS]](https://images.anandtech.com/graphs/graph10436/82573.png)
![GRID: Autosport on MSI R9 290X Gaming LE 4GB ($380) [Minimum FPS]](https://images.anandtech.com/graphs/graph10436/82583.png)
![GRID: Autosport on ASUS GTX 980 Strix 4GB ($560) [Minimum FPS]](https://images.anandtech.com/graphs/graph10436/82593.png)
Minimum frame rates show a similar story. It's interesting to note that on our AMD cards, the R9 285 and R9 290X, both Carrizo and Kaveri push the minimum frame rates from below 30 to above 30, despite the fact that the AMD cards seem to have a poor showing for GRID (at least at 3 GHz).
Middle-Earth: Shadows of Mordor at 3 GHz
The final title in our testing is another battle of system performance with the open world action-adventure title, Shadows of Mordor. Produced by Monolith using the LithTech Jupiter EX engine and numerous detail add-ons, SoM goes for detail and complexity to a large extent, despite having to be cut down from the original plans. The main story itself was written by the same writer as Red Dead Redemption, and it received Zero Punctuation’s Game of The Year in 2014.
For testing purposes, SoM gives a dynamic screen resolution setting, allowing us to render at high resolutions that are then scaled down to the monitor. As a result, we get several tests using the in-game benchmark, taking results as the average and minimum frame rates.
For this test we used the following settings with our graphics cards:
| Shadow of Mordor Settings | |||
| Resolution | Quality | ||
| Low GPU | Integrated Graphics | 1280x720 | Low |
| ASUS R7 240 1GB DDR3 | |||
| Medium GPU | MSI GTX 770 Lightning 2GB | 1920x1080 | Ultra |
| MSI R9 285 Gaming 2G | |||
| High GPU | ASUS GTX 980 Strix 4GB | 1920x1080 3840x2160 |
Ultra Ultra |
| MSI R9 290X Gaming 4G | |||

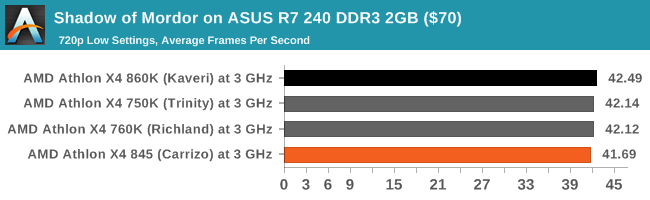
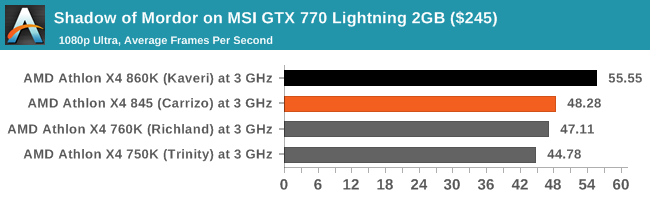
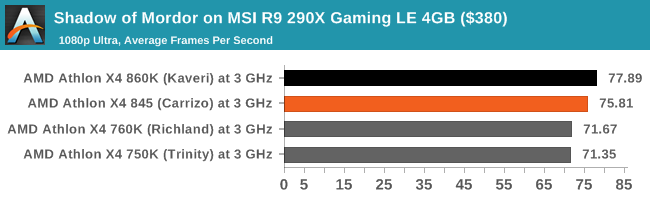
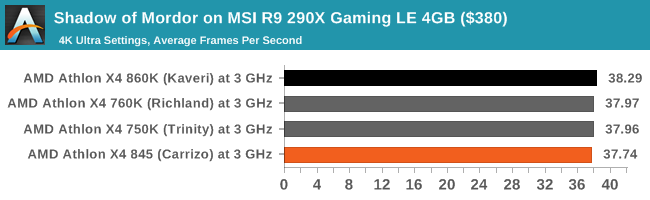
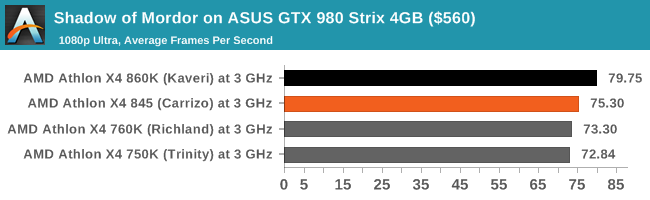
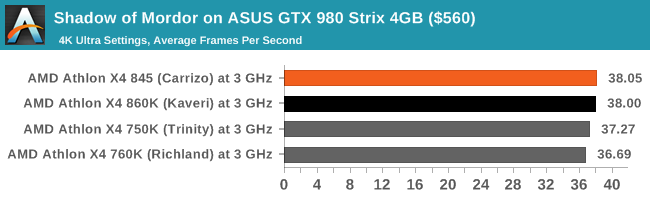
Carrizo takes miniture solace here in that it beats the Kaveri CPU at 4K with a GTX 980, albeit within the margin of error. SoM typically performs very similar no matter the processor, especially on NVIDIA cards. We haven't included the R9 285 results, as there seems to have been a recent update pushing values 30% higher than expected for the Kaveri on this GPU, and given the results trend it would seem to be more than simply L2 or PCIe lane difference, especially to the Trinity/Richland parts.
Analyzing Generational Updates
Going through the benchmark data for our Carrizo part compared to Kaveri, Richland and Trinity gives two very different sides of the same story. Simply put, it would come across that Carrizo is overall better at CPU tasks when you compare clock for clock, but performs worse when a discrete graphics card is in play for gaming. There are some slight exceptions for both sides of this story, especially when larger memory accesses comes in, but this comes down to the design choices when Carrizo for desktop was made. The fact that we have a laptop CPU in desktop clothing is going to be a main detractor when it comes to gaming, but the CPU compute side of the equation is very promising indeed.
In our generational testing, we compared the following four processors at 3 GHz and running the highest supported JEDEC memory speeds for each:
| AMD CPUs | ||||||||||||
| µArch / Core |
Cores | Base Turbo |
TDP | DDR3 | L1 (I) Cache |
L1 (D) Cache |
L2 Cache |
|||||
| Athlon X4 845 |
Excavator Carrizo |
4 | 3500 3800 |
65 W | 2133 | 192KB 3-way |
128KB 8-way |
2 MB 16-way |
||||
| Athlon X4 860K |
Steamroller Kaveri |
4 | 3700 4000 |
95 W | 1866 | 192KB 3-way |
64KB 4-way |
4 MB 16-way |
||||
| Athlon X4 760K |
Piledriver.v2 Richland |
4 | 3800 4100 |
100 W | 1866 | 128KB 2-way |
64KB 4-way |
4 MB 16-way |
||||
| Athlon X4 750K |
Piledriver Trinity |
4 | 3400 4000 |
100 W | 1866 | 128KB 2-way |
64KB 4-way |
4 MB 16-way |
||||
It is worth noting that for the most part the X4 750K and X4 760K are essentially equal, using a slightly modified Piledriver v2 microarchitecture for the X4 760K that in most cases performs similarly to the other processor at the same frequency. This will come through in almost all of our benchmark comparisons. However, the main battle will be between the top two.
Comparing the Upgrade: 2012 to 2016
Our results are going to be compared in two different ways. Firstly, we are going to look at the absolute improvement of each processor compared to the lowest one in the test: Trinity. This gives a direct analysis of the performance increase per clock total increase for every generation from 2012 to 2016. What follows is a series of graphs for each of our benchmark sections showing the results of each benchmark as a percentage improvement over Trinity. We'll analyze each one in turn.
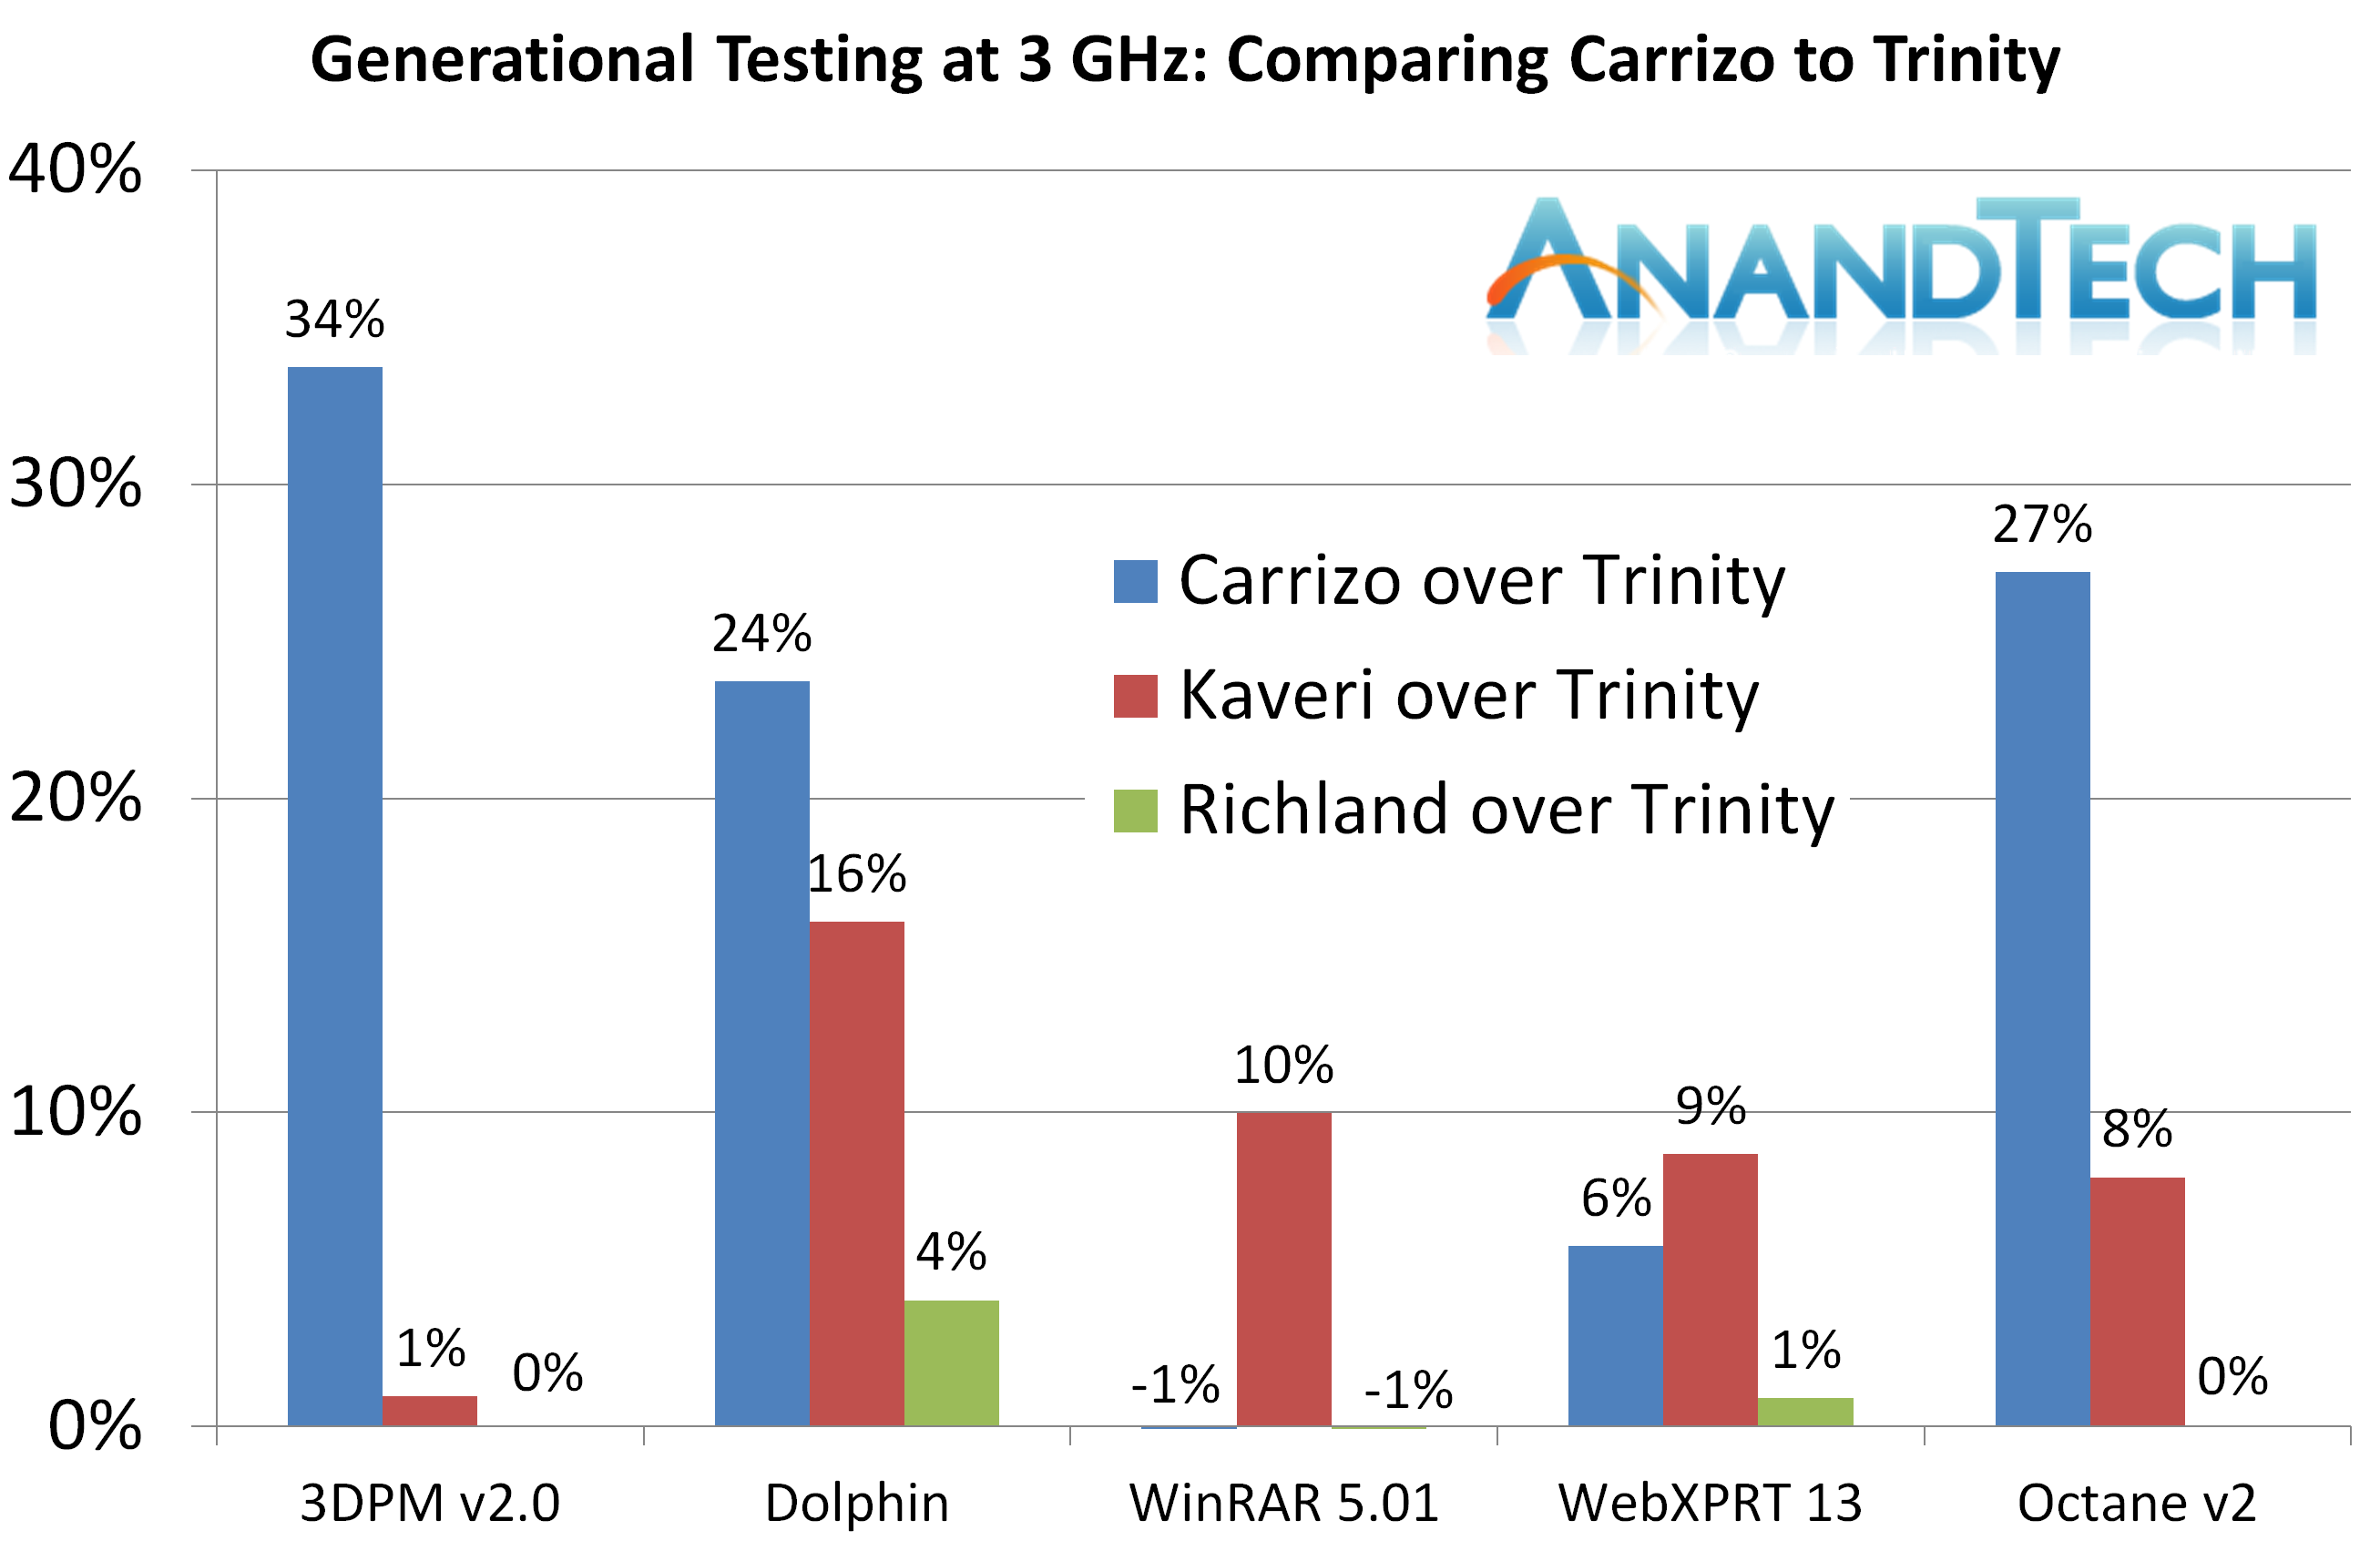
From our Real World benchmarks, Carrizo gets a good showing in three of the benchmarks, showing a sizeable jump over Kaveri, however WinRAR and WebXPRT are a little lower.
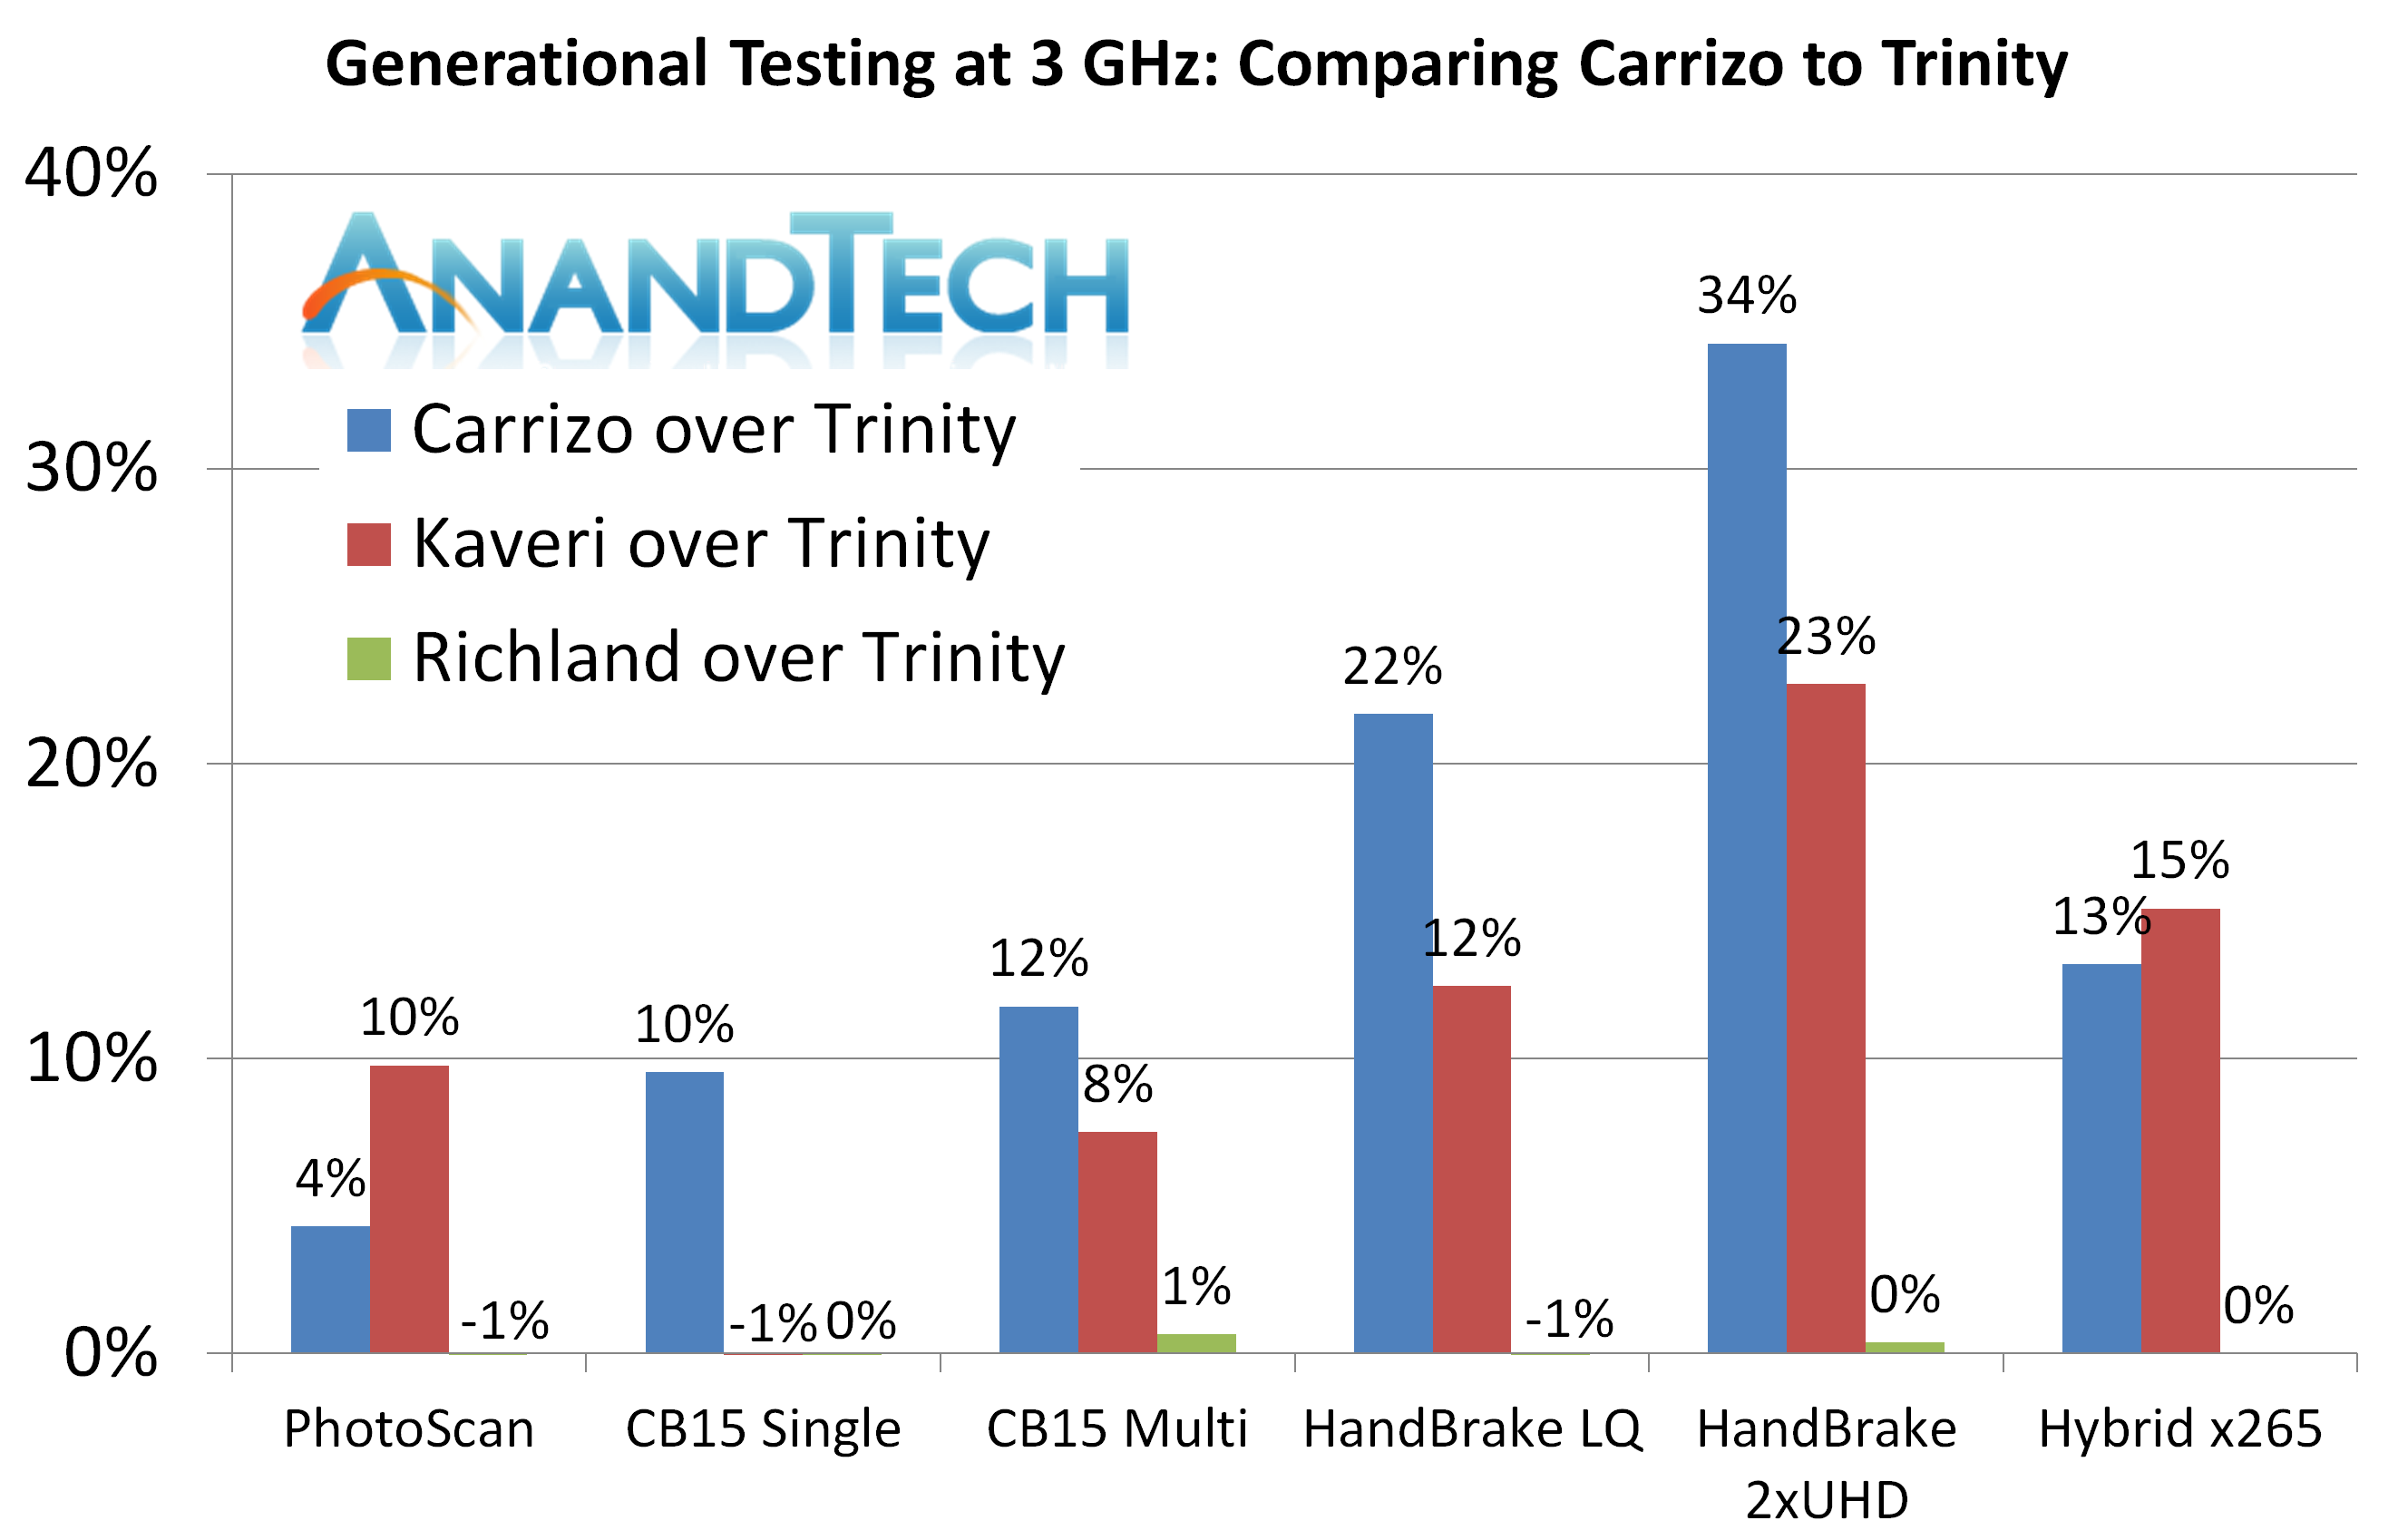
For the office tests, Carrizo takes the biggest gain for CineBench and Handbrake, but sits behind in Photoscan and Hybrid. HandBrake shows a sizable gain in both tests compared to Trinity.
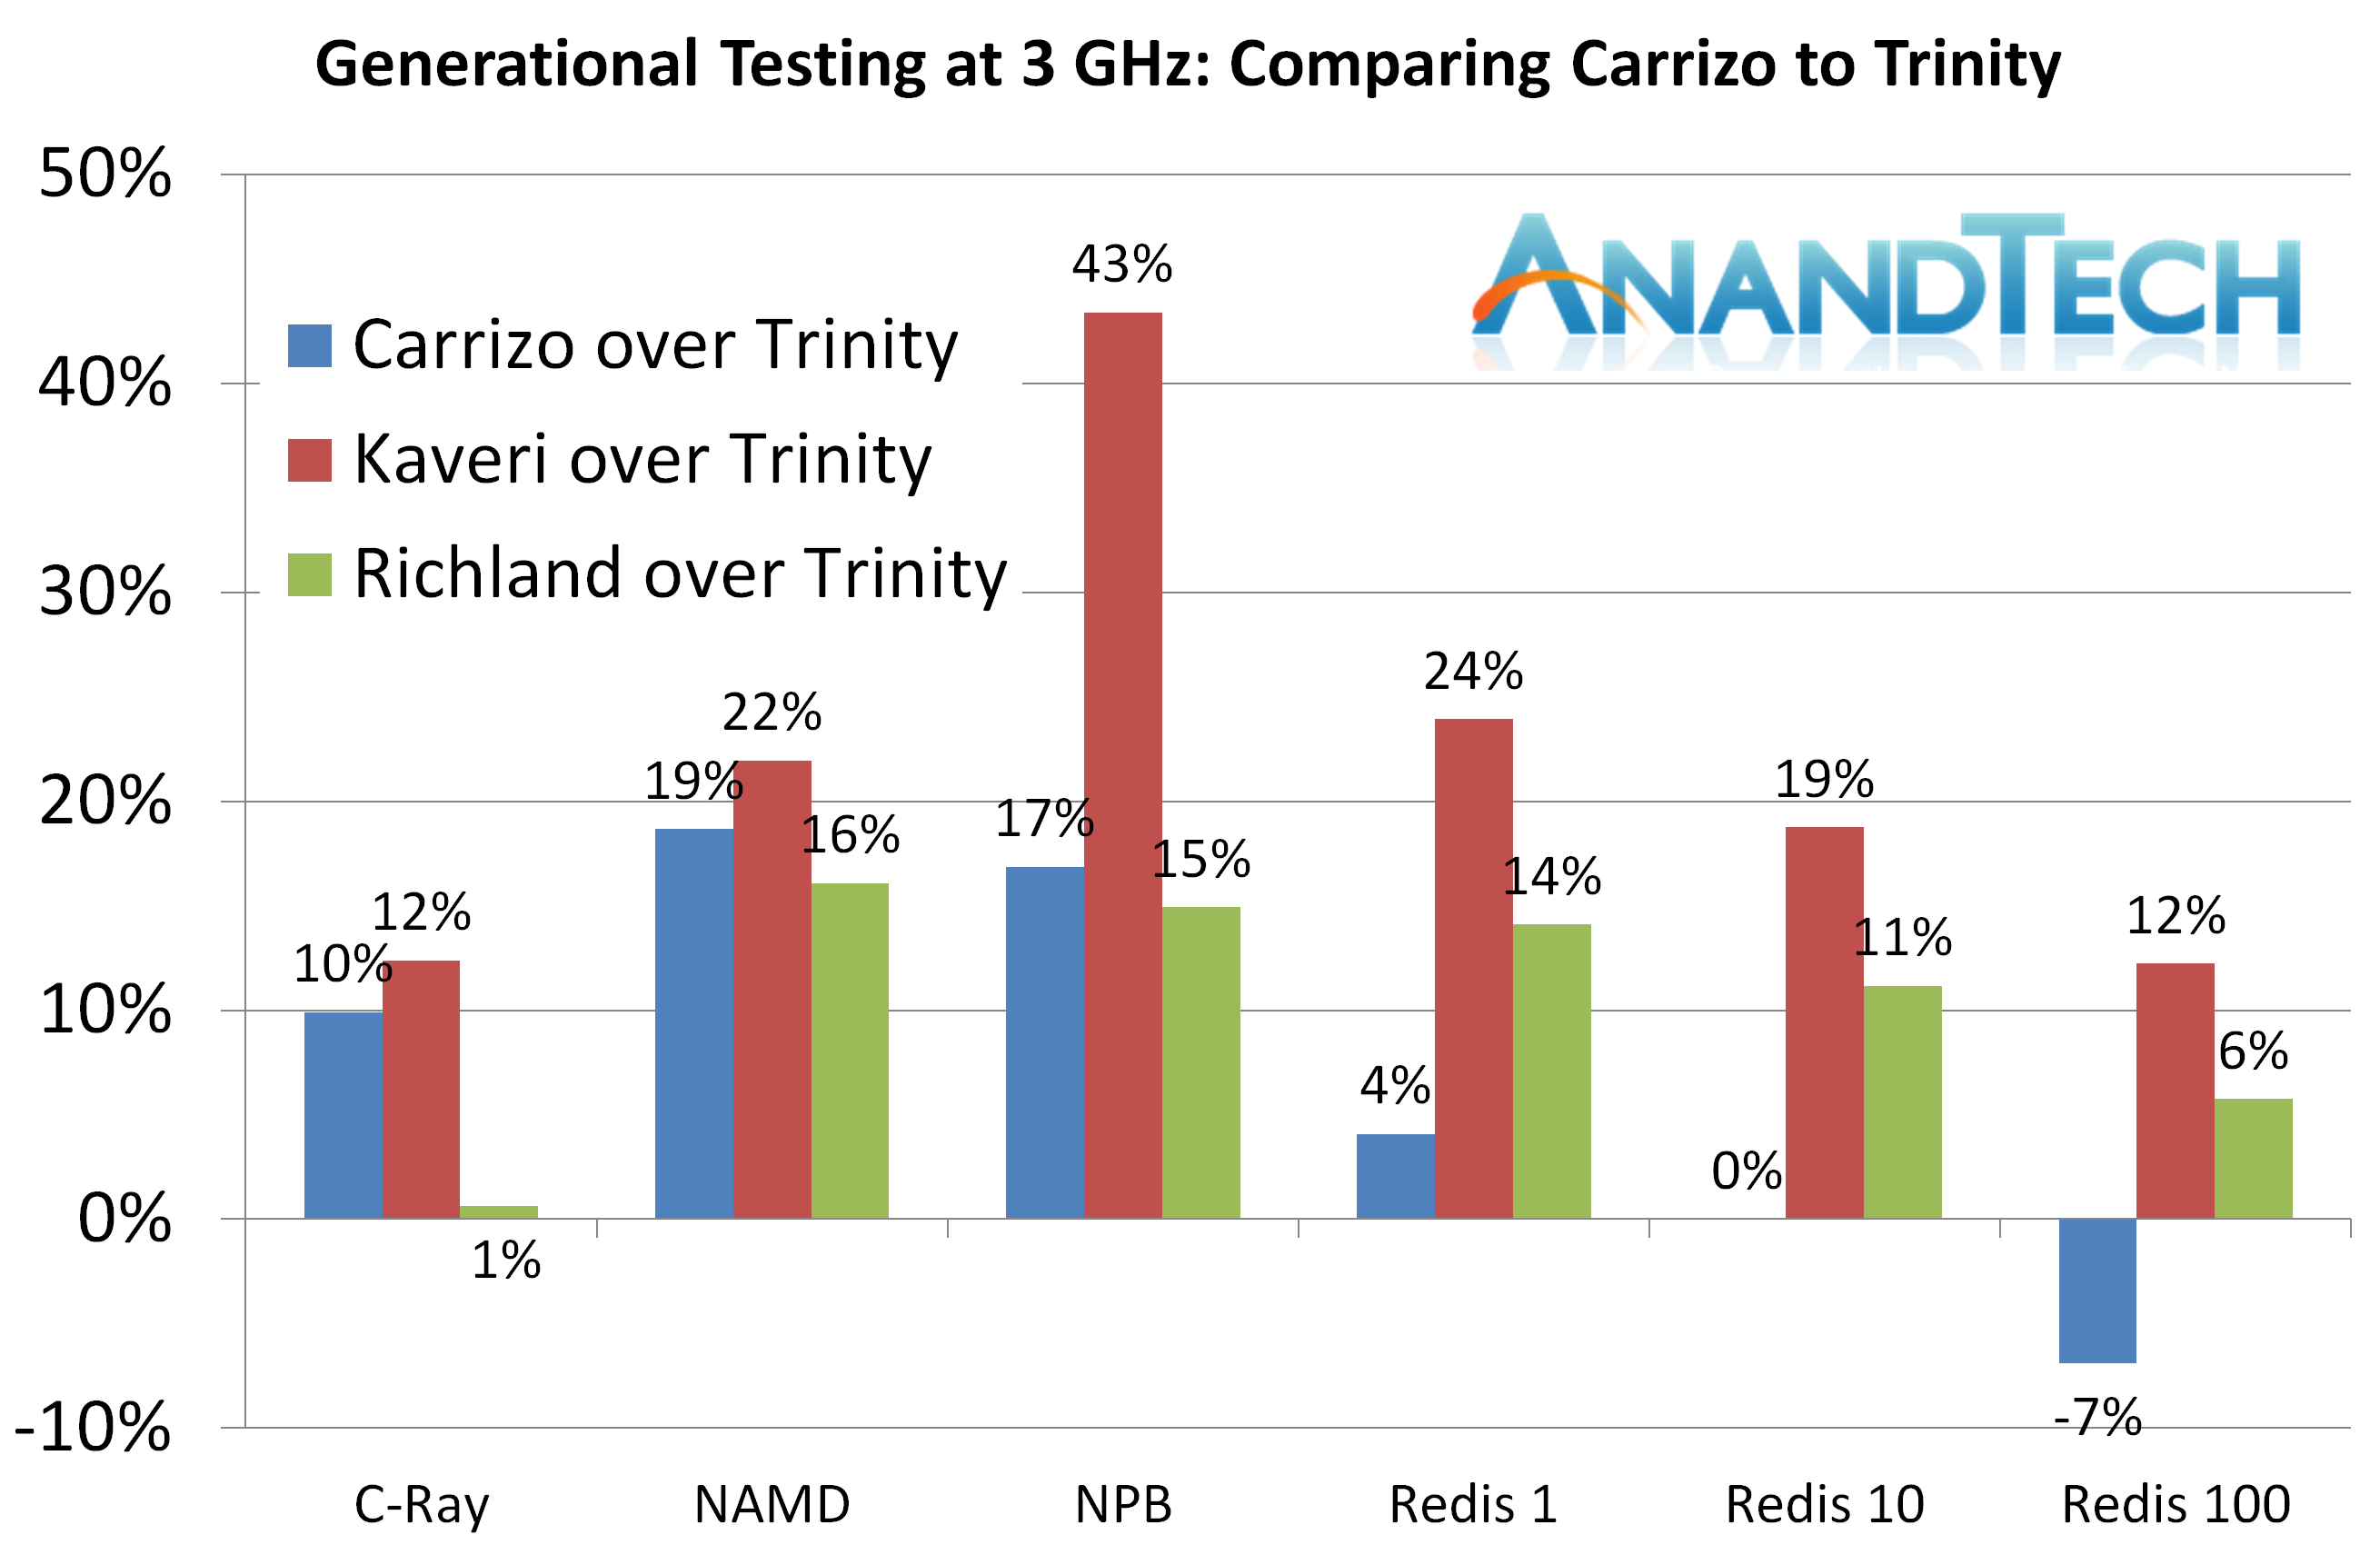
The Linux-Bench tests shows Carrizo behind Kaveri in each instance, and behind Richland for all three Redis tests. As we explained in that section, Redis is very memory dependent and as a result, despite having the larger L1 cache, only having 2 MB of L2 cache is a blow to the Carrizo part.
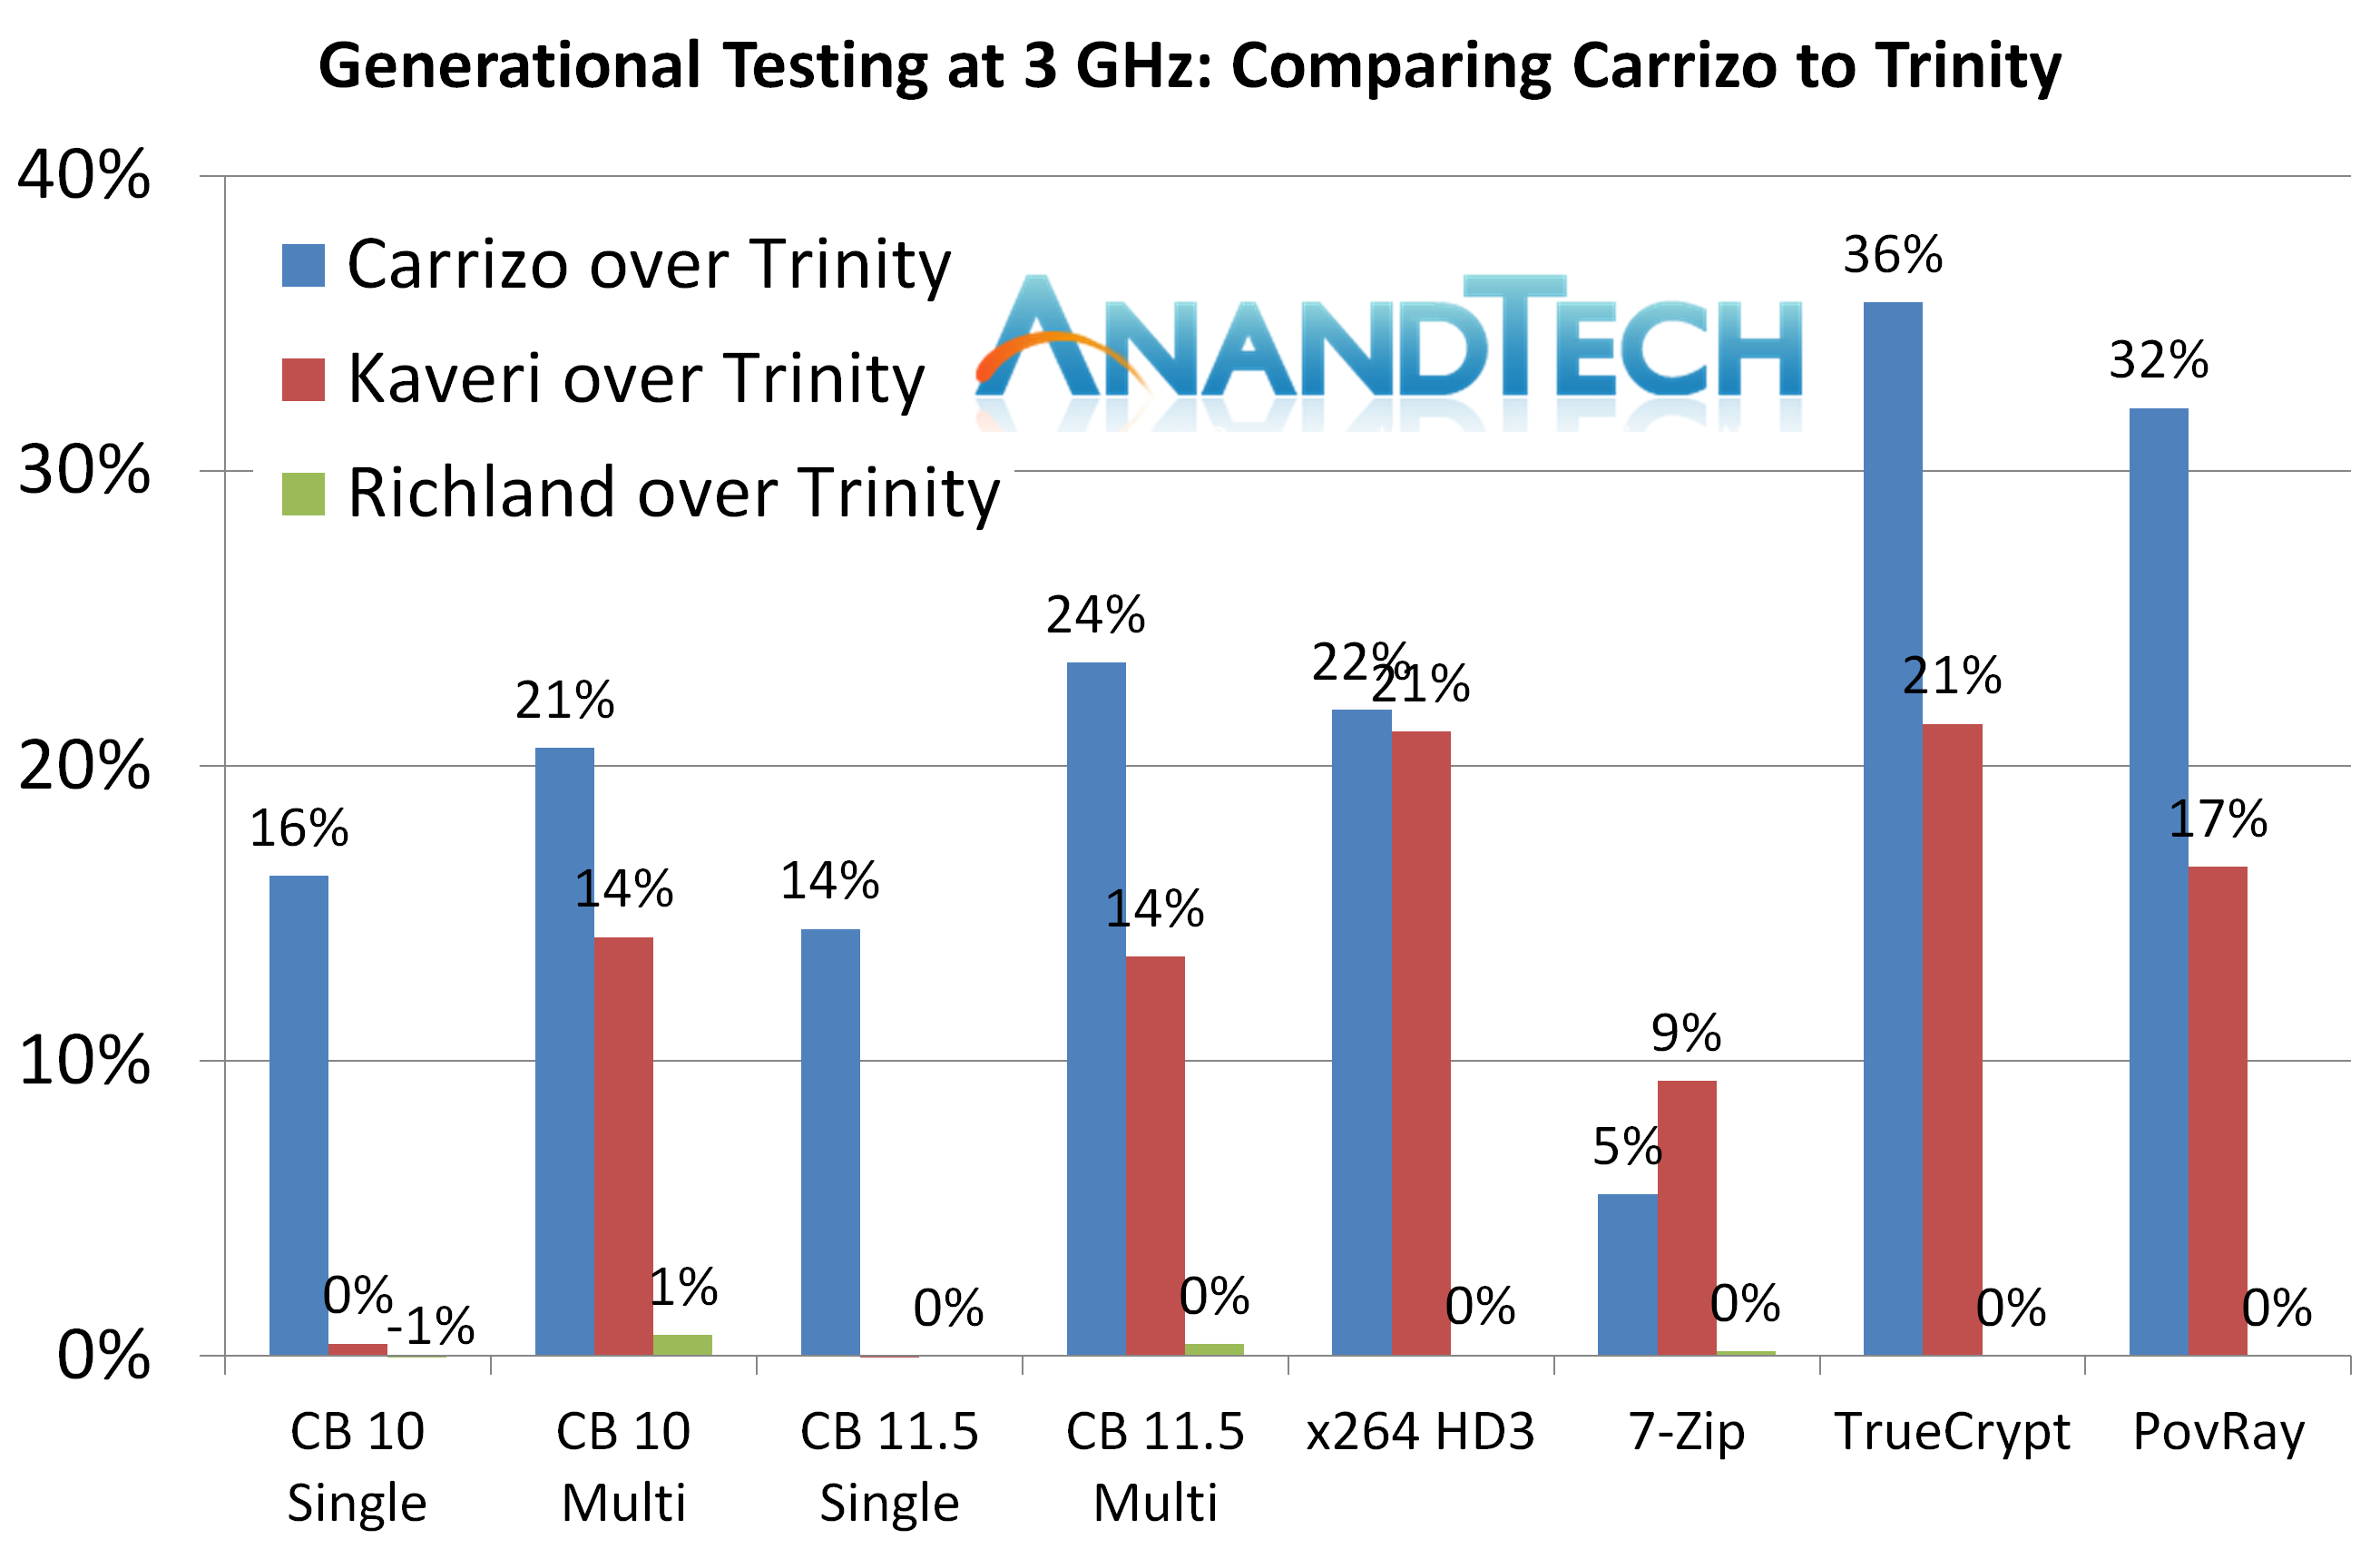
So here is where it is interesting. If you were only looking at synthetic and legacy tests in isolation, like many other review websites do, then you could be forgiven that it shows Carrizo taking a distinct lead in every benchmark (except 7-zip). In many cases there is a 10-20% gain over Kaveri.
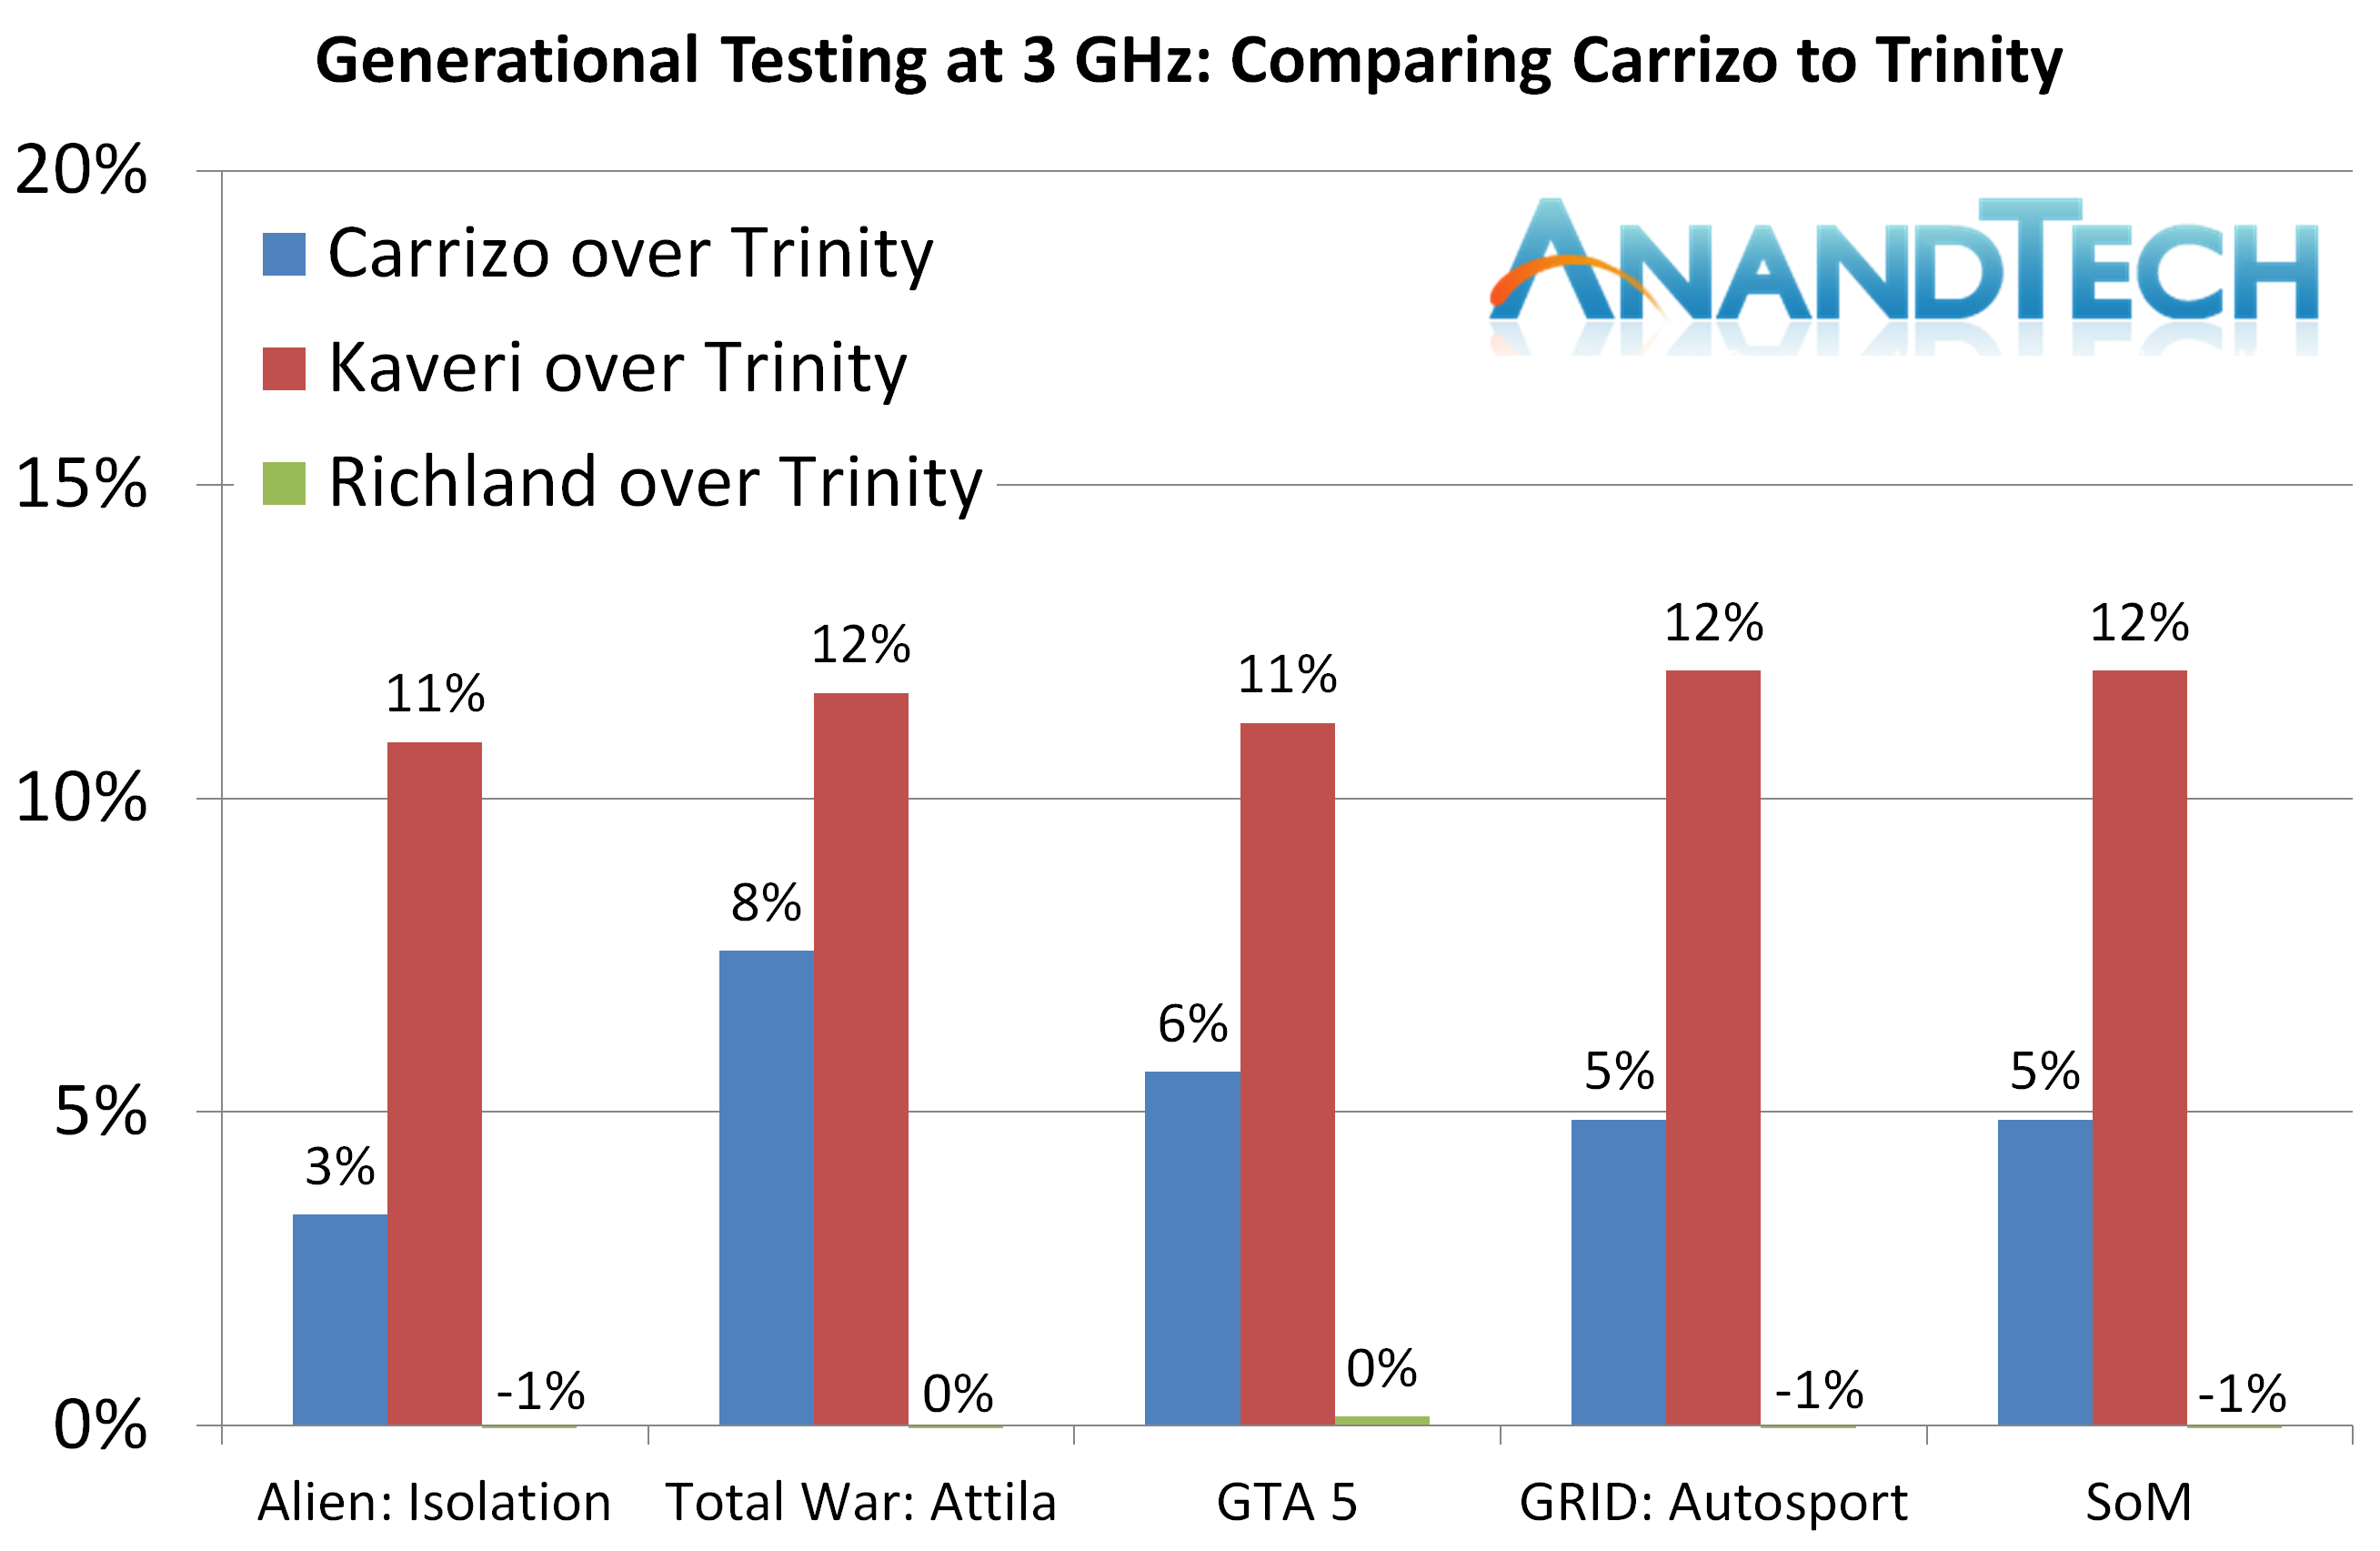
For gaming, as explained in the testing, despite the improvement over Trinity that Carrizo offers, the deficit to Kaveri is consistent across the board.
Comparing IPC
Next, we have the generational updates moving from Trinity to Richland to Kaveri to Carrizo. This is where we typically expect to see single-digit percentage increases moving through the generations, with double digits for large gains or introduction of new IP blocks into the silicon (e.g. encryption or video conversion). Again, we go through each of our five benchmark sections for this.
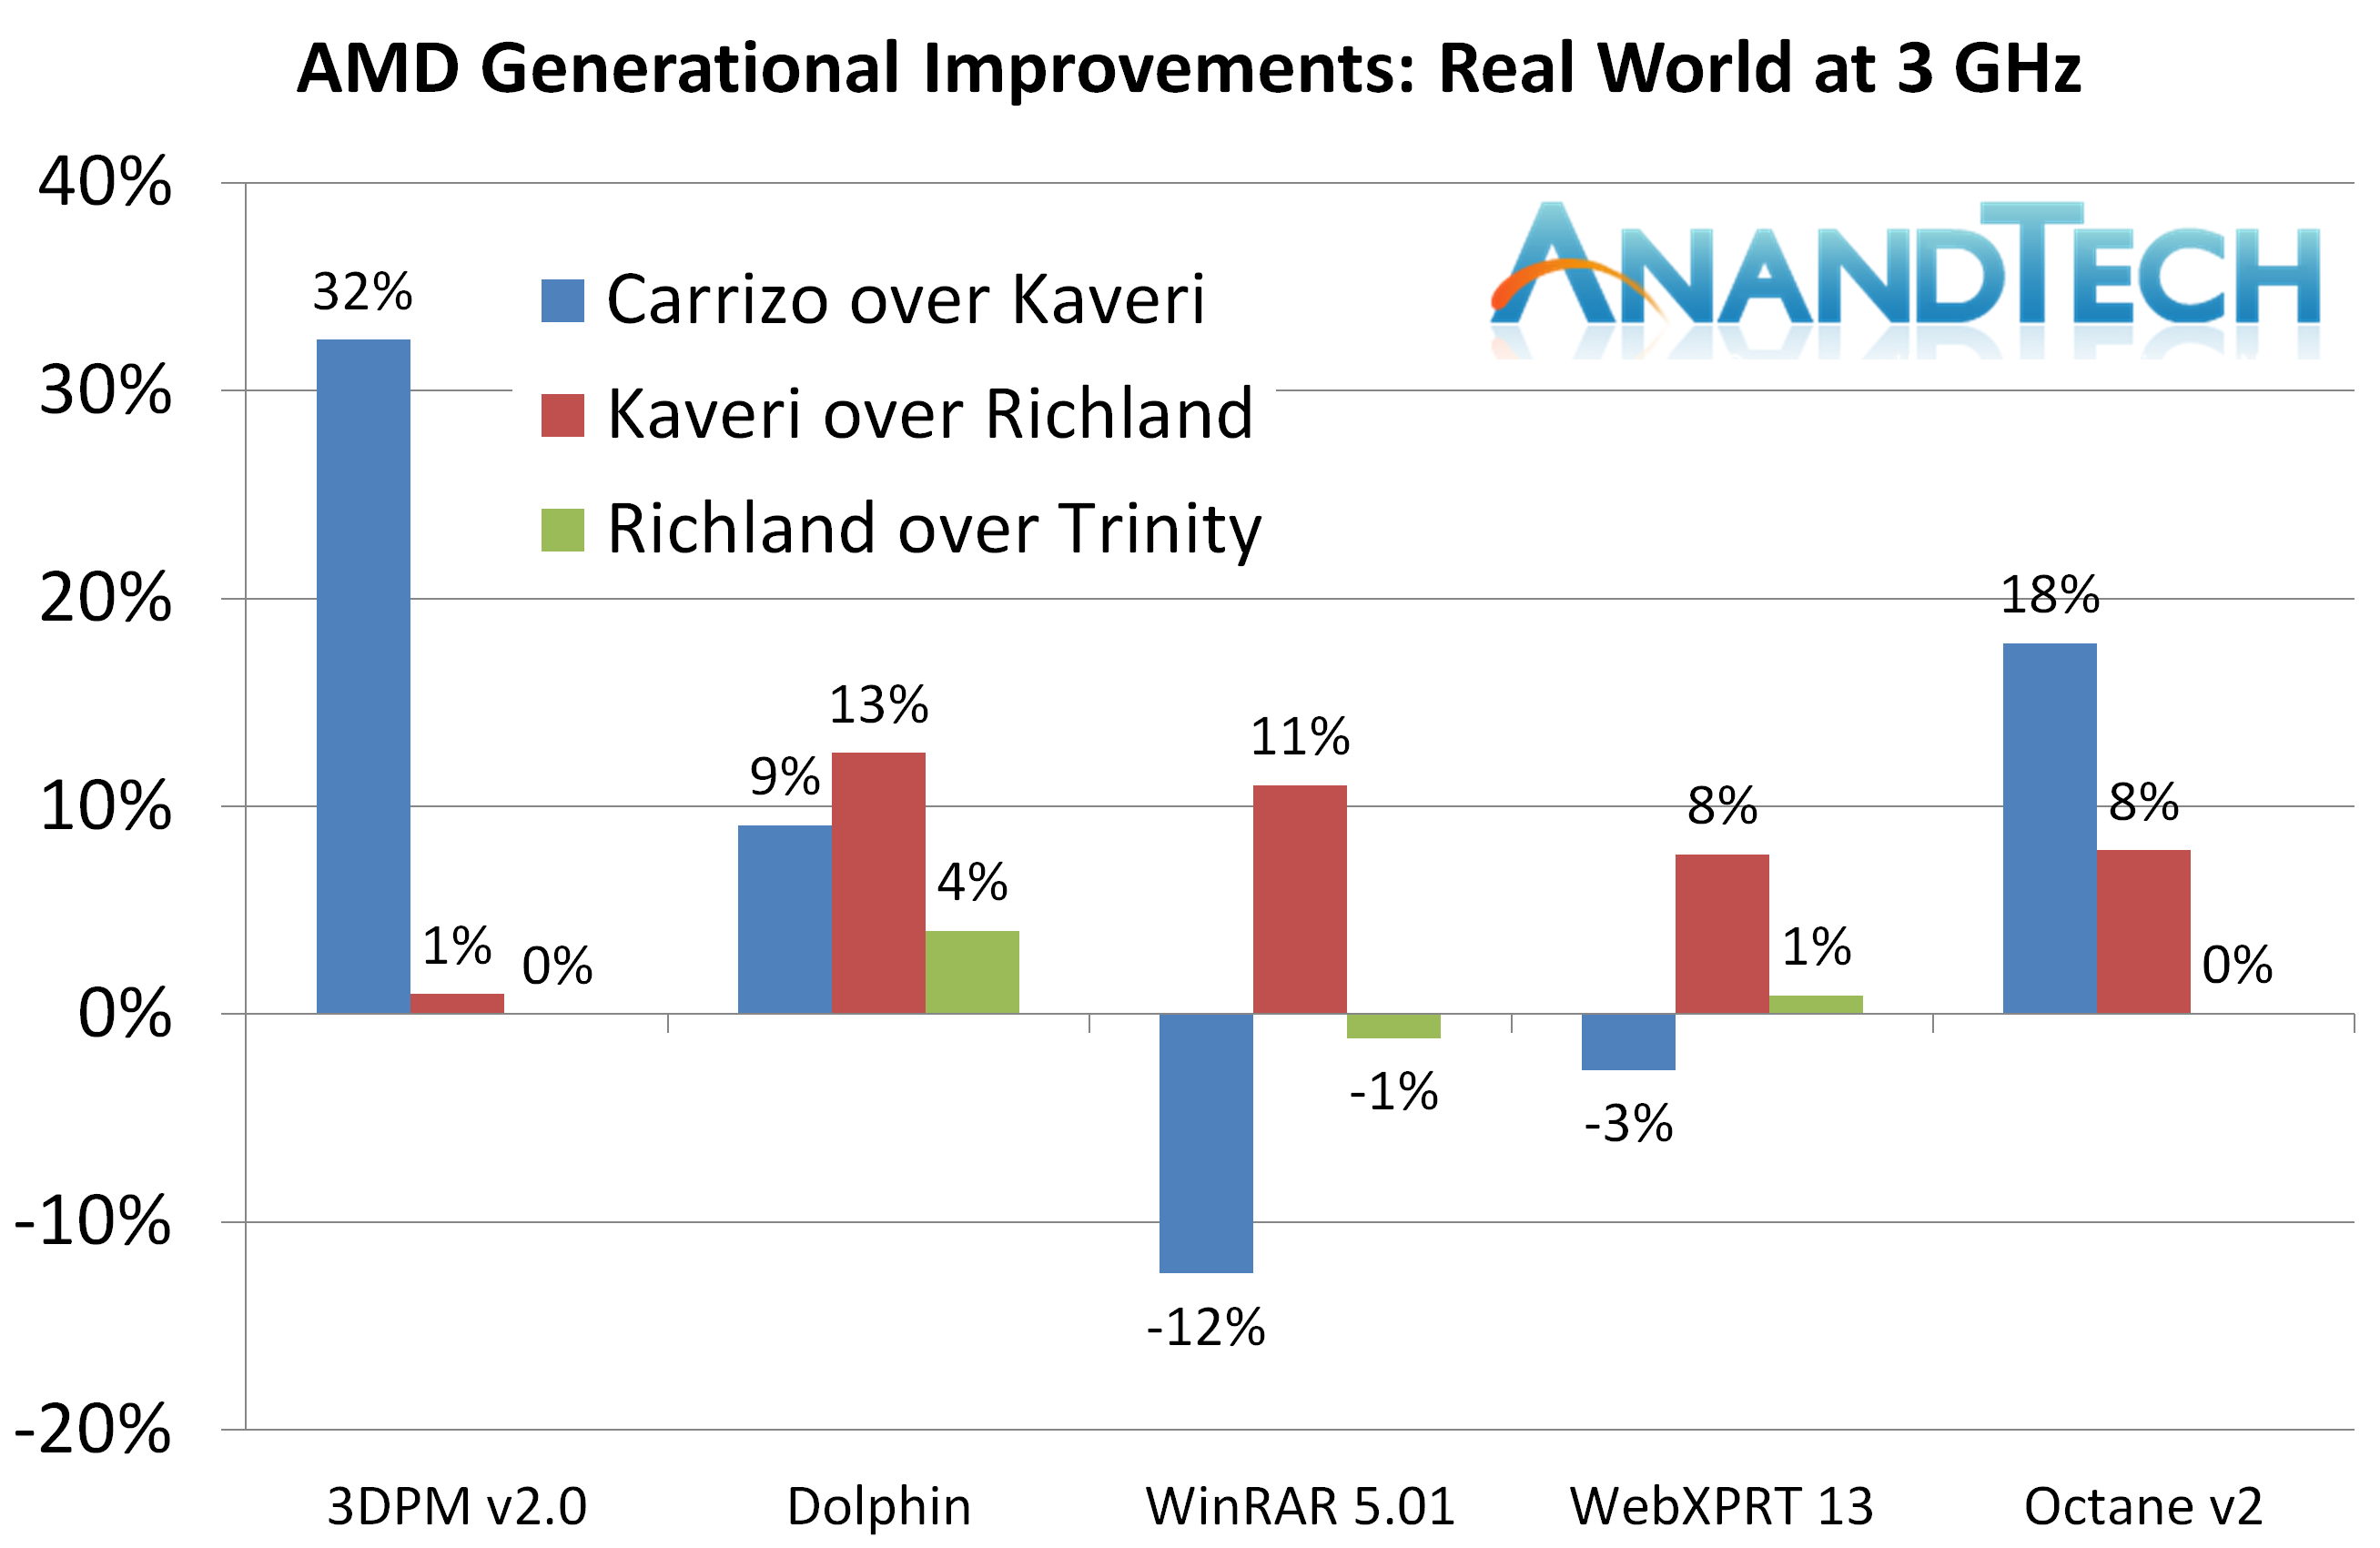
3DPM v2 takes the biggest gain, a massive 32% over Kaveri, due to better memory management and a larger L1 cache. WinRAR, being memory dependent, loses due to the smaller L2.
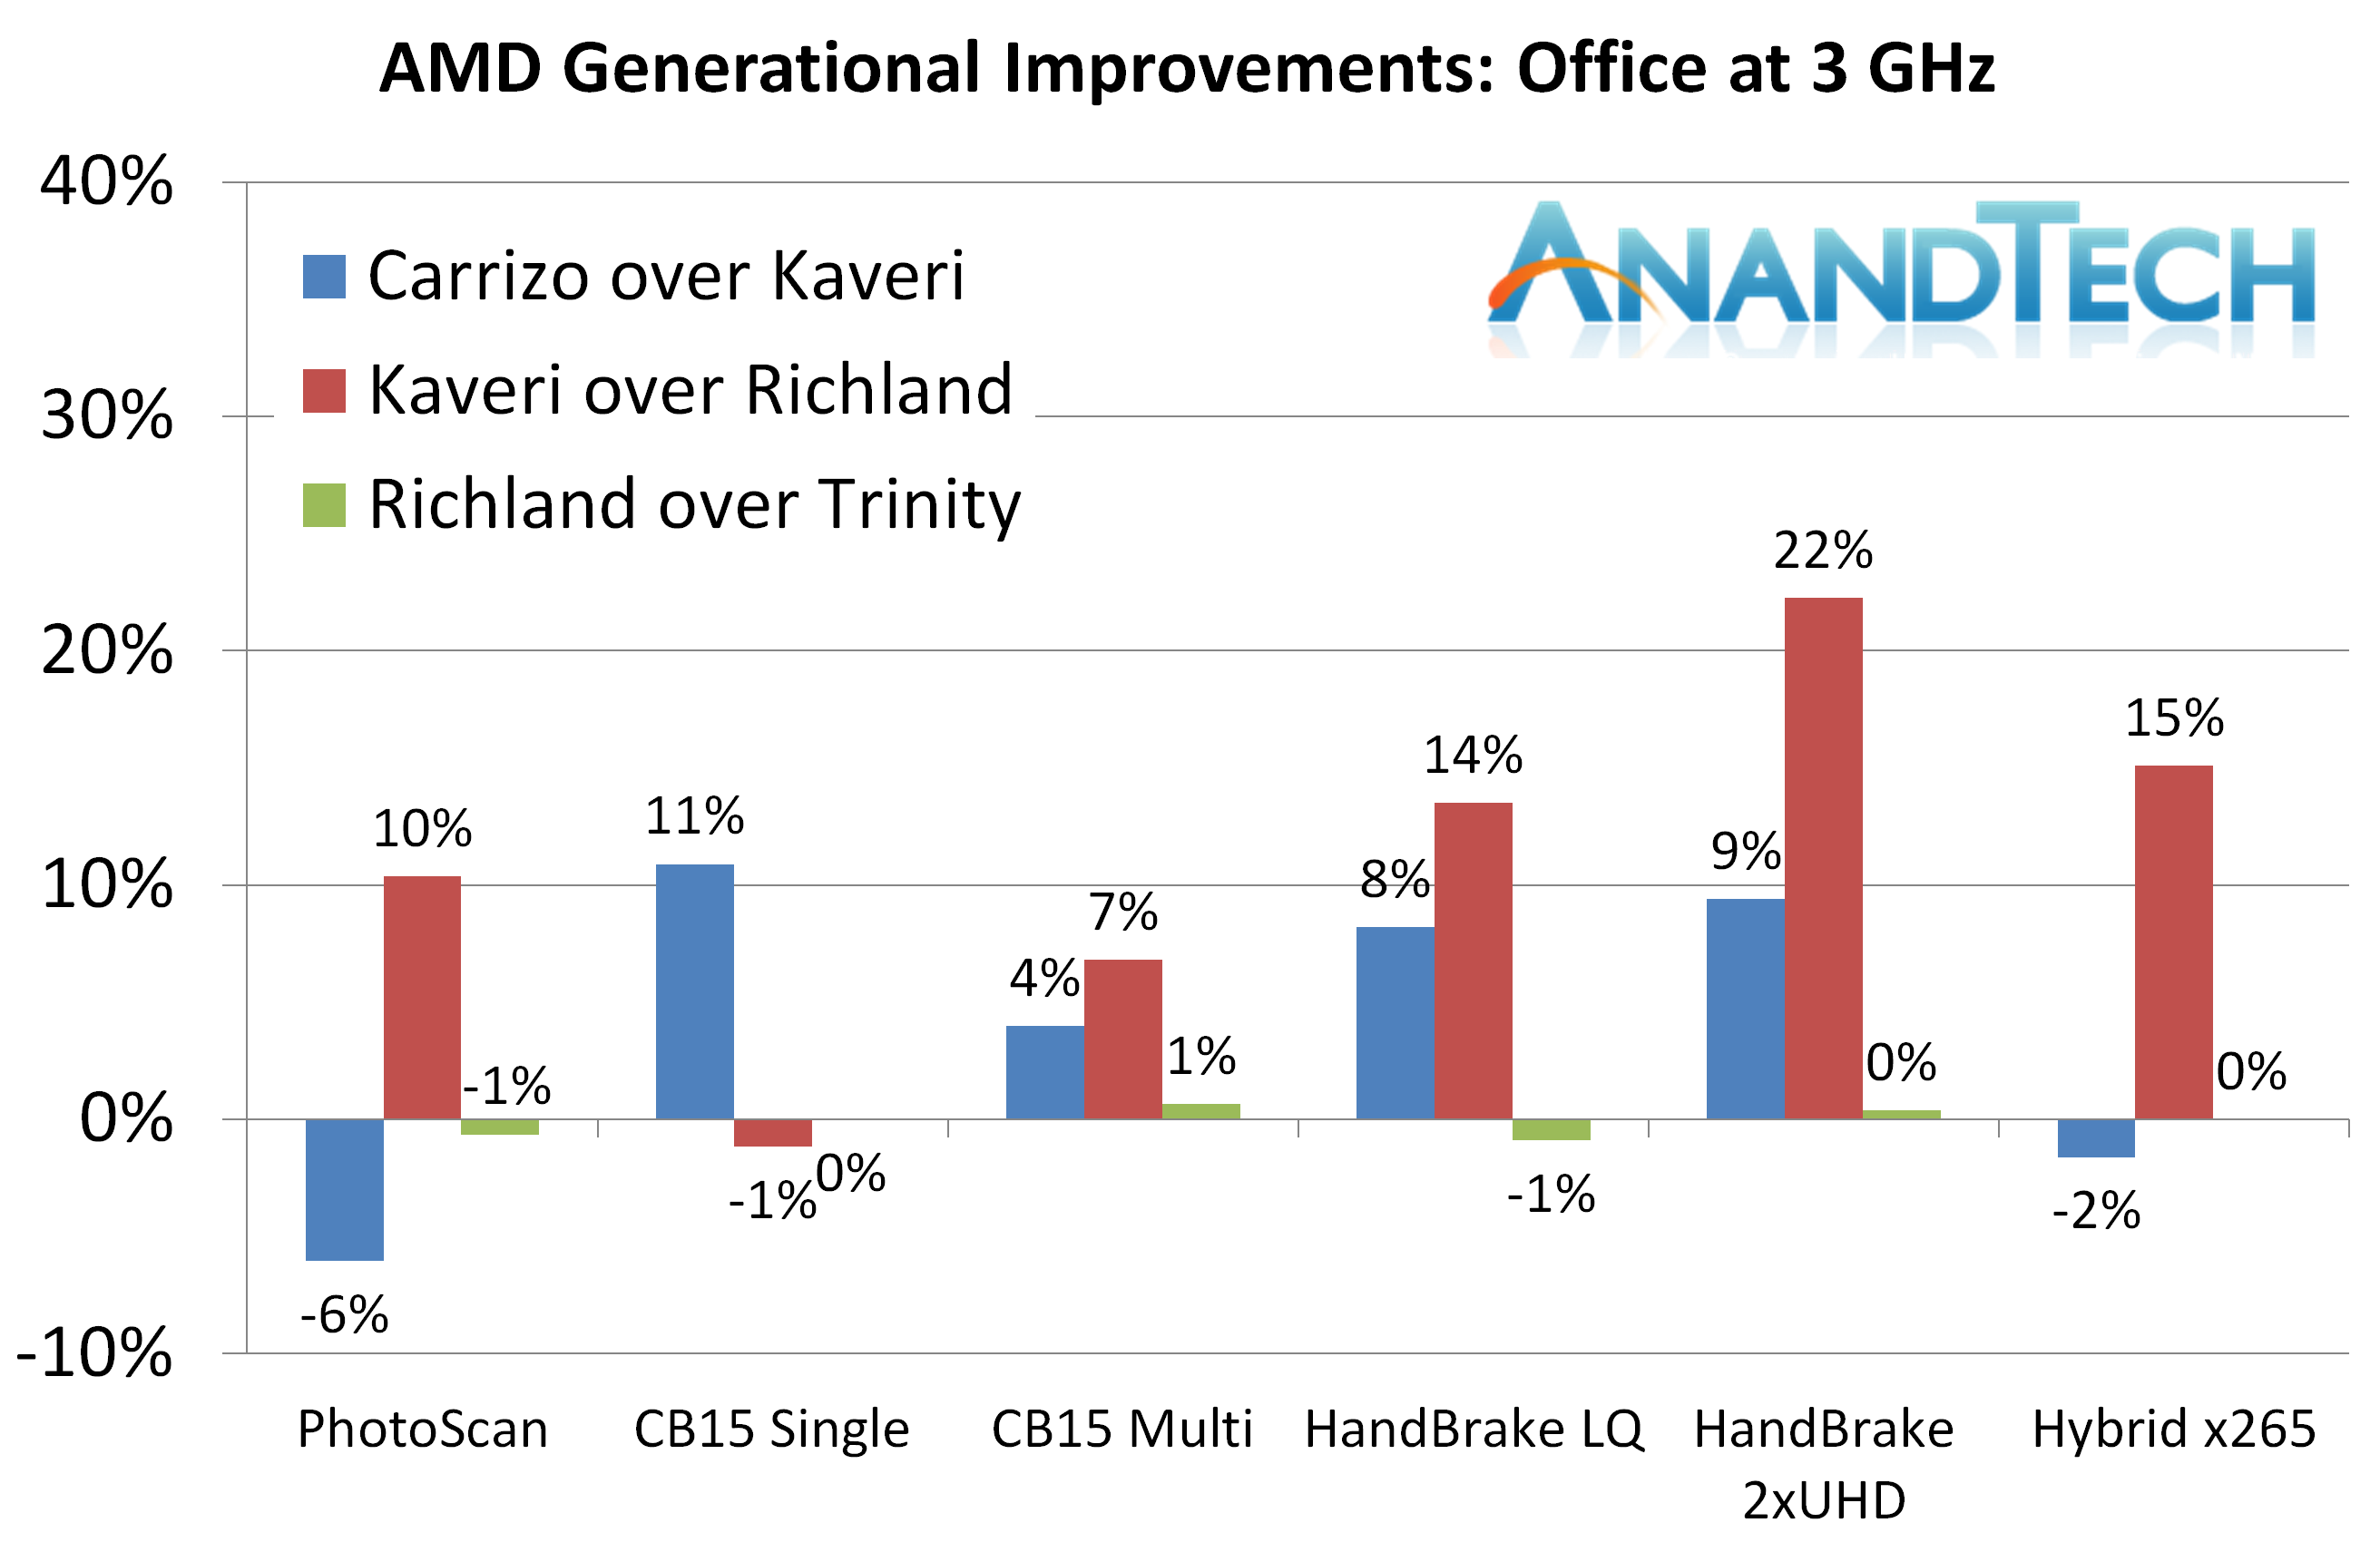
The office tests are a mixed bag - we see a regression in Photoscan due to large memory accesses, but it is clear that Kaveri was a bigger jump for a number of things than Carrizo.
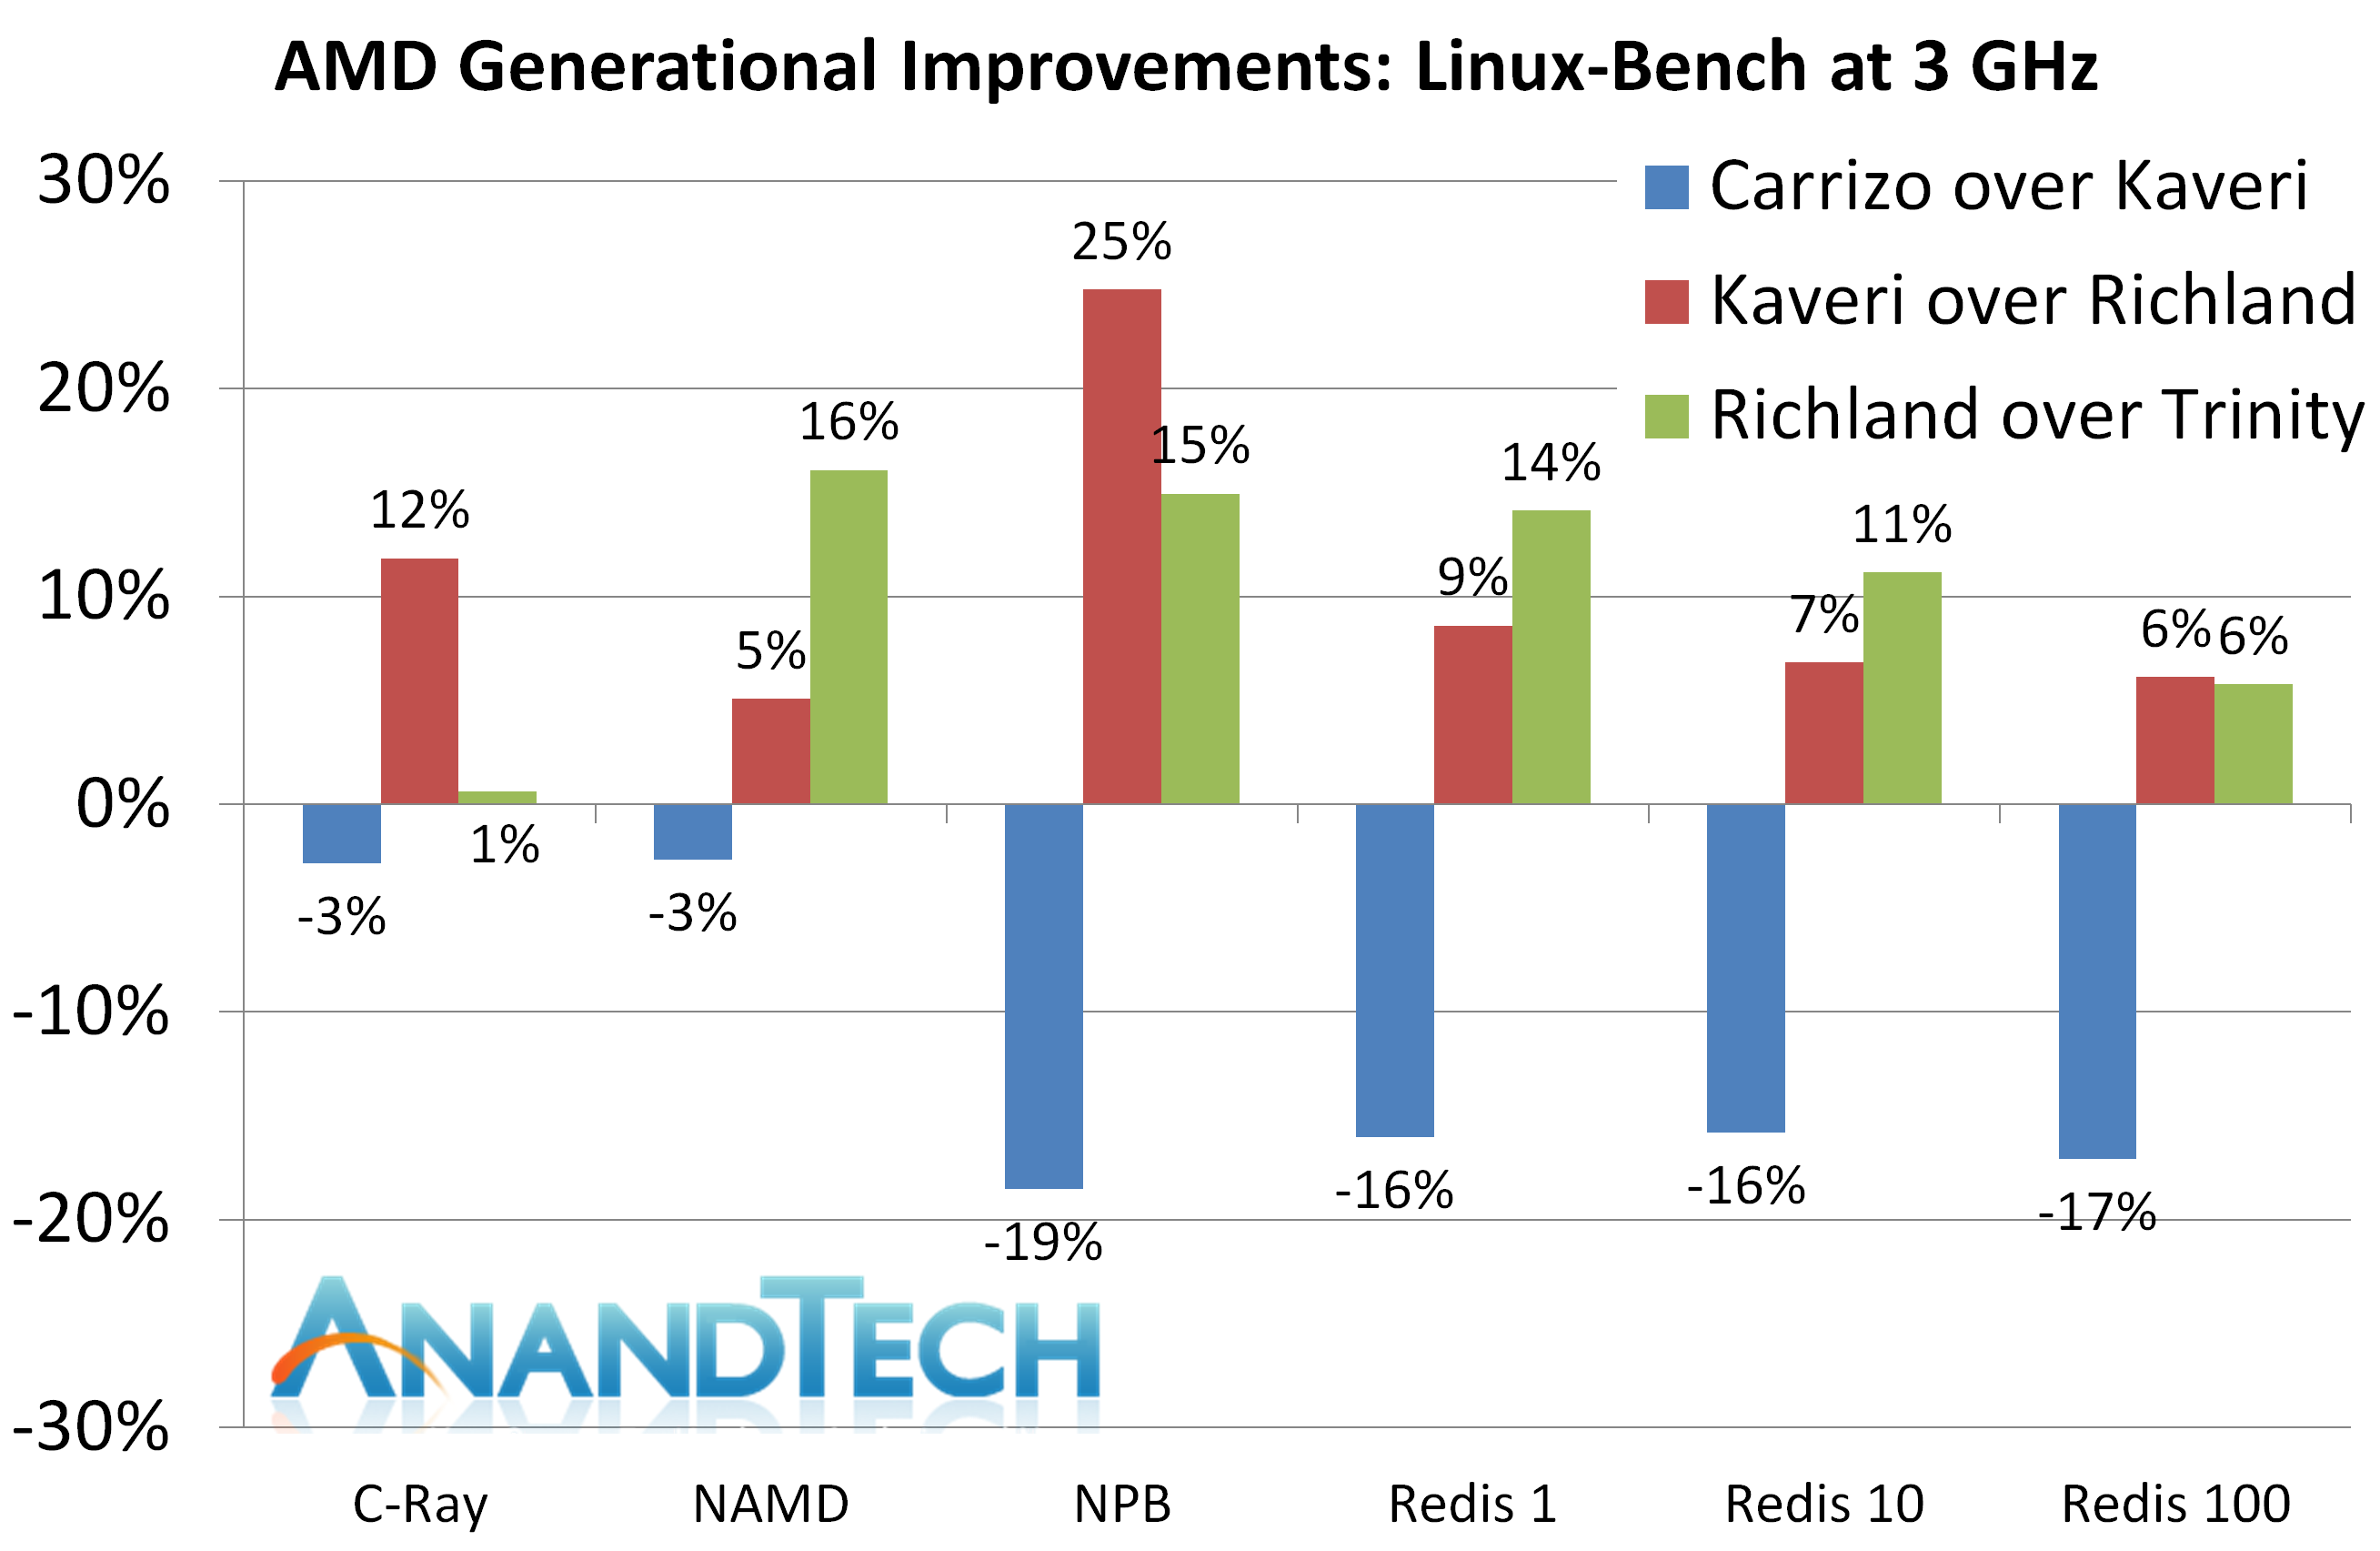
Our Linux tests get a poor showing across the board from Carrizo, which we saw in the results. In each case, the IPC for Carrizo is lower than that of Kaveri.
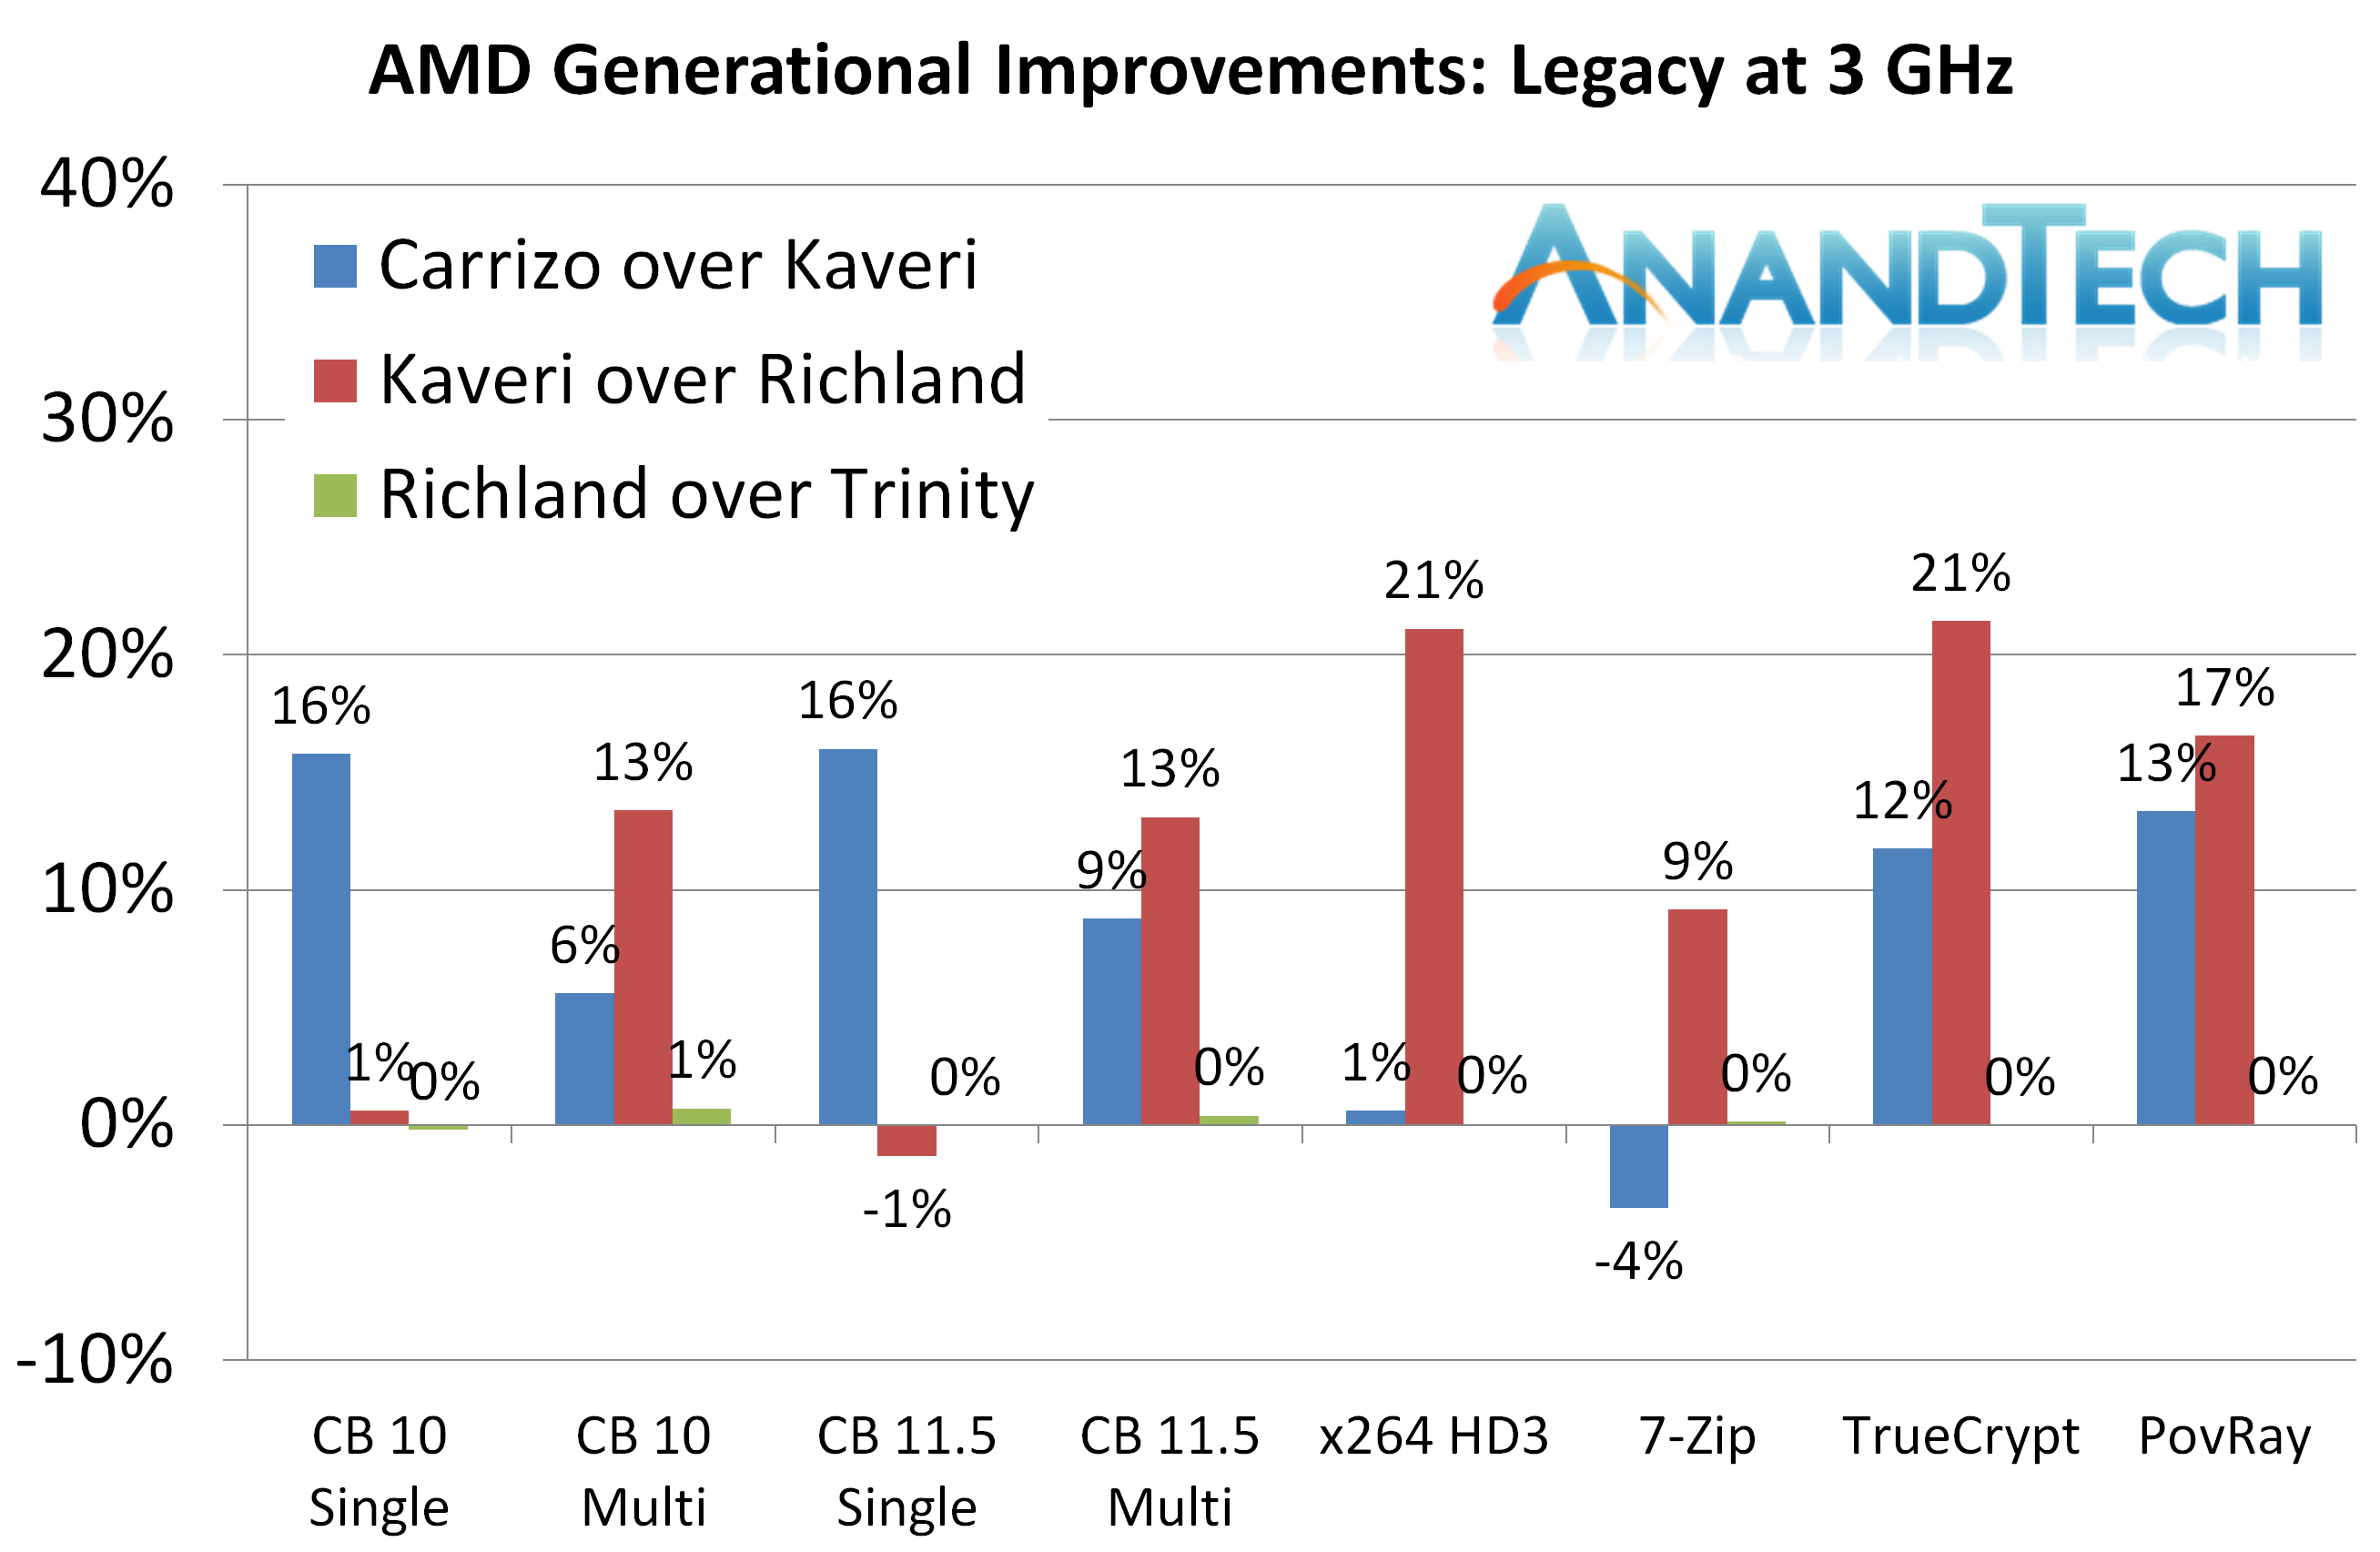
Back with the previous legacy results graph, we saw that Carrizo had a better performance than Kaveri across the board, except 7-zip. Translating this to IPC improvements and we see that in half the cases, moving to Kaveri was better than moving to Carrizo, with CineBench single threaded tests being the exception showing the capability of the core logic in Carrizo.
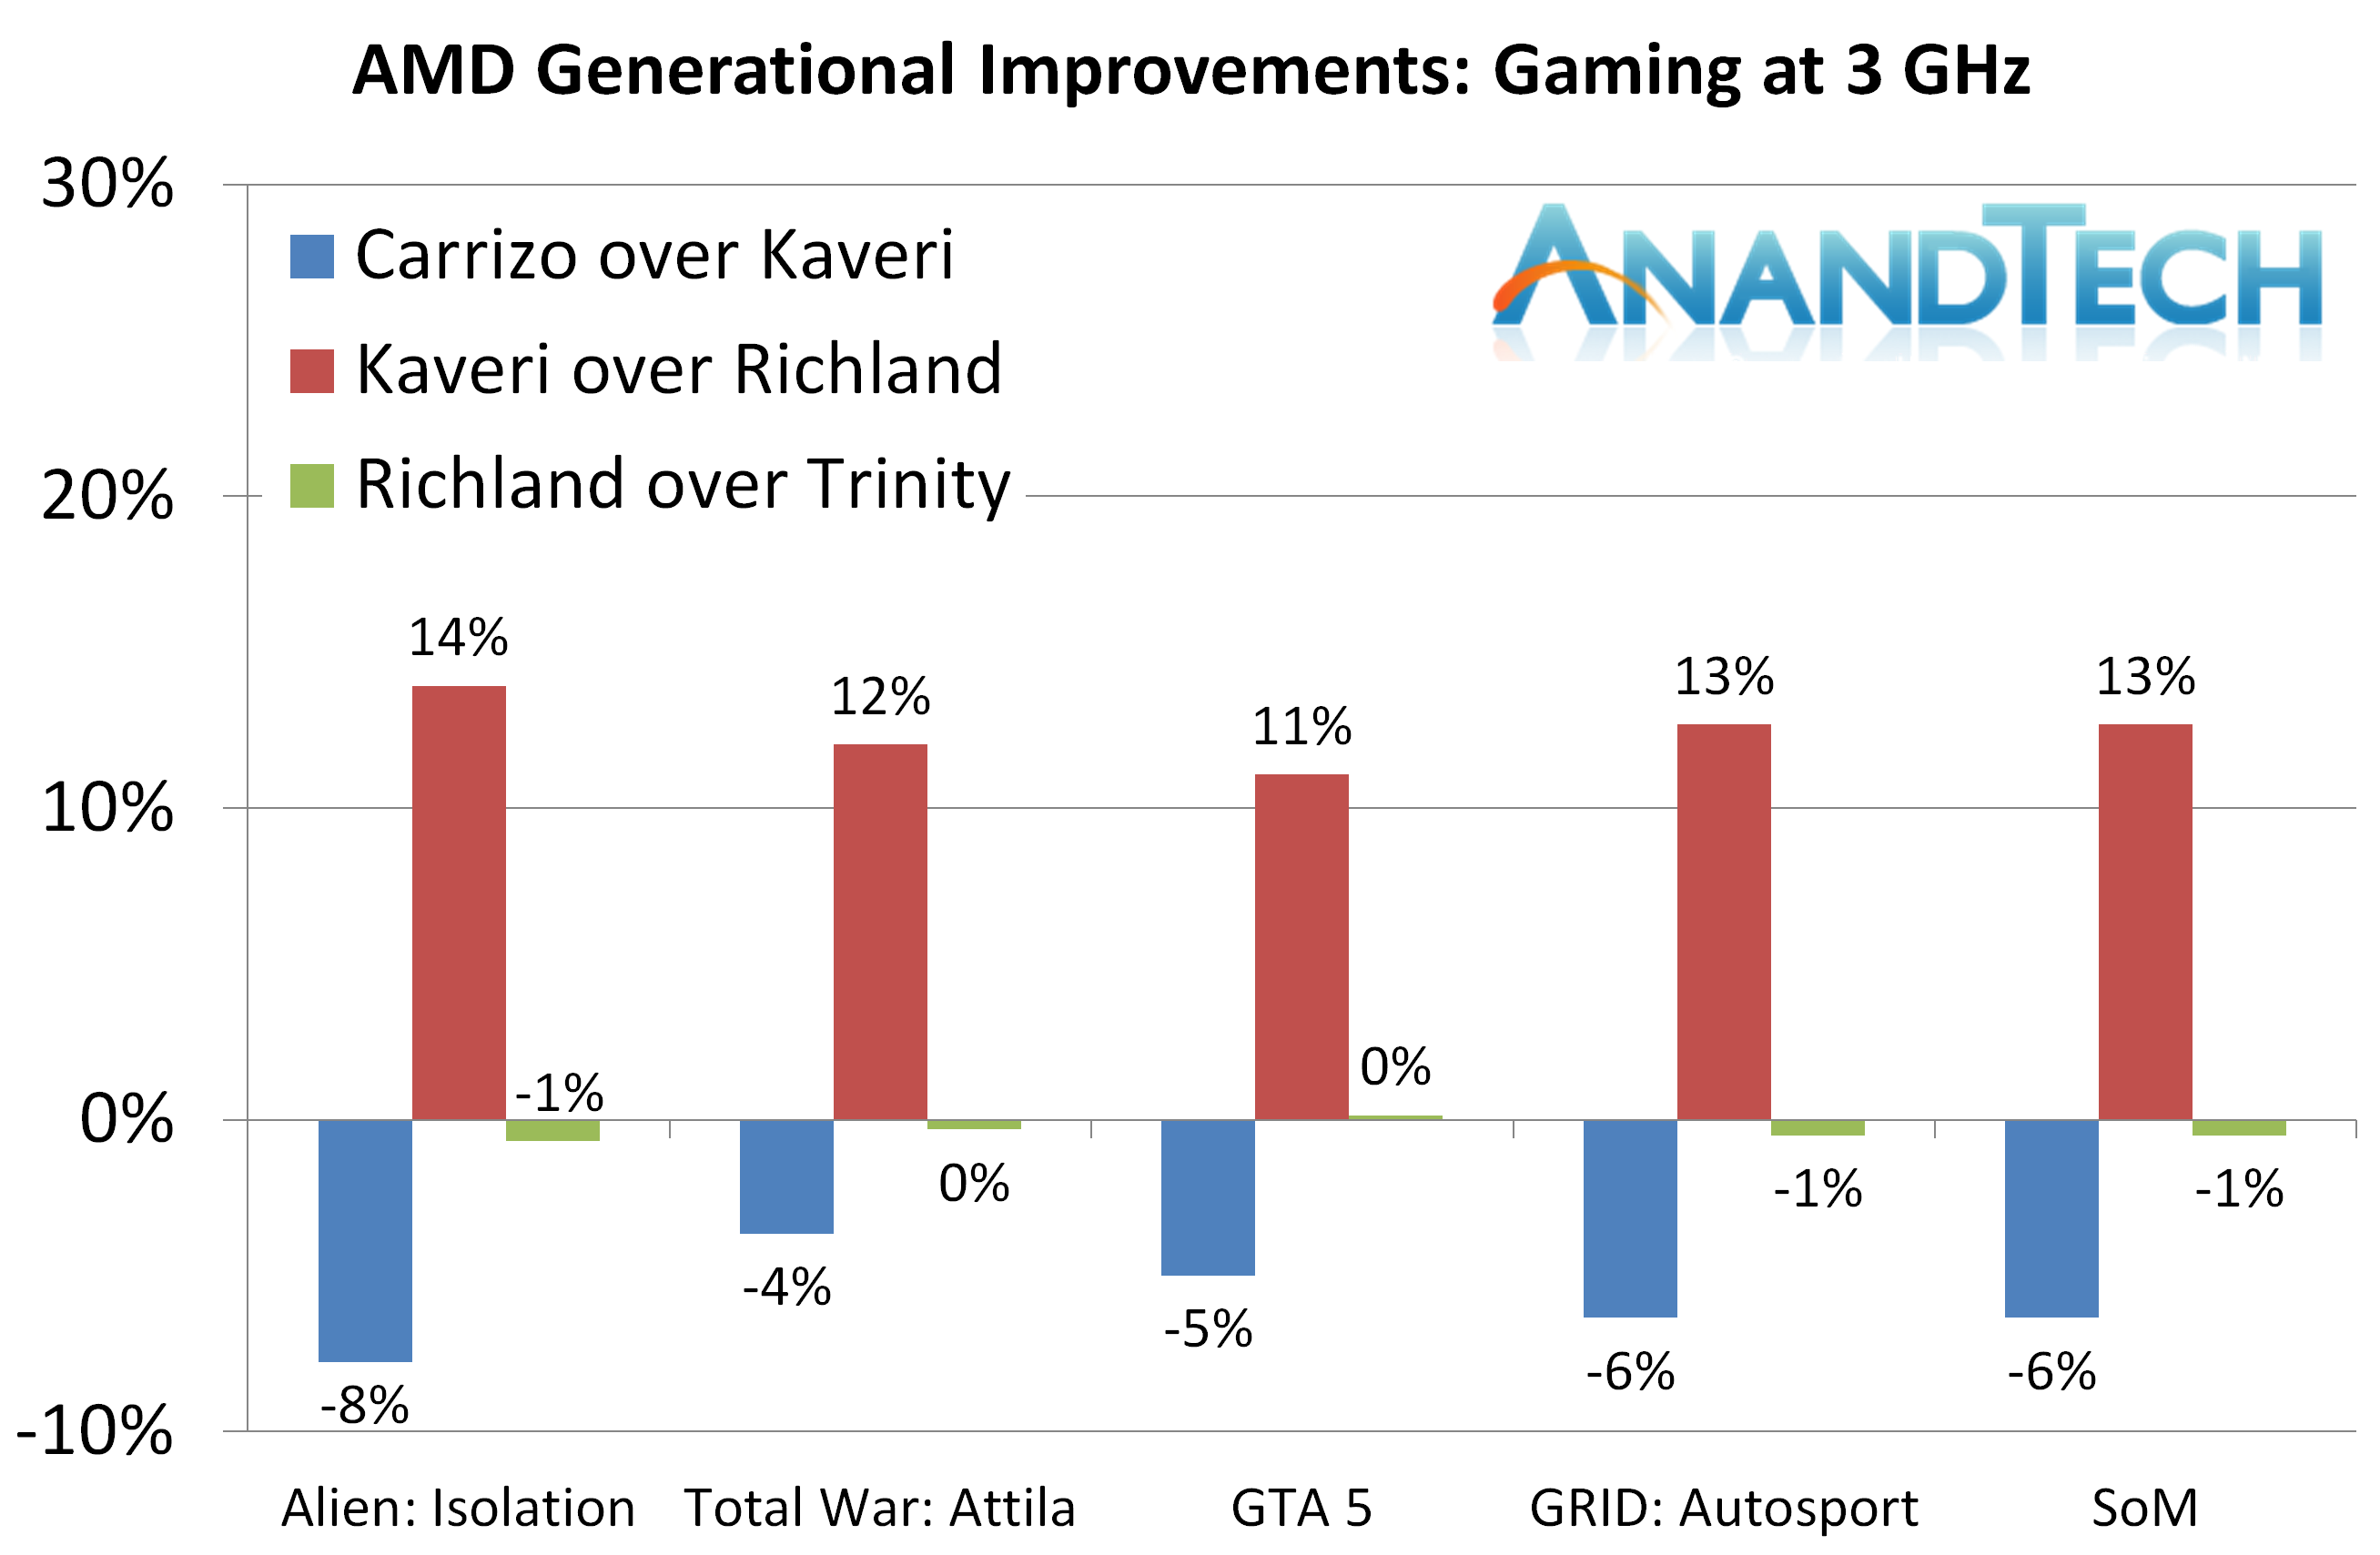
However, the big result will be for gaming. Clock for Clock, Carrizo gives an average 5.8% decrease in performance to Kaveri.
Conclusions
Wrapping all the numbers together, we get the following average IPC improvements for a Carrizo with 2MB of L2 cache over Kaveri with 4MB of L2 cache for each section:
| AMD Average IPC Increases | |||||||
| Benchmark Suite | Richland over Trinity | Kaveri over Richland | Carrizo over Kaveri | ||||
| Real World | 0.8% | 8.0% | 8.8% | ||||
| Office | -0.1% | 11.1% | 4.1% | ||||
| Legacy | 0.1% | 11.8% | 8.5% | ||||
| Overall Windows |
0.3% | 10.3% | 7.3% | ||||
| Linux | 10.4% | 10.5% | -12.1% | ||||
| Gaming | -0.4% | 12.5% | -5.8% | ||||
The headline figure, for CPU compute benchmarks (real world, office and legacy), is that Carrizo offers a +7.3% improvement over AMD's previous microarchitecture, Kaveri. It comes with the caveat that Linux and Gaming performance, which in our tests tend to rely more on memory accesses, perform 6-12% worse.
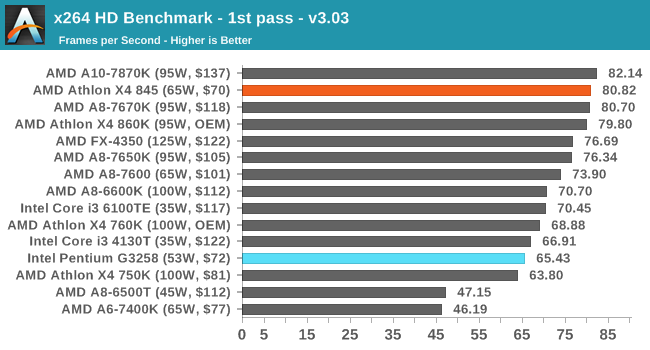
Stock Comparison: Real World
For our stock performance comparison, we take our four CPUs at their off-the-shelf frequency and also add in benchmark results from previous reviews for processors that are at a similar price. In the case of the Carrizo core based Athlon X4 845, which had an original MSRP of $70, this means that Intel’s dual core Pentium G3258 at $72 is the main competition. The Pentium comes with integrated graphics and a higher per-clock performance, however the Athlon has four threads to play with, which is two more than the Pentium, meaning the initial examination is a back and forth between the two.
Dolphin Benchmark: link
Many emulators are often bound by single thread CPU performance, and general reports tended to suggest that Haswell provided a significant boost to emulator performance. This benchmark runs a Wii program that raytraces a complex 3D scene inside the Dolphin Wii emulator. Performance on this benchmark is a good proxy of the speed of Dolphin CPU emulation, which is an intensive single core task using most aspects of a CPU. Results are given in minutes, where the Wii itself scores 17.53 minutes.
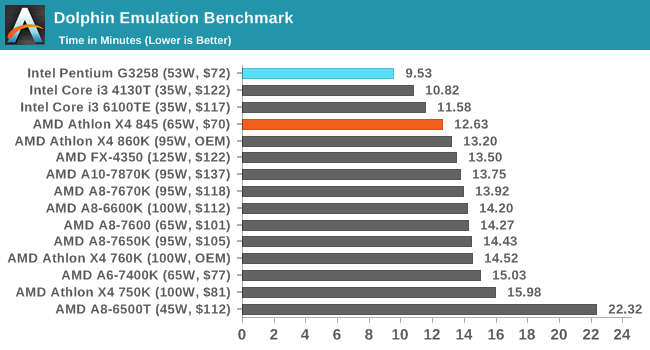
Dolphin historically favors Intel, and all three of our comparison points beat all the AMD processors here. The Athlon X4 845 holds the top spot for the AMD parts however.
WinRAR 5.0.1: link
Our WinRAR test from 2013 is updated to the latest version of WinRAR at the start of 2014. We compress a set of 2867 files across 320 folders totaling 1.52 GB in size – 95% of these files are small typical website files, and the rest (90% of the size) are small 30 second 720p videos.
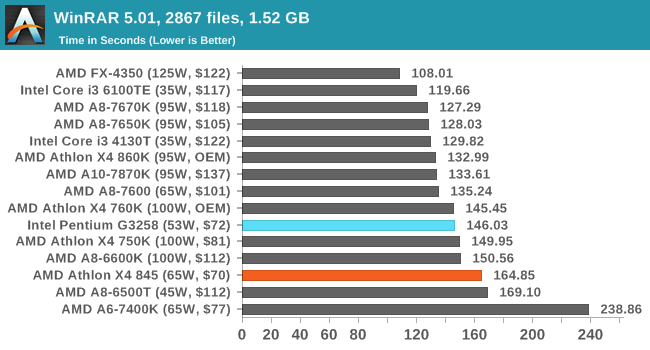
As stated earlier in the review, the X4 845's performance is below that of the other Athlon parts due to the 2MB of L2 cache. It still stays within reasonable striking distance of the Pentium here though.
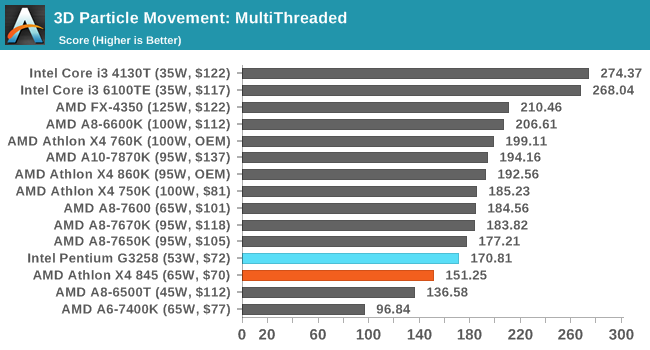
3D Particle Movement v2
The second version of this benchmark is similar to the first, however it has been re-written in VS2012 with one major difference: the code has been written to address the issue of false sharing. If data required by multiple threads, say four, is in the same cache line, the software cannot read the cache line once and split the data to each thread - instead it will read four times in a serial fashion. The new software splits the data to new cache lines so reads can be parallelized and stalls minimized. As v2 is fairly new, we are still gathering data and results are currently limited.
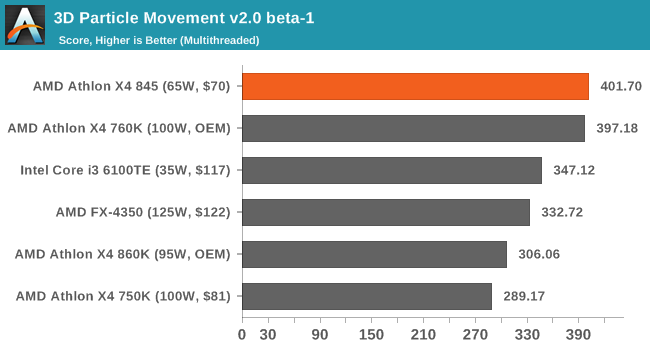
As 3DPMv2 is still new, we don't have G3258 results at this time, but we do have i3-6100TE results. Carrizo has an architectural advantage over other AMD microarchitectures, but the speed of the 760K means that it catches up. Both parts are ahead of the Core i3.
Web Benchmarks
On the lower end processors, general usability is a big factor of experience, especially as we move into the HTML5 era of web browsing.
Google Octane v2
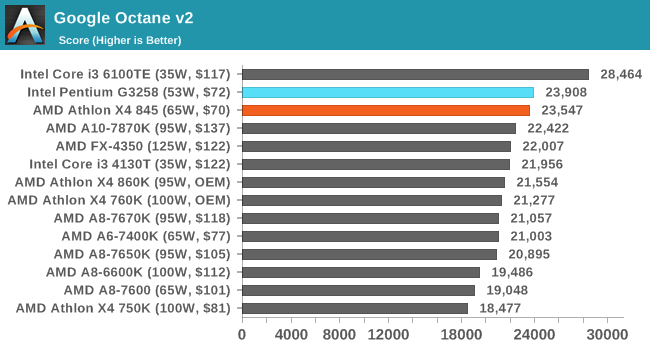
Both AMD and Intel get similar scores in Octane.
Stock Comparison: Office Performance
All of our benchmark results can also be found in our benchmark engine, Bench.
Agisoft Photoscan – 2D to 3D Image Manipulation: link
Agisoft Photoscan creates 3D models from 2D images, a process which is very computationally expensive. The algorithm is split into four distinct phases, and different phases of the model reconstruction require either fast memory, fast IPC, more cores, or even OpenCL compute devices to hand. Agisoft supplied us with a special version of the software to script the process, where we take 50 images of a stately home and convert it into a medium quality model. This benchmark typically takes around 15-20 minutes on a high end PC on the CPU alone, with GPUs reducing the time.
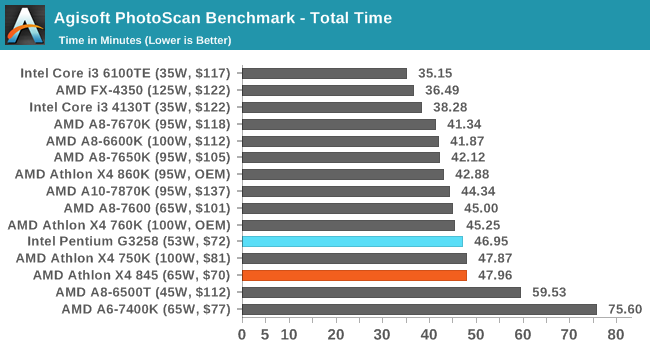
The higher IPC of the Pentium offsets the extra threads provided by the X4 845, which lags behind the other Athlons due to its reduced L2 cache size.
Cinebench R15
Cinebench is a benchmark based around Cinema 4D, and is fairly well known among enthusiasts for stressing the CPU for a provided workload. Results are given as a score, where higher is better.
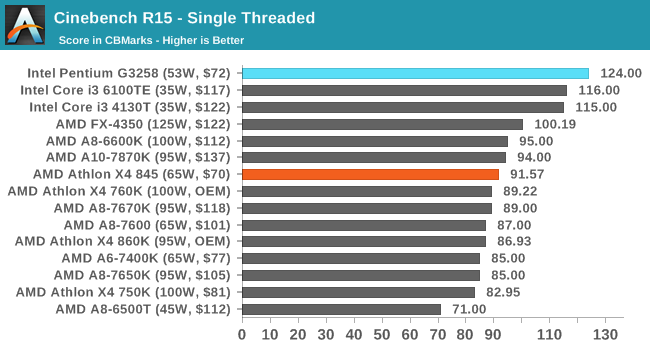
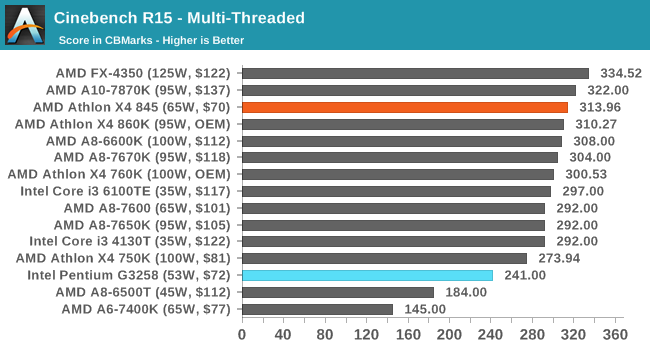
For CineBench, we see the four threads of the X4 845 in action, easily pushing a strong advantage over the Pentium in the multithreaded test. However, the Pentium does pull a 33% increase in the single threaded test due to its higher IPC.
HandBrake v0.9.9: link
For HandBrake, we take two videos (a 2h20 640x266 DVD rip and a 10min double UHD 3840x4320 animation short) and convert them to x264 format in an MP4 container. Results are given in terms of the frames per second processed, and HandBrake uses as many threads as possible.
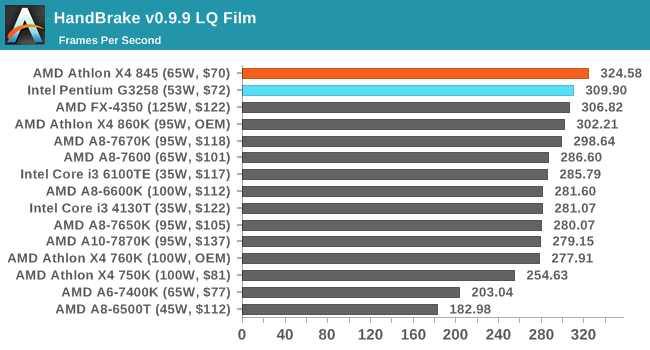
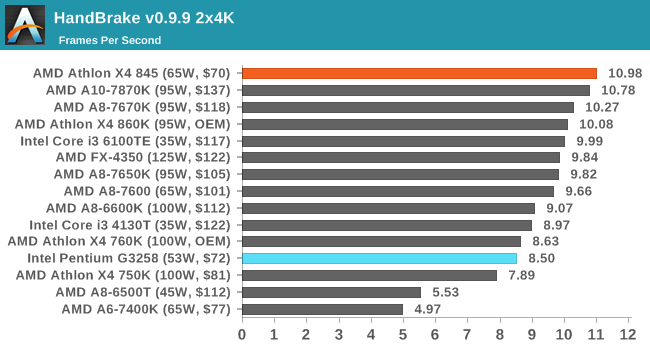
The Athlon X4 845 rules the roost in our HandBrake tests, showing what the latest AMD microarchitecture and four threads can do.
Hybrid x265
Hybrid is a new benchmark, where we take a 4K 1500 frame video and convert it into an x265 format without audio. Results are given in frames per second.
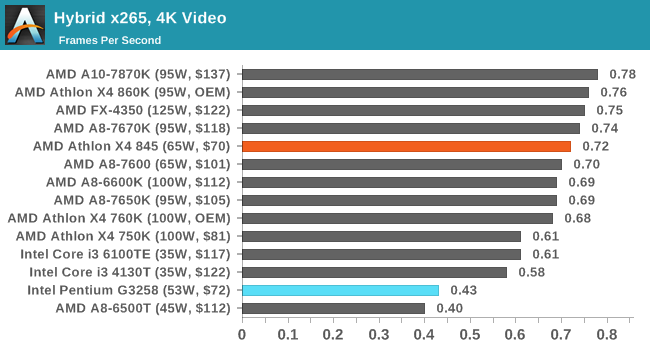
This also translates through to x265, where the dual core Pentium is lacking the ability to exploit more parallelism.
Stock Comparison: Linux Performance
Built around several freely available benchmarks for Linux, Linux-Bench is a project spearheaded by Patrick at ServeTheHome to streamline about a dozen of these tests in a single neat package run via a set of three commands using an Ubuntu 11.04 LiveCD. These tests include fluid dynamics used by NASA, ray-tracing, OpenSSL, molecular modeling, and a scalable data structure server for web deployments. We run Linux-Bench and have chosen to report a select few of the tests that rely on CPU and DRAM speed.
All of our benchmark results can also be found in our benchmark engine, Bench.
C-Ray: link
C-Ray is a simple ray-tracing program that focuses almost exclusively on processor performance rather than DRAM access. The test in Linux-Bench renders a heavy complex scene offering a large scalable scenario.
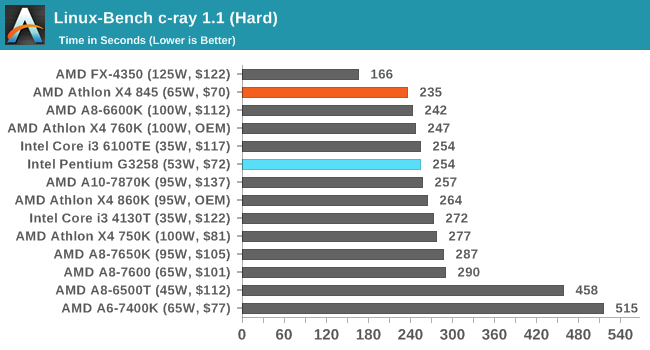
When we push up to full speed, the X4 845 comes alive and beats all the other Athlon CPUs (which wasn't the case at 3 GHz). It also pushes above the Pentium.
NAMD, Scalable Molecular Dynamics: link
Developed by the Theoretical and Computational Biophysics Group at the University of Illinois at Urbana-Champaign, NAMD is a set of parallel molecular dynamics codes for extreme parallelization up to and beyond 200,000 cores. The reference paper detailing NAMD has over 4000 citations, and our testing runs a small simulation where the calculation steps per unit time is the output vector.
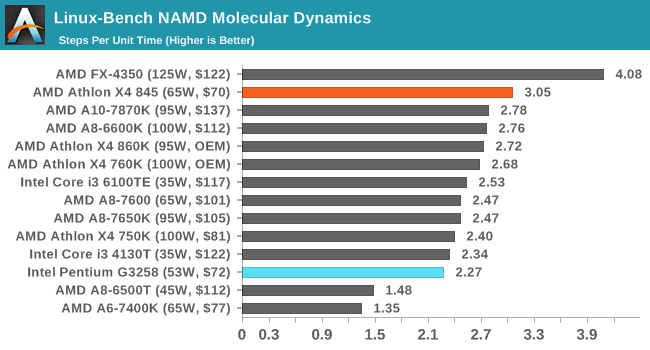
Similar things happen with NAMD.
NPB, Fluid Dynamics: link
Aside from LINPACK, there are many other ways to benchmark supercomputers in terms of how effective they are for various types of mathematical processes. The NAS Parallel Benchmarks (NPB) are a set of small programs originally designed for NASA to test their supercomputers in terms of fluid dynamics simulations, useful for airflow reactions and design.
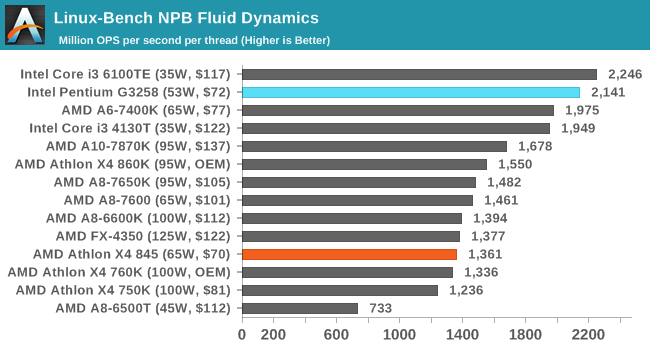
NPB seems more amenable with Intel CPUs in this case. I feel the cache arrangement in the X4 845 is the let down here again.
Redis: link
Many of the online applications rely on key-value caches and data structure servers to operate. Redis is an open-source, scalable web technology with a strong developer base, but also relies heavily on memory bandwidth as well as CPU performance.
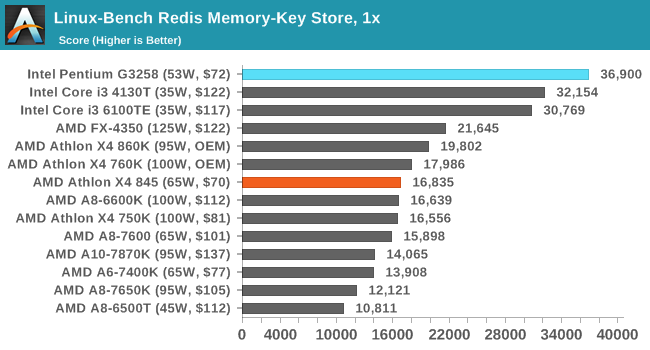
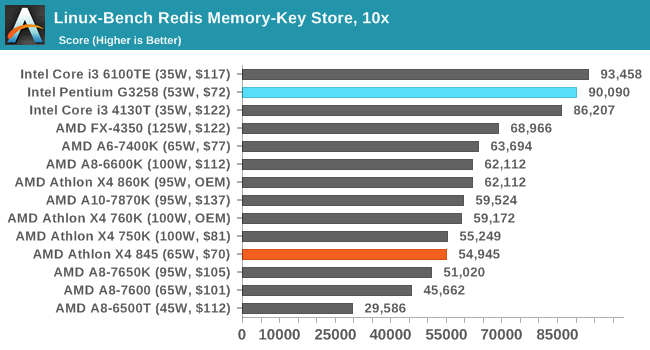
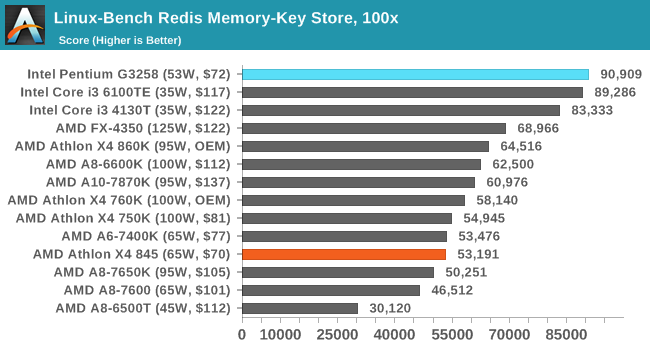
Redis easily favors high speed caches, and the Pentium oozes performance in this case.
Stock Comparison: Legacy Benchmarks
Some of our legacy benchmarks have followed AnandTech for over a decade, showing how performance changes when the code bases stay the same in that period. Some of this software is still in common use today.
All of our benchmark results can also be found in our benchmark engine, Bench.
3D Particle Movement v1
3DPM is a self-penned benchmark, taking basic 3D movement algorithms used in Brownian Motion simulations and testing them for speed. High floating point performance, MHz and IPC wins in the single thread version, whereas the multithread version has to handle the threads and loves more cores. This is the original version, written in the style of a typical non-computer science student coding up an algorithm for their theoretical problem, and comes without any non-obvious optimizations not already performed by the compiler, such as false sharing.
Despite 3DPM v1's coding issues, the multithreaded result is a lot closer than I had originally expected.
Cinebench 11.5 and 10
Cinebench is a widely known benchmarking tool for measuring performance relative to MAXON's animation software Cinema 4D. Cinebench has been optimized over a decade and focuses on purely CPU horsepower, meaning if there is a discrepancy in pure throughput characteristics, Cinebench is likely to show that discrepancy. Arguably other software doesn't make use of all the tools available, so the real world relevance might purely be academic, but given our large database of data for Cinebench it seems difficult to ignore a small five minute test. We run the modern version 15 in this test, as well as the older 11.5 and 10 due to our back data.
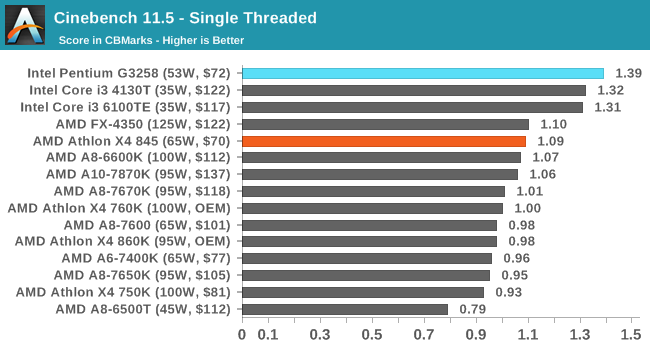
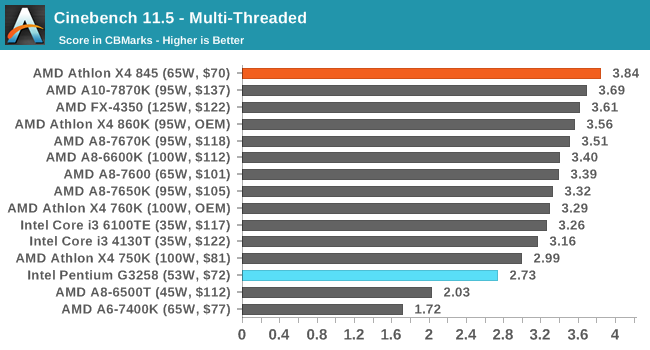
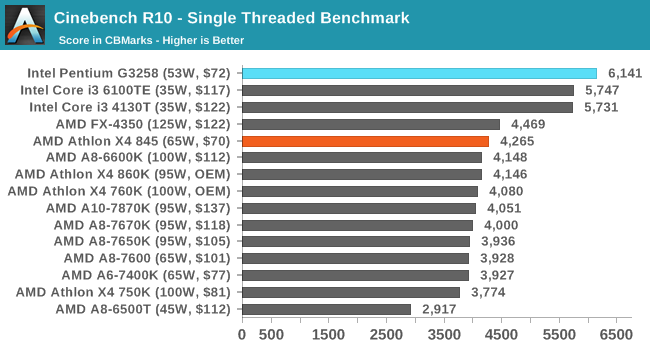
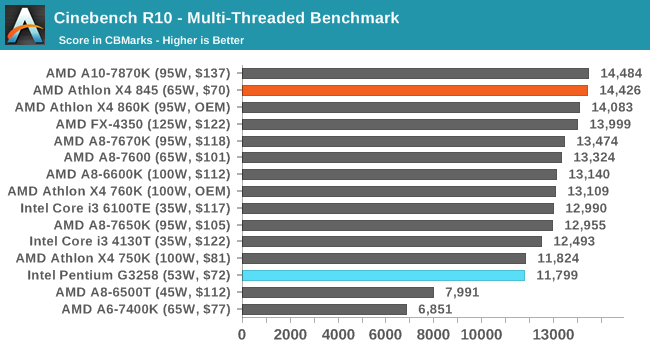
In both CineBench instances we see the high IPC of the Pentium take a 33-50% lead, whereas moving to multi-threaded puts the X4 845 firmly in the driving seat.
POV-Ray 3.7
POV-Ray is a common ray-tracing tool used to generate realistic looking scenes. We've used POV-Ray in its various guises over the years as a good benchmark for performance, as well as a tool on the march to ray-tracing limited immersive environments. We use the built-in multithreaded benchmark.
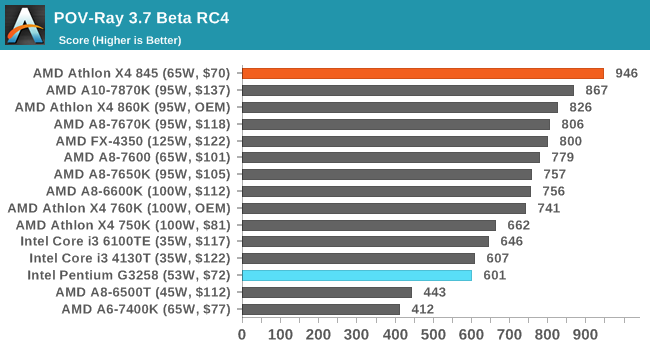
POV-Ray fully exploints all the threads in the system, and the latest AMD microarchitecture helps here as well, pushing the X4 845 beyond the other AMD CPUs in this test and comfortably over the Pentium and low-power Core i3 parts.
TrueCrypt 7.1
Before its discontinuation, TrueCrypt was a popular tool for WindowsXP to offer software encryption to a file system. The almost latest version, 7.1, is still widely used however the developers have stopped supporting it since the introduction of encrypted disk support in Windows 8/7/Vista from 5/2014, and as such any new security issues are unfixed.
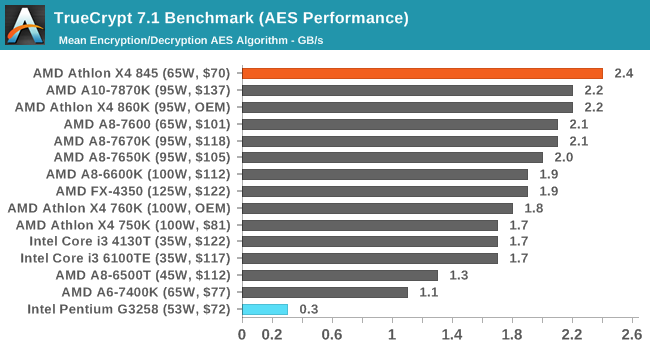
The Pentium lacks AES acceleration, which is available on Core i3 parts and up, which explains the Pentium's low performance here. The Carrizo microarchitecture pushes the 65W part ahead of all the other 95W/100W/125W parts.
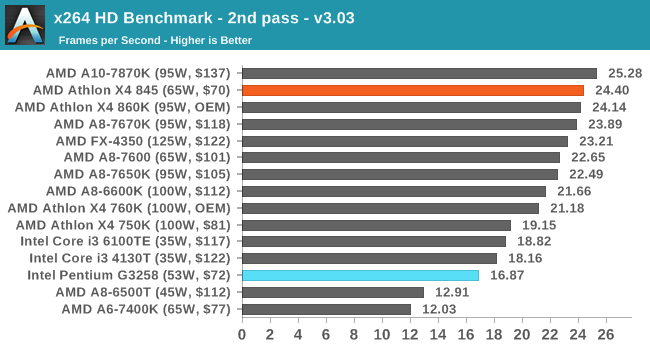
x264 HD 3.0
Similarly, the x264 HD 3.0 package we use here is also kept for historic regressional data. The latest version is 5.0.1, and encodes a 1080p video clip into a high quality x264 file. Version 3.0 only performs the same test on a 720p file, and in most circumstances the software performance hits its limit on high end processors, but still works well for mainstream and low-end. Also, this version only takes a few minutes, whereas the latest can take over 90 minutes to run.
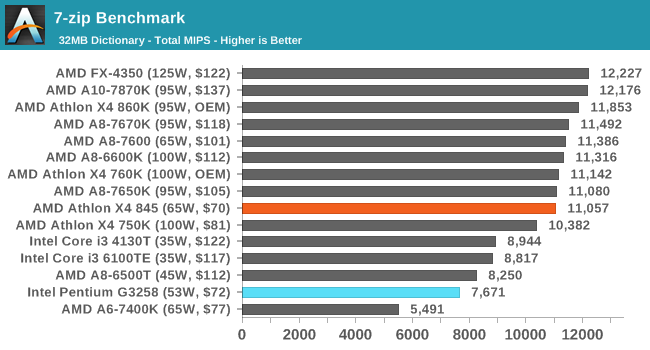
7-zip
7-Zip is a freeware compression/decompression tool that is widely deployed across the world. We run the included benchmark tool using a 50MB library and take the average of a set of fixed-time results.
Alien: Isolation
If first person survival mixed with horror is your sort of thing, then Alien: Isolation, based off of the Alien franchise, should be an interesting title. Developed by The Creative Assembly and released in October 2014, Alien: Isolation has won numerous awards from Game Of The Year to several top 10s/25s and Best Horror titles, ratcheting up over a million sales by February 2015. Alien: Isolation uses a custom built engine which includes dynamic sound effects and should be fully multi-core enabled. We take the average frame rate as our marker with a scripted version of the built-in benchmark.
For this test we used the following settings with our graphics cards:
| Alien Isolation Settings | |||
| Resolution | Quality | ||
| Low GPU | Integrated Graphics | 1280x720 | Ultra |
| ASUS R7 240 1GB DDR3 | |||
| Medium GPU | MSI GTX 770 Lightning 2GB | 1920x1080 | Ultra |
| MSI R9 285 Gaming 2G | |||
| High GPU | ASUS GTX 980 Strix 4GB | 1920x1080 | Ultra |
| MSI R9 290X Gaming 4G | |||
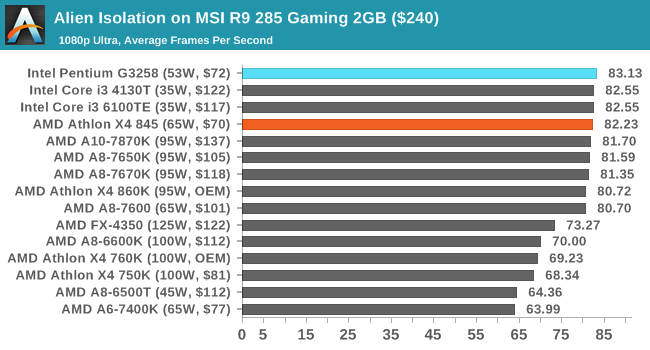
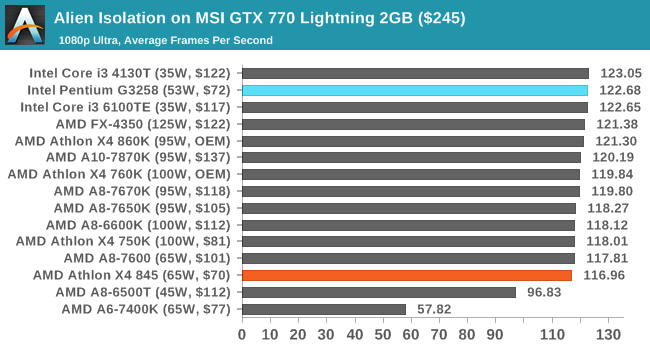
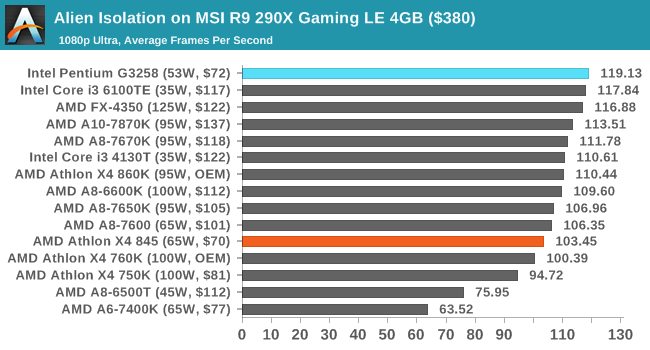
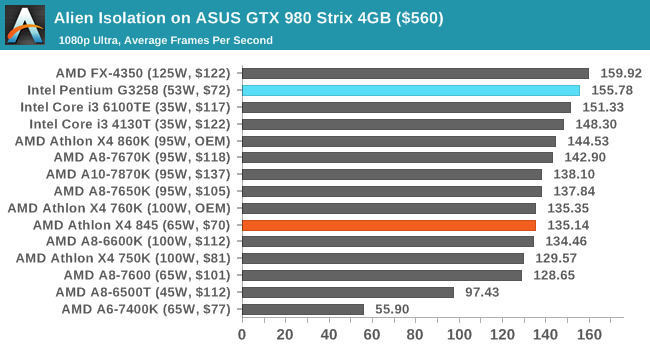
Alien Isolation in this case favors a higher IPC, and so as a result the Intel processors are quite high on the list. The biggest differences are when using the high-end graphics cards: the R9 290X and the GTX 980, which give a 10-20% increase in favor of the Pentium.
Total War: Attila
The Total War franchise moves on to Attila, another The Creative Assembly development, and is a stand-alone strategy title set in 395AD where the main story line lets the gamer take control of the leader of the Huns in order to conquer parts of the world. Graphically the game can render hundreds/thousands of units on screen at once, all with their individual actions and can put some of the big cards to task. In our benchmark, the in-game scripted benchmark is used with the option for ‘unlimited video memory’ enabled.
For this test we used the following settings with our graphics cards:
| Total War: Attila Settings | |||
| Resolution | Quality | ||
| Low GPU | Integrated Graphics | 1280x720 | Performance |
| ASUS R7 240 1GB DDR3 | |||
| Medium GPU | MSI GTX 770 Lightning 2GB | 1920x1080 | Quality |
| MSI R9 285 Gaming 2G | |||
| High GPU | ASUS GTX 980 Strix 4GB | 1920x1080 | Quality |
| MSI R9 290X Gaming 4G | |||
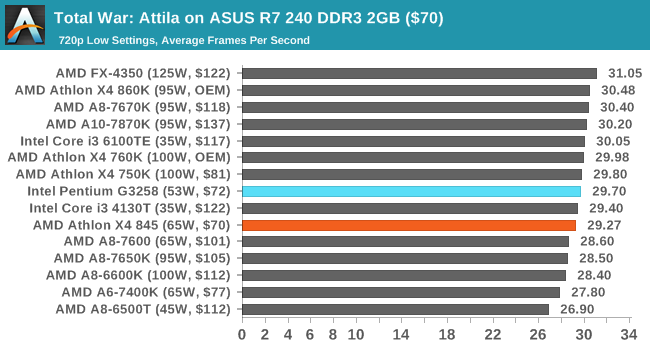
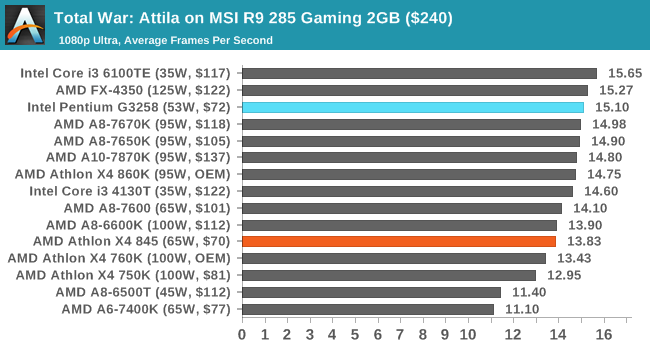
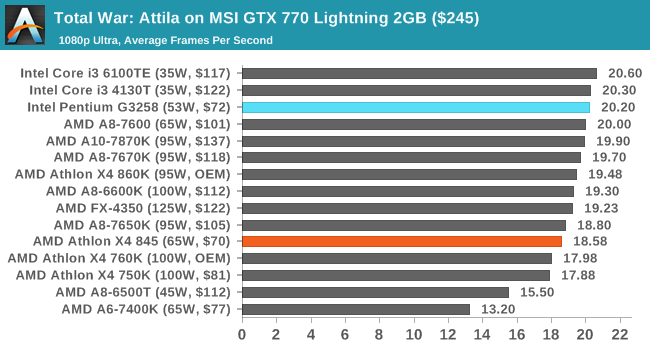
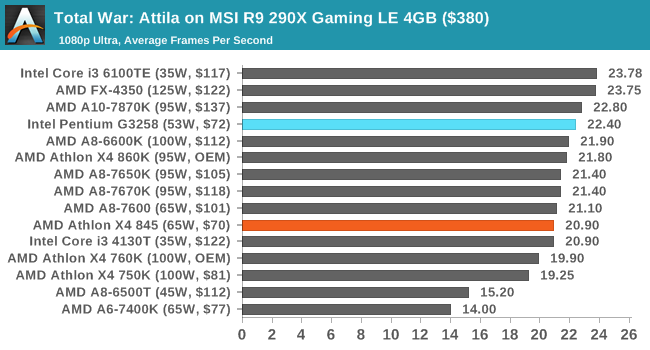
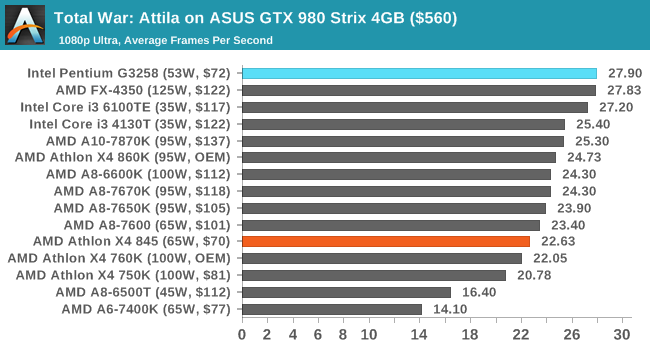
Similarly to Alien Isolation, when we push Total War: Attila high up on the quality, the Pentium pushes ahead. None of our processors on the mid-to-high GPUs could push beyond 30 FPS average however, although the Pentium gets close with the GTX 980.
Grand Theft Auto V
The highly anticipated iteration of the Grand Theft Auto franchise finally hit the shelves on April 14th 2015, with both AMD and NVIDIA in tow to help optimize the title. GTA doesn’t provide graphical presets, but opens up the options to users and extends the boundaries by pushing even the hardest systems to the limit using Rockstar’s Advanced Game Engine. Whether the user is flying high in the mountains with long draw distances or dealing with assorted trash in the city, when cranked up to maximum it creates stunning visuals but hard work for both the CPU and the GPU.
For our test we have scripted a version of the in-game benchmark, relying only on the final part which combines a flight scene along with an in-city drive-by followed by a tanker explosion. We record both the average frame rate and the percentage of frames under 60 FPS (16.6ms).
For this test we used the following settings with our graphics cards:
| Grand Theft Auto Settings | |||
| Resolution | Quality | ||
| Low GPU | Integrated Graphics | 1280x720 | Lowest |
| ASUS R7 240 1GB DDR3 | |||
| Medium GPU | MSI GTX 770 Lightning 2GB | 1920x1080 | Very High |
| MSI R9 285 Gaming 2G | |||
| High GPU | ASUS GTX 980 Strix 4GB | 1920x1080 | Very High |
| MSI R9 290X Gaming 4G | |||
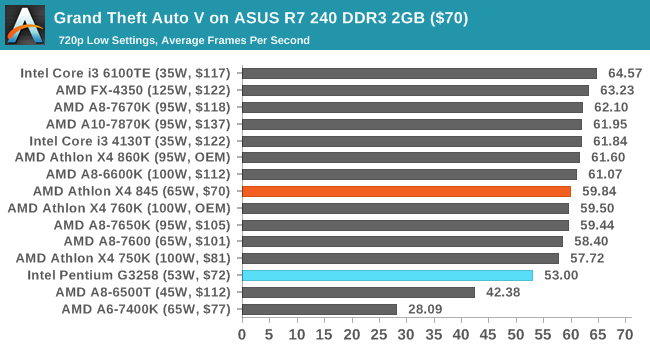
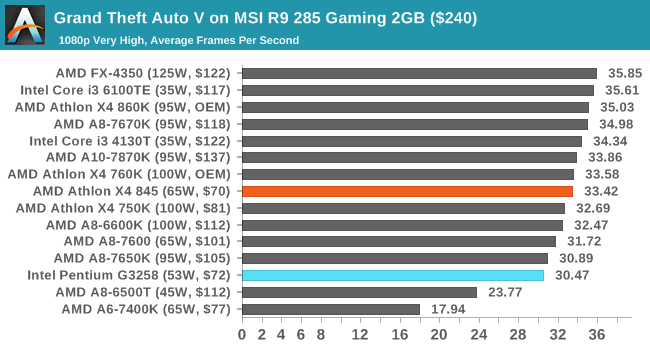
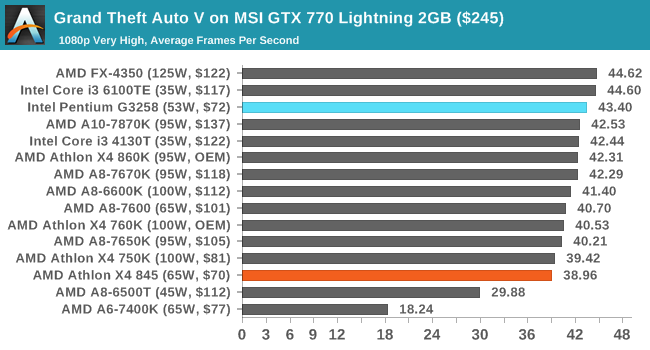
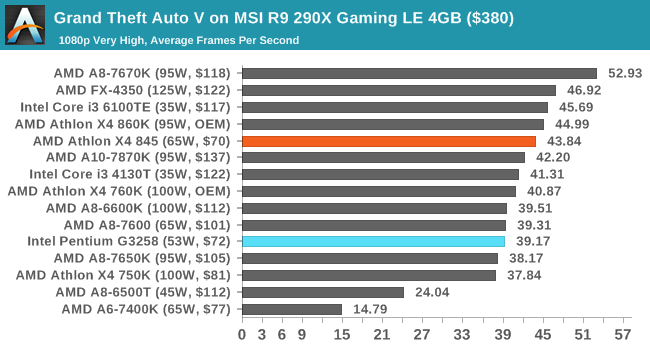
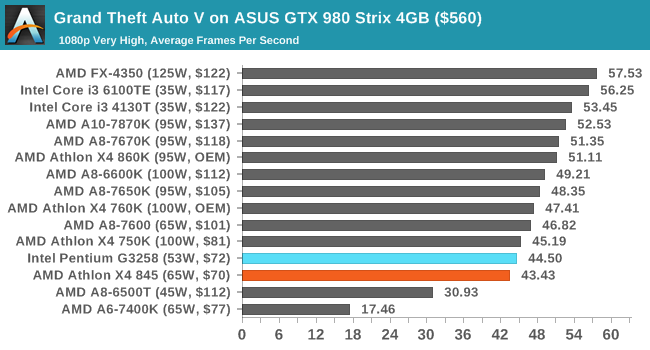
We get a slightly different turn around with Grand Theft Auto: the game can use multiple cores in the Athlon X4 845 to get a better frame rate with the R9 285 and R9 290X. However with NVIDIA cards it seems that the cores matter less to the performance, and with these cards the Pentium gets the better frame rates.
![Grand Theft Auto V on ASUS R7 240 DDR3 2GB ($70) [Under 60 FPS]](https://images.anandtech.com/graphs/graph10436/82713.png)
![Grand Theft Auto V on MSI R9 285 Gaming 2GB ($240) [Under 60 FPS]](https://images.anandtech.com/graphs/graph10436/82721.png)
![Grand Theft Auto V on MSI GTX 770 Lightning 2GB ($245) [Under 60 FPS]](https://images.anandtech.com/graphs/graph10436/82731.png)
![Grand Theft Auto V on MSI R9 290X Gaming LE 4GB ($380) [Under 60 FPS]](https://images.anandtech.com/graphs/graph10436/82741.png)
![Grand Theft Auto V on ASUS GTX 980 Strix 4GB ($560) [Under 60 FPS]](https://images.anandtech.com/graphs/graph10436/82751.png)
When we look at the % of frames under 60 FPS, we see a similar story with the results that actually make a difference (R7 240, GTX 980).
GRID: Autosport
No graphics tests are complete without some input from Codemasters and the EGO engine, which means for this round of testing we point towards GRID: Autosport, the next iteration in the GRID and racing genre. As with our previous racing testing, each update to the engine aims to add in effects, reflections, detail and realism, with Codemasters making ‘authenticity’ a main focal point for this version.
GRID’s benchmark mode is very flexible, and as a result we created a test race using a shortened version of the Red Bull Ring with twelve cars doing two laps. The car is focus starts last and is quite fast, but usually finishes second or third. Both the average and minimum frame rates are recorded.
For this test we used the following settings with our graphics cards:
| GRID: Autosport Settings | |||
| Resolution | Quality | ||
| Low GPU | Integrated Graphics | 1920x1080 | Medium |
| ASUS R7 240 1GB DDR3 | |||
| Medium GPU | MSI GTX 770 Lightning 2GB | 1920x1080 | Maximum |
| MSI R9 285 Gaming 2G | |||
| High GPU | ASUS GTX 980 Strix 4GB | 1920x1080 | Maximum |
| MSI R9 290X Gaming 4G | |||
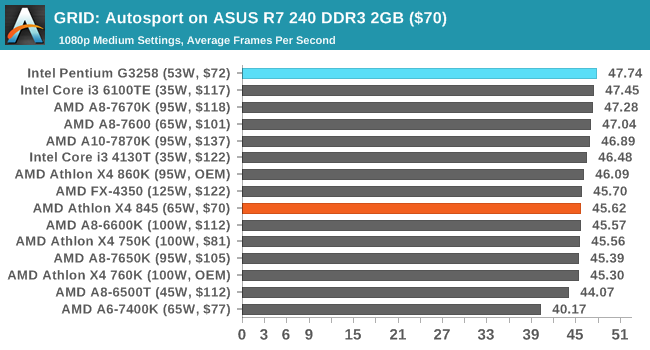
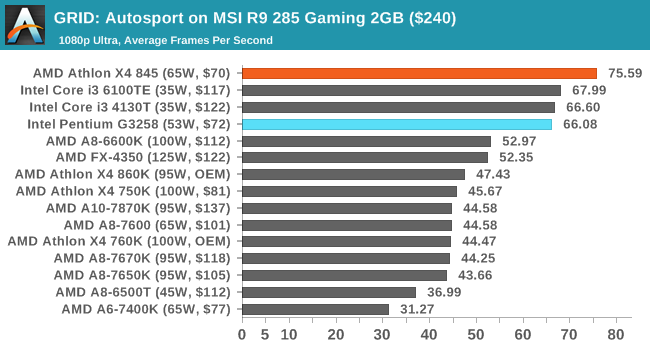
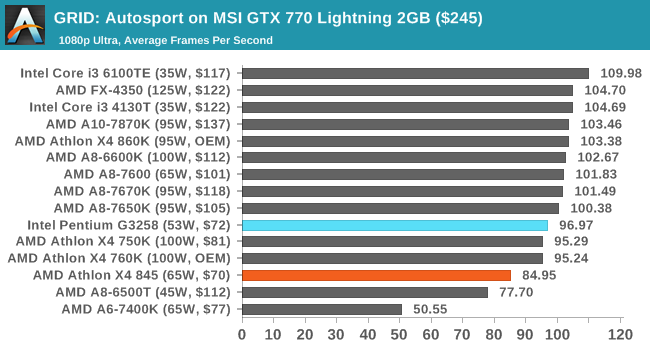
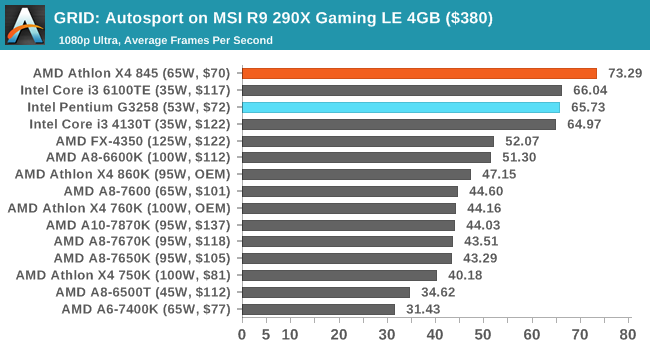
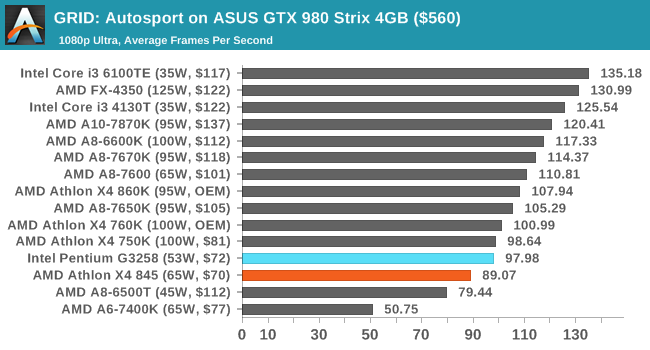
It would seem that GRID is a repeat of Grand Theft Auto: for AMD cards that are mid-to-high end, the Athlon X4 845 performs at the top of the class, whereas for the NVIDIA cards, performance would suggest to chose the Pentium CPU.
![GRID: Autosport on ASUS R7 240 DDR3 2GB ($70) [Minimum FPS]](https://images.anandtech.com/graphs/graph10436/82715.png)
![GRID: Autosport on MSI R9 285 Gaming 2GB ($240) [Minimum FPS]](https://images.anandtech.com/graphs/graph10436/82723.png)
![GRID: Autosport on MSI GTX 770 Lightning 2GB ($245) [Minimum FPS]](https://images.anandtech.com/graphs/graph10436/82733.png)
![GRID: Autosport on MSI R9 290X Gaming LE 4GB ($380) [Minimum FPS]](https://images.anandtech.com/graphs/graph10436/82743.png)
![GRID: Autosport on ASUS GTX 980 Strix 4GB ($560) [Minimum FPS]](https://images.anandtech.com/graphs/graph10436/82753.png)
The minimum frame rate results also get the same result: AMD + AMD or Intel + NVIDIA.
Middle-Earth: Shadows of Mordor
The final title in our testing is another battle of system performance with the open world action-adventure title, Shadows of Mordor. Produced by Monolith using the LithTech Jupiter EX engine and numerous detail add-ons, SoM goes for detail and complexity to a large extent, despite having to be cut down from the original plans. The main story itself was written by the same writer as Red Dead Redemption, and it received Zero Punctuation’s Game of The Year in 2014.
For testing purposes, SoM gives a dynamic screen resolution setting, allowing us to render at high resolutions that are then scaled down to the monitor. As a result, we get several tests using the in-game benchmark, taking results as the average and minimum frame rates.
For this test we used the following settings with our graphics cards:
| Shadow of Mordor Settings | |||
| Resolution | Quality | ||
| Low GPU | Integrated Graphics | 1280x720 | Low |
| ASUS R7 240 1GB DDR3 | |||
| Medium GPU | MSI GTX 770 Lightning 2GB | 1920x1080 | Ultra |
| MSI R9 285 Gaming 2G | |||
| High GPU | ASUS GTX 980 Strix 4GB | 1920x1080 3840x2160 |
Ultra Ultra |
| MSI R9 290X Gaming 4G | |||
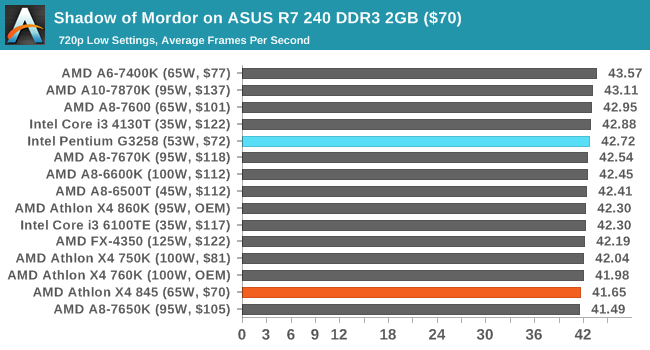
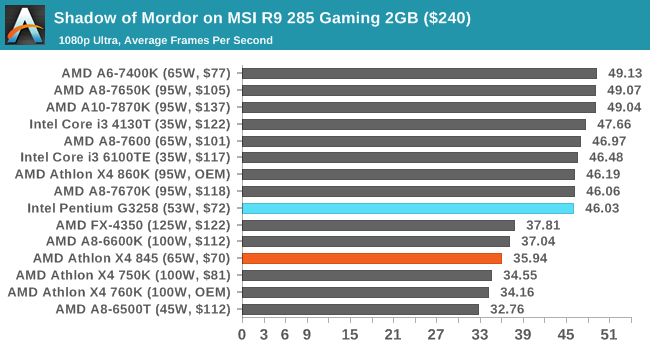
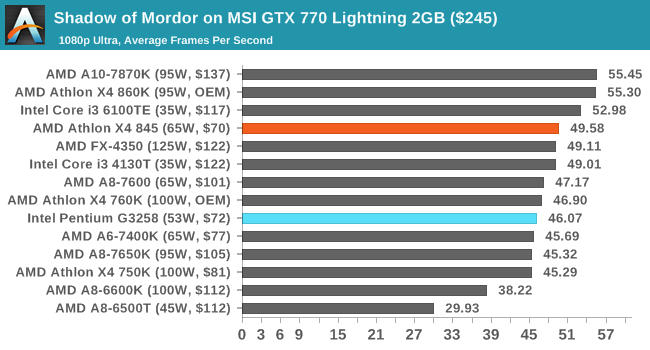
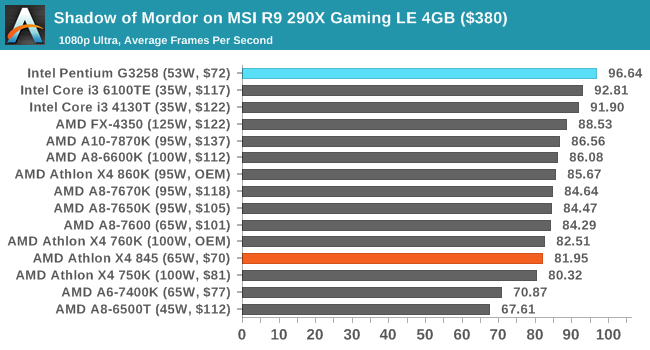
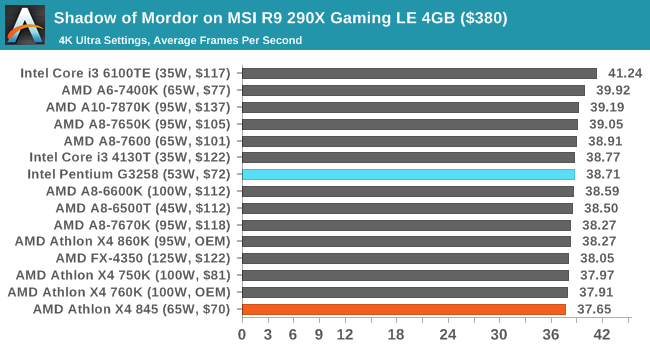
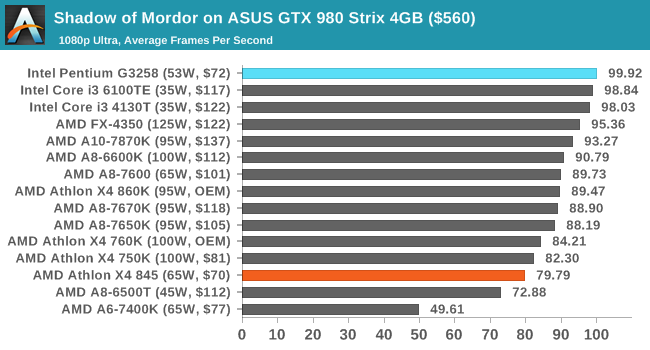
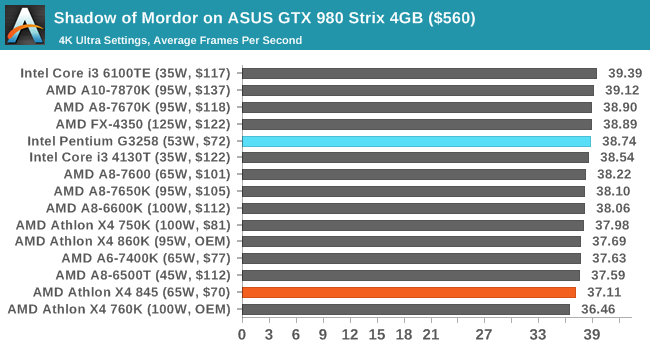
Shadow of Mordor, in all cases except the GTX 770, puts the Pentium ahead of the Carrizo part. In a couple of circumstances, this doesn't matter much, particularly at 4K resolutions with the R9 290X and GTX 980, however at 1080p the Pentium comes out ahead.
![Shadow of Mordor on ASUS R7 240 DDR3 2GB ($70) [Minimum FPS]](https://images.anandtech.com/graphs/graph10436/82717.png)
![Shadow of Mordor on MSI R9 285 Gaming 2GB ($240) [Minimum FPS]](https://images.anandtech.com/graphs/graph10436/82725.png)
![Shadow of Mordor on MSI GTX 770 Lightning 2GB ($245) [Minimum FPS]](https://images.anandtech.com/graphs/graph10436/82735.png)
![Shadow of Mordor on MSI R9 290X Gaming LE 4GB ($380) [Minimum FPS]](https://images.anandtech.com/graphs/graph10436/82745.png)
![Shadow of Mordor on MSI R9 290X Gaming LE 4GB ($380) [Minimum FPS]](https://images.anandtech.com/graphs/graph10436/82747.png)
![Shadow of Mordor on ASUS GTX 980 Strix 4GB ($560) [Minimum FPS]](https://images.anandtech.com/graphs/graph10436/82755.png)
![Shadow of Mordor on ASUS GTX 980 Strix 4GB ($560) [Minimum FPS]](https://images.anandtech.com/graphs/graph10436/82757.png)
Minimum frame rates for Shadow of Mordor are even more in favor of the Pentium here, and with the low-to-mid range graphics cards (R7 240, R9 285, GTX 770) the effect can be up to double the minimum frame rate over the Athlon.
Power Consumption
Power consumption was tested on the system while in a single MSI GTX 770 Lightning configuration with a wall meter connected to the power supply. This power supply is 80PLUS rated, and as I am in the UK on a 230-240 V supply, leads to ~75% efficiency > 50W, and 90%+ efficiency at 250W, suitable for both idle and multi-GPU loading. This method of power reading allows us to compare the power management of the UEFI and the board to supply components with power under load, and includes typical PSU losses due to efficiency.
Our Power Consumption tests have changed slightly since our last review as we are testing out new ways to represent the power used by the CPU and the system. The current three standard tests start with a system at long idle, meaning that the OS turns off the monitor and enters a lower power state without going into S3. We then move into a standard idle state on the desktop, with no software running but the desktop on display. The system is then moved into high performance mode, and we run a one-minute OCCT test to identify peak power consumption.
Due to extended requests, our power consumption numbers also use Prime95 to load the system. We use Prime95's peak power consumption mode, testing 1/2/3/4 thread consumption at the wall with our power meter. P95 hits the peak power relatively quickly, making this a straightforward test to include. For CPUs above 4 threads, we typically manage powers of two, half the CPU, and the full CPU to get an accurate picture.
For this review, we performed the power analysis for all four main CPUs at the 3 GHz frequency (using automatic voltage on the motherboard), as well as at stock frequencies. The values shown are delta values to the long idle power consumption, due to power delivery variations.
Generational Power Consumption at 3 GHz
All four processors have a 2-3W difference moving from a long idle to an idle state, however it is clear that our Carrizo CPU, which we stated is well outside its normal efficiency window at the beginning of this review, has a very good response during OCCT loading.
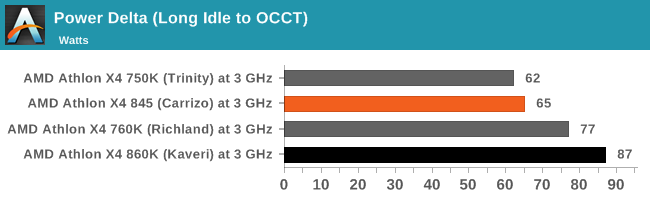
These results are within 3-4W of the full loading provided by Prime95 as well. If we analyze the per core jumps from moving up the threads using Prime95, there are some interesting numbers to pick out.
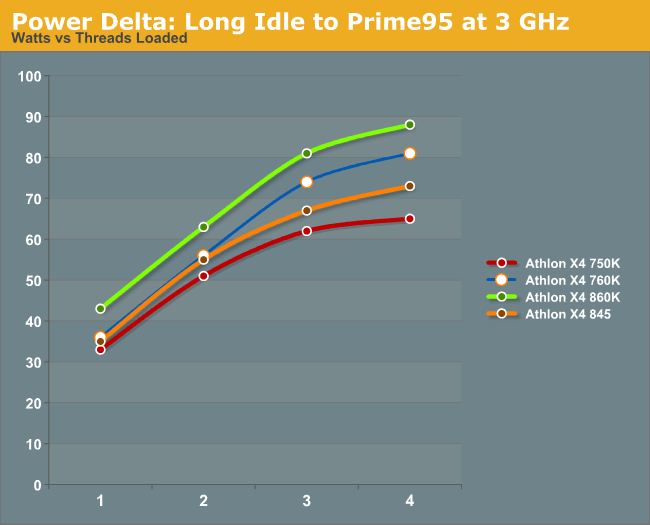
All the processors increase their power consumption by ~20W when both modules are loaded, when moving from 1 core loading to 2 core loading. When moving to 3/4 core loading, it is obvious that as both modules are already running at high frequency, a smaller amount of power is needed for each to enable the second thread.
Power Consumption at Stock
For those keeping track, we were not able to source identical TDP rated processors for this test. While the Carrizo based Athlon is 65W, the other processors are at the 95W/100W level. This makes total power consumption numbers relatively processional, and it becomes interesting looking into how close each processor gets to its TDP.
In our testing, the X4 845 seems to go beyond its 65W TDP, pushing almost another 9W through our power meter. This is only 8W away from the X4 750K, which should be 35W ahead. However, it would seem that for the X4 845, P95 draws an extra 15W compared to OCCT, but for the X4 750K, it draws 10W less, showing how difficult it can be to retain consistency. It is worth noting that TDP ratings are difficult to interpret in this way - the processors coming out of the fabs will have a statistical variation to their operating voltage, and this differs between samples. A good sample of a high TDP compared to a bad sample of a low TDP might seem to generate an interesting story, however without having access to several dozen units it can be strained to draw many conclusions.
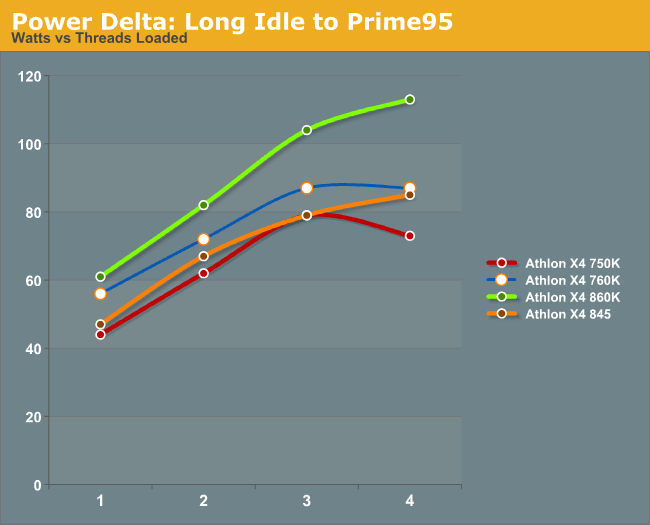
Looking at the Prime95 core-loading numbers, we see a similar pattern to what happened at 3 GHz, despite the X4 760K getting the same power reading for 3/4 core loading and the X4 750K actually decreasing in power with four loaded threads.
AMD Athlon X4 845 Overclocking
Unlike the other Athlon CPUs used as the main comparison points in this test, the X4 845 is not overtly designed for overclocking. It lacks the extra ‘K’ in its name, meaning that the CPU has a maximum limited multiplier, and the only way to adjust the frequency above the rated box speed is by adjusting the base frequency (100 MHz at default). We’ve detailed base frequency overclocking in a number of pieces in the past, both on AMD and Intel (such as the recent i3 overclocking debate), and there are a number of issues to consider.
Depending on the design of the platform, adjusting the base frequency has a knock on affect with a number of sub-systems. Typically speaking, adjusting the base frequency automatically adjusts the DRAM speeds as well, which would need to have its multiplier reduced to stay at its intended data rate. Adjusting the base frequency can also affect the chipset or PCIe lanes, pushing them out of specifications and leading to transmission errors due to the signal-to-noise ratio becoming worse, leading to corrupt data. Beyond this, as increasing the base frequency has these knock on effects, in some instances the voltage of these other components needs to be increased to compensate. It becomes a juggling act between frequency, voltage, temperature and stability very quickly. Despite this, some platforms can do it very well by implementing separate clock speed generators and compensation mechanisms, while others not so much – it depends on the design. Then there is the added factor of how close the processor is to the limit of overclocking to begin with.
At the top of this article we discussed the design for the Athlon X4 845. At its heart, using the Excavator microarchitecture and Carrizo cores, this is a processor that was originally designed for a laptop but placed into a desktop processor’s clothing. The design target for the family of processors was 15W total, and when you design a CPU to a certain power budget, there are compromises/techniques that can be done to make it more efficient at the target power rating. As you move away from that rating, either by frequency or voltage, the efficiency decreases. If you decrease it too much, you may find that at a given frequency, the performance or efficiency of the processor can be bested by an older generation part with a higher target power window – in this case, AMD’s slides suggested that a 35W Kaveri and a 35W Carrizo part would have similar efficiency characteristics. The Athlon X4 845 is a 65W processor, blowing past the 35W match up, but is only a couple of hundred MHz behind the X4 880K to begin with.
Being designed for 15W and running at 65W would typically be a problem – being so far outside the standard design window most likely means that the CPU is near the physical limit of what is possible for headroom and, depending on the voltage/frequency curve of the processor, could result in it being very warm. Nonetheless, we took a sledgehammer to crack an egg with our standard overclocking tests.
Methodology
Our standard overclocking methodology is as follows. For manual overclocks, based on the information gathered from previous testing, starts off at a nominal voltage and CPU frequency, and the base frequency is increased in steps of 5 MHz until the stability tests are failed. The CPU voltage is increased gradually until the stability tests are passed, and the process repeated until the motherboard reduces the multiplier automatically (due to safety protocol) or the CPU temperature reaches a stupidly high level (100ºC+). Our test bed is not in a case, which should push overclocks higher with fresher (cooler) air.
The testing software implements a single POV-Ray benchmark run, which typically catches memory errors or extreme CPU errors, and a five-minute blast of OCCT, which alternates between heavy and AVX loading. This should catch mathematical errors caused by low voltages.
Overclock Results
>>Insert Failure Here<<
To avoid confusion, I meant to put 'Insert Failure Here' at this point. It was a failure.
To go into a bit of my overclocking history, I’ve participated in local and global overclocking contests with a modicum of success, at one point reaching #2 in the world (if only for 36 hours or so) and coming runner-up in a couple of contests. It was my major hobby for a good period as a post-graduate, trying to extract the last bit of performance on a system that only needed to be stable enough to run the benchmark. But here, the Athlon X4 845 was not playing ball.
Going up in stages, overclocking to 120 MHz (35*120 = 4.2 GHz) went reasonably well, if only because voltage was being pumped in at a good rate and temperatures were approaching the high 80s. The memory was being adjusted accordingly to keep it around 2133 MHz. Moving higher than this was tough while still being reasonable with temperature - 121 MHz seemed to be a limit that passed the overclocking tests, but when I went for a benchmark run, it spectacularly failed during the benchmark script several times, even when the voltage was pumped up more.
I dialed the frequency back to 115, to see if it was just something odd, and the CPU also failed at this frequency, even though it had been stable before. I played around the voltage, both using what had passed at that level before and some more to ensure stability, but the gaming benchmarks were failing and a number of the CPU tests didn’t want to output results (or reasonable results). At 110 MHz, or 3.8 GHz for a measly 10% overclock, more CPU tests passed but still the GPU tests were failing.
So despite the stock frequency being absolutely fine, our CPU sample is pretty much a dud for overclocking. I really wanted to have a good 4 GHz stable to do some comparisons and scaling, but nothing really wanted to play ball for more than a few basic benchmarks. We did get a few results for 121 MHz, which I can show up here.
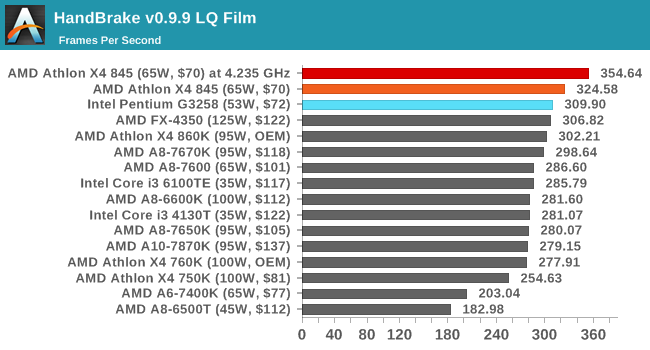
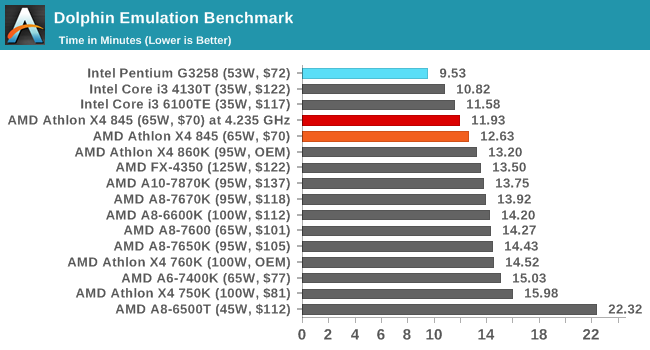
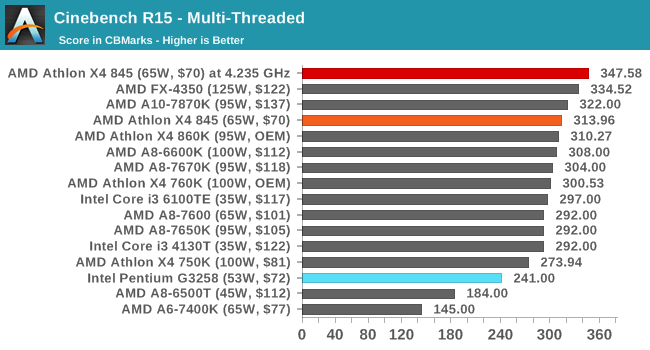
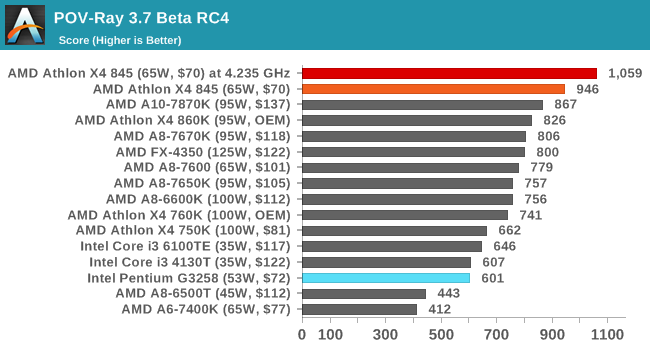
For the most part, CPU benchmarks went up 8-19% for a 21% overclock. However, stability was still a big issue, with some benchmarks only passing after a few reboots.
I clarified my results with a good friend over at JagatReview, who also participates on the world overclocking stage. The results on his samples were similar, with a 10-15% overclock coming out on the good side of average and a single sample going for 20% stable within reasonable temperatures. Unfortunately the ‘Your Mileage May Vary’ curse on the overclocking quality of AnandTech samples continues.
AMD's Desktop Future
For the last two years, AMD has slowly been feeding details about their next major CPU microarchitecture, Zen. A re-design from the ground up, and headed up by Jim Keller whose repertoire includes the AMD K8 microarchitecture and the Apple A4/A5 processors, Zen aims to bring AMD back to the mainstream and high end with a competitive product. Over the course of two years, we have heard that Zen will offer a 40% increase in instructions per clock (IPC) compared to Carrizo and feed consumer desktop parts all the way up to the extreme server market.
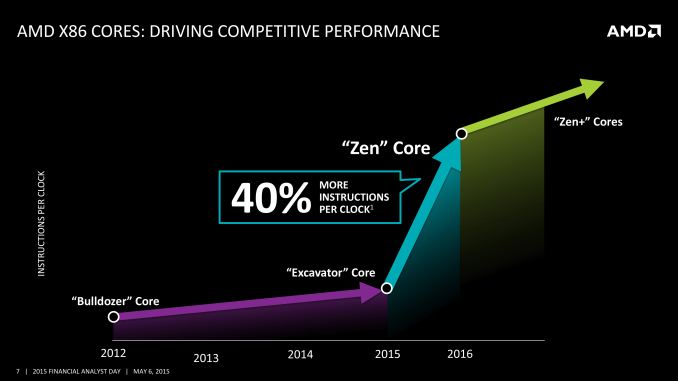
Needless to say, speculation has been rife about the composition, makeup, time-line and cost for the Zen microarchitecture. Some avid software users have been able to discern some of the microarchitectural features by following Linux kernel commits, whereas other users are blindly reposting faked slides despite the fact that they were debunked direct from AMD up to 18 months ago. For an outsider or someone new to following CPU microarchitecture design, it would be tough to follow what's going on with so much misinformation being reposted as fact and some users failing to do basic source checking. Let's tell you what we know, and how that ties in to this review about Carrizo.
Firstly, the big news is that AMD has already shown off an engineering sample of Zen at Computex, as well as showing a video rendered on Zen. At E3, the annual gaming show a week later, AMD went one further and showed an engineering sample running the game Doom (the 2016 version). At this point in time, AMD has working samples although not yet finalized.

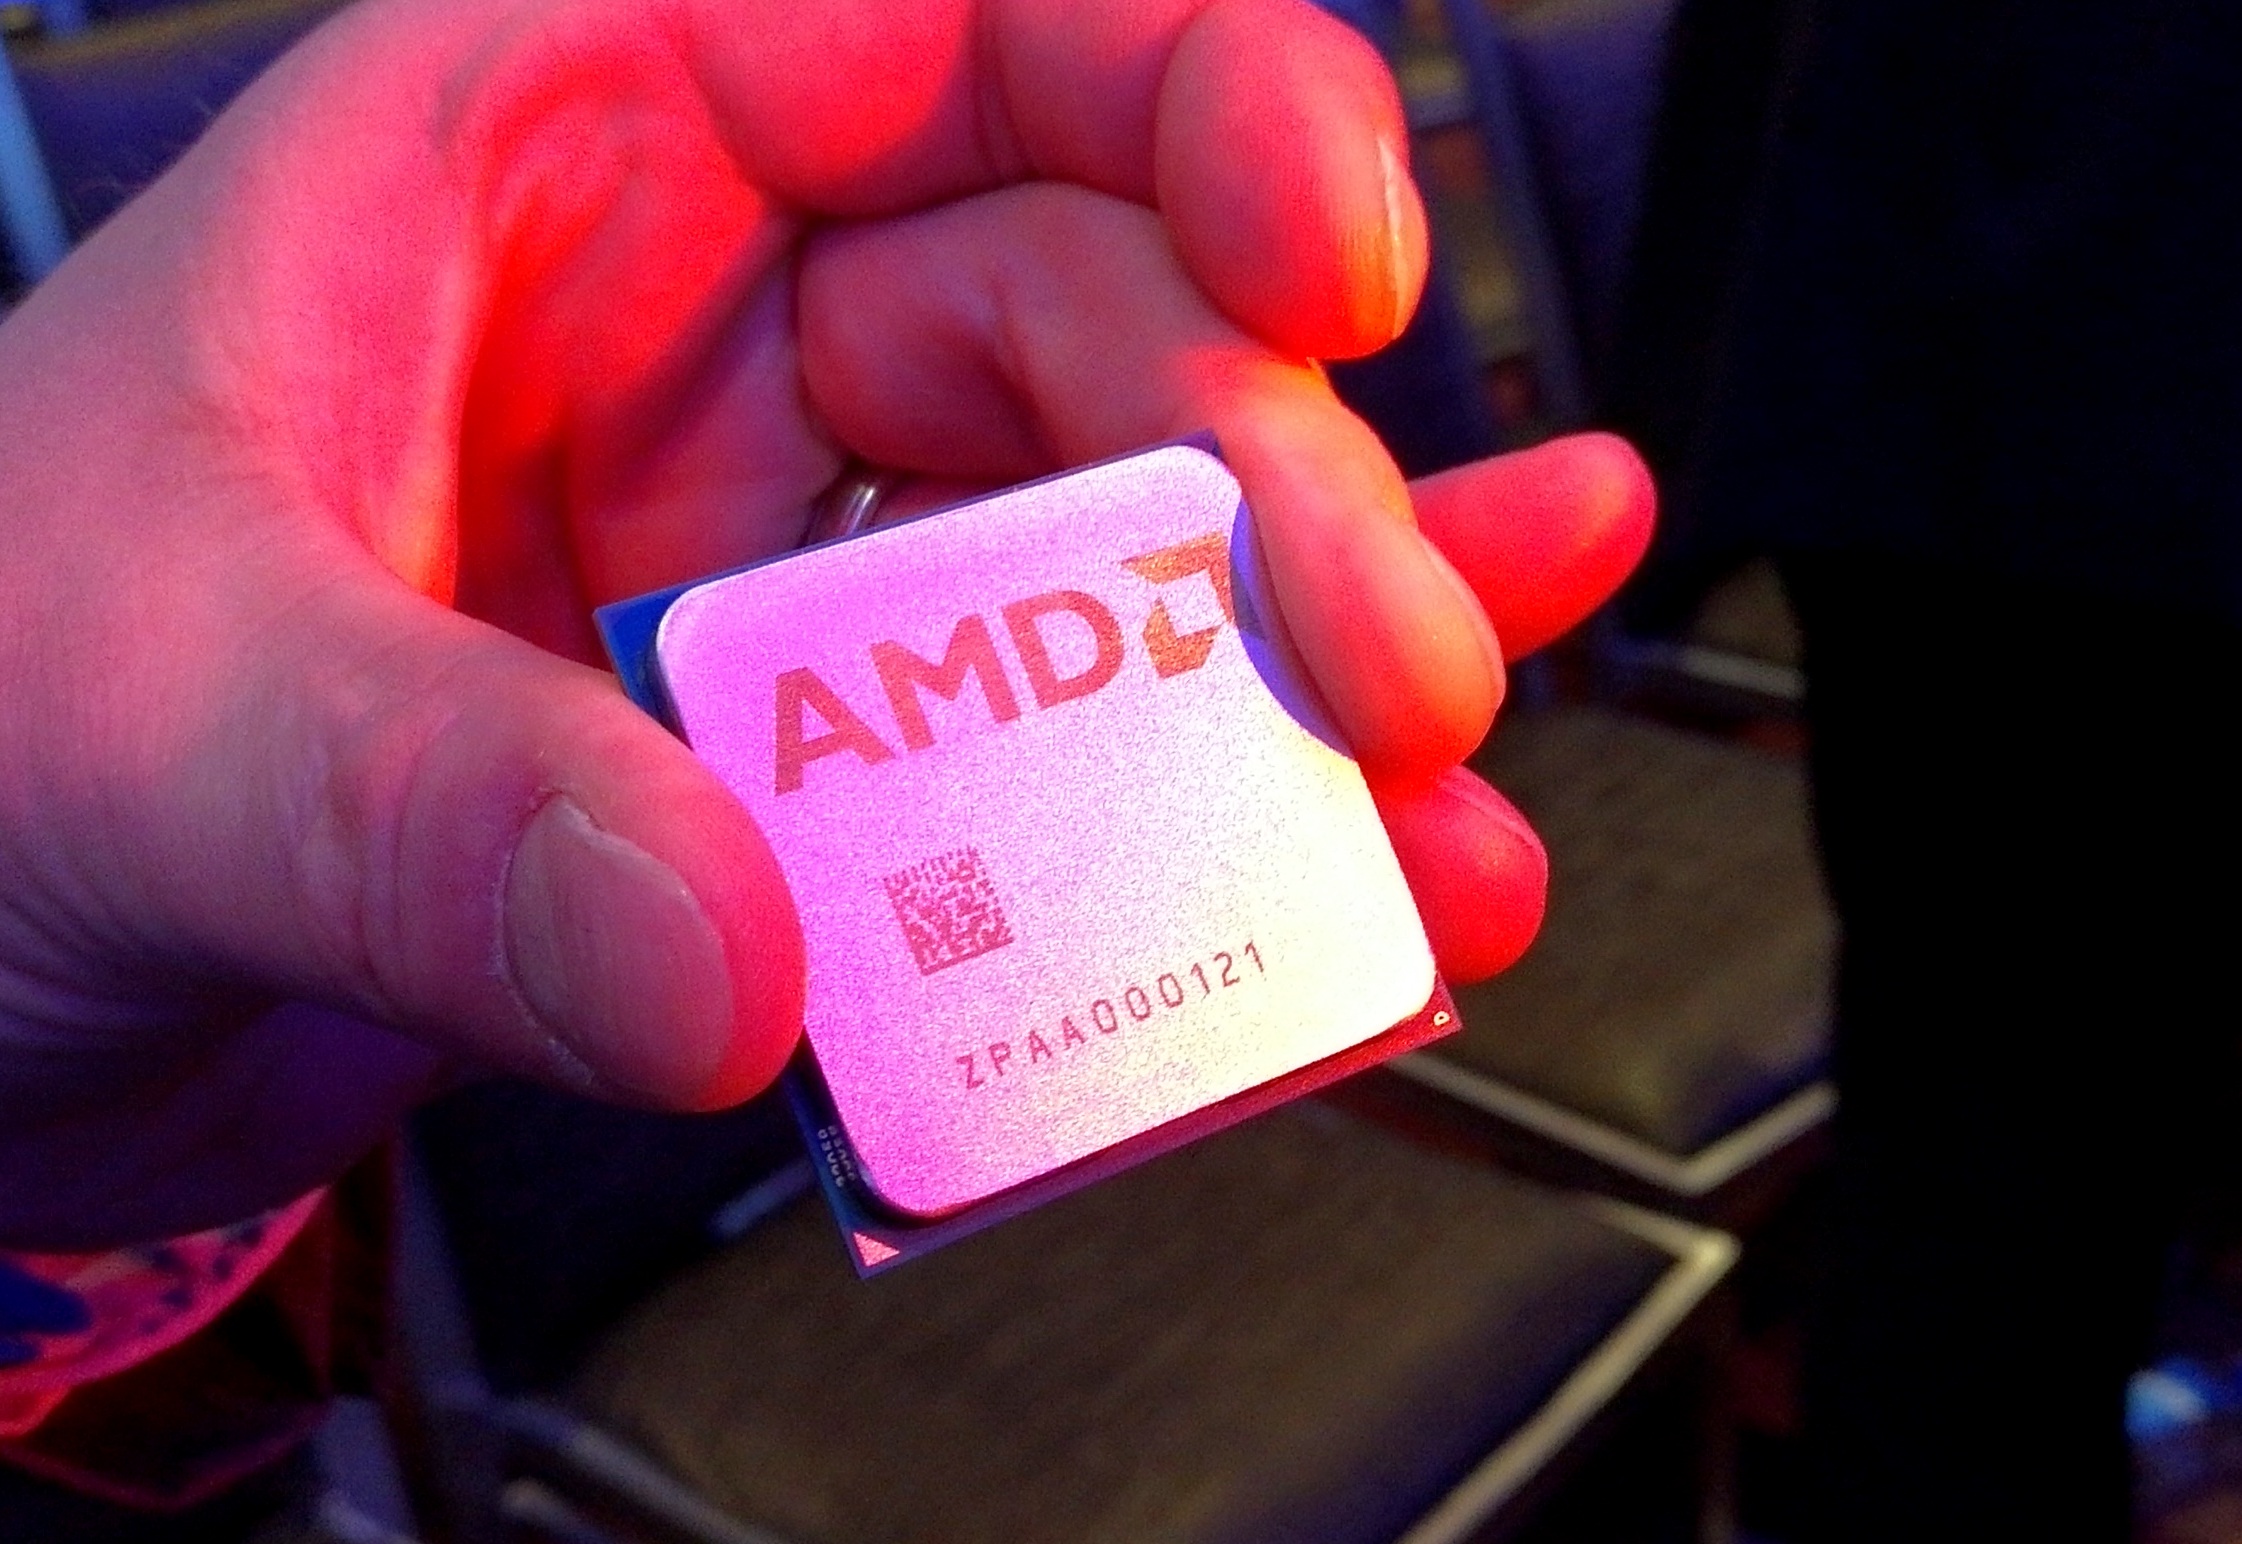
For clarity, hand was from AMD but not Lisa Su's
We know that Zen for desktop will be made at GlobalFoundries (GloFo for short) on a 14nm process node. This process is a modified version of Samsung's 14nm processes, which we've already seen in Apple's A9 SoC in the iPhone 6S as well as the Samsung Exynos 8890 in the Galaxy S7 (non-US). AMD, as part of spinning off their fab business to create GloFo several years ago, still had several contracts tying them into spending money at GloFo. These contracts were rearranged halfway through as AMD component sales stalled, and instead we refocused into GloFo research and development. The 14nm process, the new AMD 14nm Polaris and Vega GPUs, and Zen, will all be products of that deal.
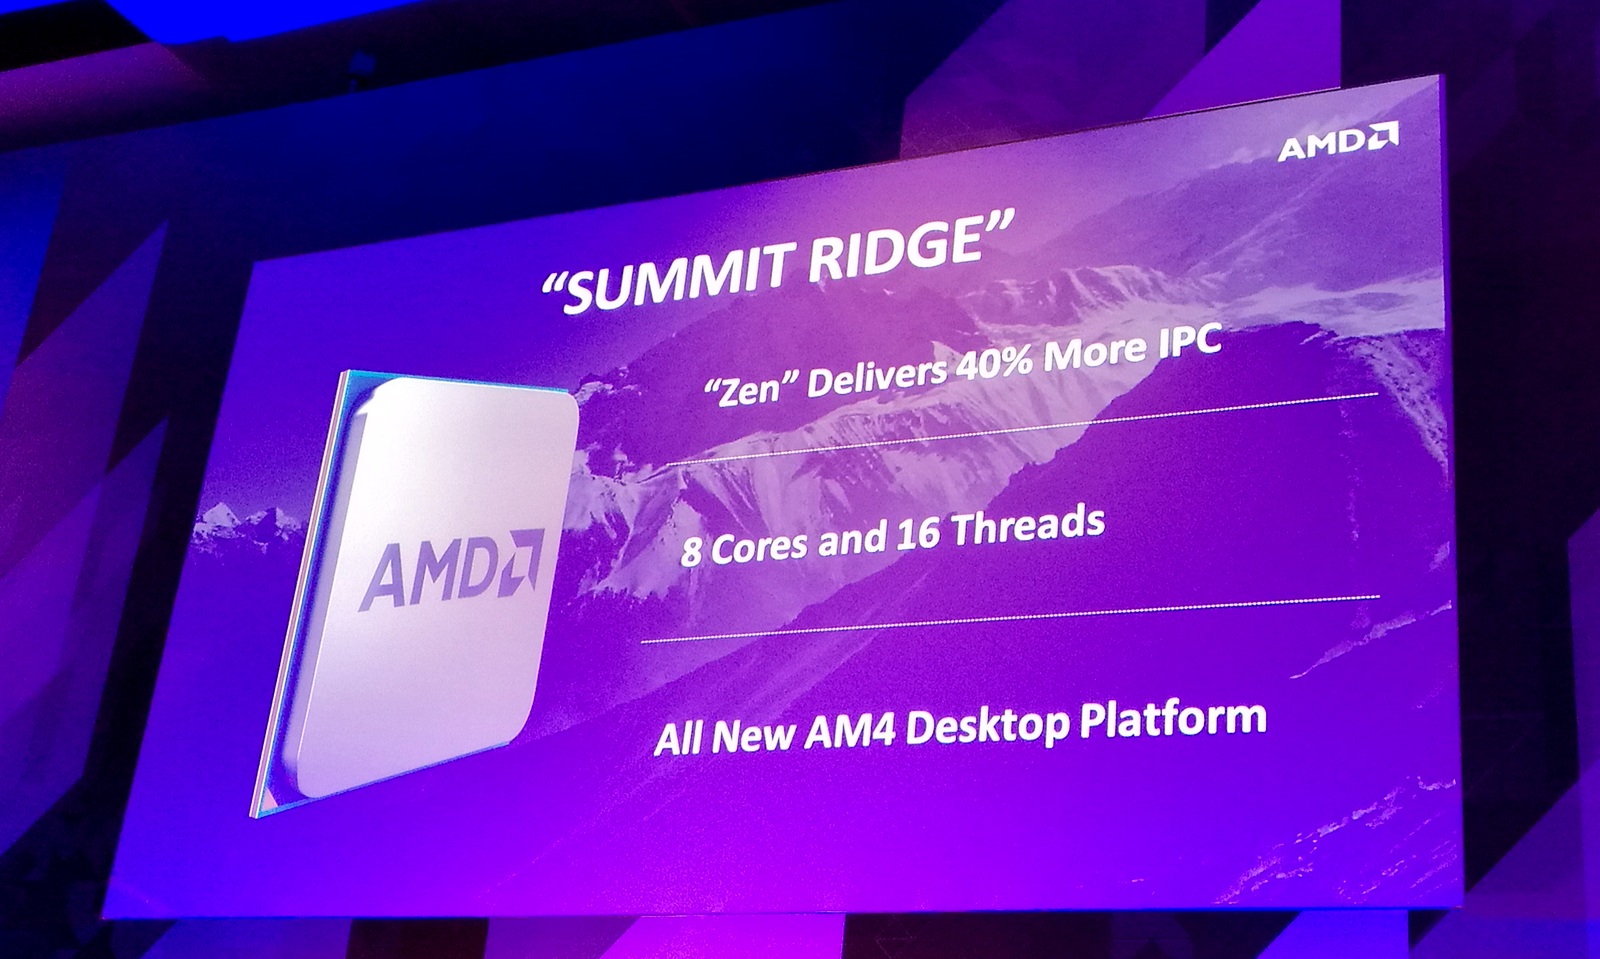
AMD's Zen-based processors, code-named Summit Ridge, will start life at the top of the AMD CPU processor stack, replacing the current FX-8000 and FX-9000 series, which are essentially 3-4 years old at this point. The first Zen product will use AMD's version of simultaneous multi-threading (SMT) and have up to 8 cores, 16 threads, in the AM4 socket. Similar to AM3 and FM2+, this socket will be a pin grid array with the pins on the CPU, however the number of pins is unknown at this point. When AMD were showing off the Zen-based CPU at Computex, we were not allowed to photograph the rear.
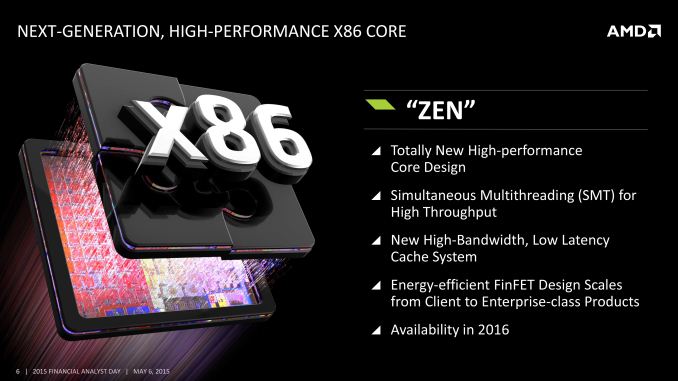
AMD has stated many times that Zen will be available within Q4, although some analysts are lead to believe that this applies to select partners and OEMs and we should expect full retail availability in Q1 2017, or January to March. In that time frame we have CES during the first week of January, which is a common target in years past for full processor launches. Given the nuances to AMD's new product, we suspect that there will be a semi-constant drip of information over the next few months to understand what is under the hood. It's either that or we get a full expose on launch day, which means a busy holiday season for anyone having to analyze it and write it all up.
There's More to AM4: Bristol Ridge and AMD's 7th Gen
It took me a while to realize, but as AM4 represents a new socket and platform for AMD's high-end processors, then AMD can't just launch Zen alone. AMD has stated that AM4 will cover both the mainstream and high-end desktop product lines, and as a result there has to be something in the mainstream segment to fulfill that role. Back at Computex, AMD announced the thing to fill that hole: Bristol Ridge (and Stoney Ridge by extension). This is what AMD will call and market it's '7th Generation' of APUs, and will be built on TSMC's 28nm Bulk CMOS process.
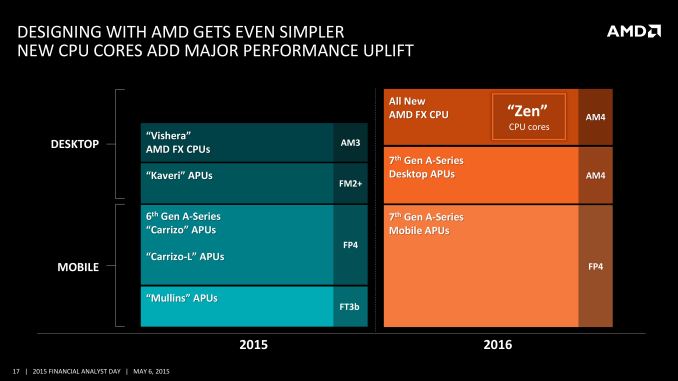
Under the hood, Bristol and Stoney Ridge will be near identical to Carrizo, by using similar but slightly updated Excavator microarchitecture underneath. We've been told that 'Excavator Mark 2' will feature an updated lithography process, which will extract more frequency and performance for a given power (or lower power at a fixed performance), 'Shadow P-states' which will adjust the voltage/frequency curve based on the quality and age of the silicon, and for notebooks there will be skin-temperature aware power management to provide longer boost frequencies with extra sensors connected over I2C.
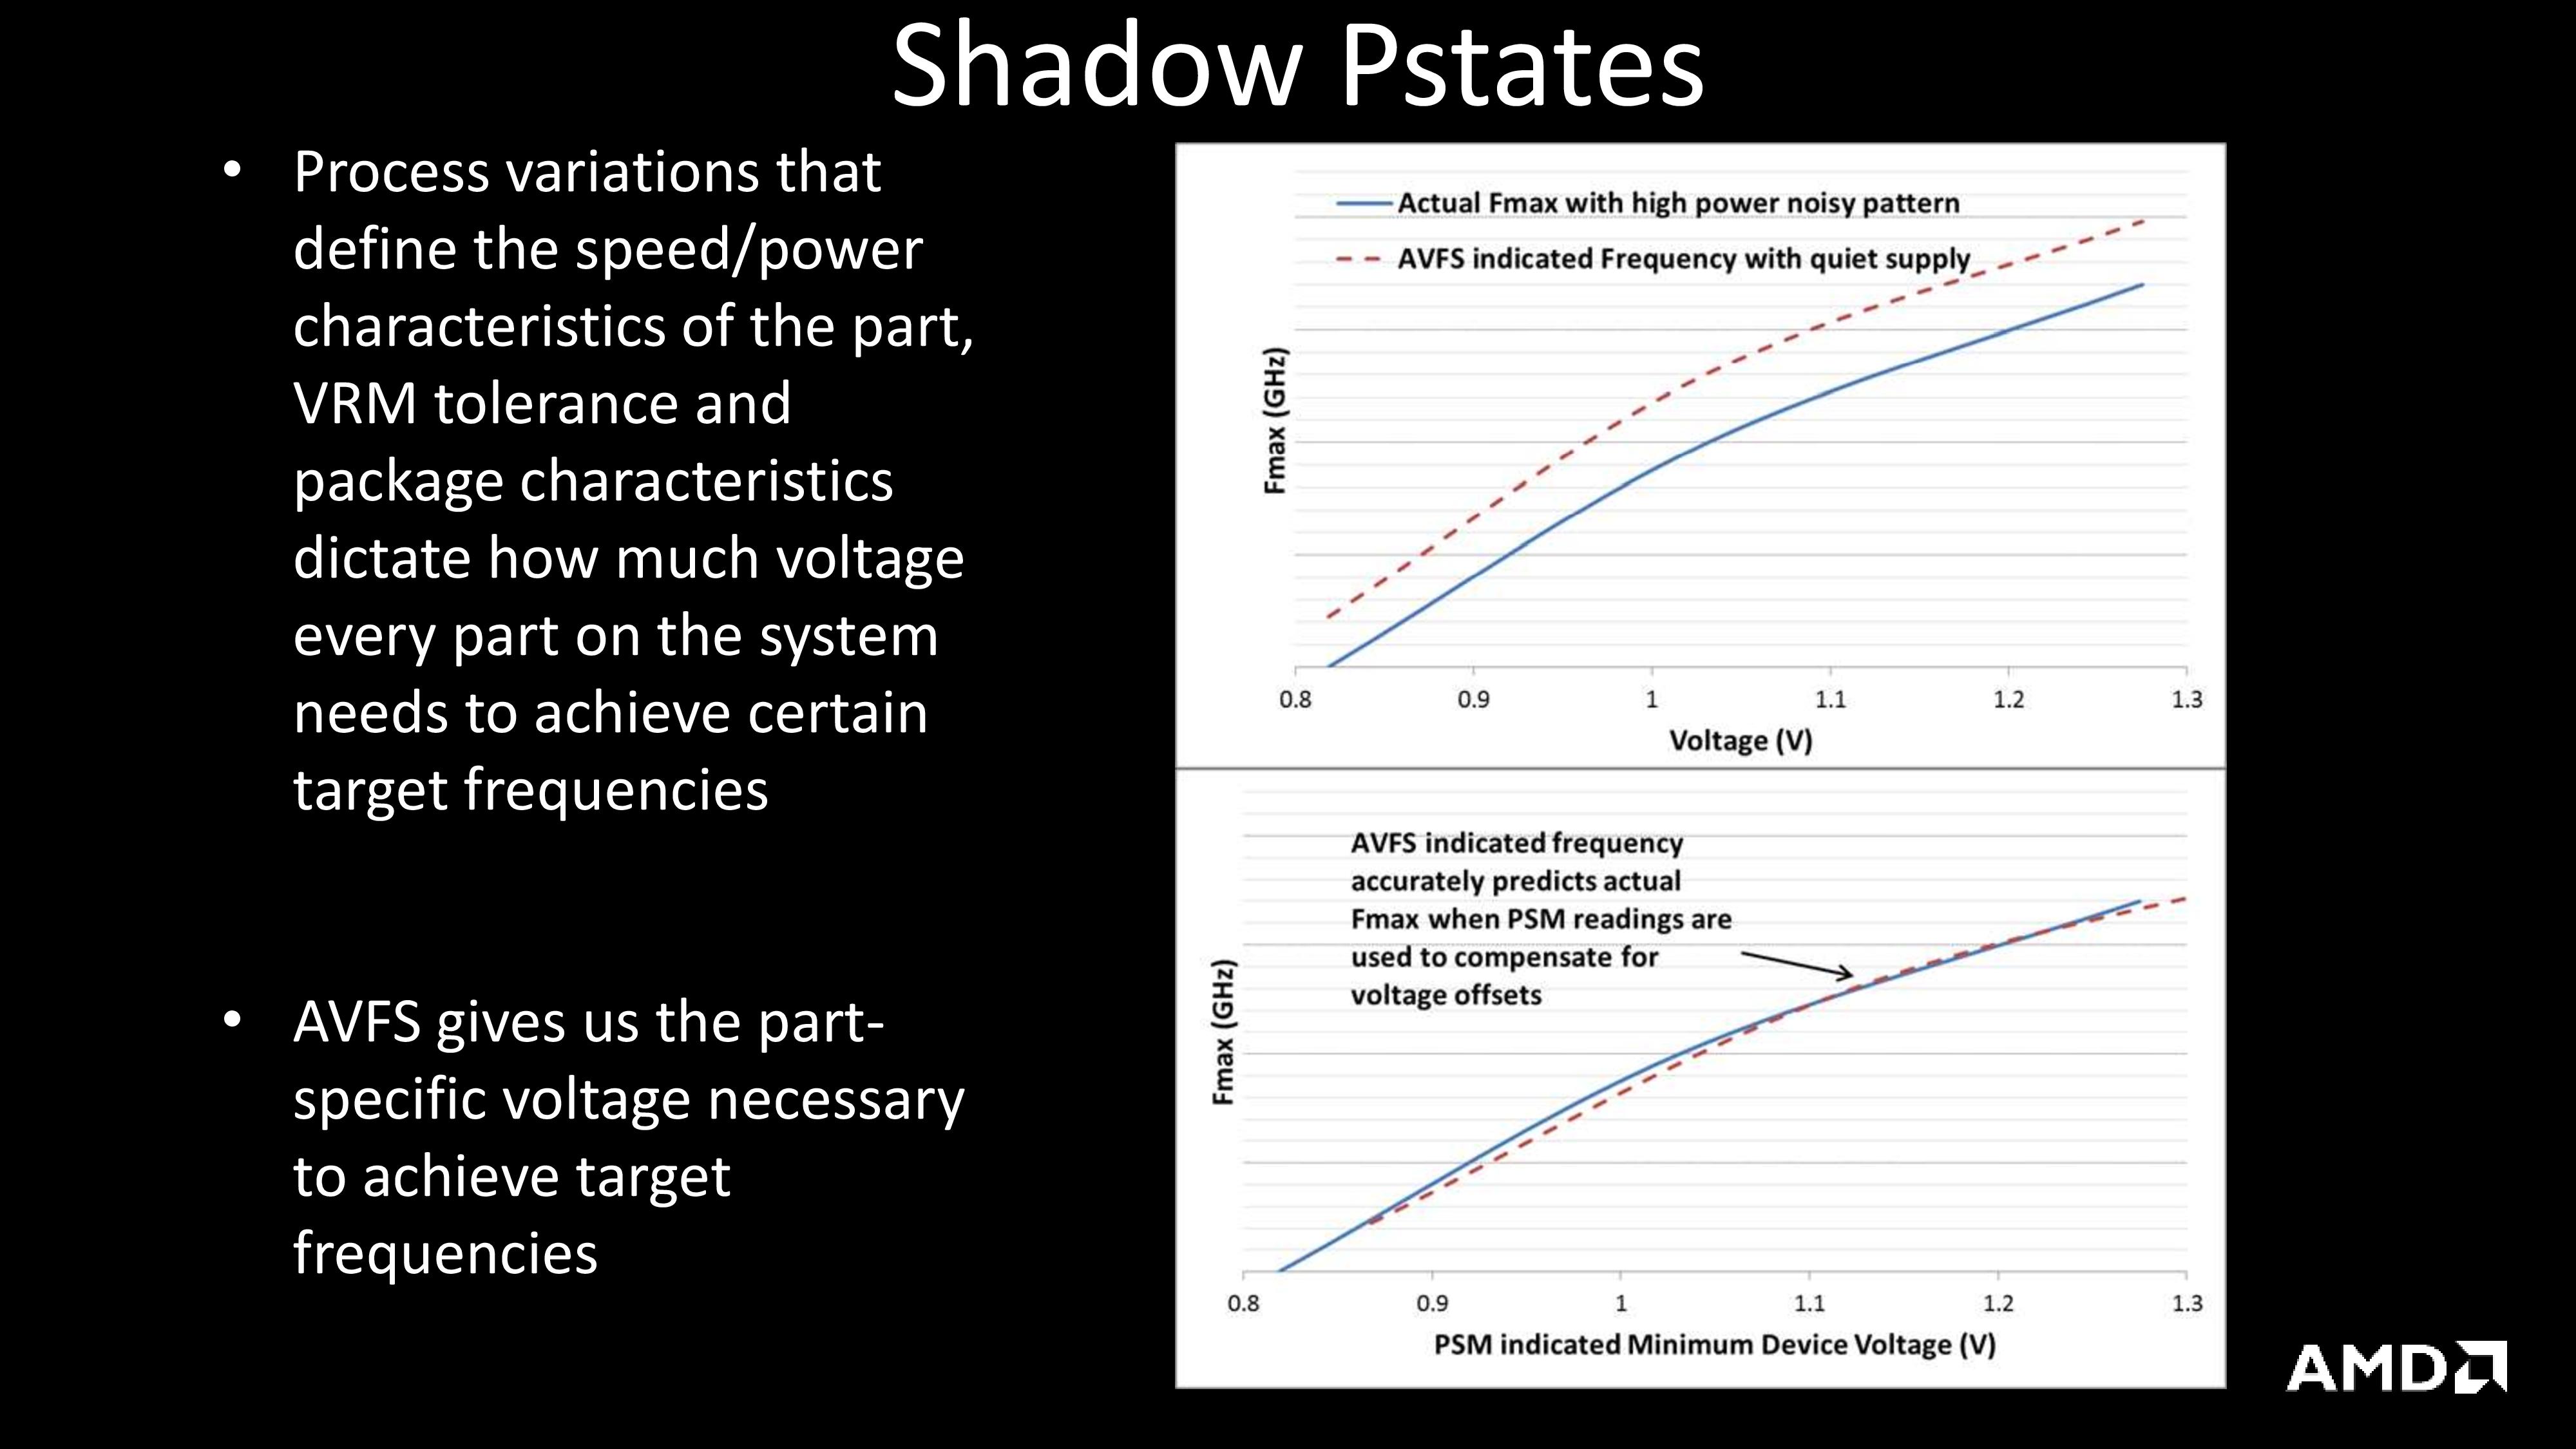
The biggest difference most users will notice is the movement to DDR4. We've already seen Carrizo with DDR4 on AMD's embedded line-up, the R-Series and G-Series announcement back in October 2015. While that was 'technically' Carrizo with DDR4, and while the new lines from AMD will be Bristol/Stoney Ridge with DDR4, we expect features and performance will be similar.
Bristol Ridge will feature AMD's dual-module designs, giving up to four cores, and will be up to 65W with TDP. Due to the nature of the CPU core design, this will probably be similar to Carrizo in the sense that 65W will be pushing the limits of efficiency in the design of the core, but AMD is confident that they can provide both a CPU and GPU in the same power budget and still be competitive in both performance and price for their intended markets. Chances are we will see Zen parts also in that 65W window, although that is pure speculation at this point. Stoney Bridge on the other hand is similar to Bristol Ridge, but with only one module. Both sets of *Ridge processors on the desktop (assuming Stoney comes to Desktop) will allow for dual channel memory. Both Bristol and Stoney on the notebook side are using GCN 1.2, and not the latest Polaris graphics, which would suggest (along with the 28nm node) that the desktop side will do something similar.
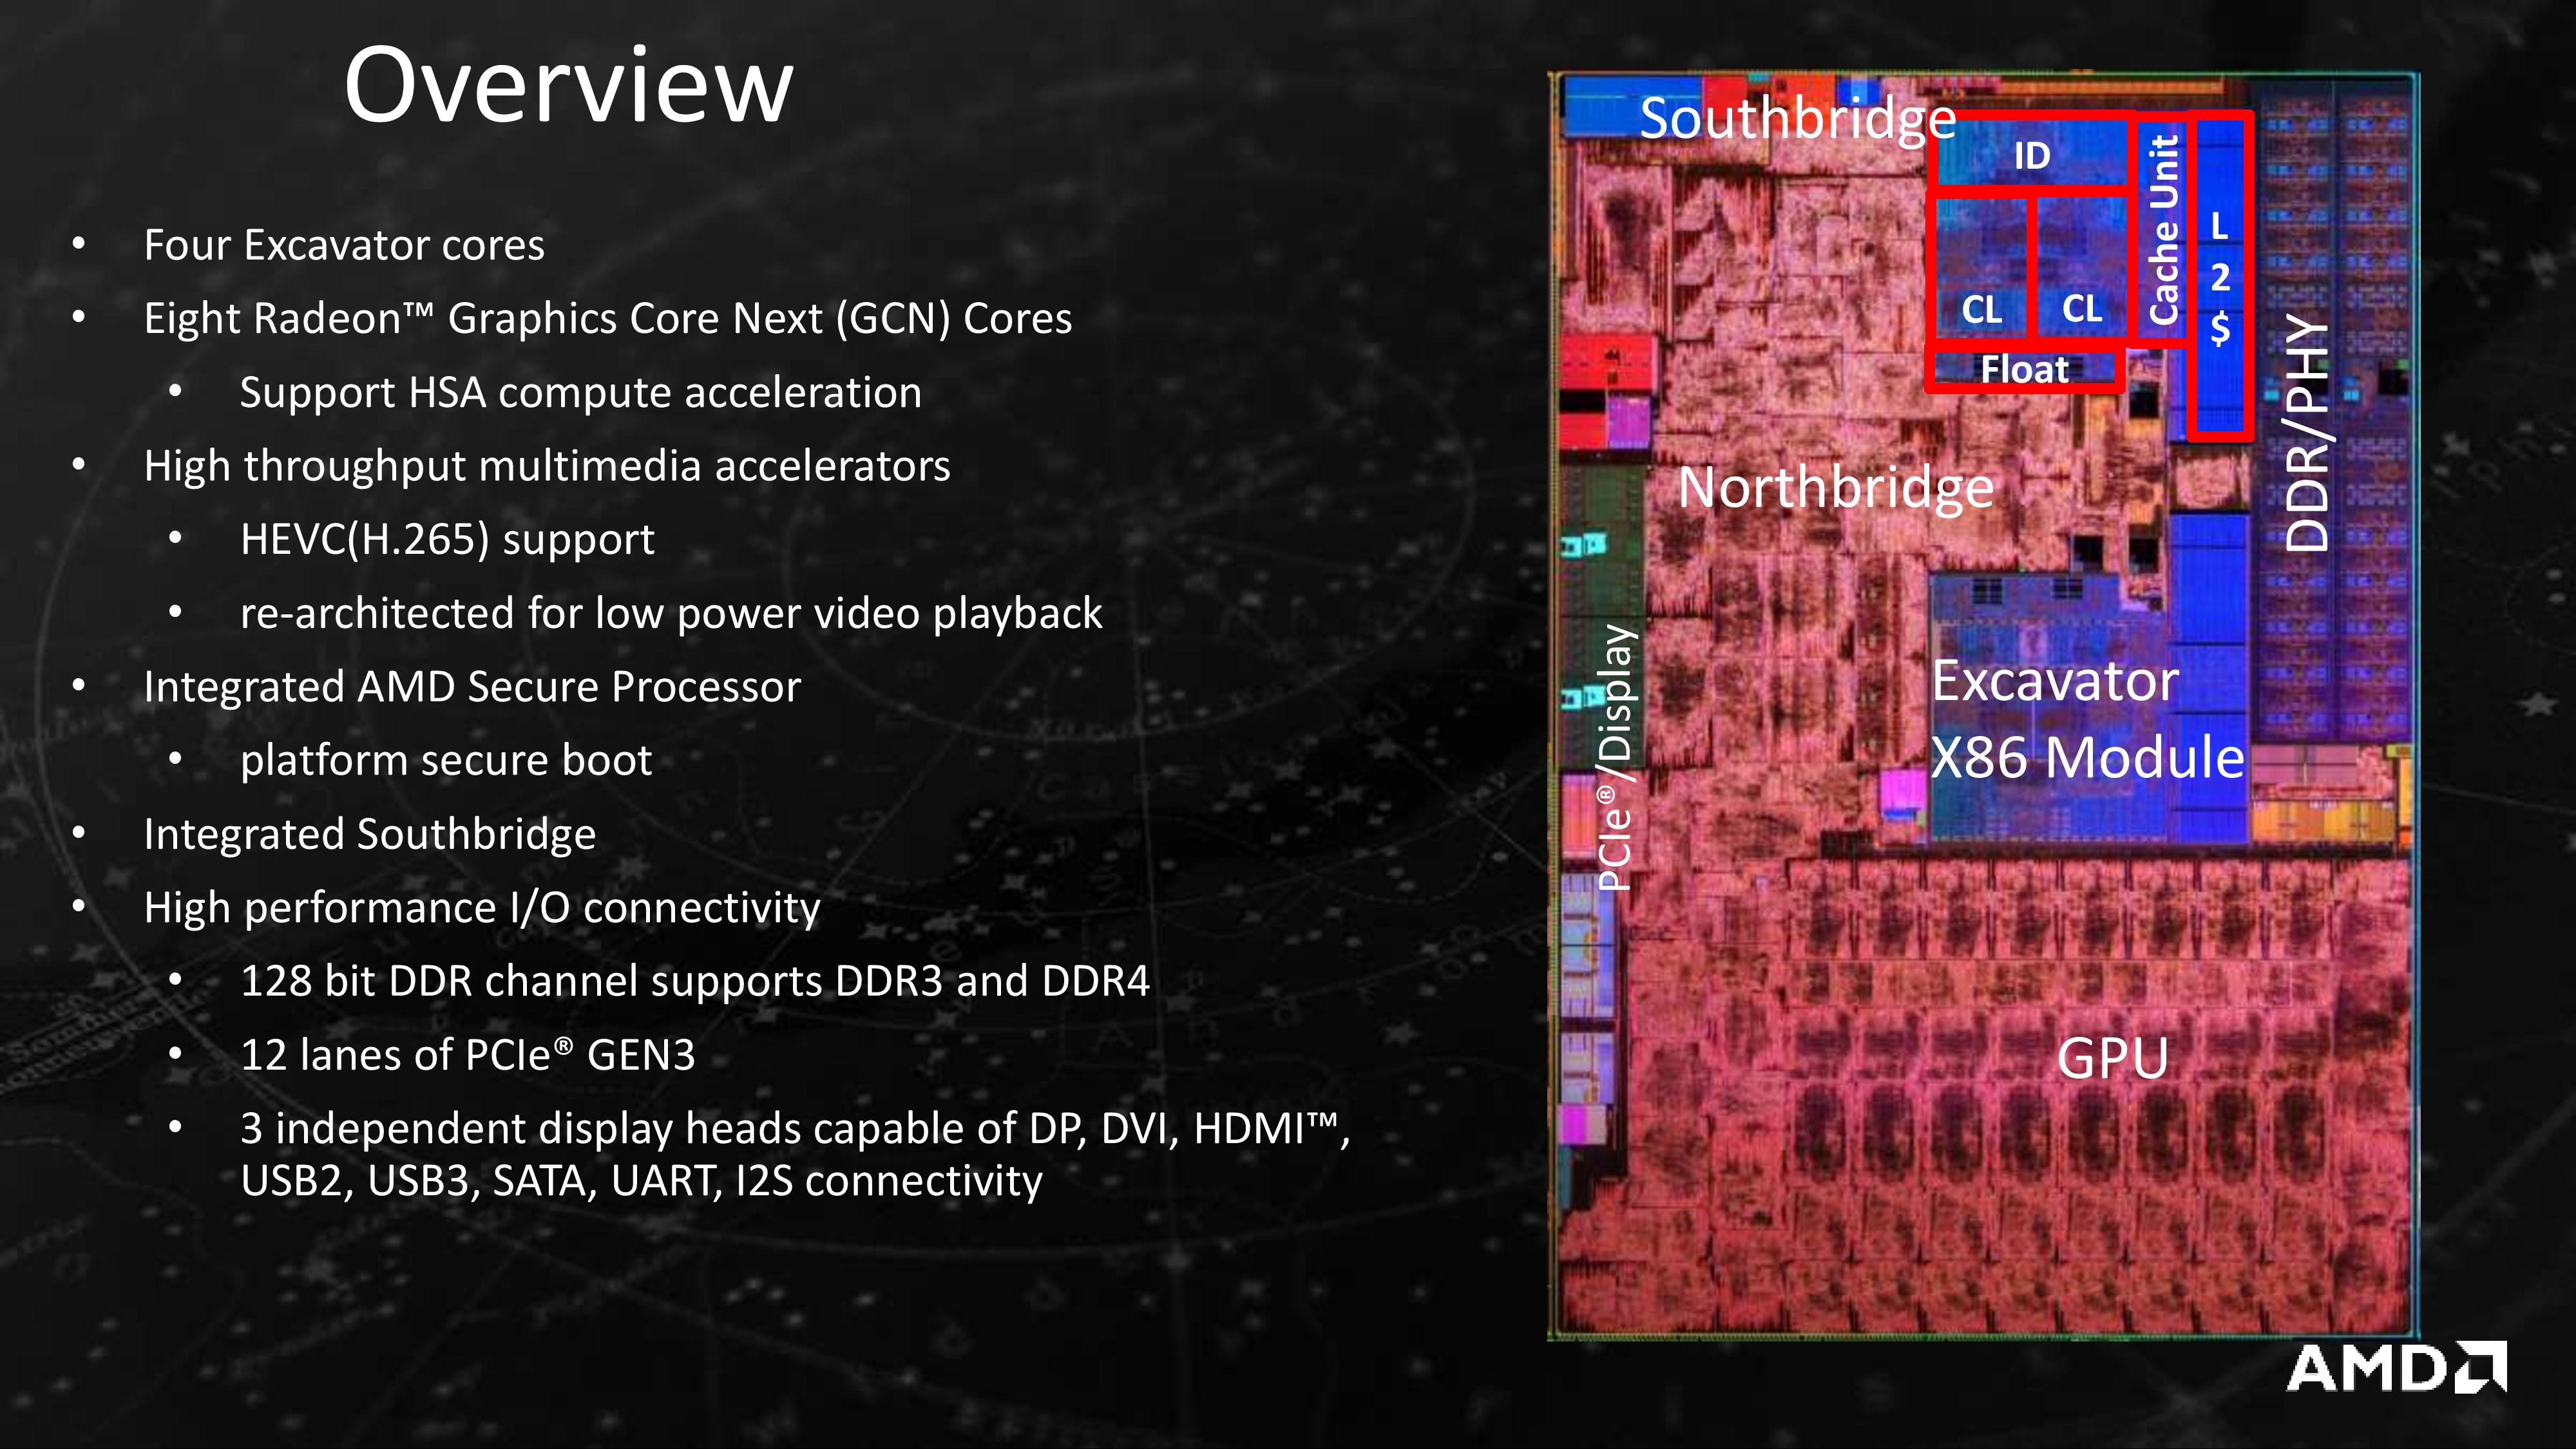
AMD's Bristol Ridge for Notebooks
Bristol Ridge and Stoney Ridge have already been announced for notebooks and laptops, and released in devices such as the new HP Envy x360. These parts vary from 15W to 35W TDP, and to improve the clarity as to the power of each processor, there is no overlap in configurable TDP and as a result the name of the processor should be a good indication as to the performance.
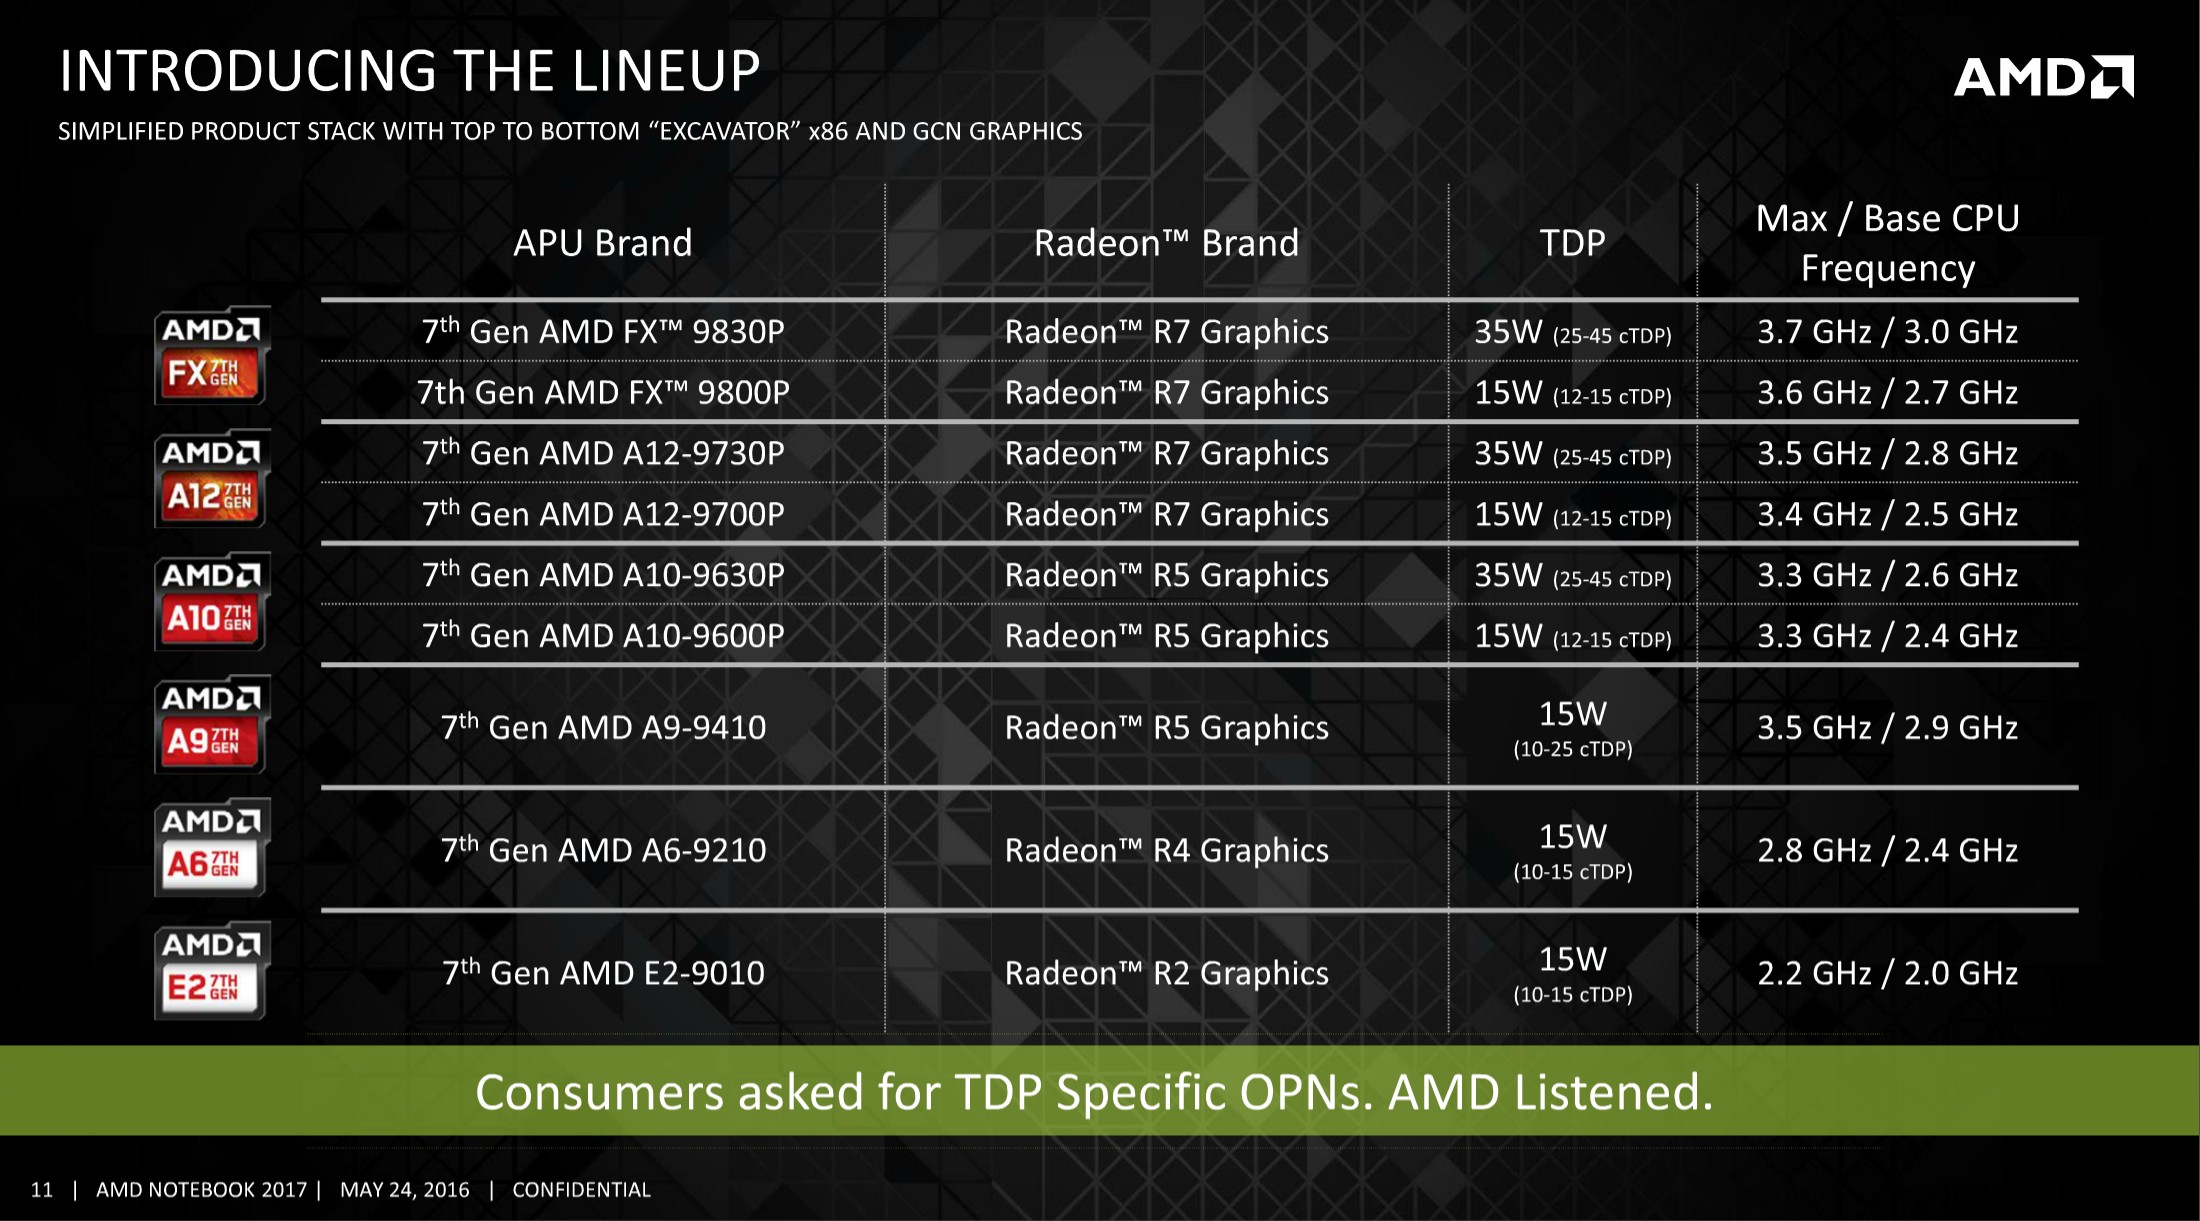
AMD's Bristol Ridge (FX/A12/A10) and Stoney Ridge (A9/A6/E2) Notebook SKUs
Moving back to the desktop, and we're still left with a few unanswered questions with regards to AMD's 7th Generation. Most users were imagining a summer release time frame for the initial parts, along with the launch of AM4 motherboards and chipsets. Normally if that was the case, we would see some indication at Computex that the boards were near-final. However, it is clear from talking to the motherboard manufacturers, and the fact that there were no motherboards in sight, that nothing was ready. This pushes the expected release date further back, which makes me wonder if Bristol Ridge and Zen will be released simultaneously so AMD can go full steam with the platform on day one.
There's also the matter of the chipset. Almost zero words have been mentioned regarding the chipset for the AM4 platform. Being the traditional motherboard reviewer means that chipsets are meant to be my bread and butter, but if nothing has been said, we do not know what to expect. What is the bandwidth rate from the CPU to the chipset? How many PCIe lanes are there? How many SATA drives are supported? How many M.2 drives are supported? Will there be anything extra special on board? Will there be more than one chipset for overclocking? Will only certain chipsets allow for SLI configurations? What is the power consumption?
So Should I Wait?
The timeline for Bristol Ridge and Zen is still very fluid. We know they are coming at the end of the year, we just don't know when, and how much they will cost, and if there will be any improvement. If we're talking about a direct comparison between the AMD Athlon X4 845 and the equivalent CPU-only based counterpart for Bristol Ridge, then we actually don't know. We don't know if AMD will continue to support the AMD Athlon line, or if there will be one launched on day one, or what the price will be. We don't know how low Zen will go for cost, and how that will perform either.
What we do know is that investing into the new AM4 platform will require a new motherboard and new DDR4 memory. The cost of DDR4 has almost matched that of DDR3, as well as support for larger memory modules, which is a plus, however the cost of the AM4 motherboard is an unknown. At present, an A88X based FM2+ motherboard can go from $69 for a micro-ATX GIGABYTE board to $134 for the ASUS A88X-Pro we used in this review. There are even some below ($65 for ASRock FM2A88X Pro3+) and some above ($159 for ASUS Crossblade Ranger), or if you really want a low-end chipset on an FM2+ motherboard then there are $40 models from the major manufacturers. There's no telling if AM4 will hit these price points on day one, or in what volume or specifications.
Consider this, however. Buying an A88X based Carrizo desktop today can allow for an upgrade to the top Kaveri Athlon X4 880K in the future, with a known budget and something that can do both office work and game at a level of performance consummate with its price. When the AM4 Bristol Ridge Athlons come out (if they are planning to), we expect generational improvements in performance (4-8%) at best, and it might not be worth waiting 4-8 months to get a similar percentage gain. But, buying it now means a user will have something to play on during the summer.
But, depending on what price Zen is being released at (and in what volume / the size of the early adopters tax), it might be worth waiting and saving to make the leap from low-efficiency mainstream to AMD's new high end platform. Save now, get a good cooler, 16GB of DDR4, a good GPU and an SSD all when the time arrives. Spend the summer working hard and save, ready for launch day. The games will still be here.
In this review, we took the newest member of AMD’s desktop processor line, the Athlon X4 845, and pitted it against similar comparison points dating back to the first Bulldozer based desktop processors for the mainstream segment. This new processor uses AMD’s latest microarchitecture, Excavator, to create Carrizo based cores. The Athlon X4 845 uses two Carrizo modules for four total threads, wrapped into a 65W thermal design power window, and would appear to be the only Carrizo based processor AMD is going to release for the FM2+ socket.
The Athlon X4 845 is actually a dressed up laptop processor, modified for the desktop platform. As a result we only get 2 MB of L2 cache rather than the 4 MB for all of our comparison points, but also there is only eight PCIe 3.0 lanes rather than sixteen, which can also have some knock on effects. In this review we wanted to do a direct performance comparison, clock for clock, between the new processor and the older processors. However, some of the design decisions made above the core logic have had an impact in results.
Know Your Comparison
Typically in a review like this, we talk about IPC or ‘instructions per clock’. This is a measure of how efficient the processor is at processing instructions – either a fixed set of instructions in a quicker time or more instructions in a fixed time. There are two main components to the core design that play major roles: the front/back end that actually performs the calculations, and the memory sub-system that provides the data for calcualtions. In order to get the peak IPC for a given test, both of these components need to be running near their limit or be able to compensate if waiting for the other. However, this is often test dependent – some probe the logic more than the memory, and for others the reverse is true. It depends on what you are testing.
In most circumstances, generational processor updates have similar or improved memory sub-system arrangements which makes most comparisons in IPC directly related to the logic in the core. When we compare the Excavator design to Steamroller or Piledriver however, the memory sub-system has changed for better and for worse in our benchmark suite. This makes comparisons between the two sets of core logic difficult, as the memory plays a significant part in the performance. This is wholly benchmark dependent as well. A number of professional benchmark tests are designed specifically to either test one or other of the two segments, so it becomes really important to consider what each benchmark is doing in every case. When doing a good analysis, we can determine if the core-logic has improved (either the processing latency, scheduler, prefetch or other), or if the memory subsystem is the main catalyst for improvements.
That being said, users cannot buy one set of core logic with a different memory sub-system. They come in complete packages, and as a result the full top-down result might only of interest for users wanting to buy today. This requires both the core and the memory to work together to give better performance, so it can be striking if decisions are made to affect that. It also pains both the reviewer and the user if in fact something like the memory sub-system comes in different flavors, depending on how much is spent or if the manufacturer is just trying to sell excess parts.
The March on IPC
Nonetheless, time for the conclusions to this review. Here are the main processors we tested:
| AMD CPUs | ||||||||||||
| µArch / Core |
Cores | Base Turbo |
TDP | DDR3 | L1 (I) Cache |
L1 (D) Cache |
L2 Cache |
|||||
| Athlon X4 845 |
Excavator Carrizo |
4 | 3500 3800 |
65 W | 2133 | 192KB 3-way |
128KB 8-way |
2 MB 16-way |
||||
| Athlon X4 860K |
Steamroller Kaveri |
4 | 3700 4000 |
95 W | 1866 | 192KB 3-way |
64KB 4-way |
4 MB 16-way |
||||
| Athlon X4 760K |
Piledriver.v2 Richland |
4 | 3800 4100 |
100 W | 1866 | 128KB 2-way |
64KB 4-way |
4 MB 16-way |
||||
| Athlon X4 750K |
Piledriver Trinity |
4 | 3400 4000 |
100 W | 1866 | 128KB 2-way |
64KB 4-way |
4 MB 16-way |
||||
The main points of comparison are the caches: the AMD Athlon X4 845 has a double-size L1 data cache with an improved prefetch, but a half-size L2 cache, compared to the Kaveri based X4 860K. It is worth noting that we were not able to source 65W parts to match the X4 845, however one of the most poignant results out of the testing is our IPC performance analysis table after the 3 GHz testing. We set all the processors to 3 GHz, with maximum official supported memory for each, and it went a bit like this:
| AMD Average IPC Increases | |||||||
| Benchmark Suite | Richland over Trinity | Kaveri over Richland | Carrizo over Kaveri | ||||
| Real World | 0.8% | 8.0% | 8.8% | ||||
| Office | -0.1% | 11.1% | 4.1% | ||||
| Legacy | 0.1% | 11.8% | 8.5% | ||||
| Overall Windows |
0.3% | 10.3% | 7.3% | ||||
| Linux | 10.4% | 10.5% | -12.1% | ||||
| Gaming | -0.4% | 12.5% | -5.8% | ||||
The AMD Athlon X4 845 is a Janus-like product: powerful, yet two-faced. In practically all of our Windows based CPU benchmarks, it scored increases over the previous generation in most part due to the larger L1 data cache but also the improved logic.
The benchmarks that required more memory, such as Agisoft or WinRAR, saw minor decreases, which could be predicted before we started.
However, two major segments saw significant decreases in performance. For our Linux tests, most of these were highly memory sensitive. NPD and NAMD are both scientific matrix solvers, requiring lots of memory accesses, and Redis is a key-value load store known to be highly cache size and latency sensitive – this bought these results down.
The gaming side of the equation is a different story, and the results were fairly consistent across all benchmarks and all GPUs: the X4 845 performs worse than the X4 860K clock for clock. There are two ways to attribute this, as mentioned above: PCIe 3.0 x8 and 2MB of L2 cache. Given previous experience with PCIe lane bandwidth requirements resulting in only a tiny difference in performance, it would seem that the latter has more of an effect on gaming (at this level of CPU power) than one might expect. It means a 6% decrease in performance when clock speeds are identical compared to Kaveri, but still ends up 5% over Trinity and Richland.
Wanting The Full Package
The AMD Athlon X4 845, as mentioned earlier in the review, is outside the regular efficiency range for the Carrizo core design. It was designed to be operated at 15W for the total chip, or 35W for the high power mode. AMD even noted in their slides that at 35W, the Carrizo and Kaveri designs would be similar for efficiency. So to push it to 65W would suggest that Kaveri might even be ahead, given the wider window that Kaveri was designed for. The result of pushing Carrizo to 65W means that there is no integrated graphics, and the frequencies are near but below the competing Kaveri parts, and overclocking is next to zero. What Carrizo relies on is the microarchitectural advances more than anything else.
Our new Athlon, at $70 launch price, competes mainly against the Intel Pentium G3258, known as the overclockable Haswell-based dual core Pentium that was launched for $72. Depending on the retailer, the time of day, how the wind is blowing, or what sale is on, these prices can be as low as $50, along with other Athlon and Pentium processors. The typical price/performance metric becomes more focused on just the performance in this case, and the battle between the two trades blows.
In single threaded environments, the G3258 wins out hands down, by having a 25-50% performance advantage despite having lower clock speeds.
However, due to having four threads rather than two, the X4 845 wins in any fully multithreaded test, particularly for heavy workloads such as video encoding. The G3258 lacks accelerated AES encryption as well, meaning the X4 845 gets a result 800% higher in that case.
Where the waters are muddied is in variable threaded workloads, or memory dependent workloads. The Pentium has larger and quicker caches, meaning that it can take the lead in some multithreaded workloads. But taking into account some benchmarks, like Google Octane, the difference is minimal:
When it comes to gaming, it depends on which benchmark/configuration you choose, but for GTA and GRID, when the Athlon is paired up with an AMD graphics card, the Athlon wins, but with an NVIDIA graphics card, the Pentium wins. For Shadow of Mordor and Alien Isolation however, the higher IPC for the Intel processor wins out no matter which GPU is used.
Carrizo, 7th Generation and the Future
When we benchmarked a number of laptops using Carrizo processors, and compared them to a Kaveri laptop, we could instantly tell that the Carrizo microarchitecture was a sufficient jump in the mobile space for performance and power, as long as OEMs would actually use dual channel memory. This was bolstered by the fact that any graphics tests relied on the integrated GPU, which saw enhancements with the new design as well. On the desktop side of the equation, the results are less clear cut. Here we have a microarchitecture with good performance characteristics for compute, but it gets let down in discrete gaming. Moreover, the competition provided by the Pentium G3258 is hard to ignore. The fact that the two processors, at stock, performed similarly for web use is an interesting element in our testing for sure.
AMD’s future will be with Bristol Ridge, using an updated Excavator microarchitecture, and the new line of high-end processors using Zen cores. Both of these are slated for the tail end of the year and/or Q1, anything from 4-8 months ahead. Is it really worth investing in a Carrizo (or Pentium) platform now only to find it has been passed later in the year? While it’s an interesting question, in my opinion it’s probably the wrong question to ask.
Bristol Ridge, using the updated Excavator core, is likely to perform similarly (within single digit %) of Carrizo in raw performance, but it will also have DDR4 and new chipsets to help deal with things like PCIe SSDs, NVMe, upgraded Ethernet and new features (features unknown at this point). For some users, especially building simple machines that just need base storage and some oomph, that will not matter much. If you are a user that slowly upgrades over time (by buying one big upgrade every now and again rather than a full system replacement), then going in for Carrizo (or Kaveri) now should be par for the course. The interesting element is whether to go for Kaveri (X4 880K) or Carrizo (X4 845), especially if the difference is only $20.
Carrizo comes with AMD’s new 95W near-silent cooler, whereas the X4 880K uses the new 125W solution. If the difference is only $20, pitch for the faster Kaveri every time. What you lose in microarchitecture will be made up by frequency and overclocking ability.
If you want to make that jump from Athlon to Zen, from mid-range to AMD’s high-end, then it might be worth investing a summer to earning more for a future system. Even if Zen doesn’t pan out completely (most users have their fingers crossed that Intel will have some competition at last), a bigger system with more storage or a better graphics card is never a bad thing.
Ultimately, the X4 845’s main let down, for gaming at least, would seem to be that 2 MB of L2 cache, and the base processor design aiming at 15W. Bristol Ridge is also aimed around 15W, and should come in 65W flavors (with integrated graphics), and it will be interesting to see what level of cache it has compared to the mobile counterparts.
| AMD CPU L2 Cache Levels | ||||
| Core | uArch | Cores | L2 Cache Mobile | L2 Cache Desktop |
| Excavator v2 | Bristol Ridge | 4 | 2x1 MB, 16-way | ...? |
| Excavator | Carrizo | 4 | 2x1 MB, 16-way | 2x1 MB, 16-way |
| Steamroller | Kaveri | 4 | 2x2 MB, 16-way | 2x2 MB, 16-way |
| Piledriver v2 | Richland | 4 | 2x2 MB, 16-way | 2x2 MB, 16-way |
| Piledriver | Trinity | 4 | 2x2 MB, 16-way | 2x2 MB, 16-way |


