Original Link: https://www.anandtech.com/show/10328/the-toshiba-ocz-rd400-pcie-ssd-review
The Toshiba OCZ RD400 (256GB, 512GB, 1TB) M.2 PCIe SSD Review
by Billy Tallis on May 25, 2016 8:02 AM EST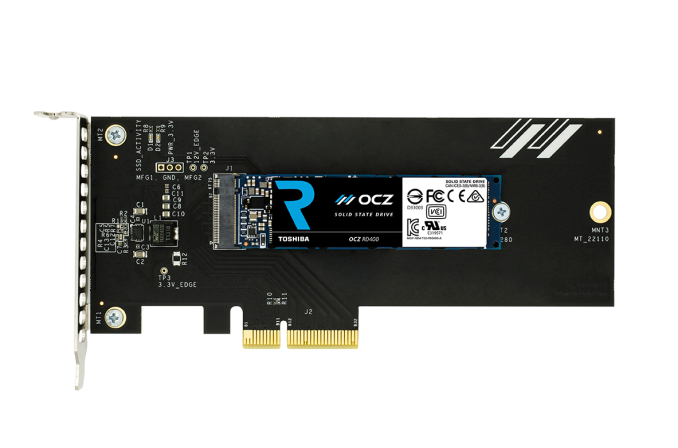
Having recently assimilated OCZ and turned it into an enthusiast-oriented consumer brand, Toshiba has released their first M.2 PCIe SSD into the consumer market. Initially previewed by OCZ as the RevoDrive 400, the new OCZ branding scheme shortens it to RD400. This is the first RevoDrive/RD product with a native PCIe SSD controller and the first PCIe 3 SSD from OCZ.
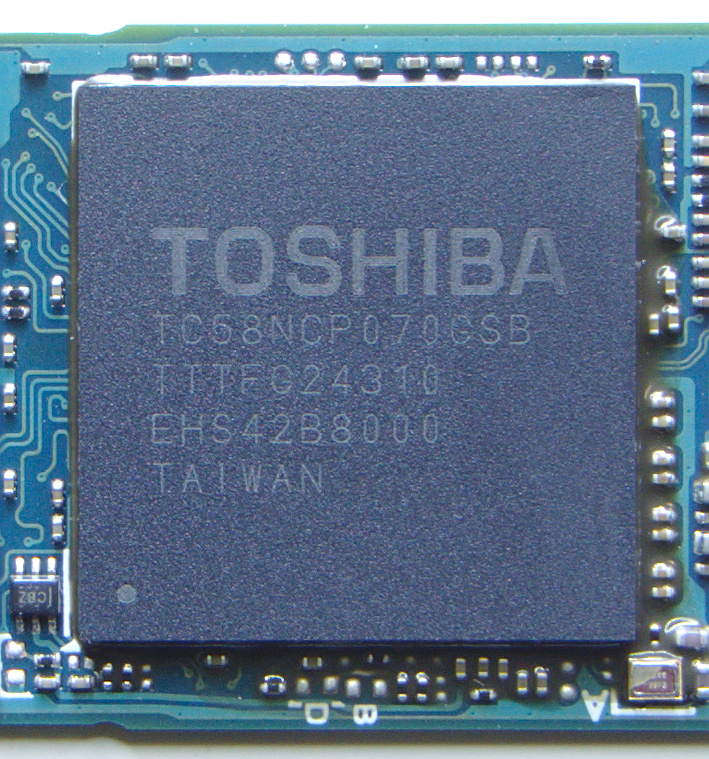
The RD400 uses Toshiba 15nm MLC and a Toshiba-branded controller that we know almost nothing about. Given how the Toshiba-branded controller in the Trion/TR drives seems to be based on the popular third-party Phison S10, we suspect the RD400 may be using a controller that is also based on a third-party design, most likely the Marvell 88SS1093. Our first look at what would become the RD400 showed that it wasn't the OCZ Jet Express controller, and if Toshiba had another entirely in-house controller that could compete at this level they would probably be talking it up more. The Marvell 88SS1093 is an 8-channel 3-core controller with performance specifications that are similar to the RD400.
Whatever the source of the controller, it makes for a far simpler design than the RAID controller and multiple SandForce SSD controllers used in previous RevoDrive SSDs, and it makes the M.2 form factor an option for the first time.


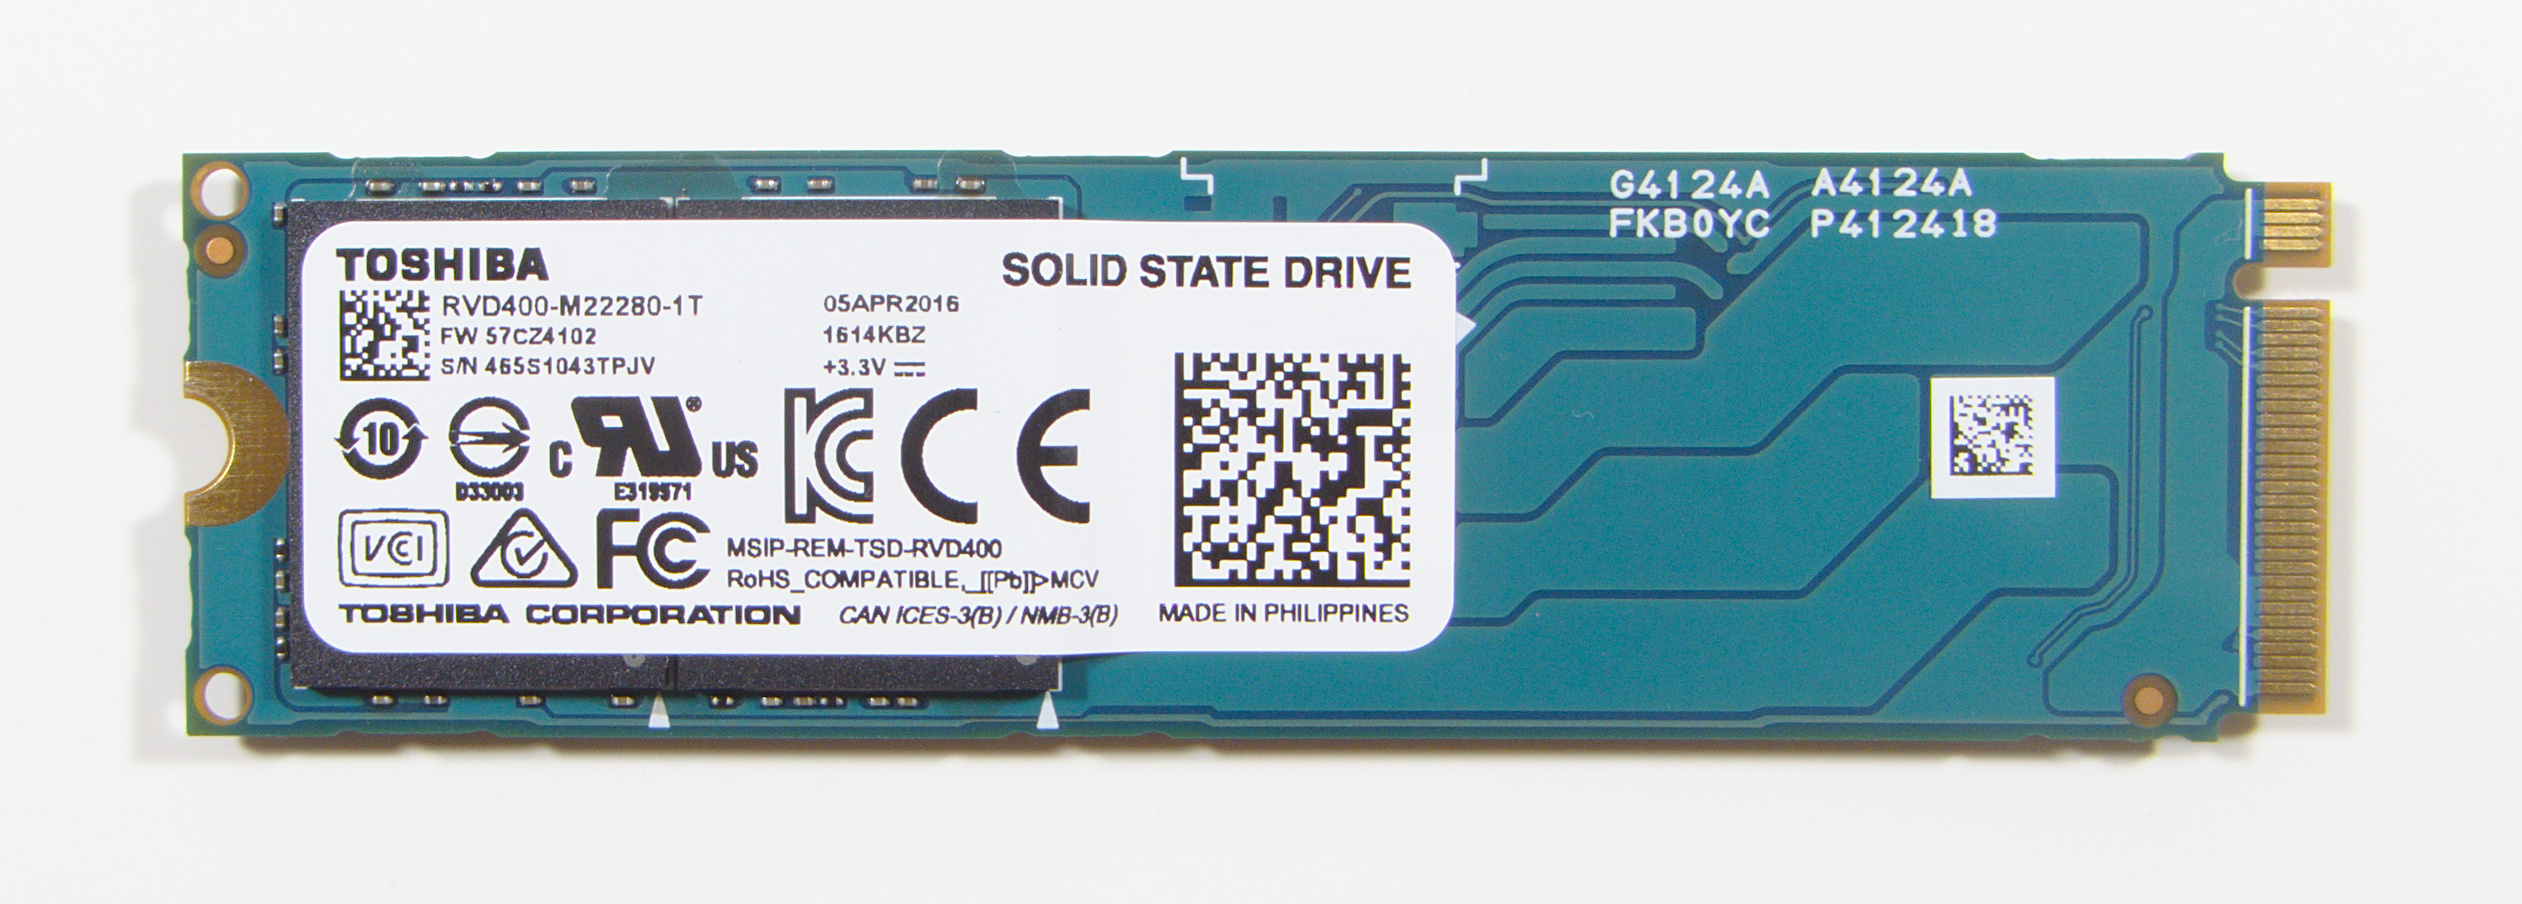
The RD400 shares its hardware with the OEM-only Toshiba XG3 M.2 SSD but the RD400 has different firmware and comes with a custom NVMe driver for Windows that Toshiba says offers better performance than Microsoft's driver. The Toshiba XG3 was announced in August 2015 and we have since encountered it in the Microsoft Surface Pro 4. As a retail product, the OCZ RD400 will not only benefit from the OCZ custom driver, but is also supported by their SSD managment utilities, and is optionally sold with a PCIe x4 to M.2 adapter that includes a thermal pad under the SSD controller. The SKUs that come with the drive pre-installed in the adapter are referred to in some documents as the RD400A, but the M.2 module is the same with or without the adapter.
| Toshiba OCZ RD400(A) Specifications | ||||
| Capacity | 128 GB | 256 GB | 512 GB | 1 TB (1024GB) |
| Controller | Toshiba TC58NCP070GSB | |||
| NAND | Toshiba 15nm MLC | |||
| Sequential Read | 2200 MB/s | 2600 MB/s | 2600 MB/s | 2600 MB/s |
| Sequential Write | 620 MB/s | 1150 MB/s | 1600 MB/s | 1550 MB/s |
| Random Read IOPS | 170k | 210k | 190k | 210k |
| Random Write IOPS | 110k | 140k | 120k | 130k |
| Form Factor | M.2 2280 single-sided | M.2 2280 double-sided | ||
| Protocol | NVMe 1.1b over PCIe 3.1 x4 | |||
| Encryption | None | |||
| Write Endurance | 74 TB | 148 TB | 296 TB | 592 TB |
| Warranty | 5 years | |||
| DWPD Equivalent | 0.31 | 0.31 | 0.31 | 0.31 |
| MSRP (with PCIe adapter) | $129.99 | $189.99 | $329.99 | $759.99 |
| MSRP (M.2 only) | $109.99 | $169.99 | $309.99 | $739.99 |
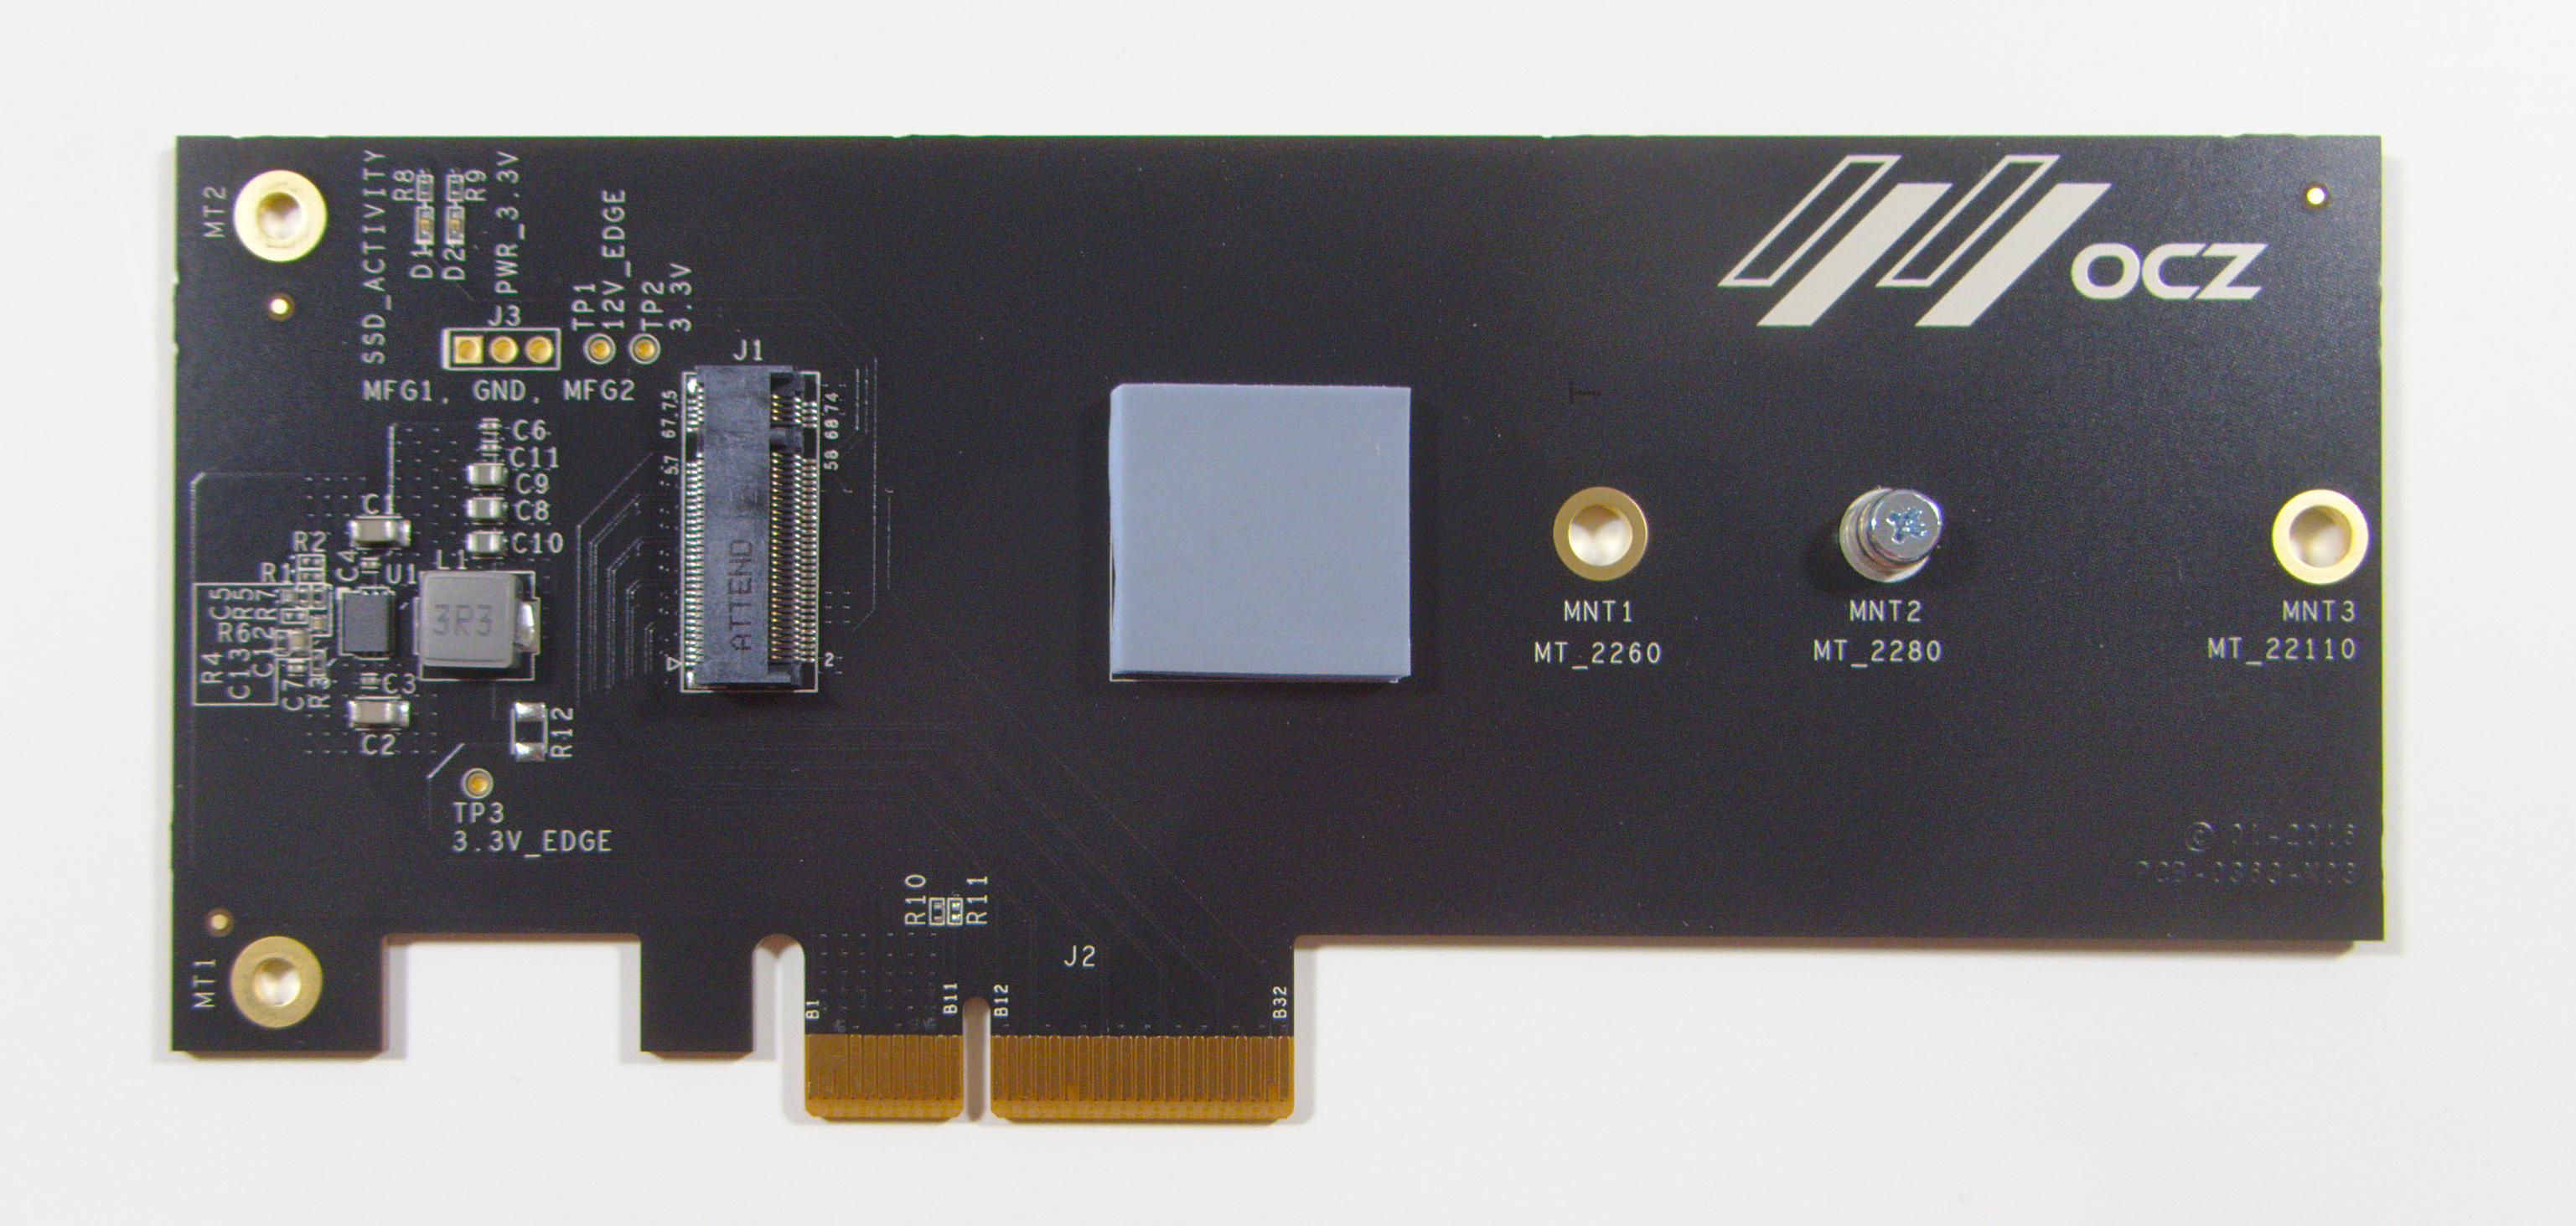
The PCIe x4 to M.2 adapter adds $20 to the price tag but may be a welcome option for some desktop users. The card itself is generic and bears OCZ branding but has no specific reference to the RD400. Unlike most cheap adapter cards, the RD400's adapter draws power from the PCIe slot's 12V supply and converts it to the 3.3V required by the M.2 drive. All of our power and performance numbers for the RD400 in this review reflect the effect of the bundled adapter's thermal pad and the overhead of the voltage conversion. Thus, this review is of the RD400 in a typical desktop environment rather than in a notebook environment.
Toshiba's overhaul of the OCZ brand has changed the OCZ SSD Guru software into the OCZ SSD Utility and the ShieldPlus Warranty into the Advanced Warranty Program, but the relevant details are the same. Toshiba has also added a new software tool: CLOUT, the Command Line Online Update Tool. Based on an internal testing tool, it offers all the management capabilities of the graphical SSD Utility but from a scriptable command line interface. The ability to perform a secure erase from a script and without having to reboot to Linux is a killer feature for me as a drive reviewer, and the fully automated testing it enabled made the RD400 the first drive to complete our suite of benchmarks in under 24 hours per drive.
The RD400 comes on the market at a time where it's only the second retail M.2 NVMe drive, as while the newer protocol has gained traction, the longer lifecycle of SSD controllers means that it's taking designers a while to update to NVMe. The competition for the RD400 consists primarily of the Samsung 950 Pro - getting Samsung some needed competition in the retail M.2 space - and the Intel SSD 750, the two which have been the two highest performance PCIe SSDs in the consumer market. They're also two of the most expensive current-generation consumer SSDs for sale: the Samsung 950 Pro is selling for 0.62–0.70 $/GB while the Intel SSD 750 is between 0.87 $/GB and 1.00 $/GB. The 256GB and 512GB RD400 models that compete directly against the Samsung 950 Pro have MSRPs below the current 950 Pro prices, which gives Toshiba some room to be competitive even if performance is lower. The 1TB and 128GB models of RD400 on the other hand have less aggressive MSRPs, likely owing to the lack of direct competitors currently on the market.
Finally, looking at the NAND in the RD400, the 15nm MLC used here presents some changes compared to the 20nm MLC in the Intel SSD 750 and the 3D NAND in the Samsung 950 Pro. The most obvious sign is the reduced write endurance rating: the 256GB and 512GB 950 Pro are both rated for 400TB while the RD400 is rated for 148TB or 296TB for the same capacities.
| AnandTech 2015 SSD Test System | |
| CPU | Intel Core i7-4770K running at 3.5GHz (Turbo & EIST enabled, C-states disabled) |
| Motherboard | ASUS Z97 Pro (BIOS 2701) |
| Chipset | Intel Z97 |
| Memory | Corsair Vengeance DDR3-1866 2x8GB (9-10-9-27 2T) |
| Graphics | Intel HD Graphics 4600 |
| Desktop Resolution | 1920 x 1200 |
| OS | Windows 8.1 x64 |
| NVMe Driver | Toshiba OCZ driver version 1.2.126.827 |
- Thanks to Intel for the Core i7-4770K CPU
- Thanks to ASUS for the Z97 Deluxe motherboard
- Thanks to Corsair for the Vengeance 16GB DDR3-1866 DRAM kit, RM750 power supply, Carbide 200R case, and Hydro H60 CPU cooler
Performance Consistency
Our performance consistency test explores the extent to which a drive can reliably sustain performance during a long-duration random write test. Specifications for consumer drives typically list peak performance numbers only attainable in ideal conditions. The performance in a worst-case scenario can be drastically different as over the course of a long test drives can run out of spare area, have to start performing garbage collection, and sometimes even reach power or thermal limits.
In addition to an overall decline in performance, a long test can show patterns in how performance varies on shorter timescales. Some drives will exhibit very little variance in performance from second to second, while others will show massive drops in performance during each garbage collection cycle but otherwise maintain good performance, and others show constantly wide variance. If a drive periodically slows to hard drive levels of performance, it may feel slow to use even if its overall average performance is very high.
To maximally stress the drive's controller and force it to perform garbage collection and wear leveling, this test conducts 4kB random writes with a queue depth of 32. The drive is filled before the start of the test, and the test duration is one hour. Any spare area will be exhausted early in the test and by the end of the hour even the largest drives with the most overprovisioning will have reached a steady state. We use the last 400 seconds of the test to score the drive both on steady-state average writes per second and on its performance divided by the standard deviation.
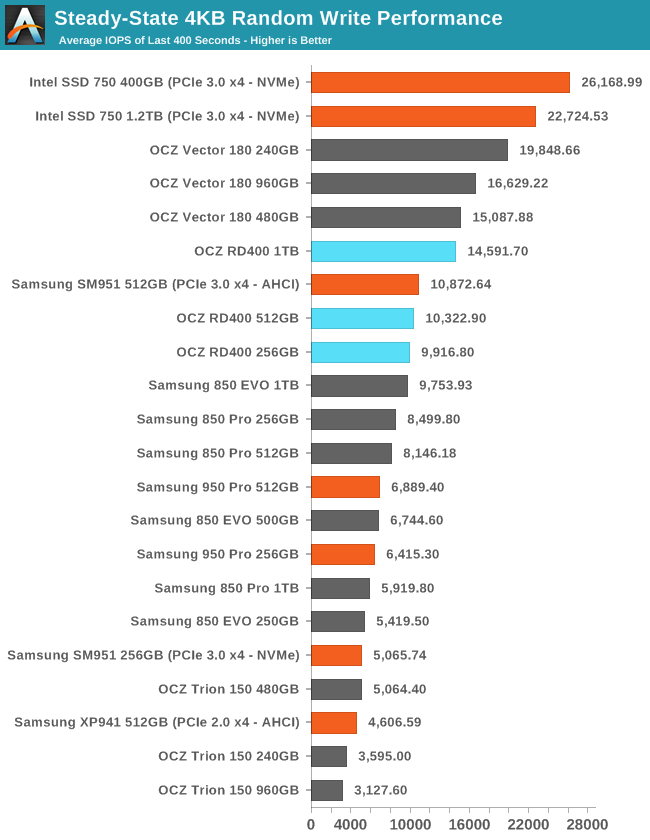
The RD400 sustains good random write performance, but the controllers and firmware in the OCZ Vector 180 and Intel 750 were designed with this kind of test in mind, and it shows. PCIe and NVMe don't help appreciably when the performance bottleneck is all the bookkeeping inside the controller, but NVMe controllers tend to have at least adequate processing power.
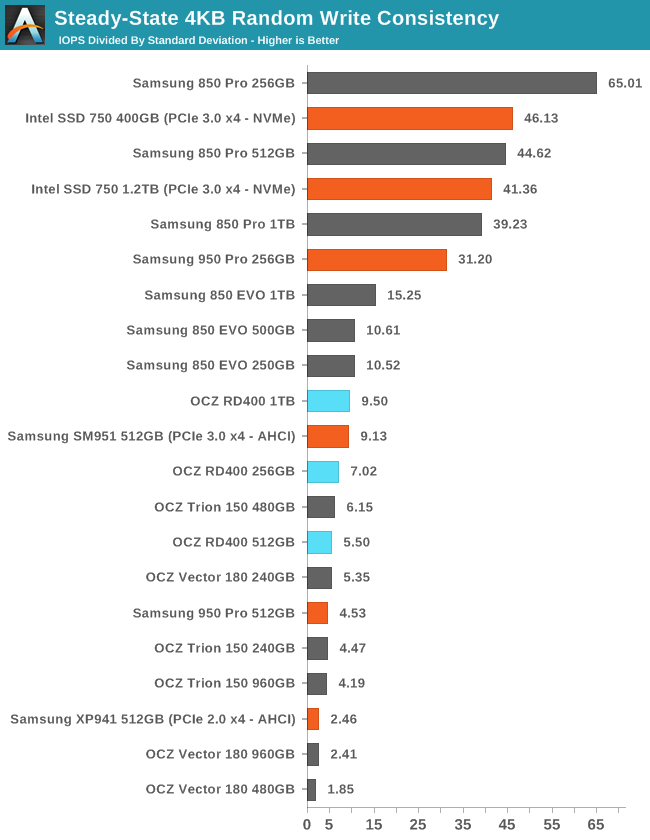
Most Samsung and Intel drives are much more consistent than the RD400, but the latter's score is fine for a client drive.
 |
|||||||||
| Default | |||||||||
| 25% Over-Provisioning | |||||||||
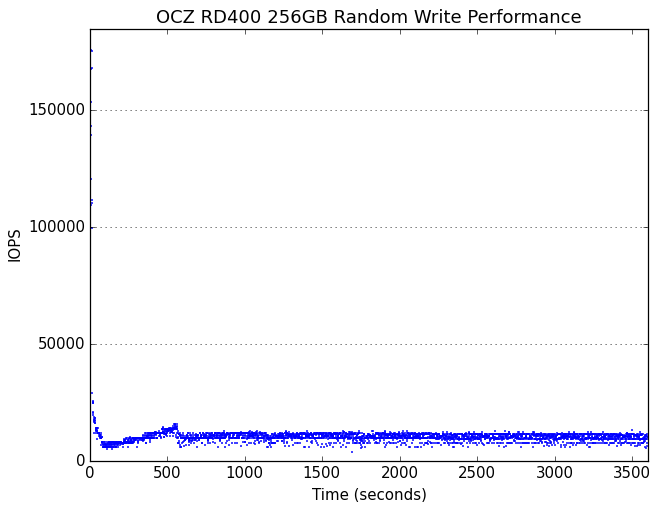
The 512GB RD400 shows oddly different behavior from the other two capacities when tested with overprovisioning, but the RD400 results are all good looking with no extremely low performance outliers.
 |
|||||||||
| Default | |||||||||
| 25% Over-Provisioning | |||||||||
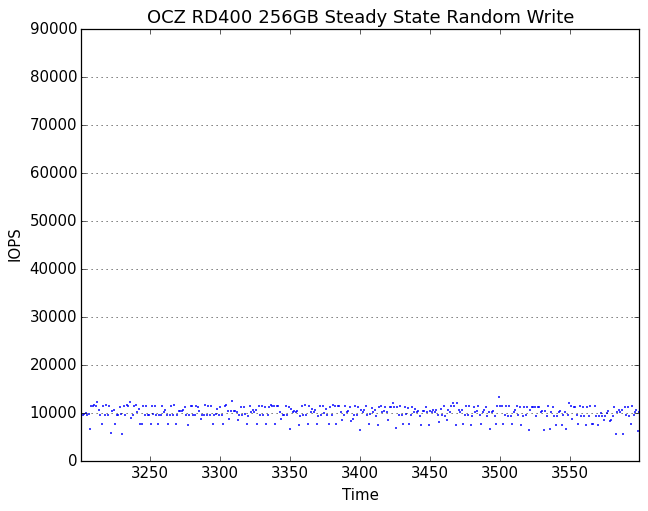
The minimum random write performance of the RD400 is as good as the average performance of most SATA drives. There is some periodic variation apparent for the 512GB and 1TB models in the form of steep drops that last only a few seconds.
AnandTech Storage Bench - The Destroyer
The Destroyer is an extremely long test replicating the access patterns of very IO-intensive desktop usage. A detailed breakdown can be found in this article. Like real-world usage and unlike our Iometer tests, the drives do get the occasional break that allows for some background garbage collection and flushing caches, but those idle times are limited to 25ms so that it doesn't take all week to run the test.
We quantify performance on this test by reporting the drive's average data throughput, a few data points about its latency, and the total energy used by the drive over the course of the test.
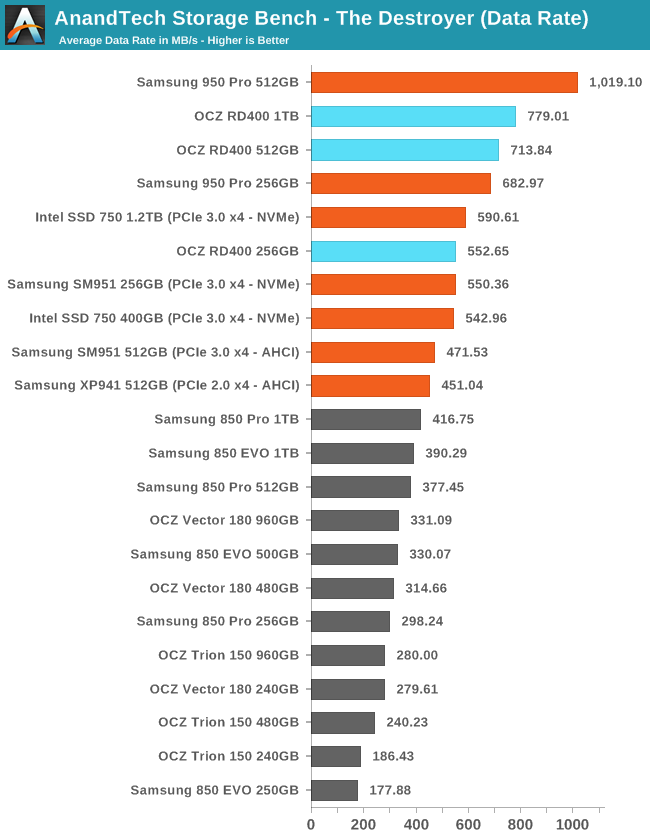
The OCZ RD400 can't keep pace with the Samsung 950 Pro on The Destroyer, but otherwise it beats or ties the other PCIe drives and is substantially faster than any SATA drive.
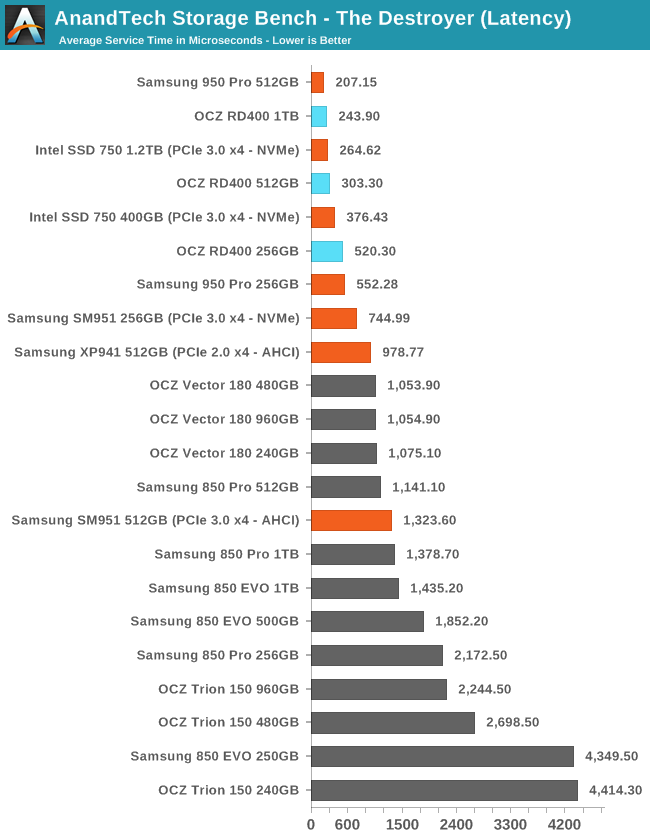
All three RD400 capacities deliver an average service time that falls between the scores of the two 950 Pro capacities. Even the 256GB RD400 almost halves the latency of the best SATA drives.
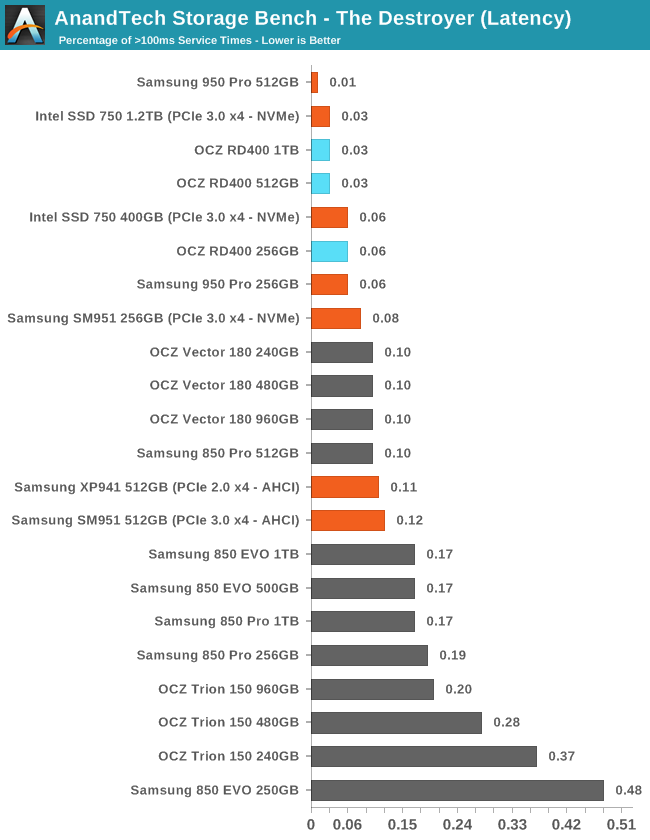
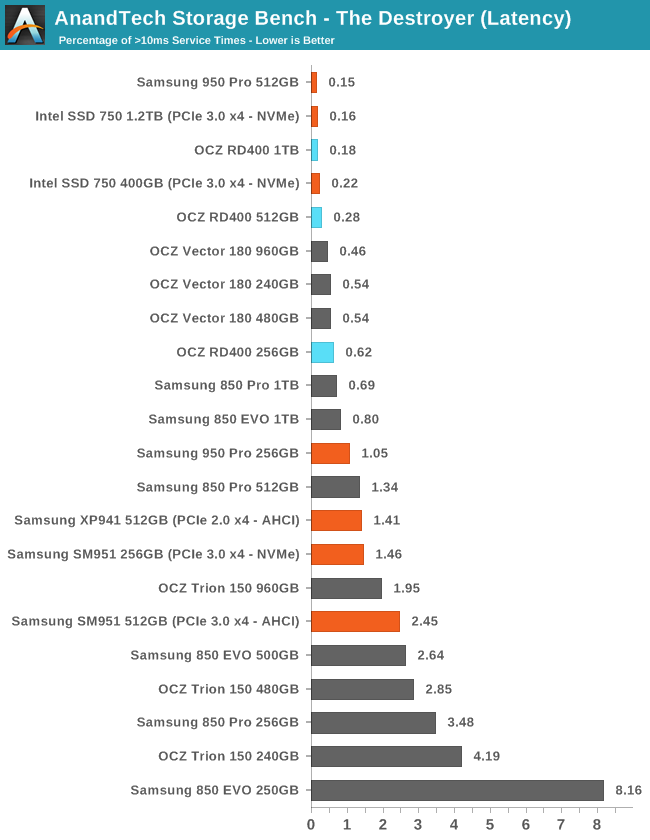
The NVMe drives top the charts for having an extremely low number of severe latency outliers in excess of 100ms, but the 512GB 950 Pro is still clearly the best performer. The NVMe drives are not all clear winners when looking at the number of latency outliers in excess of 10ms: the 256GB RD400 falls behind the Vector 180 and the 256GB 950 Pro is even further behind.
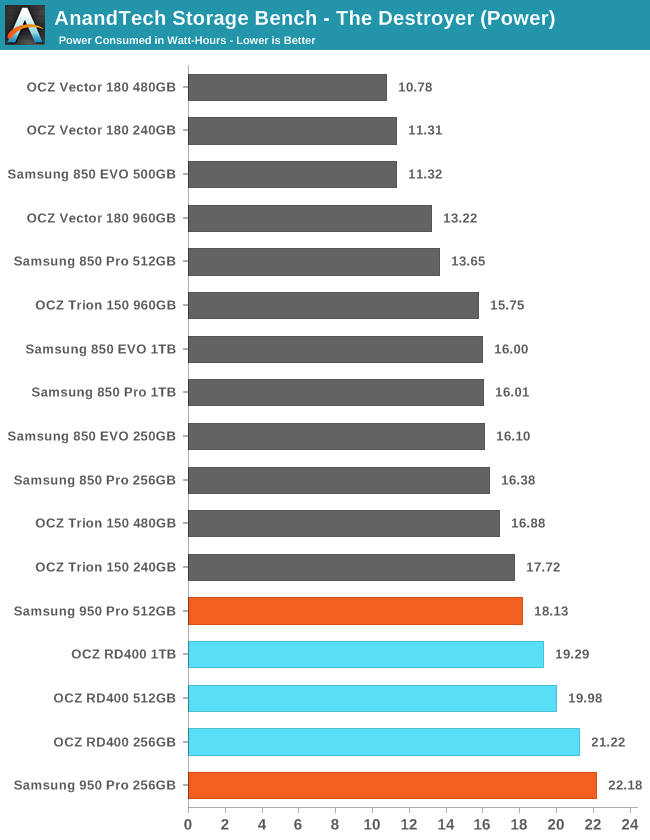
High performance usually carries some cost of high power consumption. The PCIe drives complete The Destroyer far quicker than any of the SATA drives but use more energy overall, and the RD400 falls in between the two capacities of the Samsung 950 Pro.
AnandTech Storage Bench - Heavy
Our Heavy storage benchmark is proportionally more write-heavy than The Destroyer, but much shorter overall. The total writes in the Heavy test aren't enough to fill the drive, so performance never drops down to steady state. This test is far more representative of a power user's day to day usage, and is heavily influenced by the drive's peak performance. The Heavy workload test details can be found here.
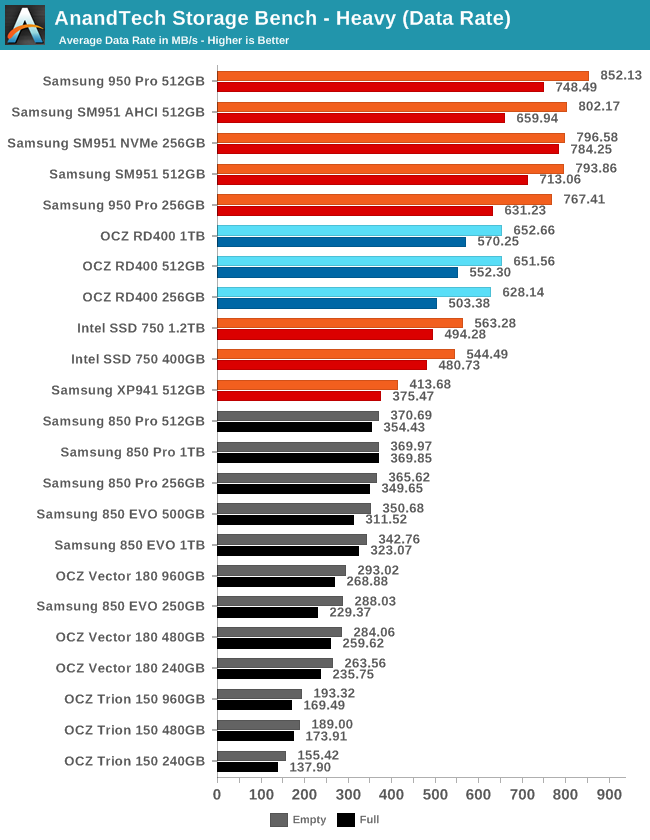
Samsung's PCIe 3 SSDs all clearly outclass the RD400 on the Heavy test, but the RD400 is slightly ahead of the Intel SSD 750 and much faster than everything else.
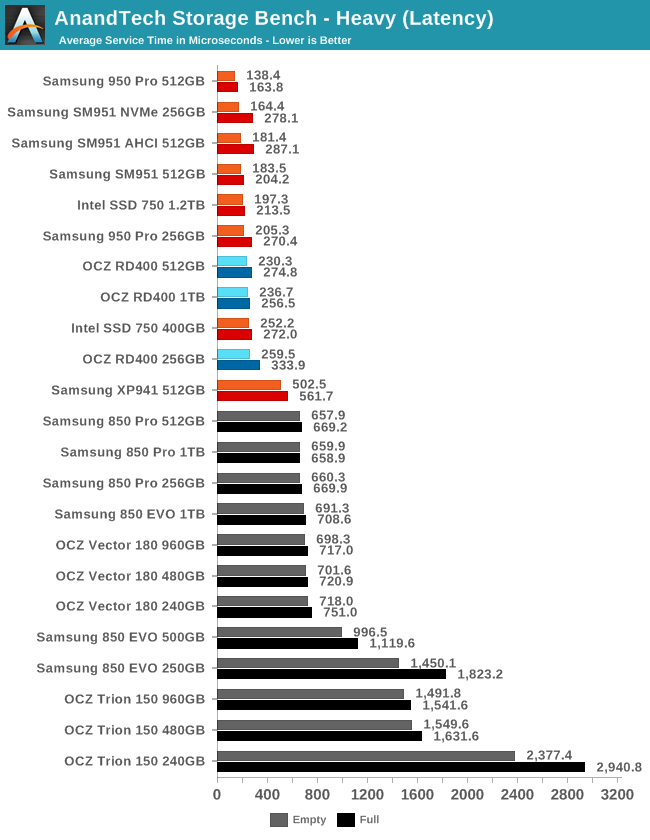
Average service time on the Heavy test shows clear separation between drive classes. The RD400 is relatively slow for a PCIe 3 SSD, but has less than half the latency of the good SATA drives and is five to ten times better than low-end TLC SATA drives.
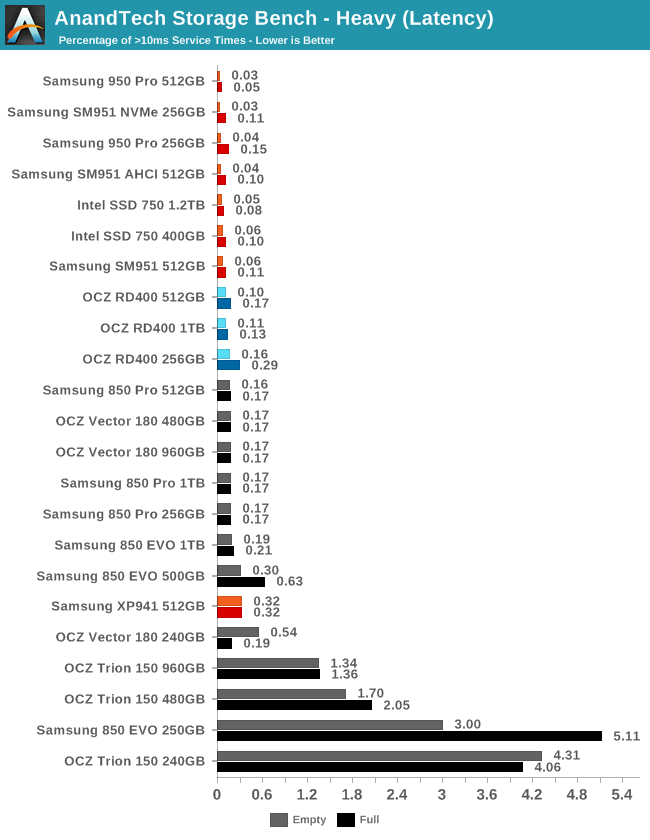
The inclusion of a few TLC SATA drives shows how almost everything else handles the Heavy test without being overwhelmed, but the RD400 is also clearly lagging behind the other PCIe 3 drives and the 256GB model needs to perform better when full.
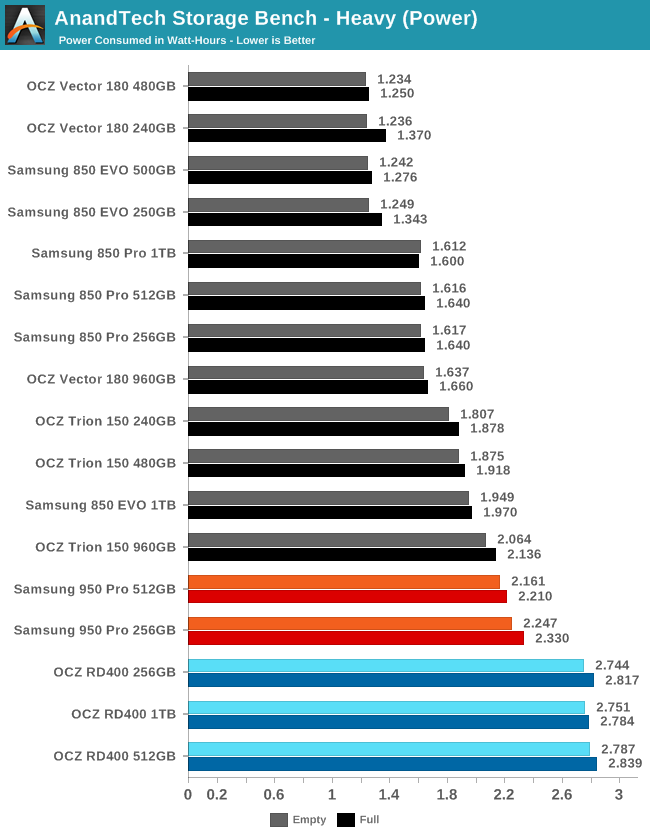
The three capacities of the RD400 all use very similar amounts of energy over the Heavy test, and significantly more than the other drives we've measured.
AnandTech Storage Bench - Light
Our Light storage test has relatively more sequential accesses and lower queue depths than The Destroyer or the Heavy test, and it's by far the shortest test overall. It's based largely on applications that aren't highly dependent on storage performance, so this is a test more of application launch times and file load times. This test can be seen as the sum of all the little delays in daily usage, but with the idle times trimmed to 25ms it takes less than half an hour to run. Details of the Light test can be found here.
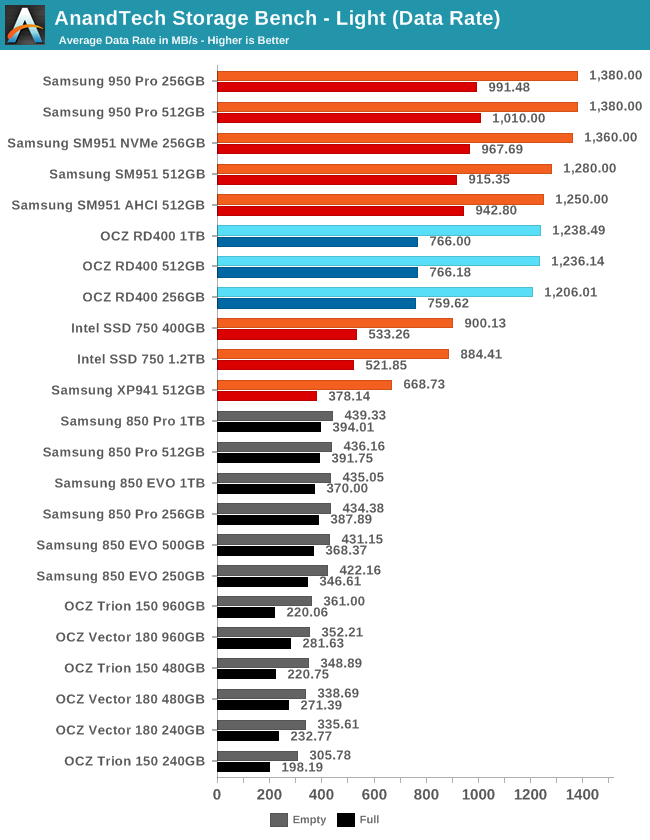
As with the Heavy test, overall performance on the Light test shows the RD400 being slower than the Samsung PCIe 3 drives but faster than the Intel 750. In this case, the RD400 is much closer to the Samsung drives when fresh, but about halfway between Samsung and Intel for filled-drive performance.
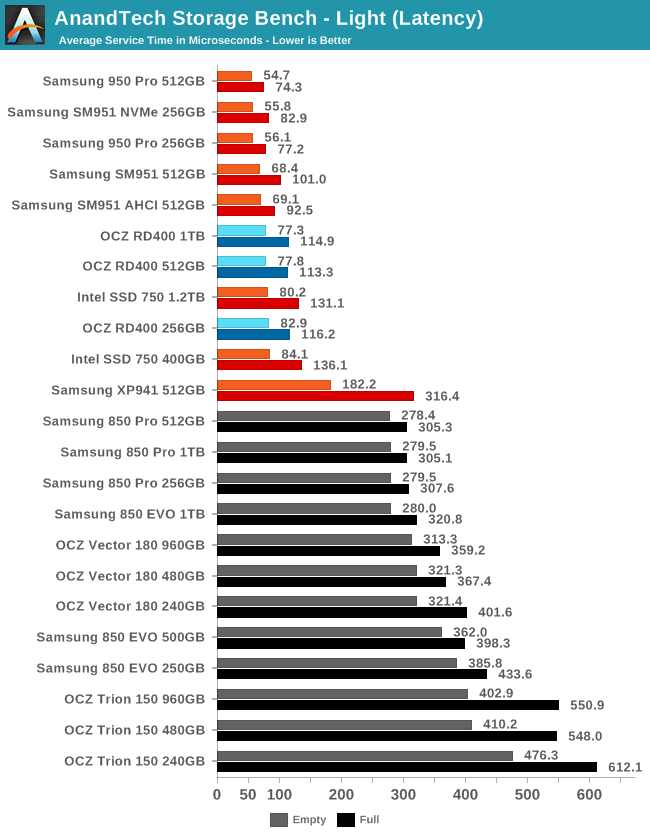
Average service times again show that the differences between PCIe 3 drives are small compared to the gulf between them and SATA drives.
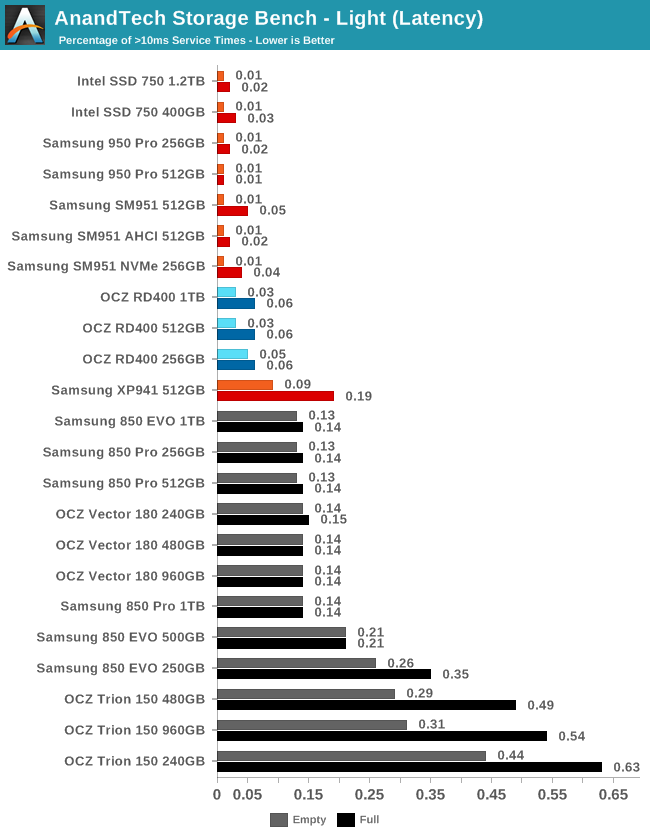
Latency outliers above 10ms are clearly more common with the RD400 than the other PCIe 3 drives, but still less than half as frequent as on any SATA drive. This time it's the 512GB and 1TB models showing a relatively large impact from the test being run on a full drive.
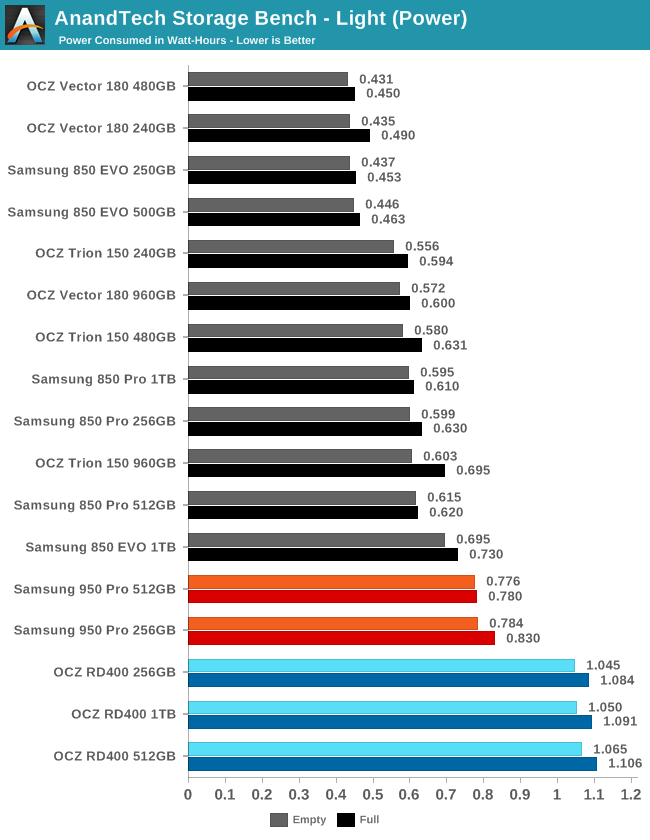
The RD400's energy usage is again worst overall with a significant gap between the Samsung 950 Pro and the RD400, and the 950 Pro already used more energy than most SATA drives.
Random Read Performance
The random read test requests 4kB blocks and tests queue depths ranging from 1 to 32. The queue depth is doubled every three minutes, for a total test duration of 18 minutes. The test spans the entire drive, which is filled before the test starts. The primary score we report is an average of performances at queue depths 1, 2 and 4, as client usage typically consists mostly of low queue depth operations.
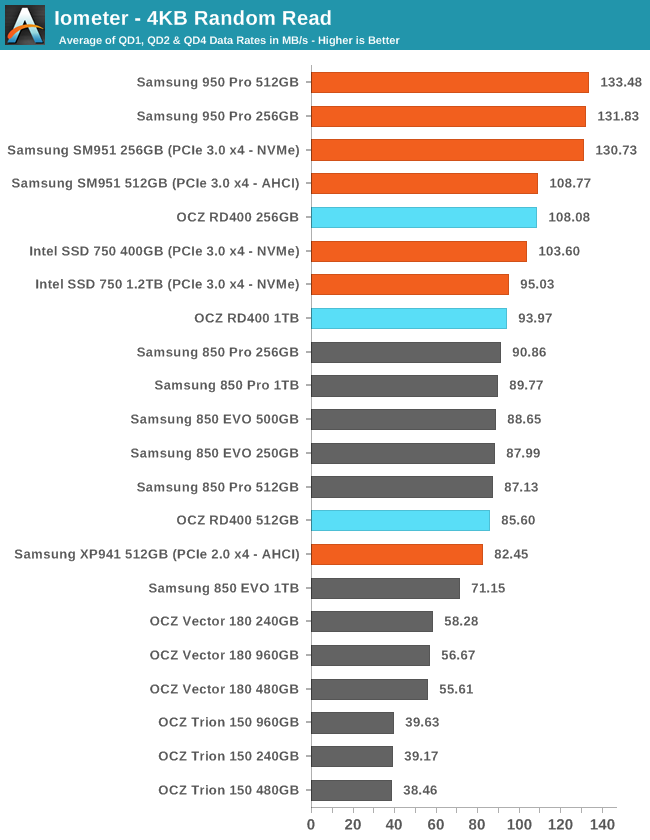
There's not a significant random read speed gap between PCIe drives and SATA drives as the unavoidable NAND latency and controller/firmware design matter more than the speed of the host interface. The RD400 performance is a bit odd, with the 512GB RD400 falling behind several SATA drives while the 256GB RD400 is clearly the fastest capacity.
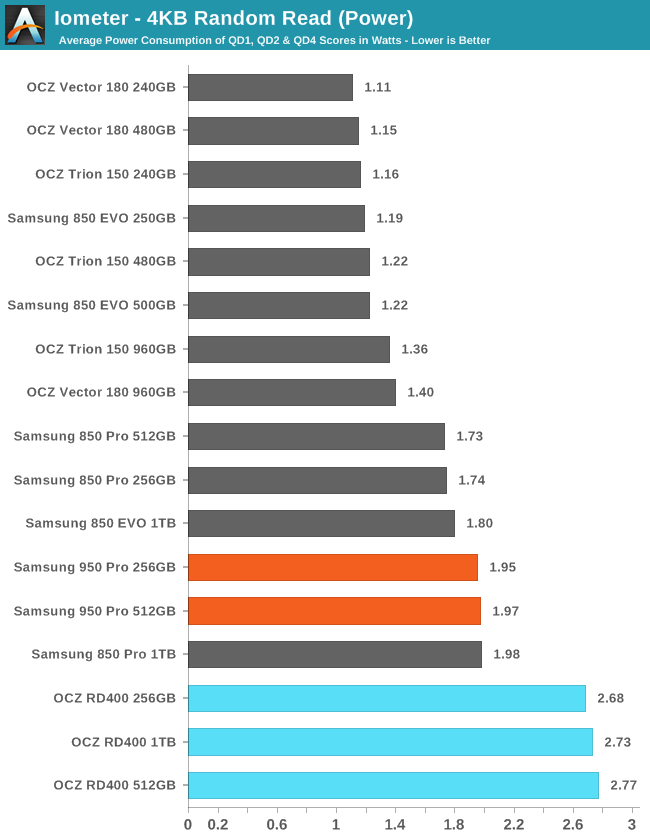
The RD400 again draws significantly more power than the other drives we've measured while the Samsung 950 Pro is a similar load to high-end SATA drives.
 |
|||||||||
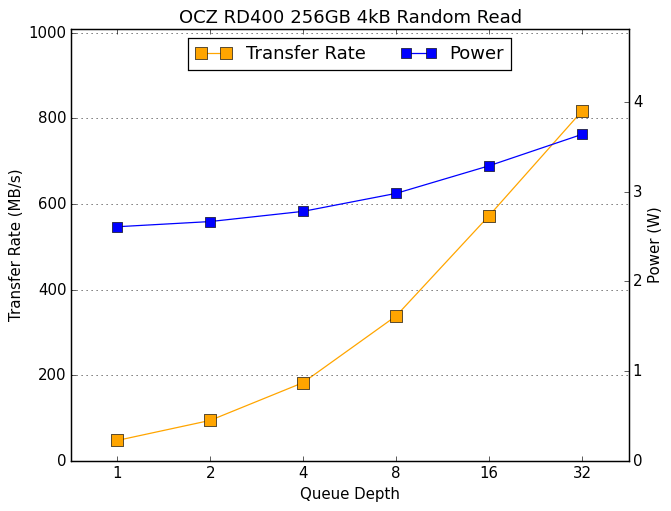
The RD400's random read speed scales smoothly with queue depth and unlike the Samsung drives it shows no signs of performance reaching a plateau near the end of the test.
Random Write Performance
The random write test writes 4kB blocks and tests queue depths ranging from 1 to 32. The queue depth is doubled every three minutes, for a total test duration of 18 minutes. The test is limited to a 16GB portion of the drive, and the drive is empty save for the 16GB test file. The primary score we report is an average of performances at queue depths 1, 2 and 4, as client usage typically consists mostly of low queue depth operations.
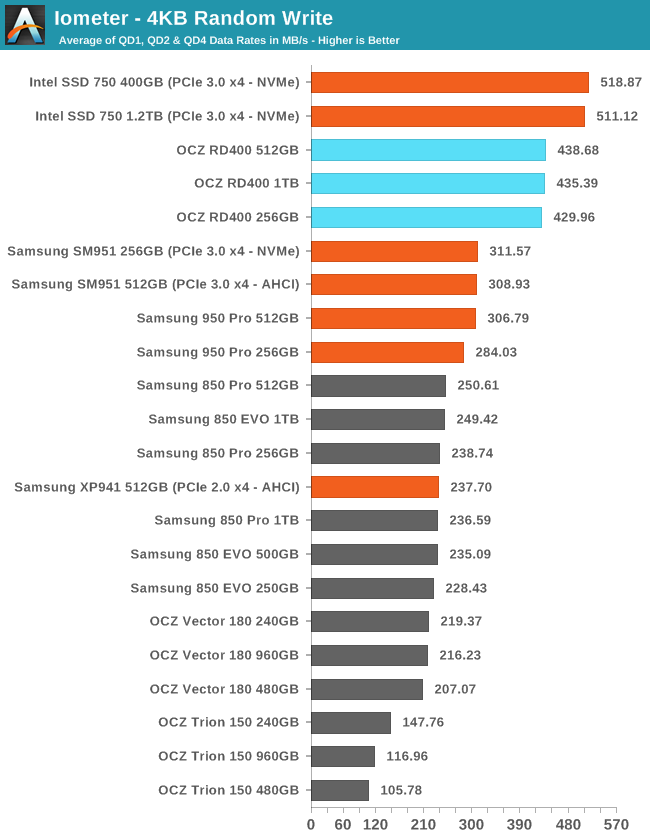
The Intel 750's enterprise roots show through quite clearly as it delivers the fastest random write speeds, but the RD400 is a strong second place. Samsung's PCIe 3 drives provide only moderate improvement over SATA. This stratification illustrates just how much NVMe drivers, controllers and firmware can differ even when the underlying PCIe link is not clost to full utilization.
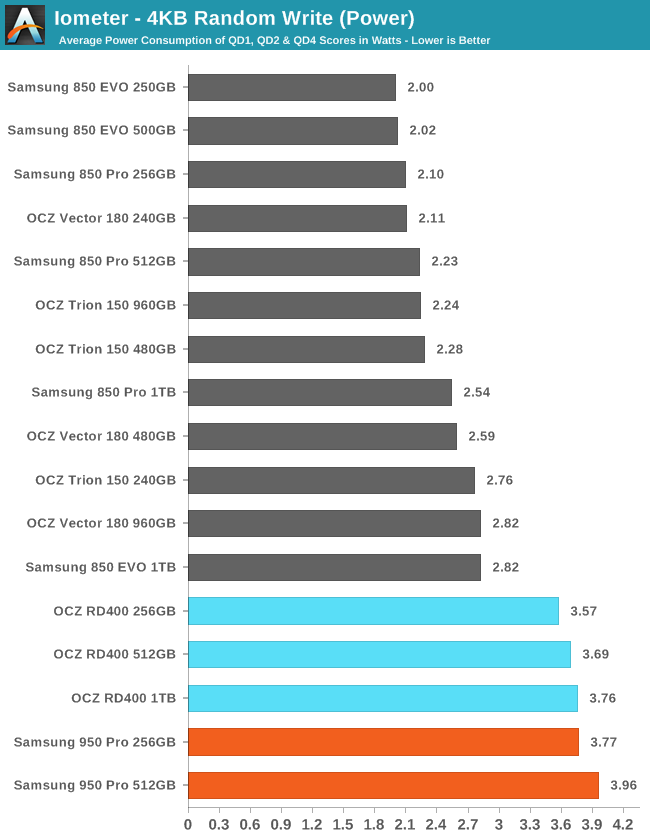
In addition to providing better random write speeds than the 950 Pro, the RD400 manages to use a bit less power, giving it a clear efficiency win.
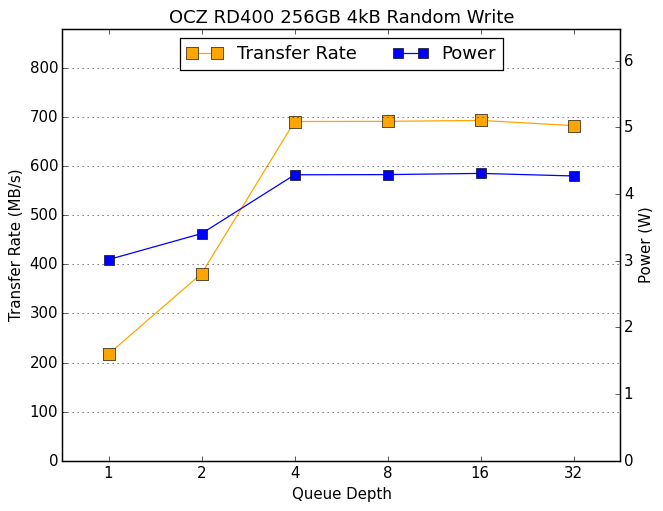 |
|||||||||
The RD400 reaches full speed by QD4 and maintains it for the rest of the test save for a bit of a drop on the 1TB RD400 near the end as the drive begins to run out of spare area and potentially triggers some thermal throttling.
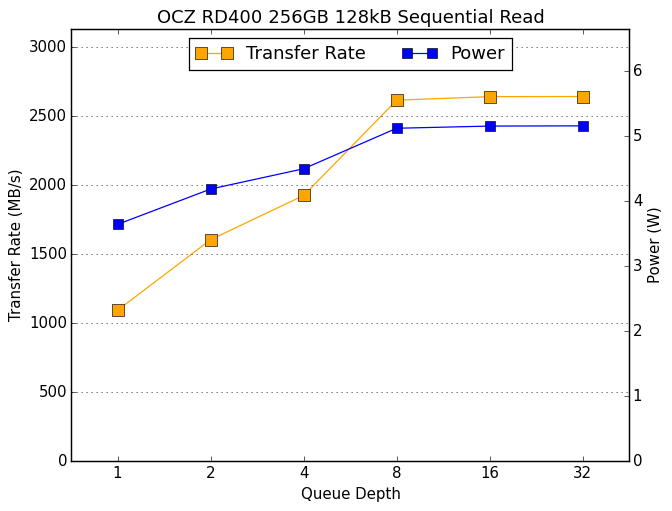
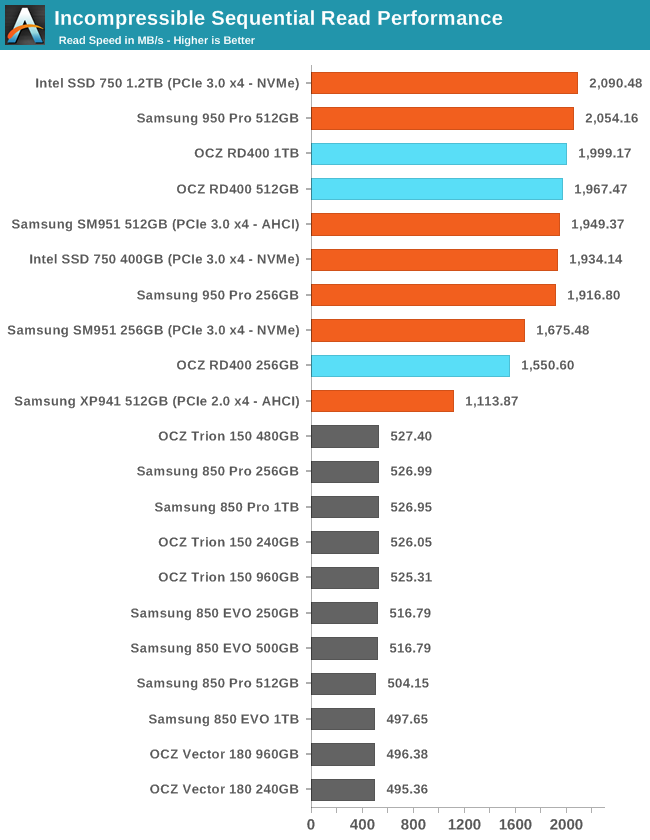
Sequential Read Performance
The sequential read test requests 128kB blocks and tests queue depths ranging from 1 to 32. The queue depth is doubled every three minutes, for a total test duration of 18 minutes. The test spans the entire drive, and the drive is filled before the test begins. The primary score we report is an average of performances at queue depths 1, 2 and 4, as client usage typically consists mostly of low queue depth operations.
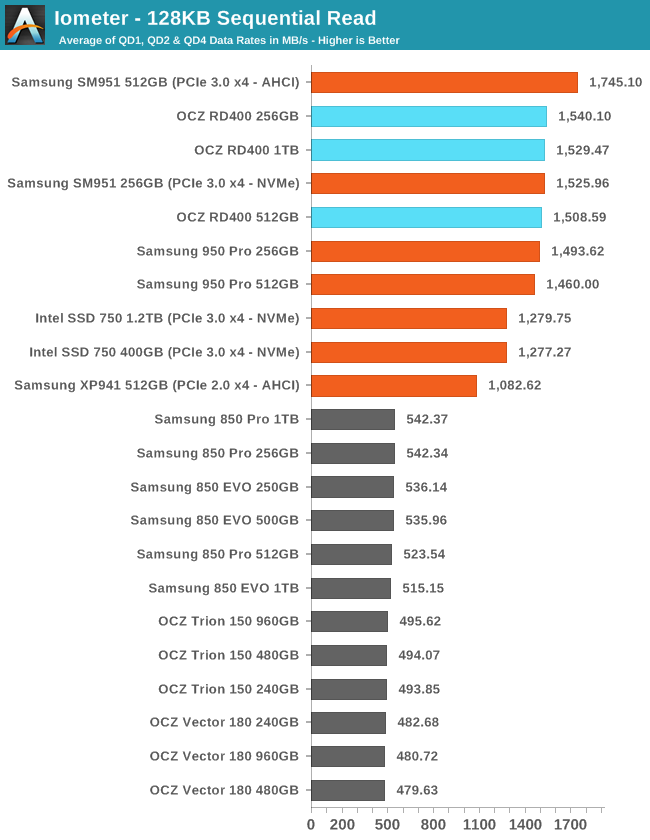
The RD400 delivers sequential read speeds on par with other PCIe 3 drives and almost three times the speed possible from a SATA drive.
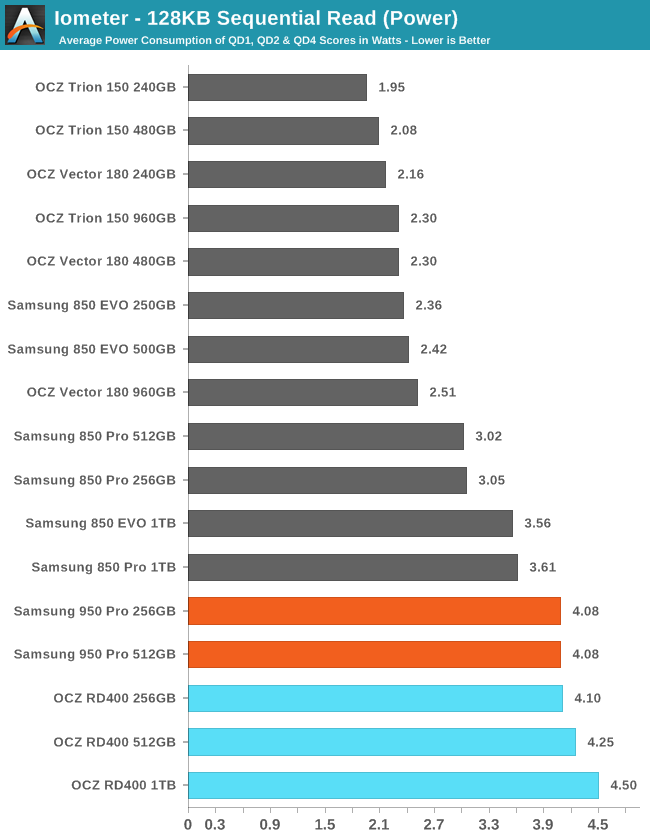
The RD400 draws slightly more power than the Samsung 950 Pro. The higher performance of the PCIe drives makes them much more efficient than any of the SATA drives.
 |
|||||||||
The 256GB RD400 jumps in performance between QD 4 and QD 8 where it tops out at the advertised speed, while the larger models show more modest increases during the second half of this test.
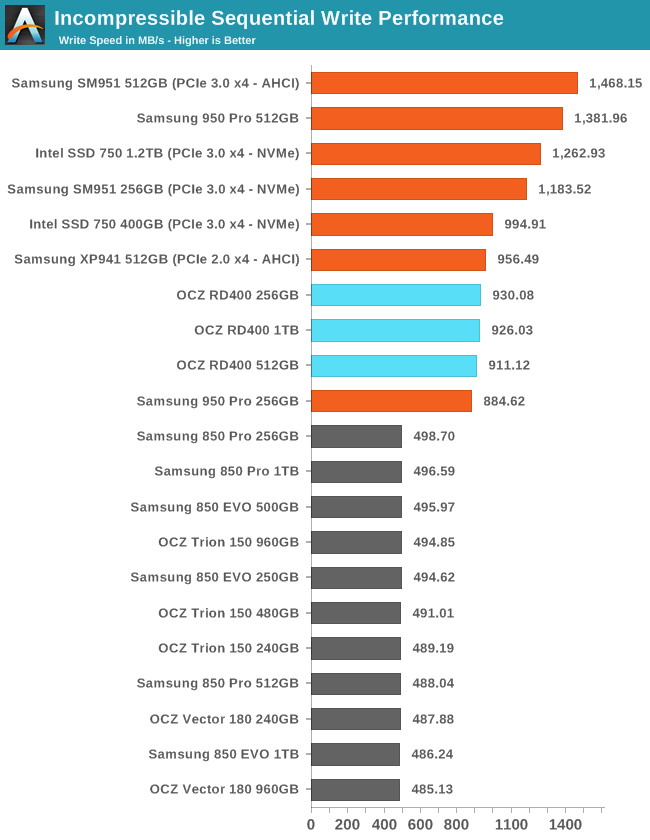
Sequential Write Performance
The sequential write test writes 128kB blocks and tests queue depths ranging from 1 to 32. The queue depth is doubled every three minutes, for a total test duration of 18 minutes. The test spans the entire drive, and the drive is filled before the test begins. The primary score we report is an average of performances at queue depths 1, 2 and 4, as client usage typically consists mostly of low queue depth operations.
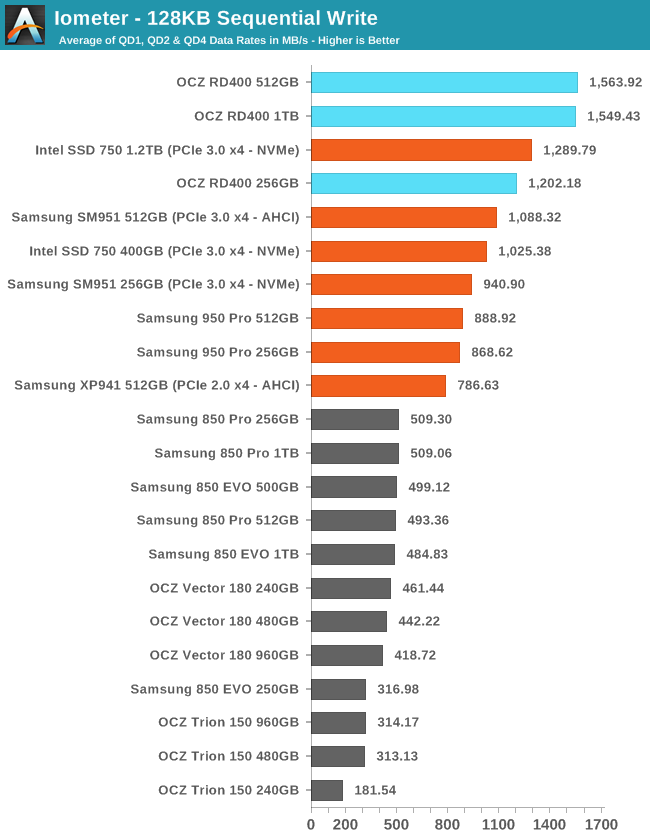
The RD400 tops the charts for sequential write speed with a substantial advantage over both Intel and Samsung PCIe SSDs.
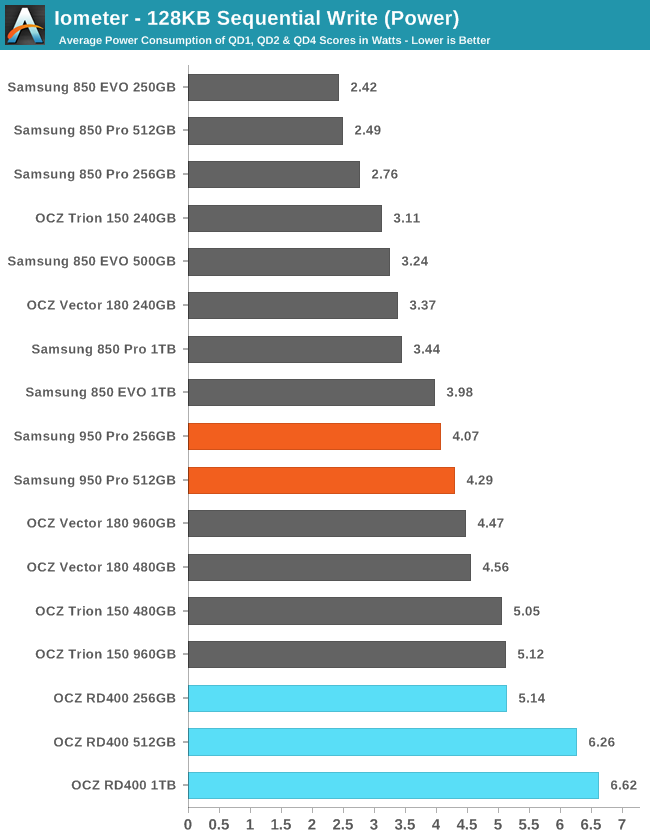
Unsurprisingly, the high performance comes with high power consumption as the 512GB and 1TB models both draw over 6W.
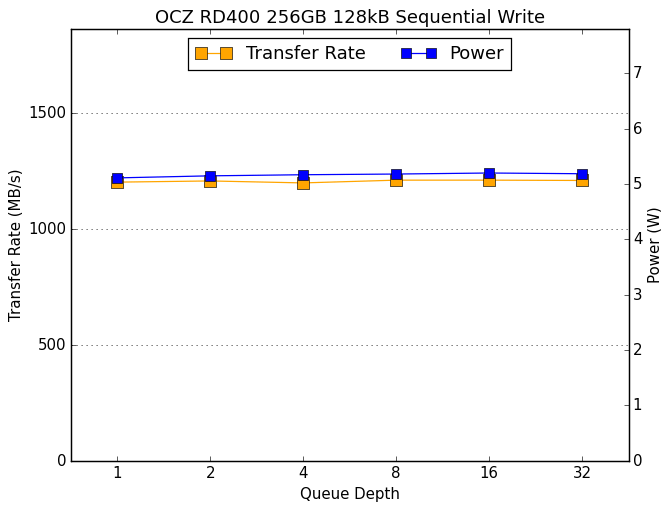 |
|||||||||
The 256GB RD400 shows constant performance across queue depths while the larger models show a slight increase from QD1 to QD2. The 1TB model wavers later in the test as thermal throttling occasionally kicks in, but even so it stays much faster overall than any competitor.
Mixed Random Read/Write Performance
The mixed random I/O benchmark starts with a pure read test and gradually increases the proportion of writes, finishing with pure writes. The queue depth is 3 for the entire test and each subtest lasts for 3 minutes, for a total test duration of 18 minutes. As with the pure random write test, this test is restricted to a 16GB span of the drive, which is empty save for the 16GB test file.
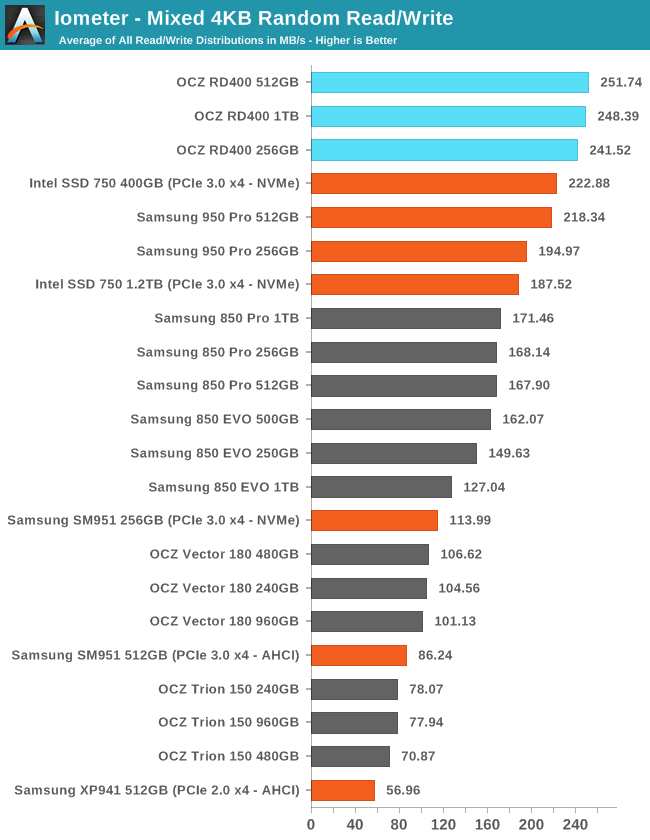
The RD400 sets new records for mixed random I/O performance with a substantial lead over the Intel 750 and Samsung 950 Pro.
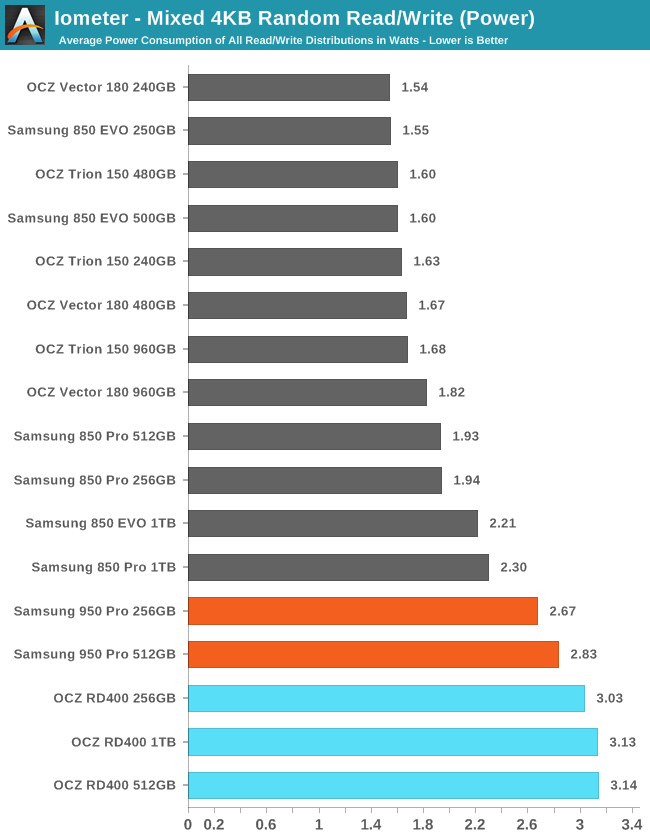
The RD400's power consumption is also record setting, but its efficiency is closer to normal for a PCIe SSD on account of the high power consumption yielding high performance.
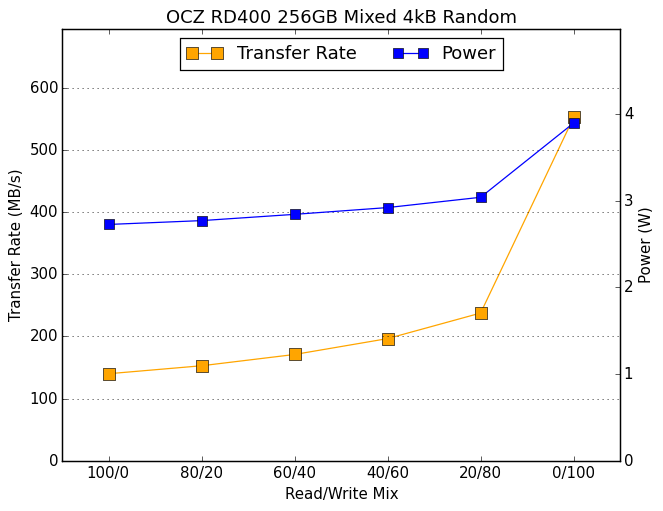 |
|||||||||
Most of the RD400's overall performance advantage is due to strong performance in the final phase of this test where the workload is 100% random writes. The 400GB Intel 750 has even higher random write speed, but performs lower on the other phases of this test.
Mixed Sequential Read/Write Performance
The mixed sequential access test covers the entire span of the drive and uses a queue depth of one. It starts with a pure read test and gradually increases the proportion of writes, finishing with pure writes. Each subtest lasts for 3 minutes, for a total test duration of 18 minutes. The drive is filled before the test starts.
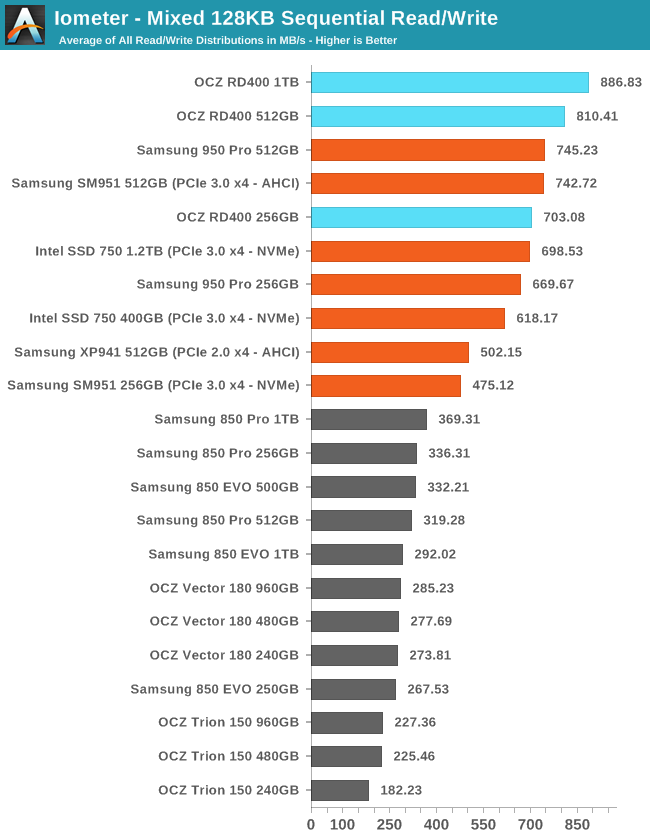
The RD400 handles a mixed sequential workload better than anything else and more than twice as fast as SATA drives.
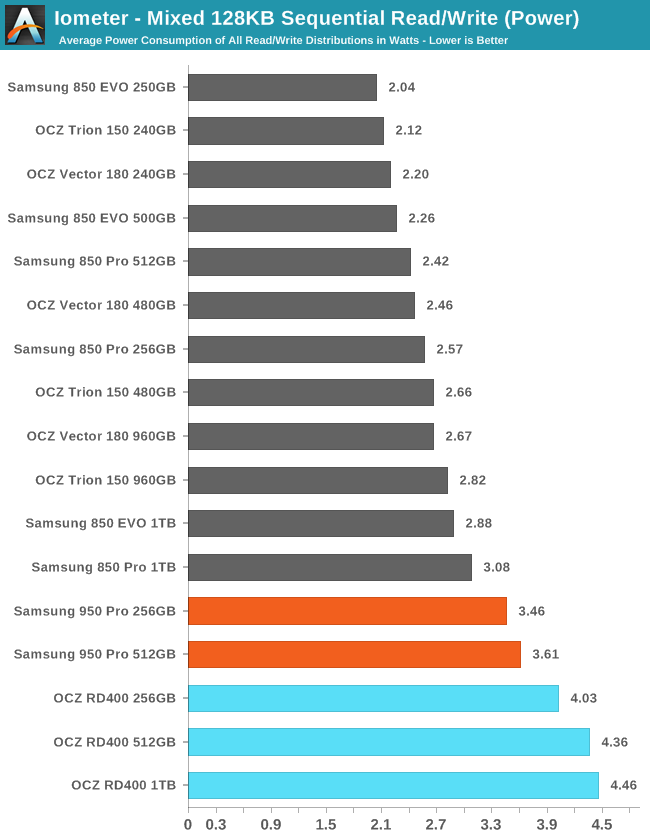
As usual, the RD400 needs plenty of power to deliver its high performance. The Samsung 950 Pro is a bit more efficient despite being slower.
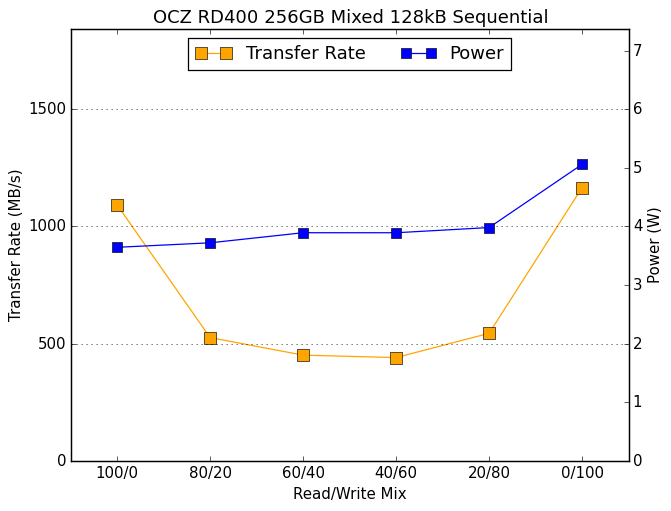 |
|||||||||
Performance across the mixed sequential test is usually a bathtub curve with the balanced mixes having the lowest performance. The RD400 bottoms out around the theoretical limit for SATA drives, which is substantially better worst-case performance than anything else. The 950 Pro has much better performance during the pure read start of the test but falls behind in the middle of the test and doesn't bounce back as much at the end.
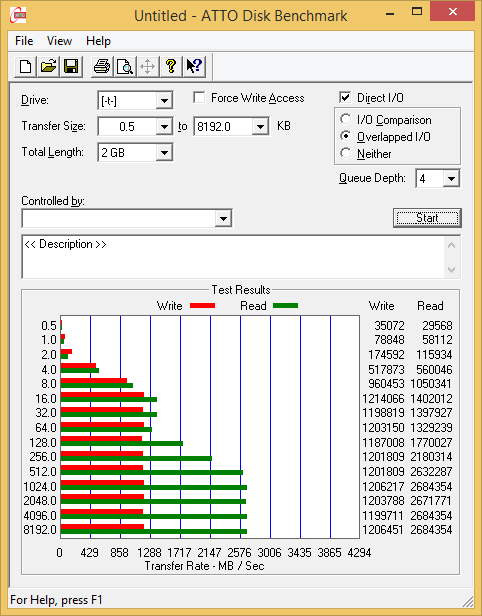
ATTO
ATTO's Disk Benchmark is a quick and easy freeware tool to measure drive performance across various transfer sizes.
 |
|||||||||
The lower write speed of the 256GB RD400 is clearly visible. All three models show essentially no performance scaling from 16kB to 64kB transfer size but only reach full performance for 512kB or larger transfers.
AS-SSD
AS-SSD is another quick and free benchmark tool. It uses incompressible data for all of its tests, making it an easy way to keep an eye on which drives are relying on transparent data compression. The short duration of the test makes it a decent indicator of peak drive performance.
The 256GB RD400 lags a bit behind the competition for read speed and all three are near the bottom of the PCIe segment for write speed.
Idle Power Consumption
Since the ATSB tests based on real-world usage cut idle times short to 25ms, their power consumption scores paint an inaccurate picture of the relative suitability of drives for mobile use. During real-world client use, a solid state drive will spend far more time idle than actively processing commands. Our testbed's PCIe link state power management support is broken, so only active idle power consumption is reported. This is realistic for most desktop scenarios, but a properly configured mobile system can potentially save power by enabling link power management for PCIe and SATA.
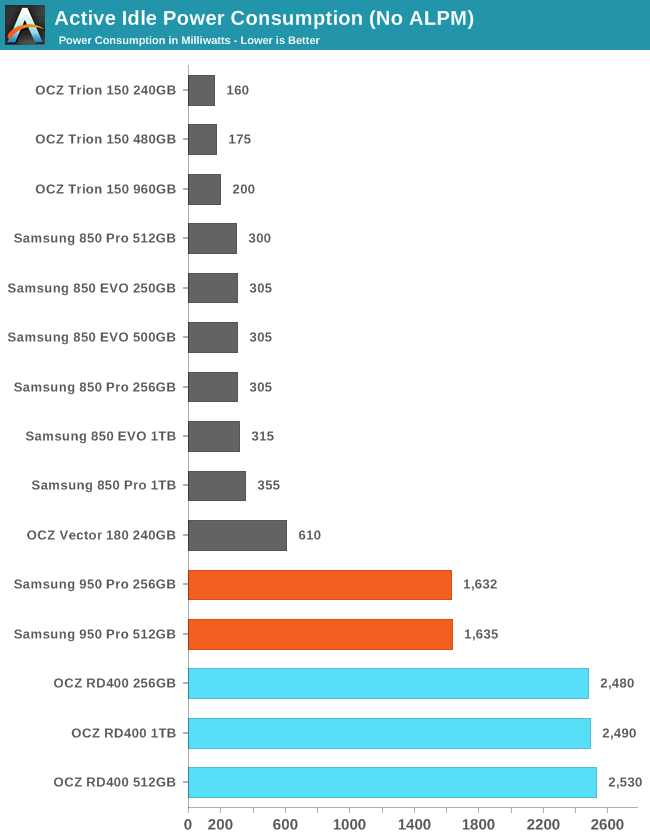
The 12V to 3.3V conversion done by the PCIe to M.2 adapter card bundled with the RD400 is providing some overhead to idle power, but most of this poor showing comes down to a lack of usable PCIe power management on common desktop platforms.
Final Words
The Toshiba OCZ RD400 is aimed at the very top segment of the consumer SSD market where the primary goal is to get the highest possible performance. The suggested retail prices aren't quite top of the line, which signals that performance expectations should be a bit lower than "the fastest that money can buy" but it needs to be in the ballpark. With the current state of the market, being a "mid-range" PCIe SSD can still mean being the second fastest drive available.
The RD400 only sets a few performance records but elsewhere it at stays close to the PCIe SSD competition and is much faster than any SATA drive. The once formidable Intel SSD 750 can now only top the charts on one benchmark and is simply too expensive for today's market, but it does retain the distinction of being the sole 2.5" U.2 SSD for the consumer market. Against the Samsung 950 Pro, the RD400 of the same capacity is usually slower, but the difference would be hard to feel during interactive use.
Looking outside the direct Samsung comparisons, the 1TB RD400 provides a capacity that Samsung doesn't yet offer, but it comes at a premium and the increased capacity doesn't provide much of a performance increase over the 512GB model. The 128GB RD400 on the other hand is smaller than any 950 Pro and thus competes mainly against grey market OEM Samsung SM951s that don't come with the nice 5-year warranty that Toshiba offers.
On the other hand, comparing the RD400 against SATA SSDs is tricky. At first glance, it may seem straightforward that a drive with two to three times the performance on most benchmarks is a good deal for a mere 30-50% price increase. But increased SSD performance brings diminishing returns for real-world use. PCIe SSDs are not yet mainstream products and are not a good value for consumers who aren't very sure that they will benefit noticeably from faster storage. Upgrading from a mechanical hard drive to a SSD alleviates a major performance bottleneck but the experience of moving from SATA SSDs to PCIe SSDs is not as revolutionary. I suspect most consumers would be better served with a larger SSD of moderate performance than a cramped but blazing fast PCIe drive, but for those who have the means and a need, the RD400 is a flagship halo product that unquestionably satisfies its purpose.
| High-End SSD Price Comparison | ||||
| Drive | 960GB- 1.2TB |
400GB- 512GB |
240GB- 256GB |
120GB- 128GB |
| OCZ RD400A (AIC) | $759.99 | $329.99 | $189.99 | $129.99 |
| OCZ RD400 (M.2 only) | $739.99 | $309.99 | $169.99 | $109.99 |
| Samsung 950 Pro | $316.99 | $178.00 | ||
| Samsung 850 Pro | $416.87 | $219.21 | $126.99 | $90.60 |
| Intel SSD 750 | $1199.99 | $349.99 | ||
| SanDisk Extreme Pro | $340.60 | $183.00 | $104.99 | |
| Samsung 850 EVO | $319.99 | $149.99 | $88.39 | $66.80 |
The RD400 does have some downsides other than not being the absolute fastest drive on the market. Our testing showed it to be significantly more power-hungry than the Samsung 950 Pro, which suggests it may be less suitable for laptop use. The higher power consumption is likely due to a combination of a less efficient controller and NAND that needs more power, but we don't have enough information to pin down the primary cause.
Overall the high power consumption in the small M.2 package also makes heat a somewhat greater concern. Like the Samsung 950 Pro, the RD400 strikes a precarious balance of performance against temperature. During our most intensive tests the OCZ SSD utility put up several alerts that thermal throttling had been engaged due to the drive's temperature. The temperature never got close to the critical level where damage to the drive is possible, but performance was negatively affected. Another round of testing is underway with the RD400s in our usual PCIe to M.2 adapter to investigate how the drive is affected by less effective cooling and how its power consumption differs when fed a direct 3.3V supply instead of using OCZ's adapter to convert 12V down to 3.3V. I suspect these tests will probably show that the RD400 is still inferior to the Samsung 950 Pro for laptop use.
Overall the Toshiba OCZ RD400 earns its place as a high-end SSD. It delivers great performance all around with no major weaknesses and is a solid competitor to the Samsung 950 Pro. It is roughly the second-fastest client SSD on the market and with pricing that promises to undercut the 950 Pro it should be a great value and a very welcome source of competitive pressure.


