Original Link: https://www.anandtech.com/show/10282/msi-cubi-2-plus-vpro-skylake-ministx-pc-review
MSI Cubi 2 Plus vPro Skylake mini-STX PC Review
by Ganesh T S on April 27, 2016 8:05 AM EST
The desktop PC market has been subject to many challenges over the last few years. However, the miniaturization trend (including the introduction of the ultra-compact form factor - UCFF - NUCs) has provided some bright spots. The recent introduction of the mini-STX (5x5) form factor has provided yet another option between the NUC and the mITX form factor for PC builders. The ECS LIVA One was one of the first mini-STX PCs to come to the market. MSI also quickly followed with the introduction of the Cubi 2 Plus models. The consumer-focused Cubi 2 Plus is complemented by the business-focused Cubi 2 Plus vPro.
Introduction and Setup Impressions
MSI entered the UCFF PC market with a set of models under the Cubi brand. They were based on Broadwell processors. Earlier this year, they launched the Cubi 2 Plus mini-PCs with a slightly larger form factor. Unlike the soldered processors in the Cubi-mini PC kits, the Cubi 2 Plus models come with a LGA 1151 socket and are capable of supporting Skylake CPUs with TDPs of up to 35W (-T series).
MSI initially wanted to sample the Cubi 2 Plus vPro, but, due to some logistics issues, we ended up with a regular Cubi 2 Plus unit. I went ahead and completed our standard mini-PC evaluation routine. After I sent some feedback and questions, MSI realized that we didn't have the vPro unit in hand, and arranged for a vPro unit to replace the regular version. The first sample had a Samsung SM951 128GB NVMe card and a 8GB DDR4 SO-DIMM (SK Hynix HMA41GS6AFR8N-TF) pre-installed. The vPro one came with a HGST HTS725050A7E630 (500 GB, 7200 RPM, SATA-III) hard drive and a single 4GB DDR4 SO-DIMM (SK Hynix HMA451S6AFR8N-TF). Both configurations had Windows 10 Home pre-installed. The regular Cubi 2 Plus was processed with its original hardware configuration, but, the OS was upgraded to Windows 10 Pro x64. For the vPro model, we completely reconfigured the unit. There was no point in handicapping it with single-channel memory and a hard drive for primary storage. Therefore, we installed a Mushkin Atlas Vital 250GB M.2 SATA SSD and a 2x8GB Patriot Memory DDR4 SO-DIMM kit.
The presence of a mini-STX motherboard in the Cubi 2 Plus models makes the ECS LIVA One a valid comparison point. The Cubi 2 Plus models are thicker (155.3mm x 147.9mm x 62.2mm) compared to the ECS LIVA One (173mm x 176mm x 33mm), though this doesn't consider the 2.5" disk drive / ODD add-on for the latter. While the ECS LIVA One can be oriented horizontally or vertically, the Cubi 2 Plus models are meant to be placed horizontally. VESA mounting is possible for both of them. The bigger z-height for the Cubi 2 Plus models enable more ventilation slots compared to the ECS LIVA One. Internally, the most obvious difference is the use of DDR4 SO-DIMM slots in the Cubi 2 Plus (compared to the DDR3L slots in the ECS LIVA One).
In addition to the main unit pictured above, the Cubi 2 Plus packages contain a 90W (19V @ 4.74A) power adapter, a VESA mount with appropriate screws, a user guide and a special cable to provide SATA connectivity if the end-user opts to install a 2.5" drive in the system. The vPro sample already had this cable pre-installed along with the hard drive.
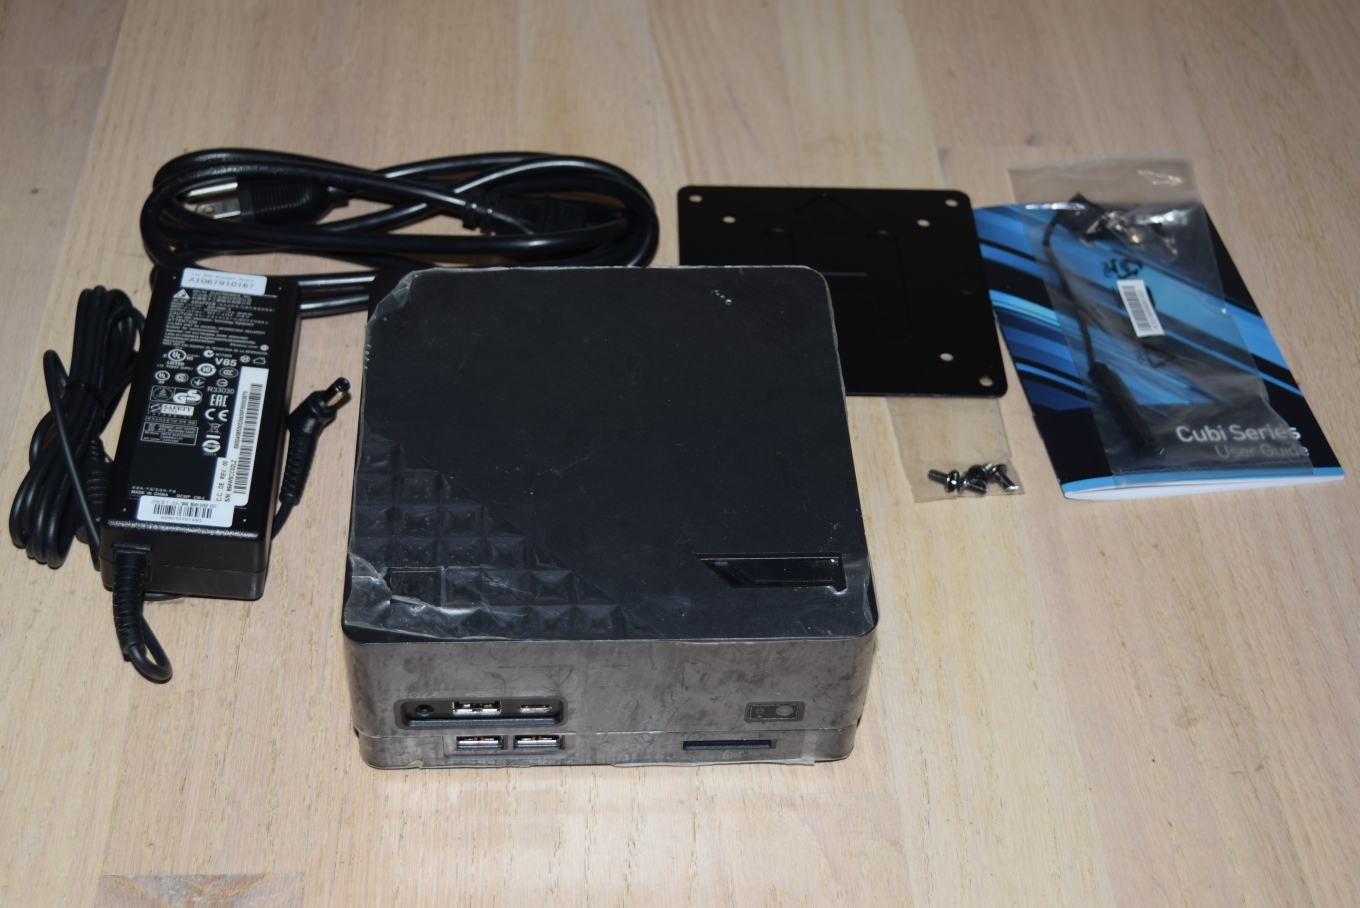
The galleries below takes us around the packaging and chassis design of the two models. Important aspects to note include the completely revamped I/O in the lower part of the chassis. While the regular model has 2x USB 2.0 ports and a SD card reader in the front, the vPro model adds a serial port, a HDMI port and another USB 2.0 port in the rear. The rest of the I/Os are summarized in the table that follows the galleries.


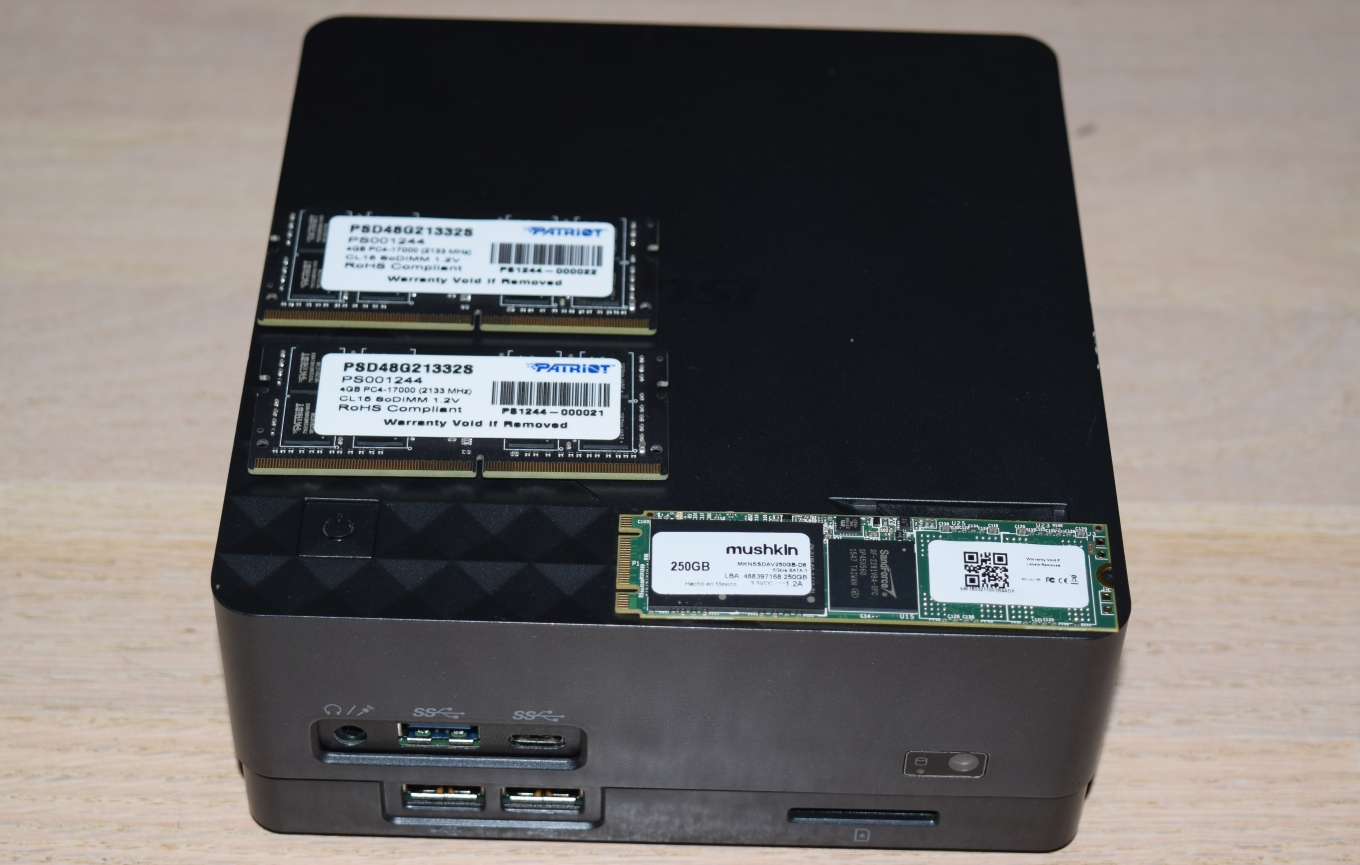
The internal layout of the components in both the models is similar. The gallery below presents a limited teardown of the regular model.


The specifications of the review configurations of both models are summarized in the table below. While the regular model is configured as a powerful mini-PC for home users, the vPro model targets business use-cases.
| MSI Cubi 2 Plus Specifications | ||
| Cubi 2 Plus | Cubi 2 Plus vPro | |
| CPU | Intel Core i3-6100T (2C/4T Skylake x86 @ 3.2 GHz, 14nm, 3 MB L2, 35W TDP) |
Intel Core i5-6500T (4C/4T Skylake x86 @ 2.5 GHz, 14nm, 6 MB L2, 35W TDP) |
| PCH | Intel H110 | Intel Q170 |
| Graphics | Intel HD Graphics 530 (24 EU) @ 350 MHz (Turbo 950 MHz) | Intel HD Graphics 530 (24 EU) @ 350 MHz (Turbo 1.1 GHz) |
| Memory | SK Hynix HMA41GS6AFR8N-TF DDR4 16-15-15-36 @ 2133 MHz 1x8 GB |
Patriot Memory PSD48G21332S DDR4 16-15-15-36 @ 2133 MHz 2x8 GB |
| Storage | Samsung SM951 Series MZVPV128 (128 GB; M.2 Type 2280 PCIe 3.0 x4 NVMe; 16nm; MLC) |
Mushkin Atlas Vital MKNSSDAV250GB-D8 (250 GB; M.2 Type 2280 SATA III; MLC) |
| Wi-Fi | Intel Dual Band Wireless-AC 3165 (1x1 802.11ac - 433 Mbps) |
|
| Ethernet | Intel Gigabit Ethernet Connection I219-V with RJ45 connector | Intel Gigabit Ethernet Connection I219-LM with RJ45 connector |
| Display Outputs | 1x HDMI 1.4b, 1x DisplayPort 1.2 |
2x HDMI 1.4b, 1x DisplayPort 1.2 |
| Audio | TRRS connector for headset with microphone | |
| Miscellaneous I/O Ports | 1x USB 3.1 Gen 1 Type-C (5 Gbps), 2x USB 3.0 Type-A (5 Gbps), 4x USB 2.0 (including one with charging capabilities), SD Card Reader |
1x USB 3.1 Gen 1 Type-C (5 Gbps), 3x USB 3.0 Type-A (5 Gbps), 4x USB 2.0 (including one with charging capabilities), SD Card Reader Serial Port |
| Dimensions | 155.3 x 147.9 x 58.6 (mm) | |
| PSU | External, 90 W | |
| Pricing | $210 (barebones), $496 (as configured) | $270 (barebones), $683 (as configured) |
| Full Specifications | Cubi 2 Plus Specifications | Cubi 2 Plus vPro Specifications |
We installed Windows 10 Pro x64 on both models. Drivers were downloaded from the product page and the setup process was uneventful. On the BIOS front, the features in the H110-based regular model were quite basic. It didn't even have a list of storage devices (SATA or M.2) attached to the system, and it also didn't report the amount of RAM installed. On the other hand, the Q170-based vPro model had a much more useful BIOS. In addition to the DRAM and storage device information, there is also support for Intel AMT (Active Management Technology) BIOS extensions. Secure boot options are available in both BIOS versions.


In the table below, we have an overview of the various systems that we are comparing the Cubi 2 Plus models against. Note that they may not belong to the same market segment. The relevant configuration details of the machines are provided so that readers have an understanding of why some benchmark numbers are skewed for or against the Cubi 2 Plus when we come to those sections.
| Comparative PC Configurations | ||
| Aspect | MSI Cubi 2 Plus vPro | |
| CPU | Intel Core i5-6500T | Intel Core i5-6500T |
| GPU | Intel HD Graphics 530 | Intel HD Graphics 530 |
| RAM | Patriot Memory PSD48G21332S DDR4 16-15-15-36 @ 2133 MHz 2x8 GB |
Patriot Memory PSD48G21332S DDR4 16-15-15-36 @ 2133 MHz 2x8 GB |
| Storage | Mushkin Atlas Vital MKNSSDAV250GB-D8 (250 GB; M.2 Type 2280 SATA III; MLC) |
Mushkin Atlas Vital MKNSSDAV250GB-D8 (250 GB; M.2 Type 2280 SATA III; MLC) |
| Wi-Fi | Intel Dual Band Wireless-AC 3165 (1x1 802.11ac - 433 Mbps) |
Intel Dual Band Wireless-AC 3165 (1x1 802.11ac - 433 Mbps) |
| Price (in USD, when built) | $683 | $683 |
Platform Analysis and vPro Capabilities
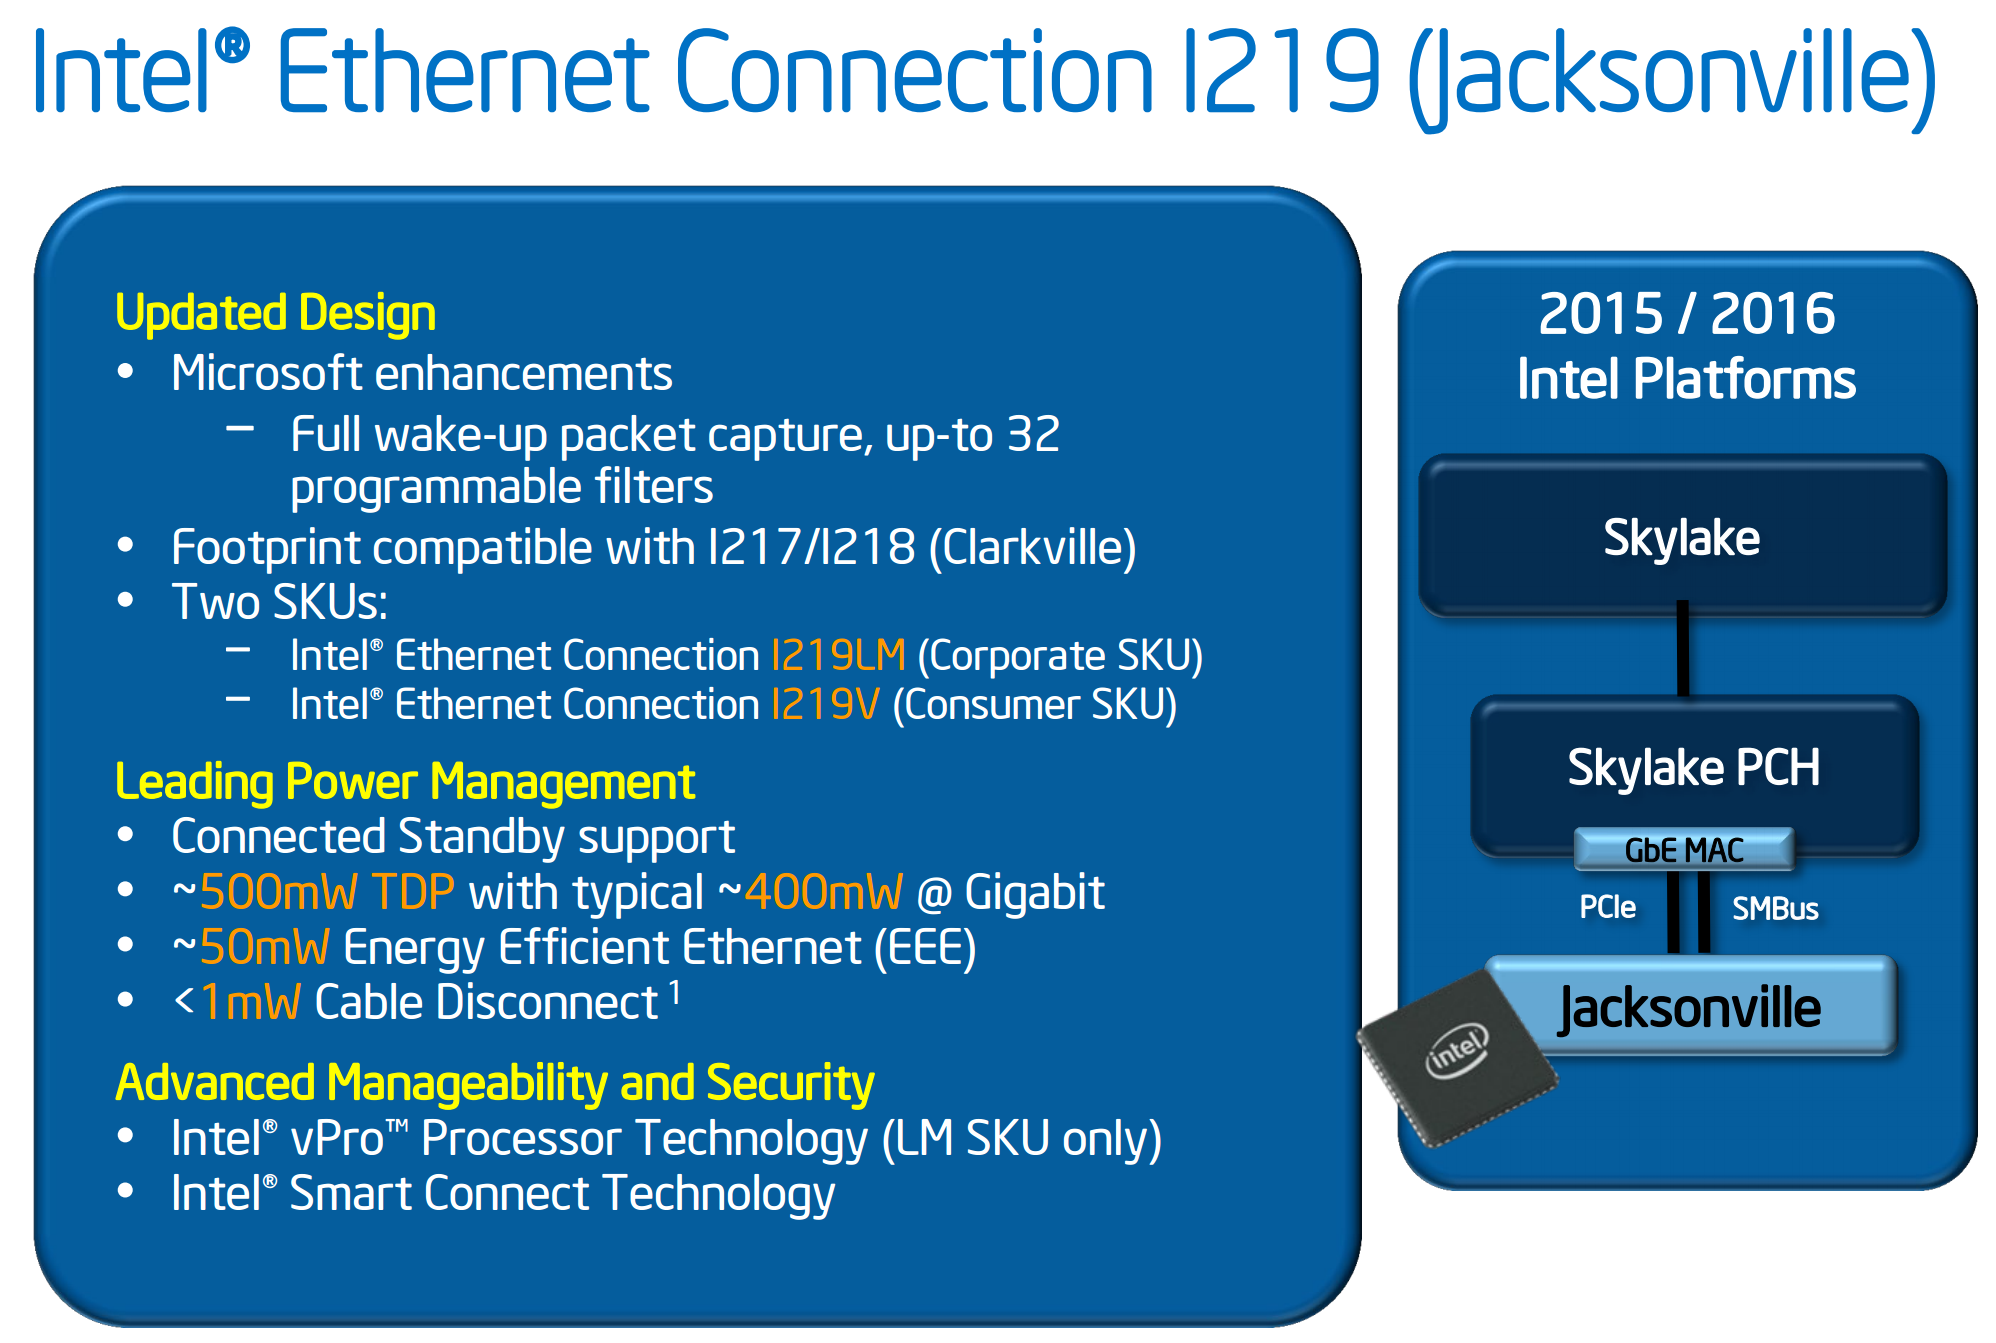
The Cubi 2 Plus is based on the H110 chipset, while the vPro model is based on the Q170 chipset. Another important difference in the motherboards is the presence of the Intel I219-LM Gigabit Ethernet Controller on the vPro model (compared to the Intel I219-V on the regular one). The LM SKU supports Intel vPro features, while the V does not.
The differences between the H110 and Q170 can be seen in the table below. Intel is able to price the H110 low because it loses many interesting features such as support for PCIe 3.0 (all PCIe lanes are Gen 2 only).
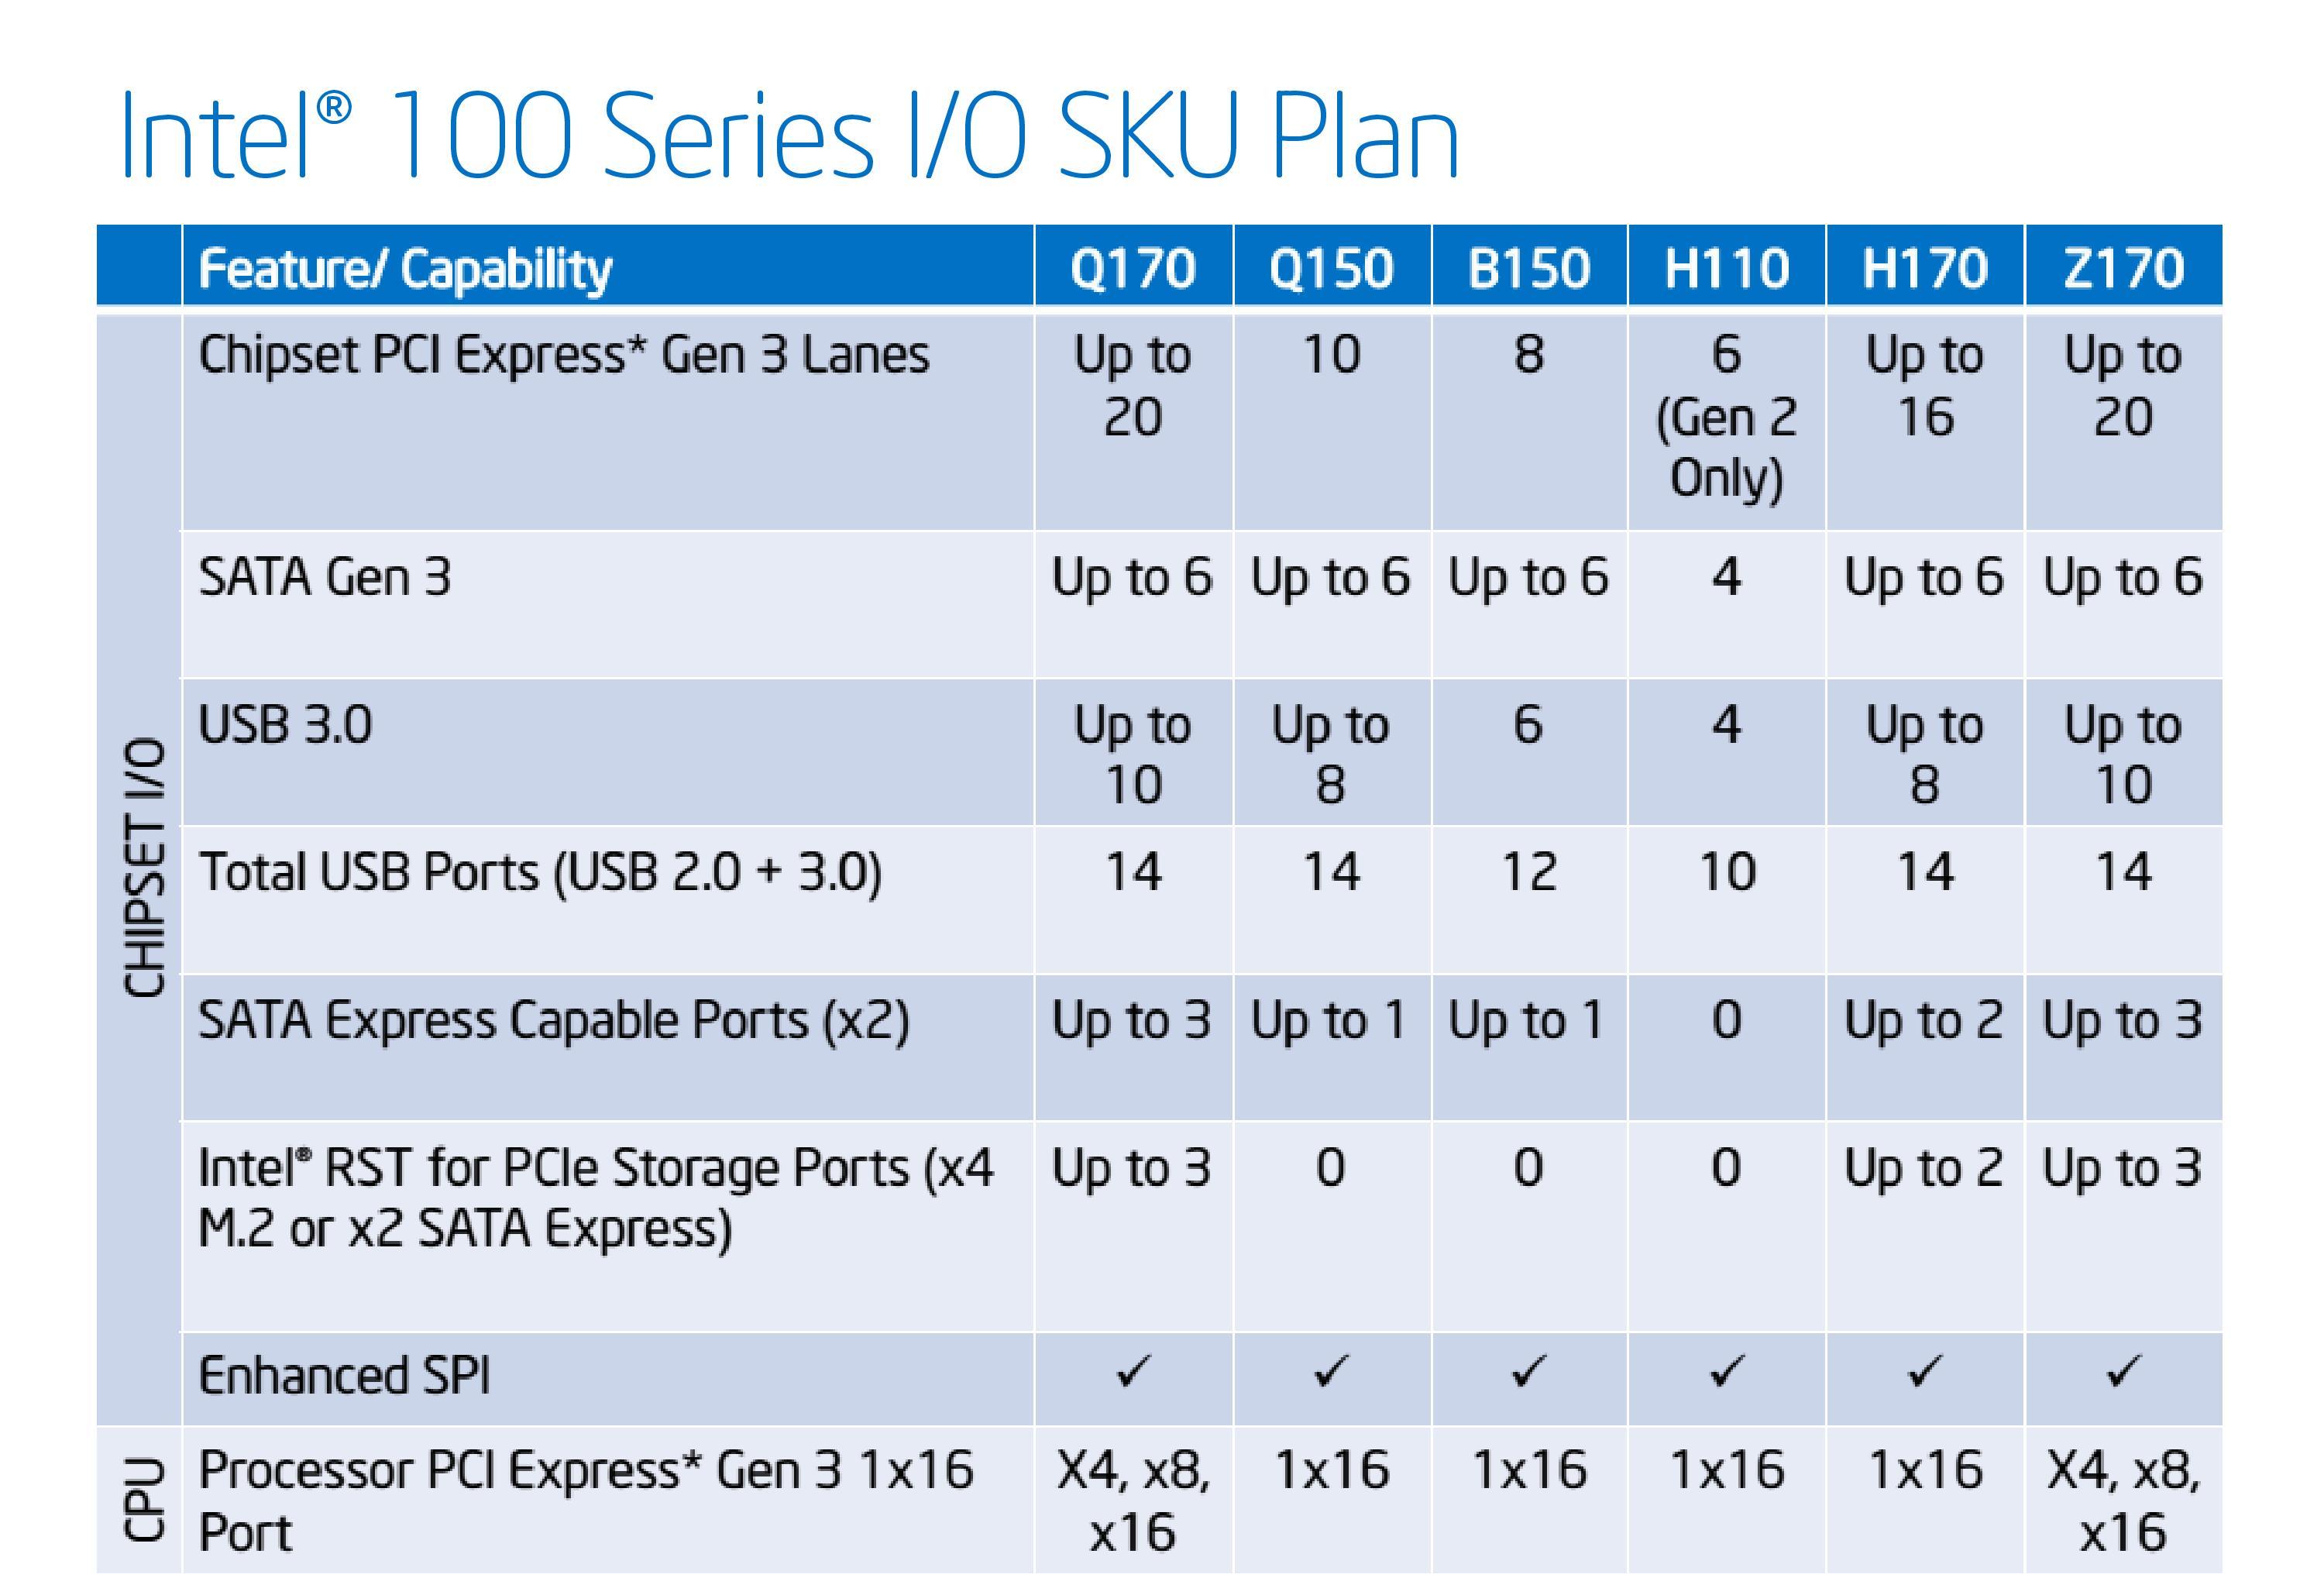
The H110 chipset also doesn't support Intel RST (Rapid Storage Technology) for setting up SATA drives in a RAID configuration.
Despite the extra hardware capabilities of the Q170 chipset, MSI has decided to focus solely on the vPro capabilities in that model. The PCIe lanes are used in a similar manner in both the models (probably done to simplify board design efforts).
- PCIe 2.0 x1 for the Intel Dual Band Wireless-AC 3165 AC HMC WiFi Adapter
- PCIe 2.0 x1 for the Realtek PCIe CardReader
- PCIe 2.0 x4 for the M.2 PCIe SSD (if one is present)
Moving on to the vPro capabilities, we already looked at the various BIOS extensions available for the Intel Active Management Technology (AMT). AMT is particularly useful for IT administrators in business settings. They can remotely manage, support and maintain compatible PCs in the company network. AMT involves both hardware and firmware features. In the review of the Logic Supply ML100G-30, I had described how the BIOS extensions for AMT can be configured to enable out-of-band management of the PC over a particular network interface. Coupled with AMT, remote KVM allows control of even the boot process over that network interface.
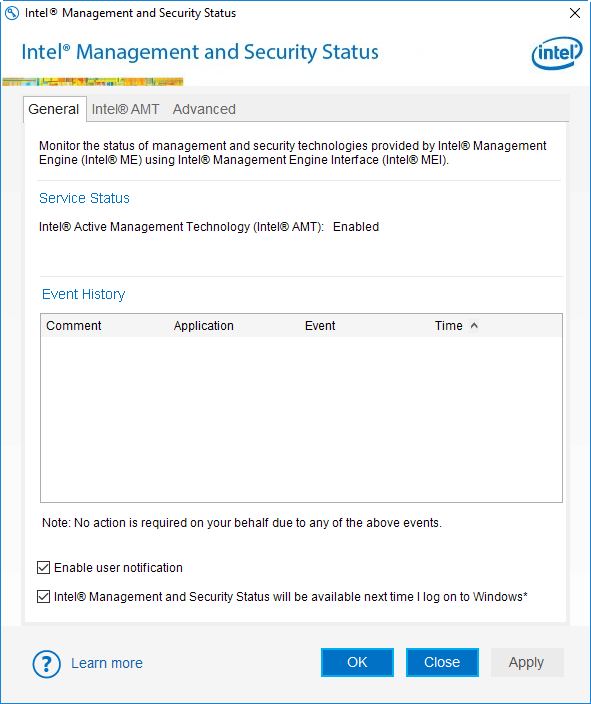
Intel AMT status can also be monitored from within Windows.


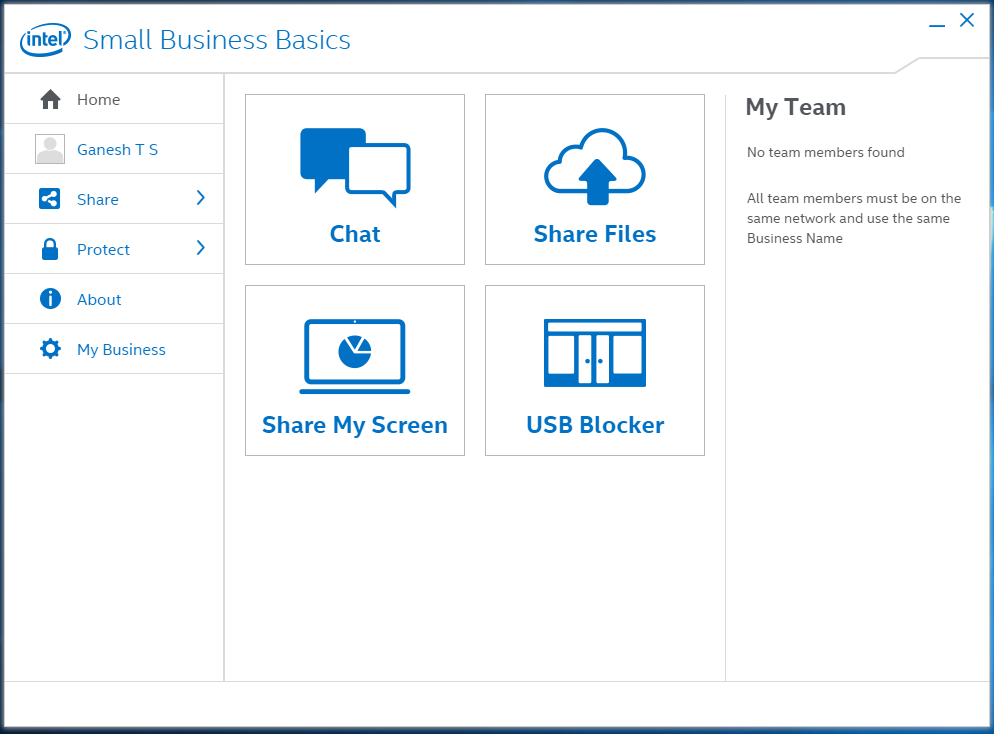
Intel's Small Business Advantage (SBA) is a boon for small IT groups. It allows an administrator to be in touch with all the computers in the network for support purposes as well as to restrict usage of, say, USB ports on the PCs.
Skylake vPro brings more features of use to IT administrators. Intel Authenticate is obviously the biggest, though we didn't get a chance to test that out with the Cubi 2 Plus vPro.
Performance Metrics - I
The MSI Cubi 2 Plus models were evaluated using our standard test suite for low power desktops / industrial PCs. Starting with this review, we will be including SYSmark 2014 scores in addition to Futuremark benchmarks in this section.
BAPCo SYSmark 2014
BAPCo's SYSmark 2014 is an application-based benchmark that uses real-world applications to replay usage patterns of business users in the areas of office productivity, media creation and data/financial analysis. Scores are meant to be compared against a reference desktop (HP ProDesk 600 G1 with a Core i3-4130, 4GB RAM and a 500GB hard drive) that scores 1000 in each of the scenarios. A score of, say, 2000, would imply that the system under test is twice as fast as the reference system.
Since this is one of the first mini-PC reviews to carry SYSmark 2014 scores, we didn't have enough comparison points. The Cubi 2 Plus model had already been sent back to MSI before we took the decision to run SYSmark 2014 on the mini-PCs that come in for reiew. Therefore, we decided to process the benchmark on the original vPro configuration supplied by MSI (with a 500GB hard drive and one 4GB DDR4 SO-DIMM).
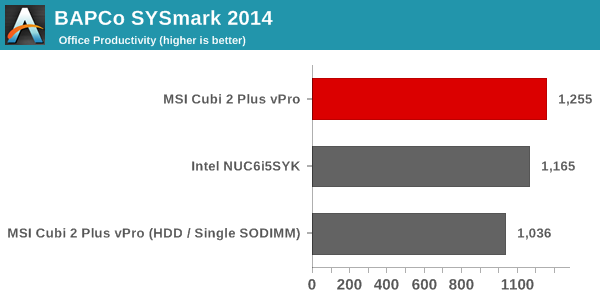
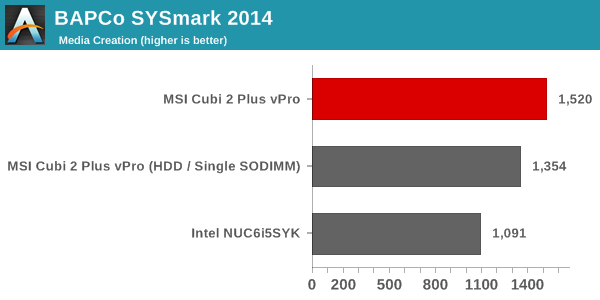
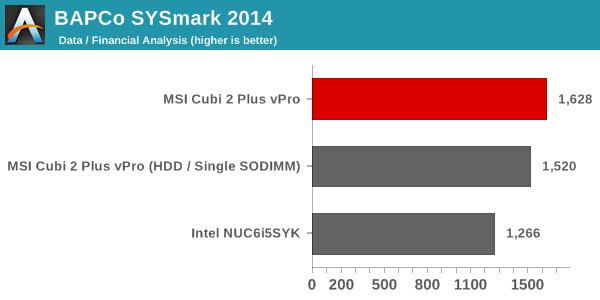
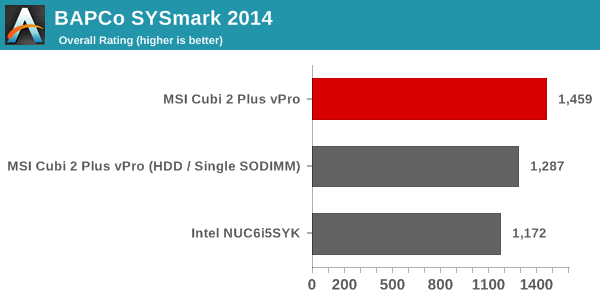
The above results show that we get considerable increase in performance by moving to a SSD from a HDD (even just a SATA-based one) and using both SODIMM slots instead of just one. The 35W TDP Core i5-6500T is also obviously well ahead of the 15W TDP (cTDP-ed up to 23W unofficially) Core i5-6260U in the Intel NUC6i5SYK in all benchmarks. That said, the HDD / single-channel memory configuration does lose out to the Skylake NUC in the office productivity benchmark, indicating that the workload actually benefits a great deal from a faster and more efficient storage subsystem.
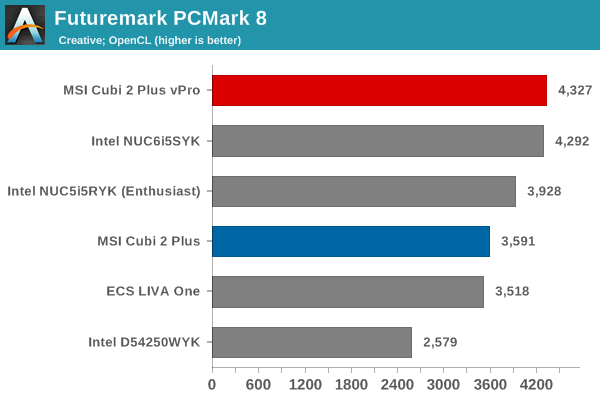
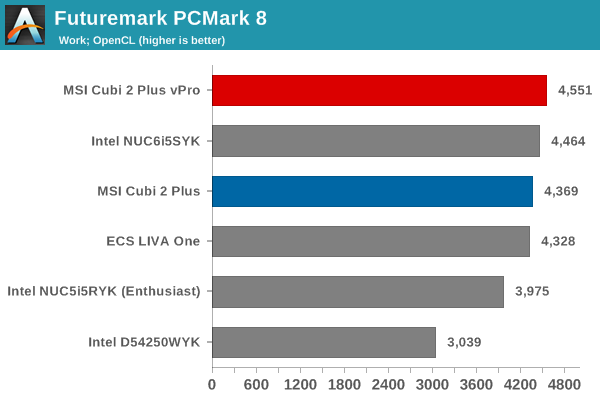
Futuremark PCMark 8
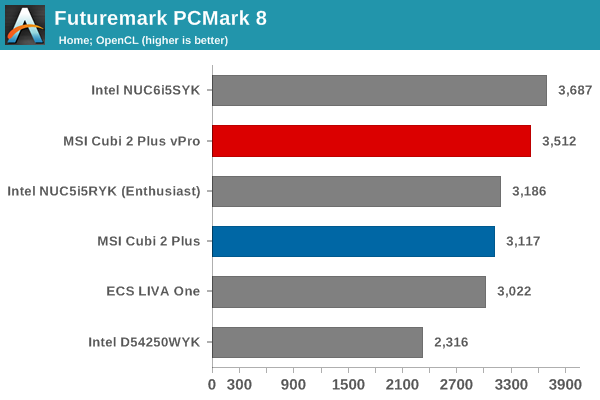
PCMark 8 provides various usage scenarios (home, creative and work) and offers ways to benchmark both baseline (CPU-only) as well as OpenCL accelerated (CPU + GPU) performance. We benchmarked select PCs for the OpenCL accelerated performance in all three usage scenarios. These scores are heavily influenced by the CPU in the system. Compared to SYSmark 2014, these scores show a stiff competition between the Core i5-6260U and the Core i5-6500T, though the latter one does win out on most of the benchmarks. The Core i3-6100T, unfortunately, is not a great competitor when the Core i5-equipped systems are considered.
Miscellaneous Futuremark Benchmarks
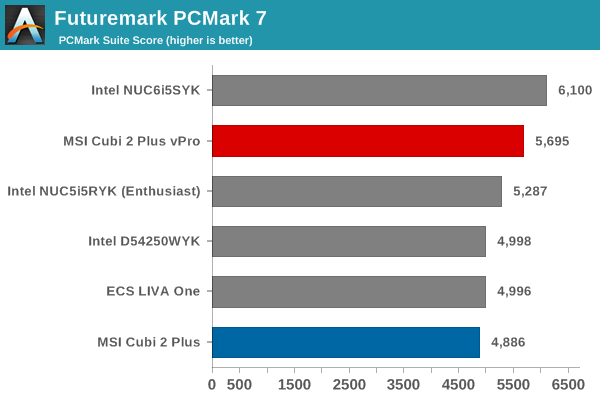
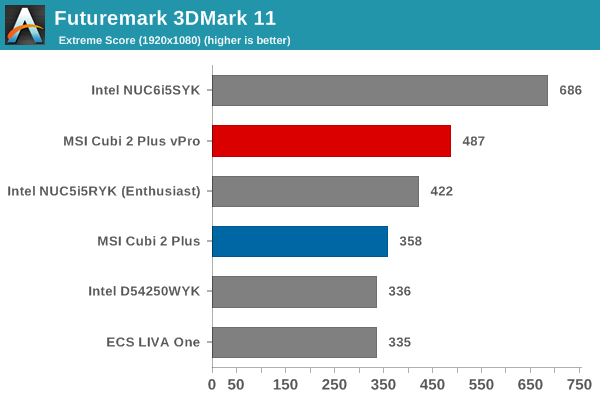
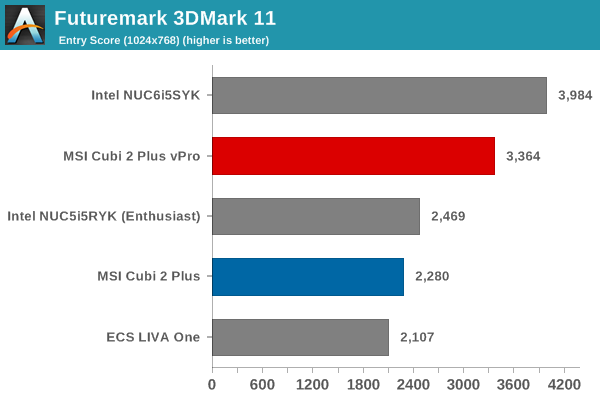
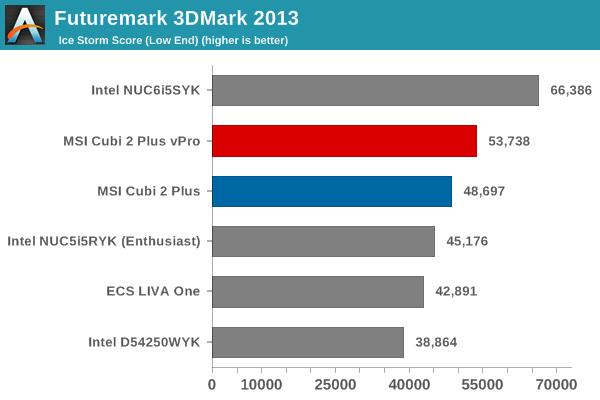
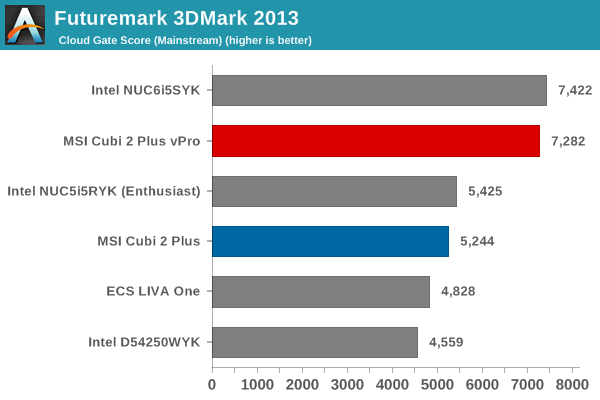
The GPU benchmarks show a clear lead for the Core i5-6260U. GPU performance is one of the focus points for the U-series chipsets compared to the traditional desktop processors such as the Core i3-6100T and the Core i5-6500T.
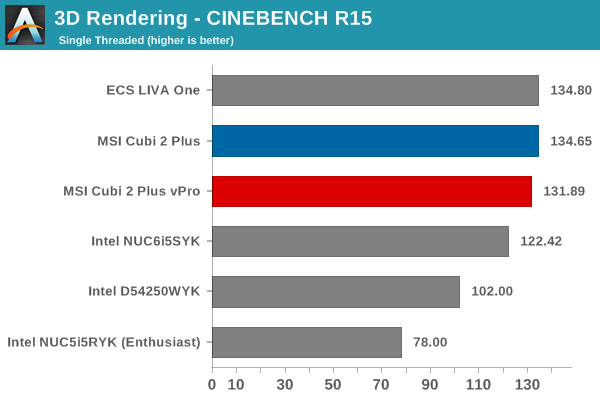
3D Rendering - CINEBENCH R15
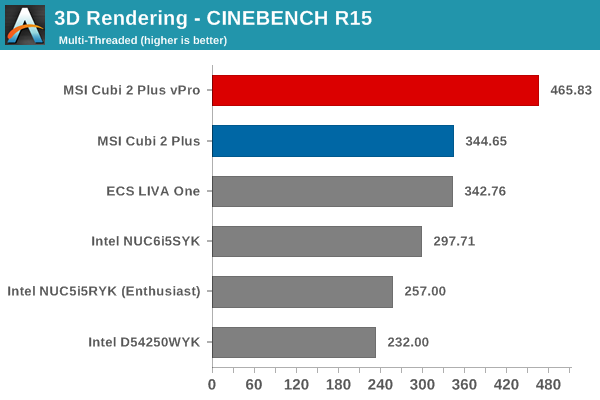
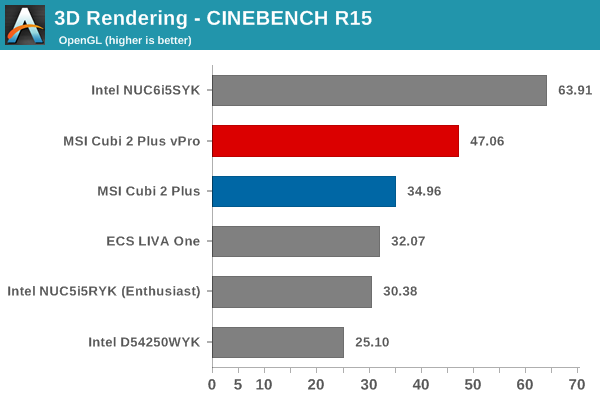
We have moved on from R11.5 to R15 for 3D rendering evaluation. CINEBENCH R15 provides three benchmark modes - OpenGL, single threaded and multi-threaded. Evaluation of select PCs in all three modes provided us the following results. Here, the higher clocks in the Core i3-6100T compared to the Core i5-6500T help in single-threaded performance. However, the four physical cores in the Core i5-6500T help the vPro model to achieve impressive results in the multi-threaded benchmark. The OpenGL scores reflect the better GPU in the Skylake NUC. The higher turbo rate (1.1 GHz) of the Intel Graphics 530 in the Core i5-6500T / vPro model helps it get an edge over the Core i3-6100T in the regular version.
Performance Metrics - II
In this section, we mainly look at benchmark modes in programs used on a day-to-day basis, i.e, application performance and not synthetic workloads.
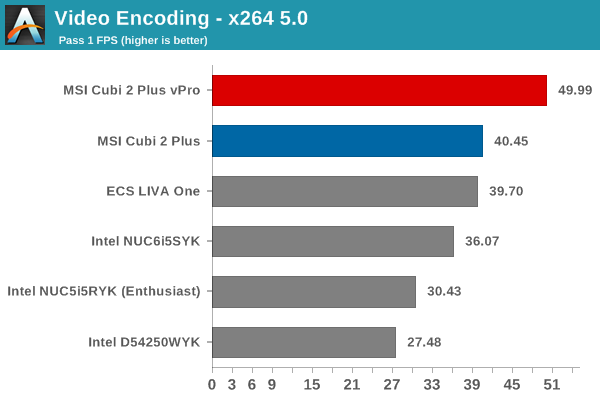
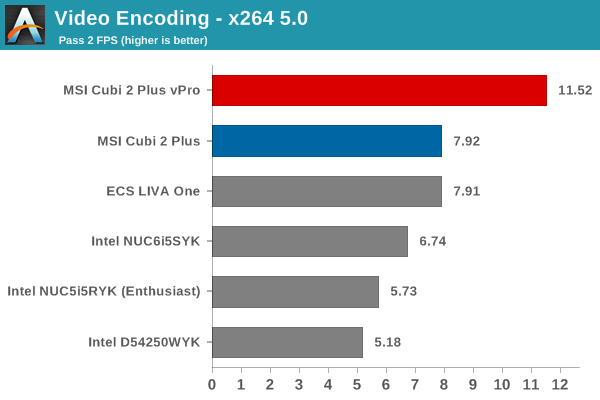
x264 Benchmark
First off, we have some video encoding benchmarks courtesy of x264 HD Benchmark v5.0. This is simply a test of CPU performance - both clock speed and multi-threading capabilities. As expected, the Core i5-6500T emerges as the best of the lot by a huge margin.
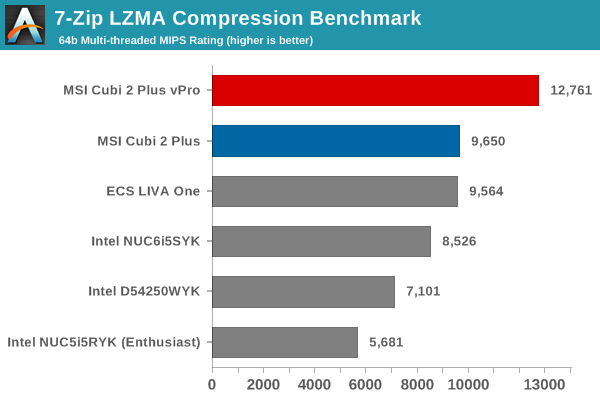
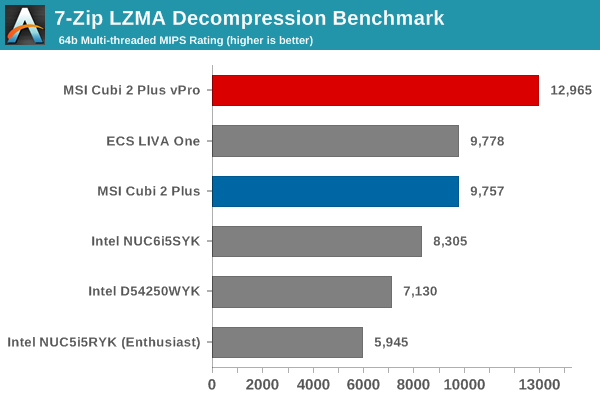
7-Zip
7-Zip is a very effective and efficient compression program, often beating out OpenCL accelerated commercial programs in benchmarks even while using just the CPU power. 7-Zip has a benchmarking program that provides tons of details regarding the underlying CPU's efficiency. In this subsection, we are interested in the compression and decompression MIPS ratings when utilizing all the available threads. The Core i5-6500T again emerges as a comfortable winner.
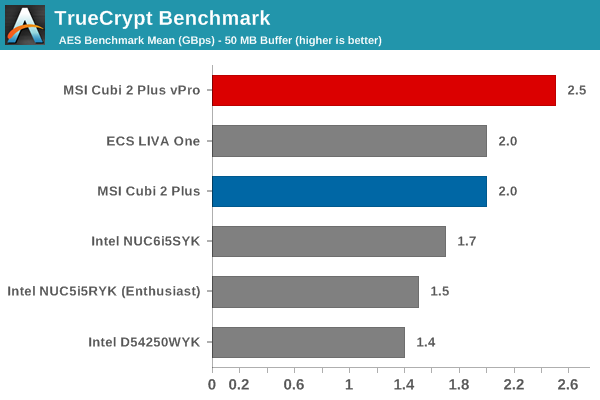
TrueCrypt
As businesses (and even home consumers) become more security conscious, the importance of encryption can't be overstated. CPUs supporting the AES-NI instruction for accelerating the encryption and decryption processes used to be restricted to the higher end SKUs. However, starting with Bay Trail, even the lowly Atom series started gaining support for AES-NI. TrueCrypt, a popular open-source disk encryption program can take advantage of the AES-NI capabilities. The TrueCrypt internal benchmark provides some interesting cryptography-related numbers to ponder. In the graph below, we can get an idea of how fast a TrueCrypt volume would behave in the MSI Cubi 2 Plus vPro and how it would compare with other select PCs. This is a purely CPU feature / clock speed based test.
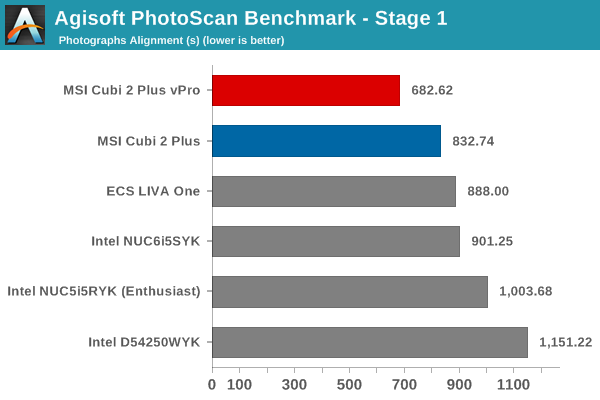
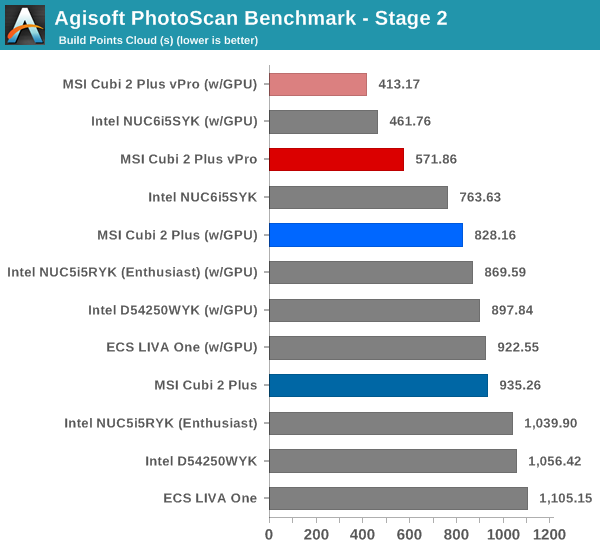
Agisoft Photoscan
Agisoft PhotoScan is a commercial program that converts 2D images into 3D point maps, meshes and textures. The program designers sent us a command line version in order to evaluate the efficiency of various systems that go under our review scanner. The command line version has two benchmark modes, one using the CPU and the other using both the CPU and GPU (via OpenCL). The benchmark takes around 50 photographs and does four stages of computation:
- Stage 1: Align Photographs
- Stage 2: Build Point Cloud (capable of OpenCL acceleration)
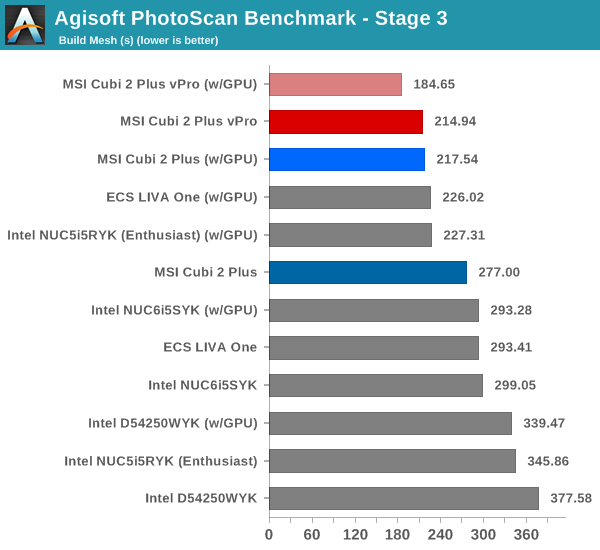
- Stage 3: Build Mesh
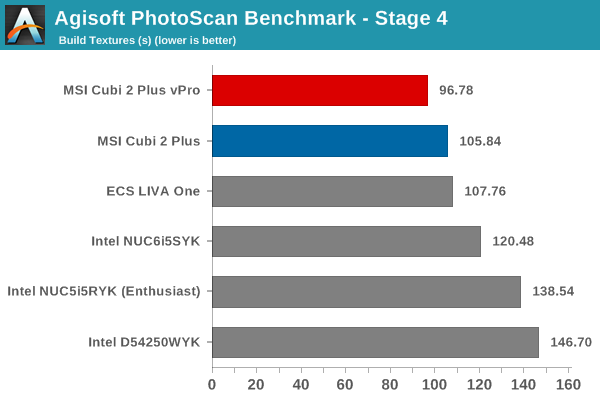
- Stage 4: Build Textures
We record the time taken for each stage. Since various elements of the software are single threaded, others multithreaded, and some use GPUs, it is interesting to record the effects of CPU generations, speeds, number of cores, DRAM parameters and the GPU using this software.
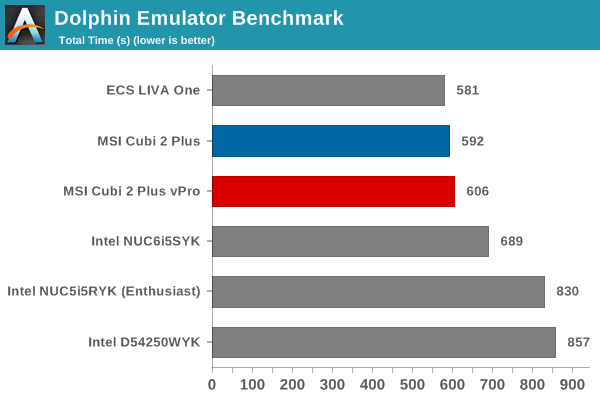
Dolphin Emulator
Wrapping up our application benchmark numbers is the Dolphin Emulator benchmark mode results. This is again a test of the CPU capabilities, and it seems to fare well where single-threaded performance is good. That is probably the reason why the higher-clocked Core i3-6100T in the ECS LIVA One and the MSI Cubi 2 Plus fares better than the Core i5-6500T in the Cubi 2 Plus vPro. That said, the margin between the three is very small.
Networking and Storage Performance
Networking and storage are two major aspects which influence our experience with any computing system. This section presents results from our evaluation of these aspects in the MSI Cubi 2 Plus vPro. On the storage side, one option would be repetition of our strenuous SSD review tests on the drive(s) in the PC. Fortunately, to avoid that overkill, PCMark 8 has a storage bench where certain common workloads such as loading games and document processing are replayed on the target drive. Results are presented in two forms, one being a benchmark number and the other, a bandwidth figure. We ran the PCMark 8 storage bench on selected PCs and the results are presented below.
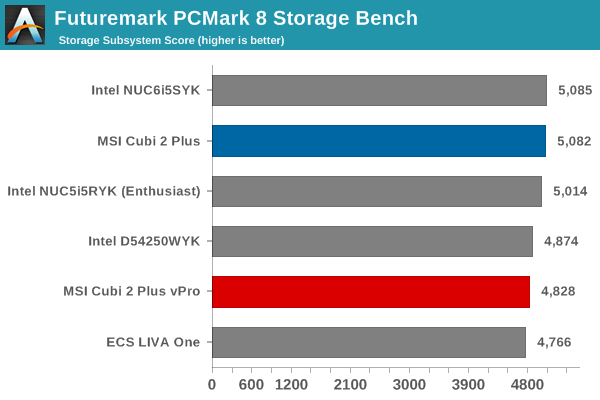
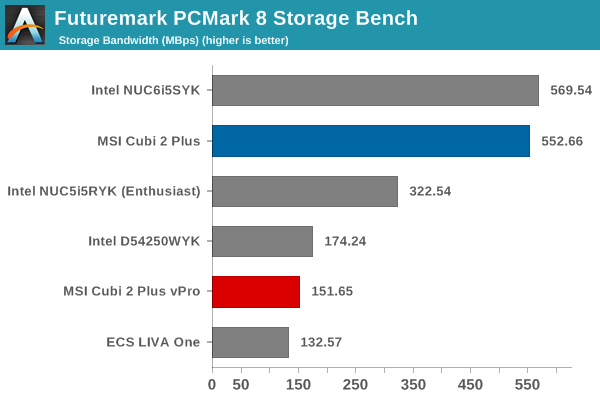
The Samsung SM951 NVMe drive performs similarly in both the Cubi 2 Plus (Core i3-6100T) and the NUC6i5SYK (Core i5-6260U). The SATA-based Mushkin Atlas Vital 250GB SandForce SF2281 drive performs admirably when the storage subsystem score is considered, but, its SATA interface unfortunately pulls down the storage bandwidth numbers compared to the PCIe NVMe drives.
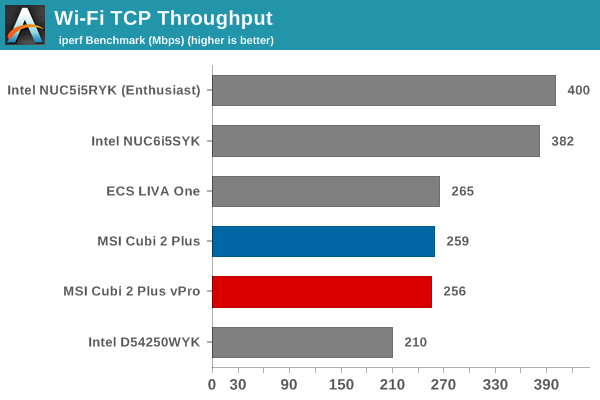
On the networking side, we restricted ourselves to the evaluation of the WLAN component. Our standard test router is the Netgear R7000 Nighthawk configured with both 2.4 GHz and 5 GHz networks. The router is placed approximately 20 ft. away, separated by a drywall (as in a typical US building). A wired client (Zotac ID89-Plus) is connected to the R7000 and serves as one endpoint for iperf evaluation. The PC under test is made to connect to either the 5 GHz (preferred) or 2.4 GHz SSID and iperf tests are conducted for both TCP and UDP transfers. It is ensured that the PC under test is the only wireless client for the Netgear R7000. We evaluate total throughput for up to 32 simultaneous TCP connections using iperf and present the highest number in the graph below.
In the UDP case, we try to transfer data at the highest rate possible for which we get less than 1% packet loss.
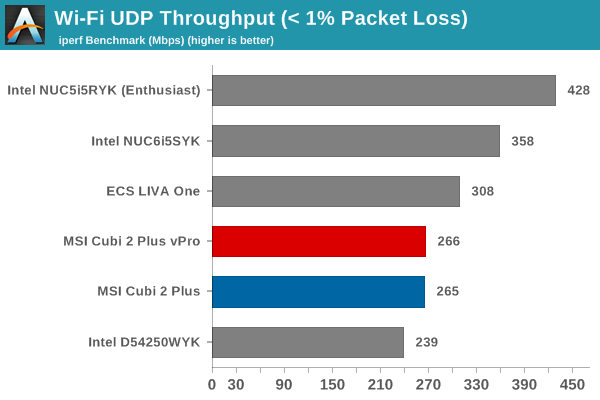
The numbers are very good for a single-stream 802.11ac card. This is probably due to good antenna placement inside the unit and the fact that the chassis is completely made of plastic.
HTPC Credentials
The MSI Cubi 2 Plus is relatively quiet considering the fact that it has an actively cooled 35W CPU inside. Consumers looking for high-end / fanless HTPCs need to look elsewhere. However, the Cubi 2 Plus is more than capable enough when it comes to basic HTPC duties - OTT streaming and playback of various media codecs flawlessly in an efficient manner.
The vPro model is meant for business use and it doesn't make sense to evaluate it for HTPC duties. So, this section deals only with the Core i3-6100T model. In addition, we have already seen the HTPC capabilities of the Core i3-6100T in the ECS LIVA One review. The treatment in this section will, therefore, be cursory in nature.
Refresh Rate Accurancy
Starting with Haswell, Intel, AMD and NVIDIA have been on par with respect to display refresh rate accuracy. The most important refresh rate for videophiles is obviously 23.976 Hz (the 23 Hz setting). As expected, the MSI Cubi 2 Plus has no trouble with refreshing the display appropriately in this setting.

The gallery below presents some of the other refresh rates that we tested out. The first statistic in madVR's OSD indicates the display refresh rate.


Network Streaming Efficiency
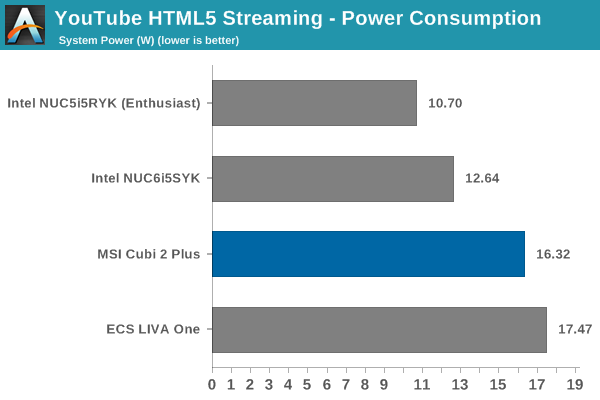
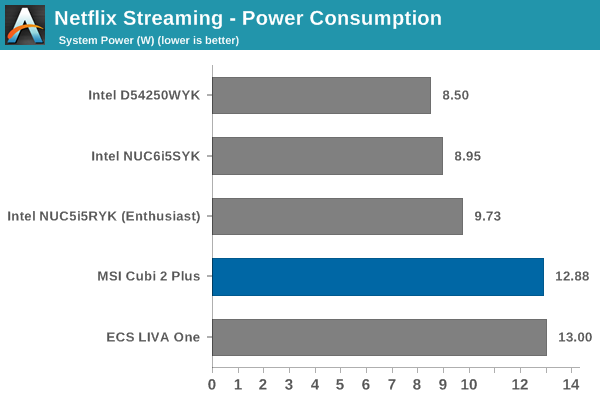
Evaluation of OTT playback efficiency was done by playing back our standard YouTube test stream and five minutes from our standard Netflix test title. Using HTML5, the YouTube stream plays back a 1080p encoding. Since YouTube now defaults to HTML5 for video playback, we have stopped evaluating Adobe Flash acceleration. Note that only NVIDIA exposes GPU and VPU loads separately. Both Intel and AMD bundle the decoder load along with the GPU load. The following two graphs show the power consumption at the wall for playback of the HTML5 stream in Mozilla Firefox (v 45.0.3). Being a full-blown desktop platform means that the Cubi 2 Plus, like the LIVA One, is not particularly power-efficient when it comes to these HTPC workloads.
Netflix streaming evaluation was done using the Windows 10 Netflix app. Manual stream selection is available (Ctrl-Alt-Shift-S) and debug information / statistics can also be viewed (Ctrl-Alt-Shift-D). Statistics collected for the YouTube streaming experiment were also collected here.
Decoding and Rendering Benchmarks
In order to evaluate local file playback, we concentrate on EVR-CP and madVR. We already know that EVR works quite well even with the Intel IGP for our test streams. Under madVR, we used the DXVA2 scaling logic (as it is well known that the stressful configurations don't work even on the Iris Pro-equipped processors). We considered four different cases while evaluating the ECS LIVA One. In this review, we dropped the testing with Kodi and Quick Sync.
In our earlier reviews, we focused on presenting the GPU loading and power consumption at the wall in a table (with problematic streams in bold). Starting with the Broadwell NUC review, we decided to represent the GPU load and power consumption in a graph with dual Y-axes. Nine different test streams of 90 seconds each were played back with a gap of 30 seconds between each of them. The characteristics of each stream are annotated at the bottom of the graph. Since the Intel Skylake GPU load reported by third-party tools is only the EU load, it doesn't particularly reflect the actual load. Fortunately, Intel also provides instantaneous power consumption numbers for the GPU block. Note that the GPU usage is graphed in red and needs to be considered against the left axis, while the GPU and at-wall power consumption need to be considered against the right axis.
Frame drops are evident whenever the GPU load consistently stays above the 85 - 90% mark.
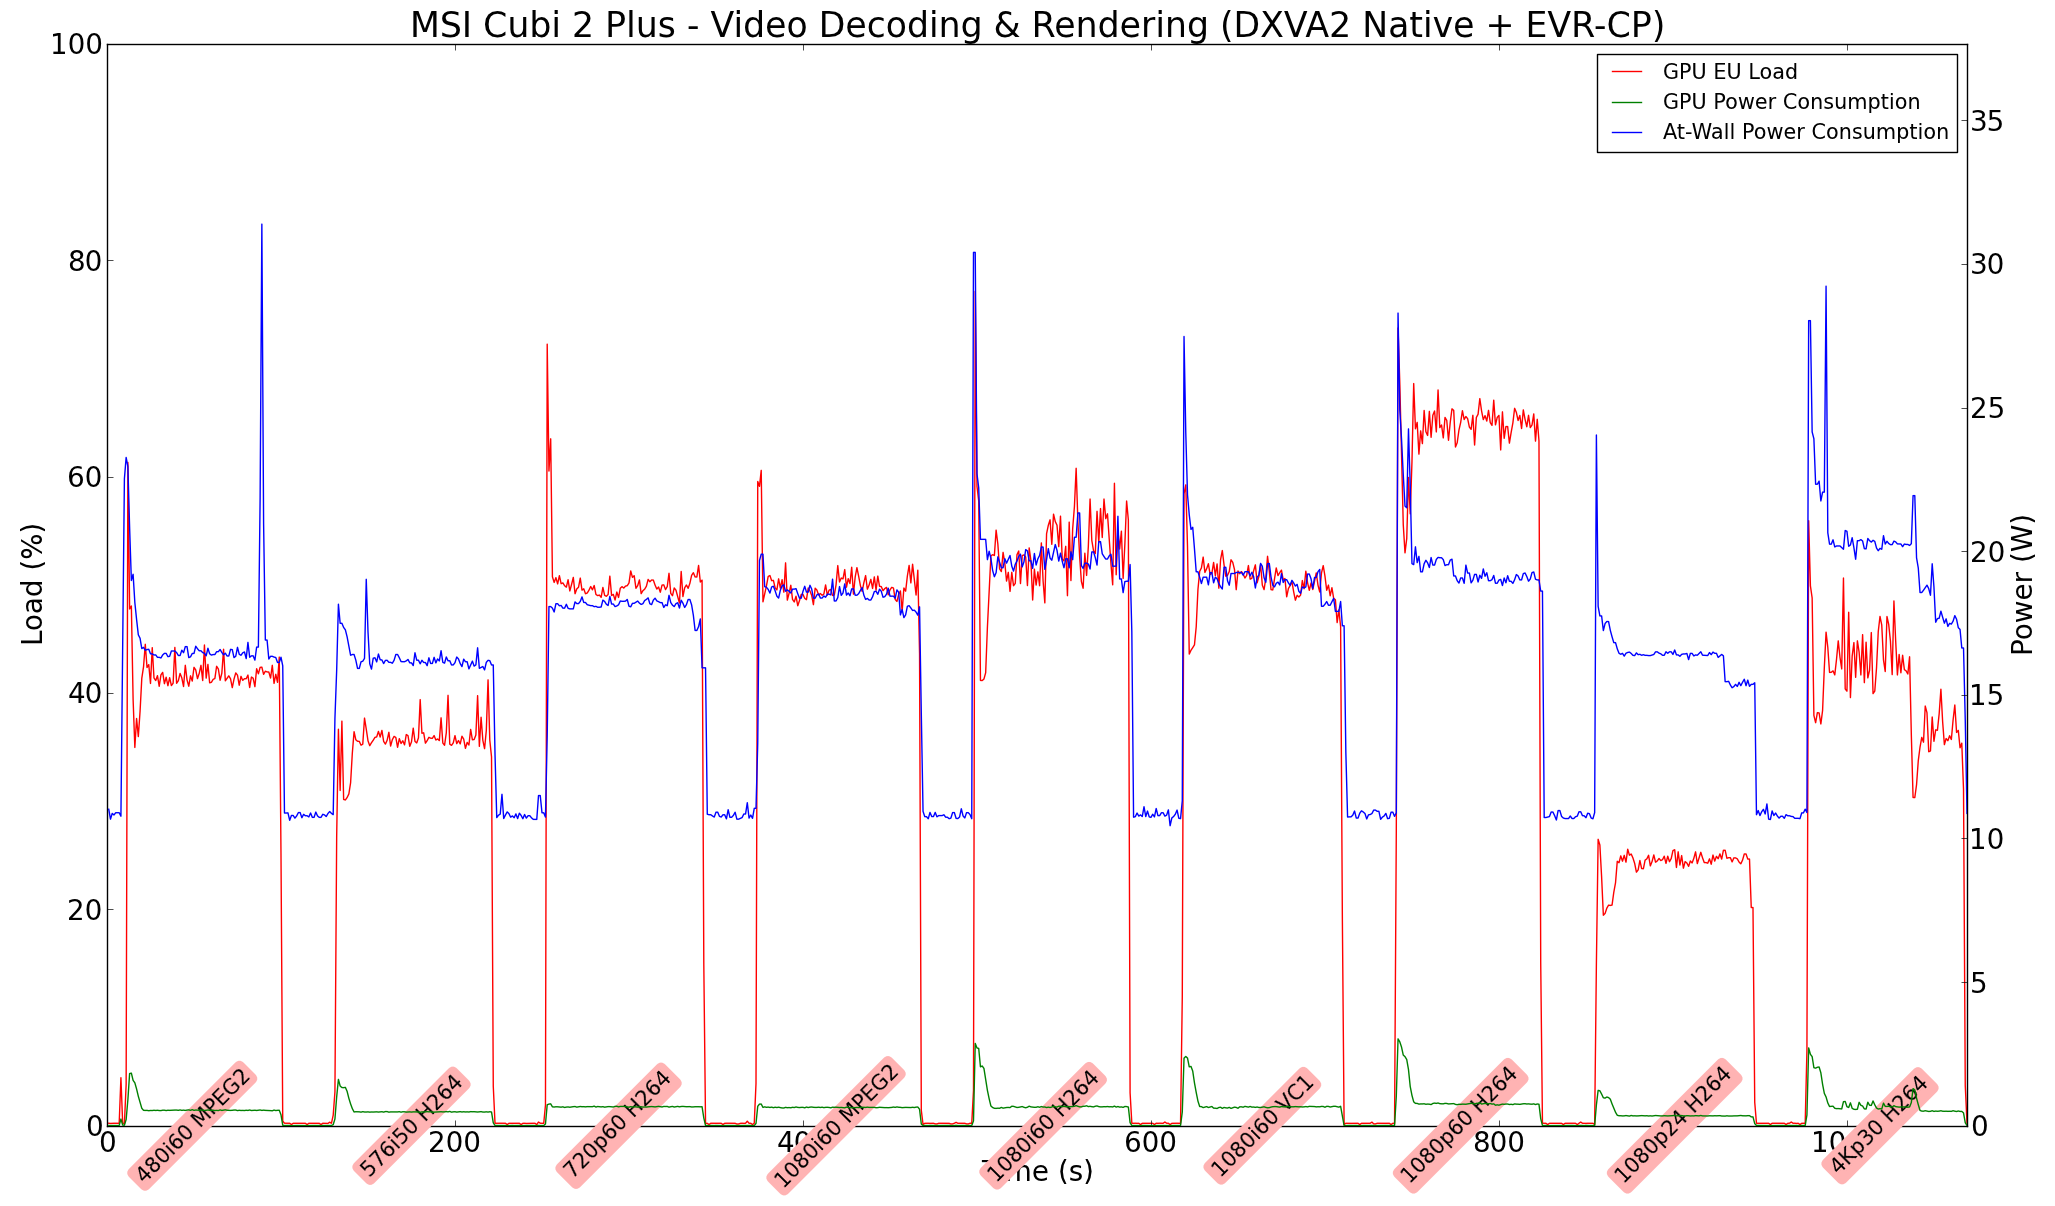
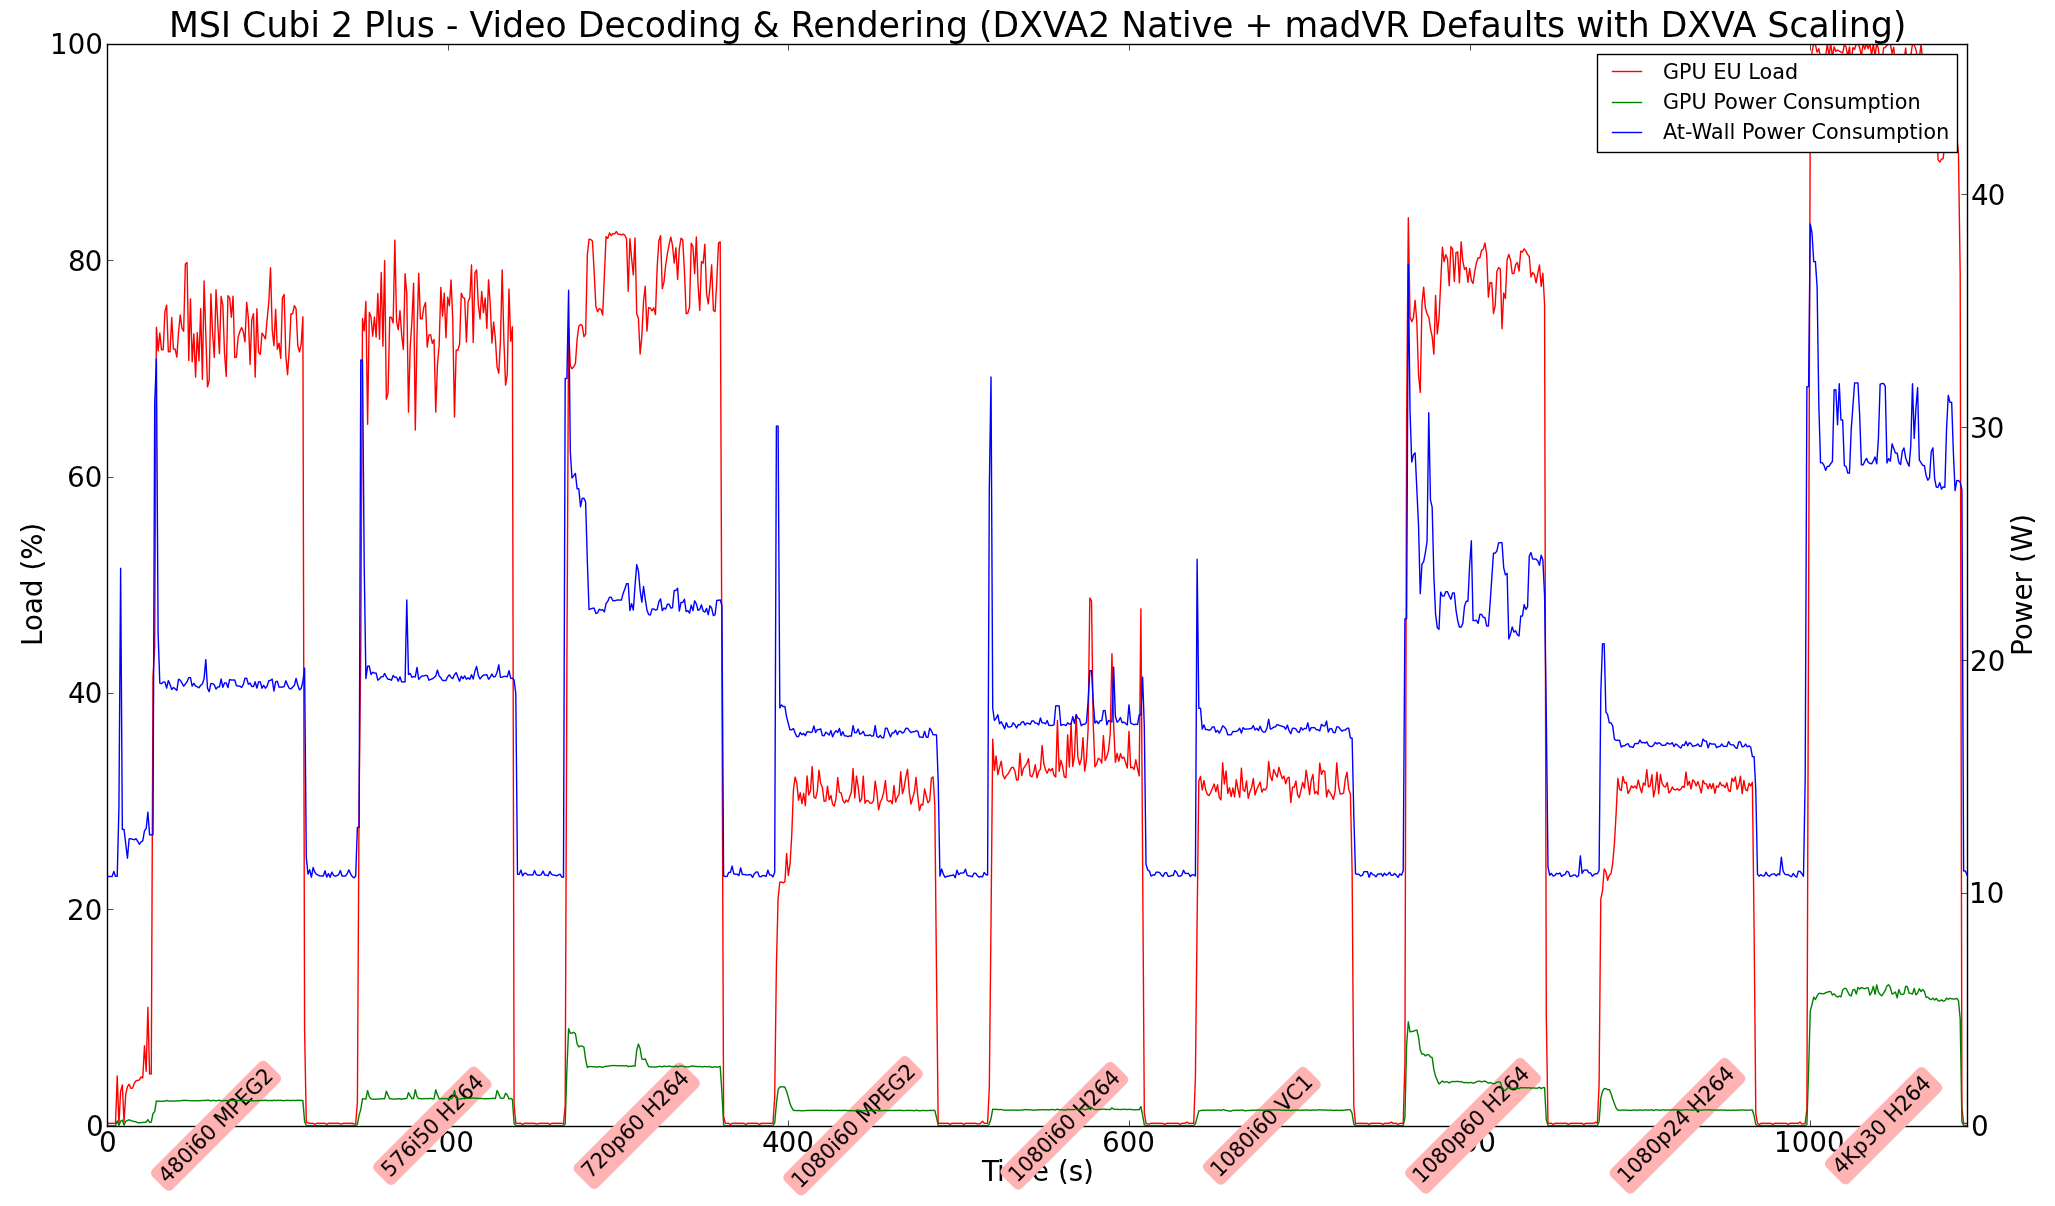
No frame drops were observed in any of the cases other than the 4Kp30 H.264 clip with madVR.
One of the aspects I wish to clarify in our video decoding and rendering benchmarks is the absence of any HEVC clips in our test suite. In addition to waiting for widespread adoption (i.e, the licensing issues currently being played out with the MPEG-LA, HEVC Advance and others), we also want to coincide HEVC playback evaluation with a shift in our HTPC testbed from a 1080p display to a 4K one.
Power Consumption and Thermal Performance
The power consumption at the wall was measured with a 1080p display being driven through the HDMI port. In the graphs below, we compare the idle and load power of the MSI Cubi 2 Plus vPro with other low power PCs evaluated before. For load power consumption, we ran Furmark 1.12.0 and Prime95 v27.9 together. The numbers are typical for the combination of hardware components in the machine.
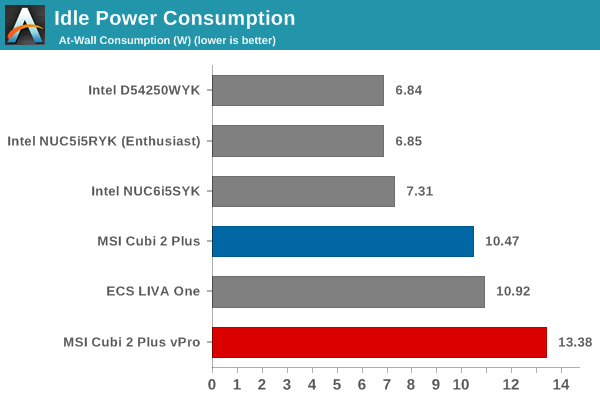
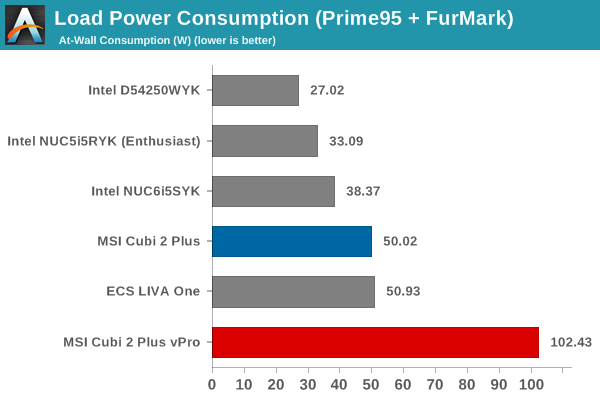
The MSI Cubi 2 Plus vPro is able to sustain a much higher load (despite having a processor with the same TDP as the Cubi 2 Plus).
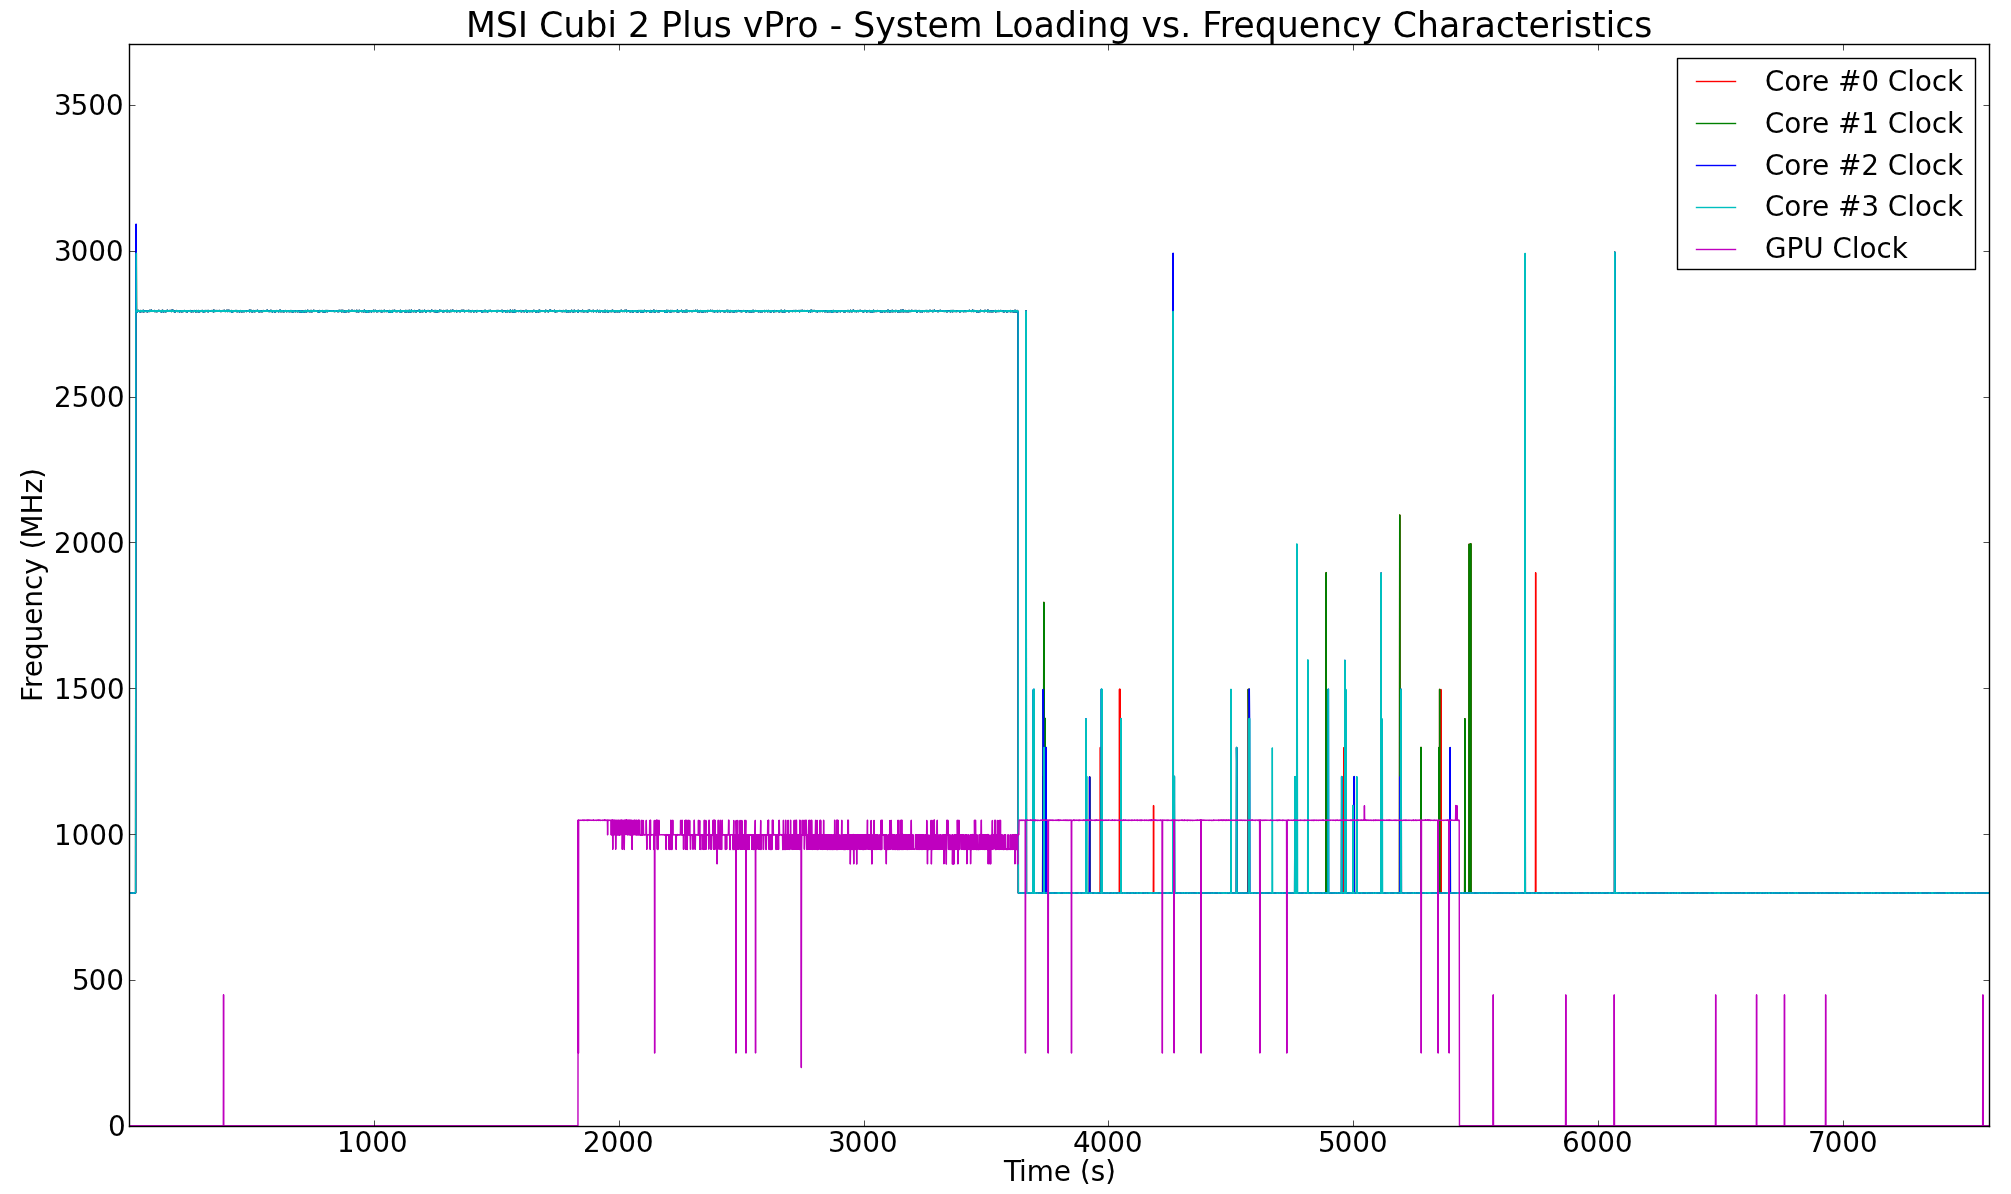
Our thermal stress routine starts with the system at idle, followed by 30 minutes of pure CPU loading. This is followed by another 30 minutes of both CPU and GPU being loaded simultaneously. After this, the CPU load gets removed, allowing the GPU to be loaded alone for another 30 minutes. The various clocks in the system as well as the temperatures within the unit are presented below. Starting with this review, we are also presenting the instaneous power consumption numbers of the internal components as reported by HWiNFO.
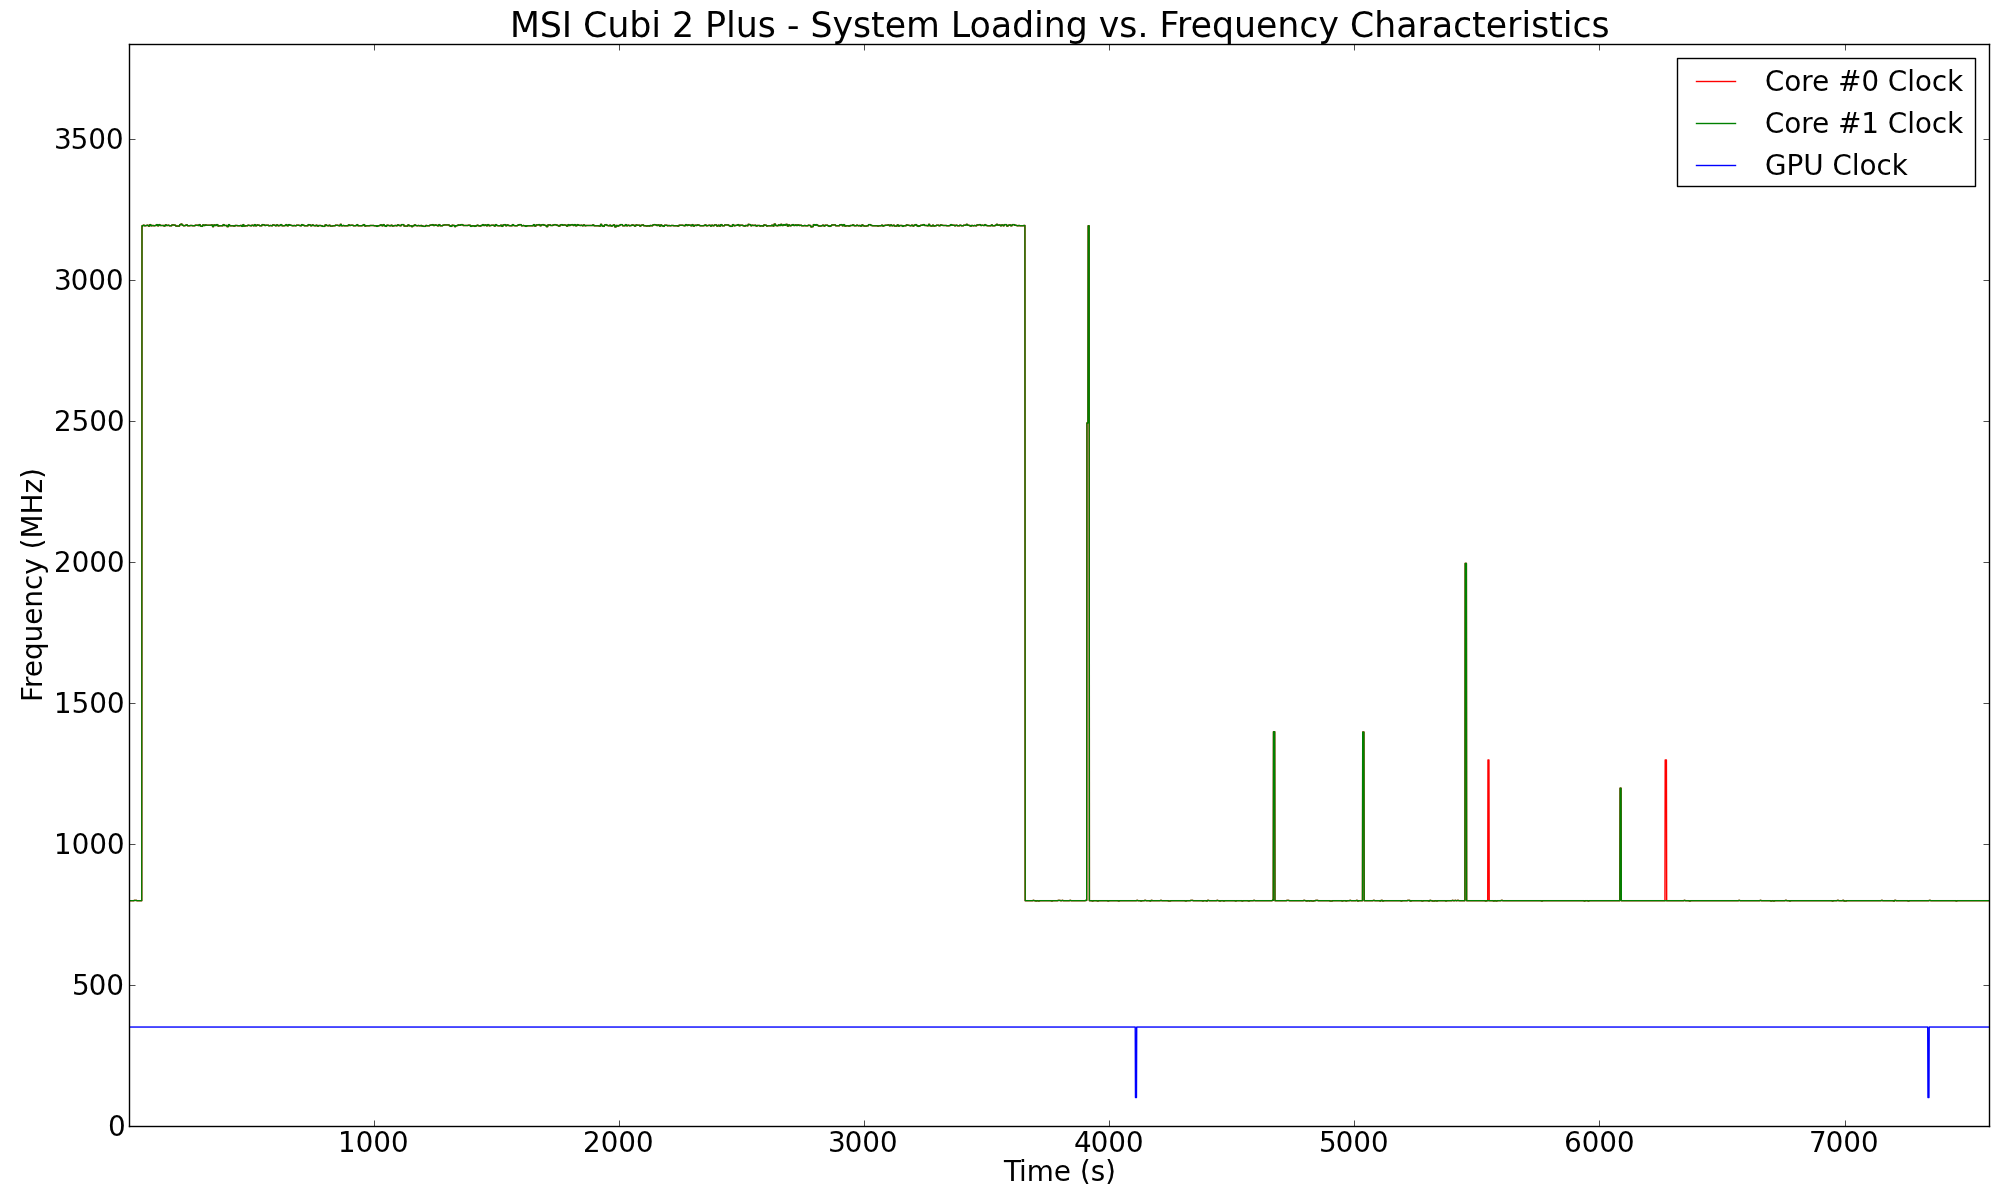
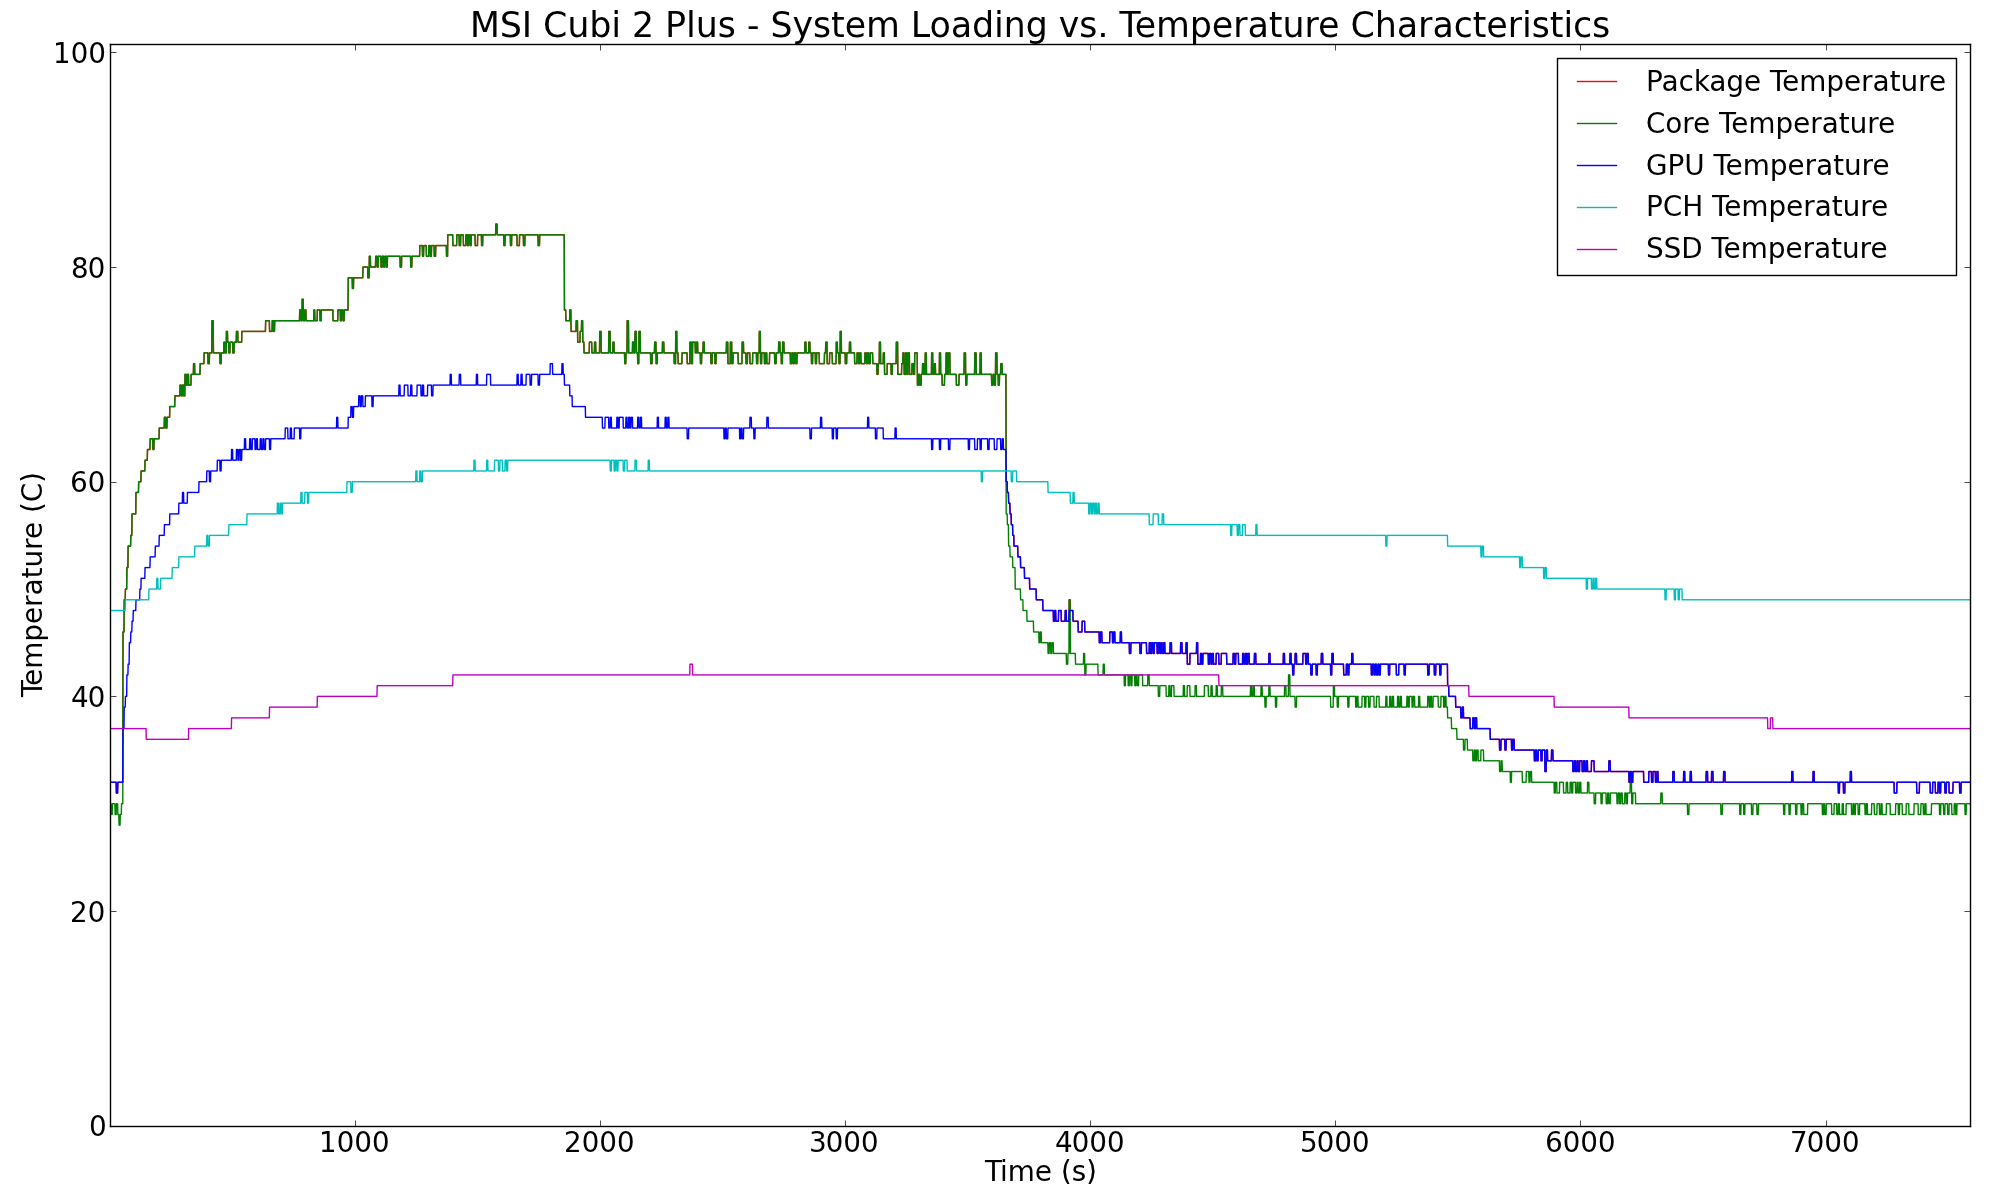
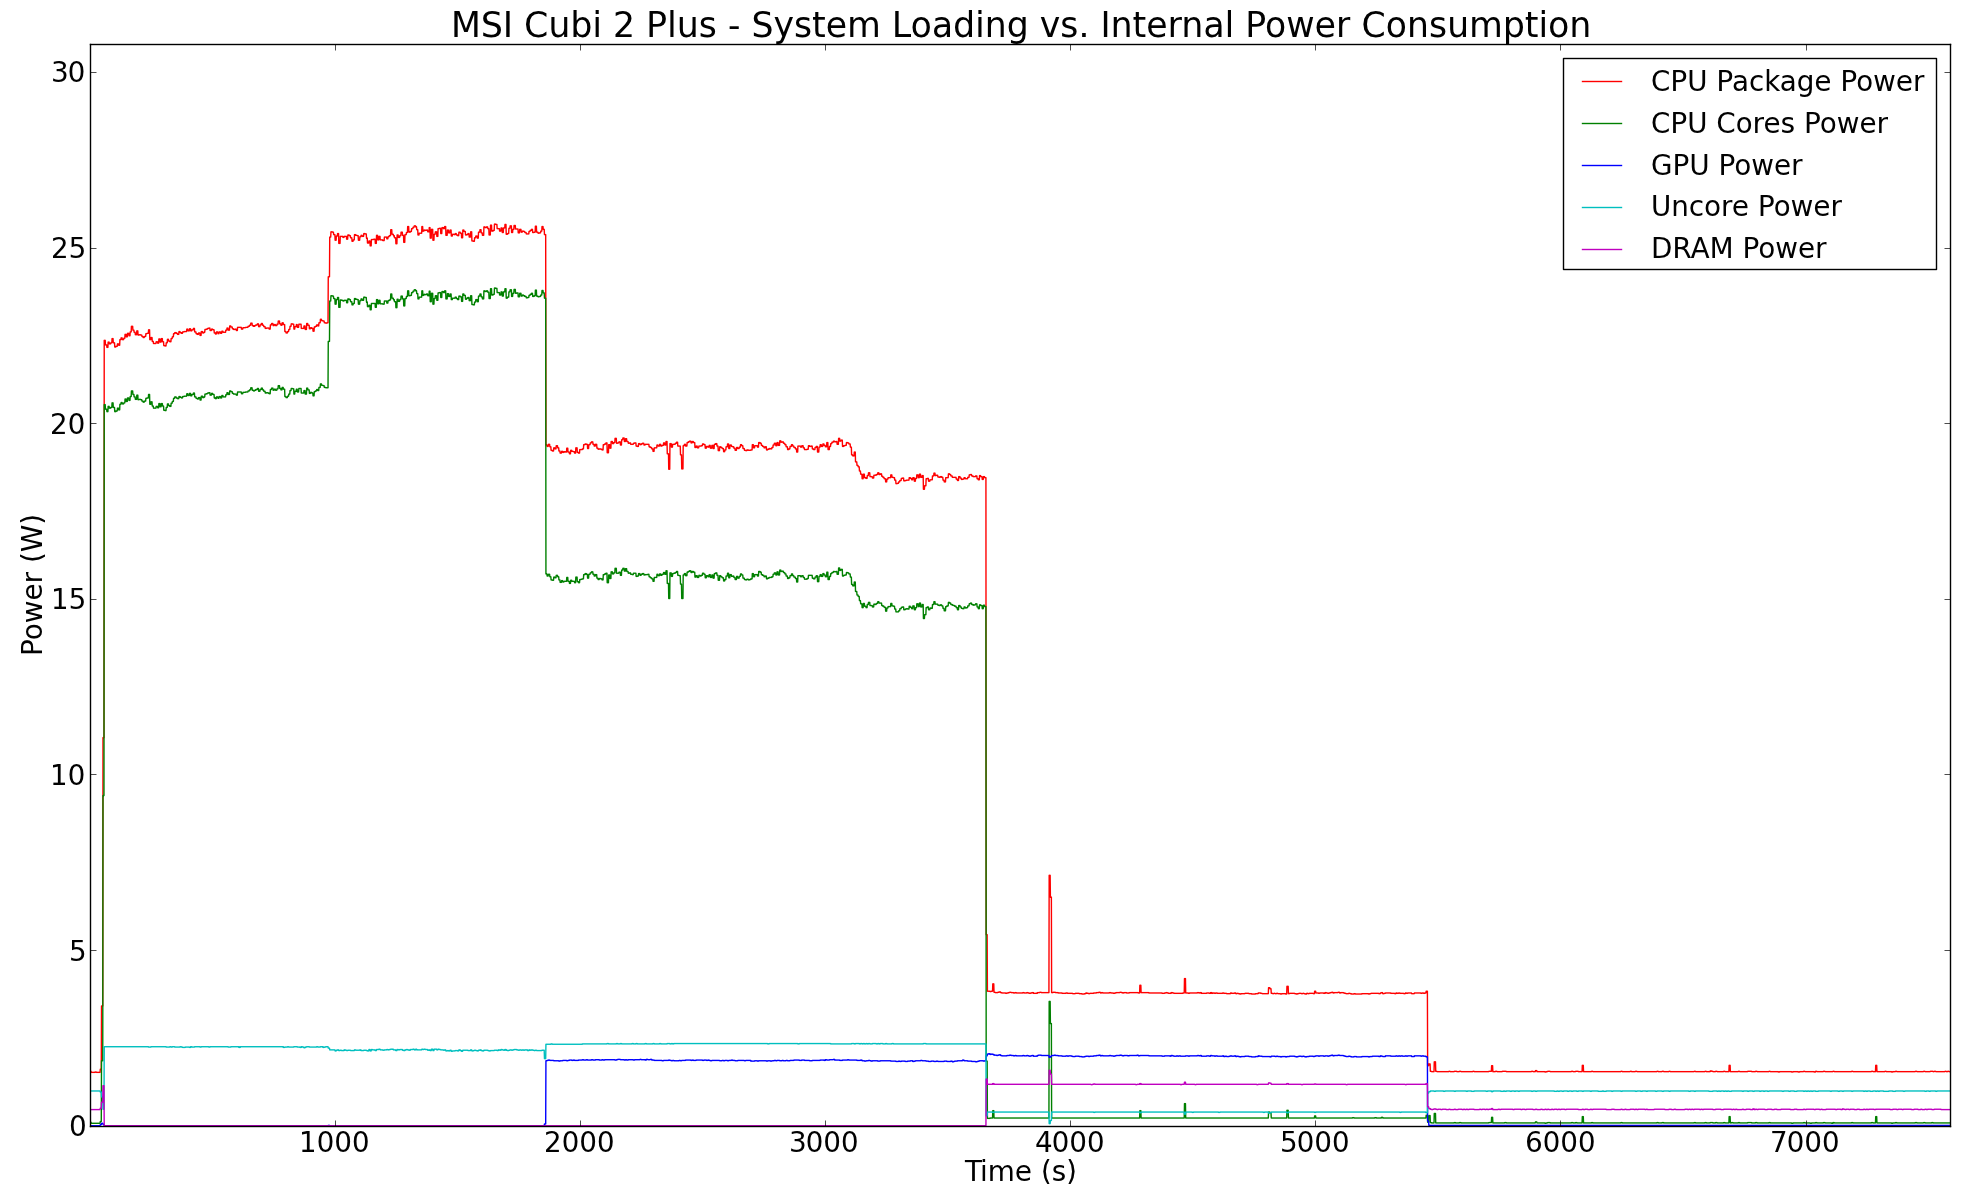
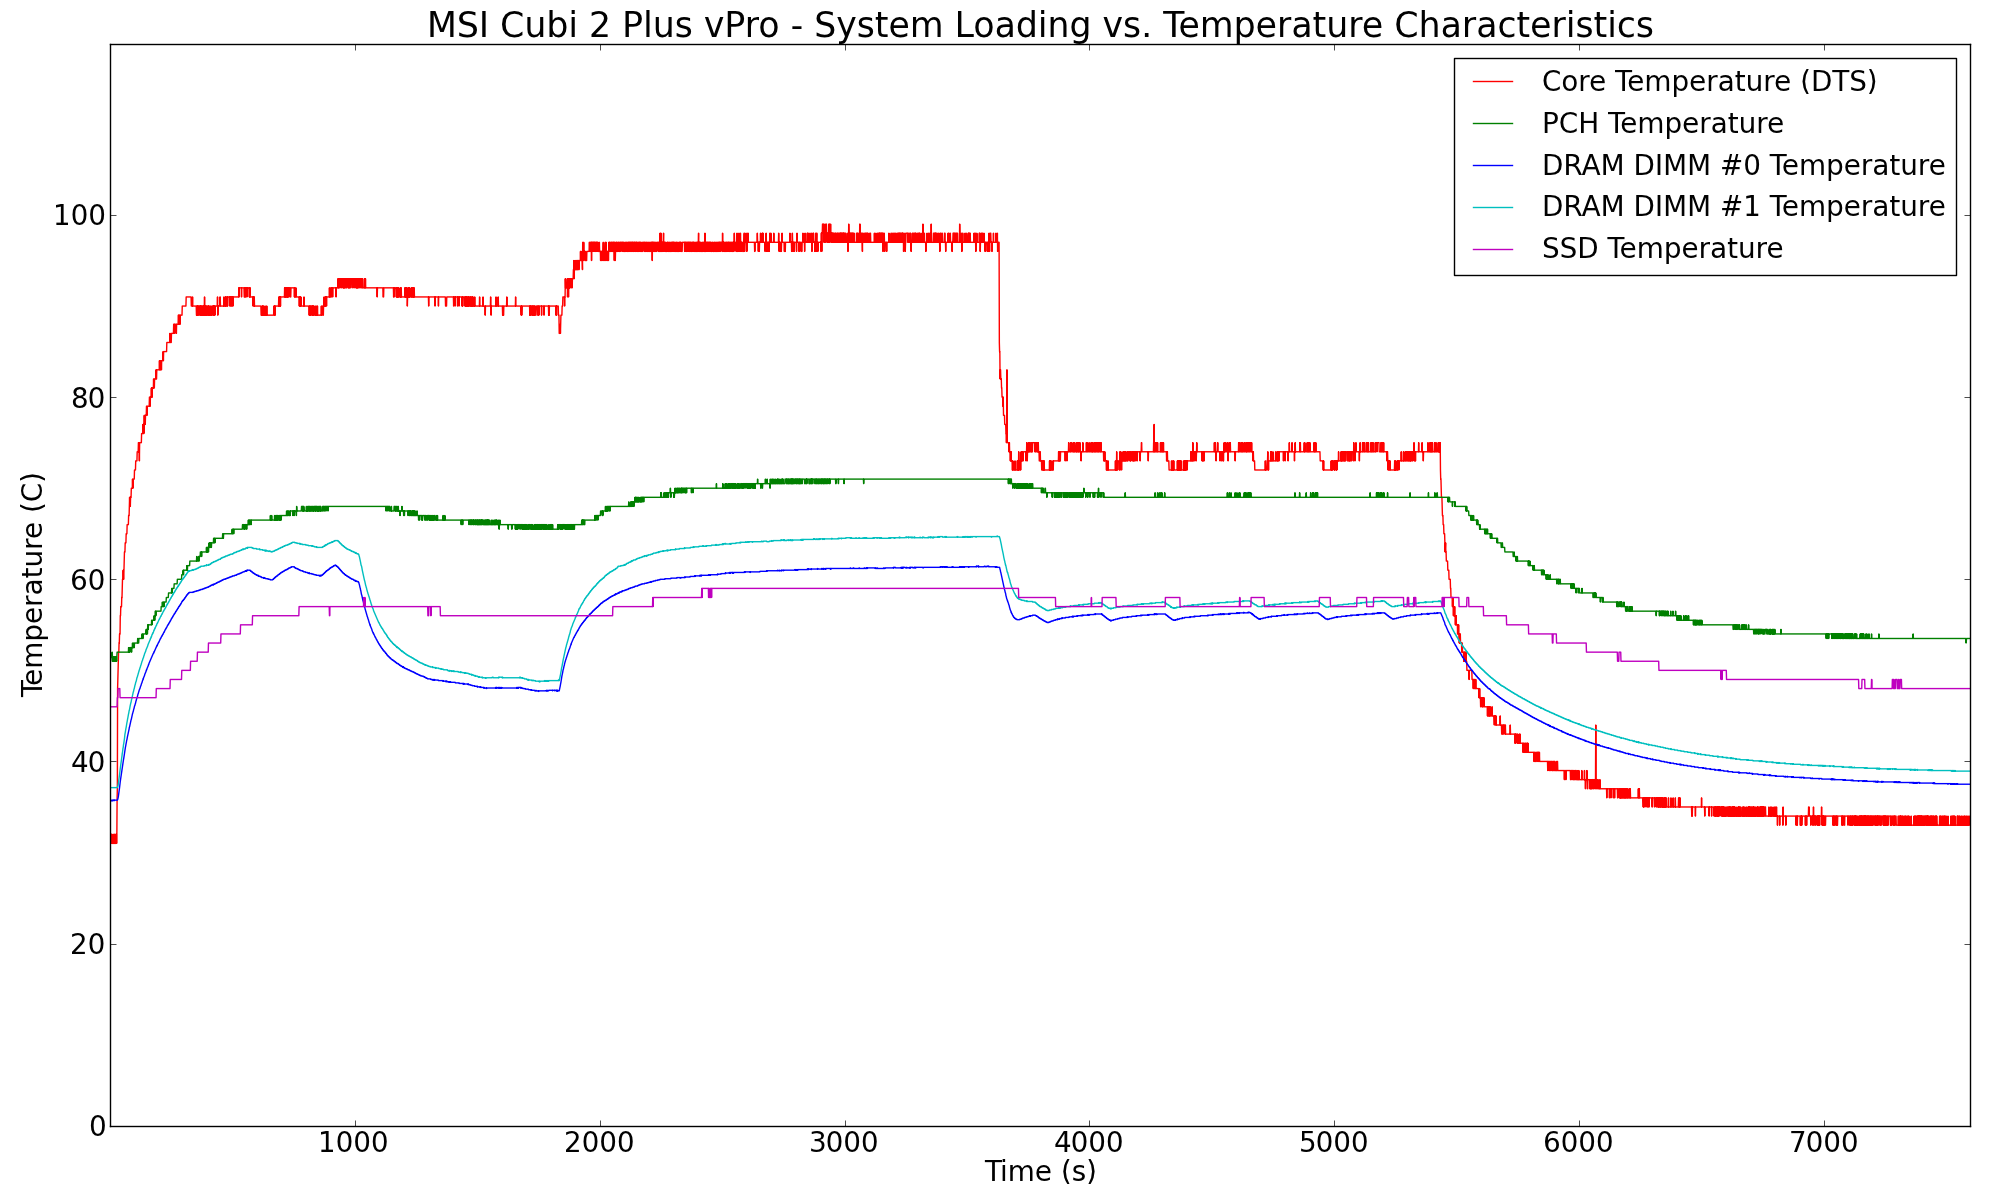

According to the official specifications, the junction temperature of the processors is 100 C. While the Core i3-6100T is kept comfortably below that limit, the thermal solution is just about sufficient for the Core i5-6500T. Note that the CPU package power starts going up rapidly above 60W for the vPro system, but 'power throttling' kicks in before thermal throttling to keep things within limits.
Another important aspect to keep note of while evaluating fanless PCs is the chassis temperature. Using the Android version of the FLIR One thermal imager, we observed the chassis temperature for the vPro model after the CPU package temperature reached the steady state value in the above graph.
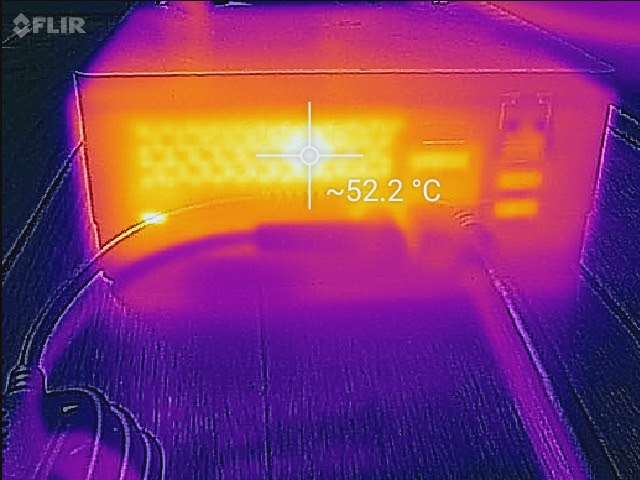
We have additional thermal images in the gallery below.


The active thermal solution ensure that the chassis temperature doesn't become a big concern even under very heavy loading conditions.
Miscellaneous Aspects and Final Words
The MSI Cubi 2 Plus vPro gave us an opportunity to look at yet another implementation of the mini-STX form factor after reviewing the ECS LIVA One. It is interesting to see the approach taken by the two companies, particularly in terms of hardware components and available features. MSI must be lauded for integrating Intel NICs in both versions of the Cubi 2 Plus. ECS uses a Realtek NIC in the LIVA One. The integration of DDR4 SODIMM slots by MSI also enables the Cubi 2 Plus (Core i3-6100T model) to score better in the benchmarks against the LIVA One with the same processor. However, ECS integrated a USB 3.1 Gen 2 bridge (ASMedia ASM1142) to provide consumers with a 10 Gbps Type-C port in the LIVA One. The Type-C port in the Cubi 2 Plus is only Gen 1 (5 Gbps).
We have looked at two different systems in the review today. The MSI Cubi 2 Plus is meant for the average consumer, while the Cubi 2 Plus vPro is meant for business users / enterprises planning to purchase multiple PCs together. Accordingly, MSI's marketing approach is also going to be different for the two systems.
In the North American market, MSI plans to offer only the barebones version (no CPU / hard drive / memory). The Cubi 2 Plus will be sold to the channels and have an approximate MSRP of $210 with a 2-year warranty. The vPro model will be a build-to-order one, priced at $270 with a 2-year warranty.
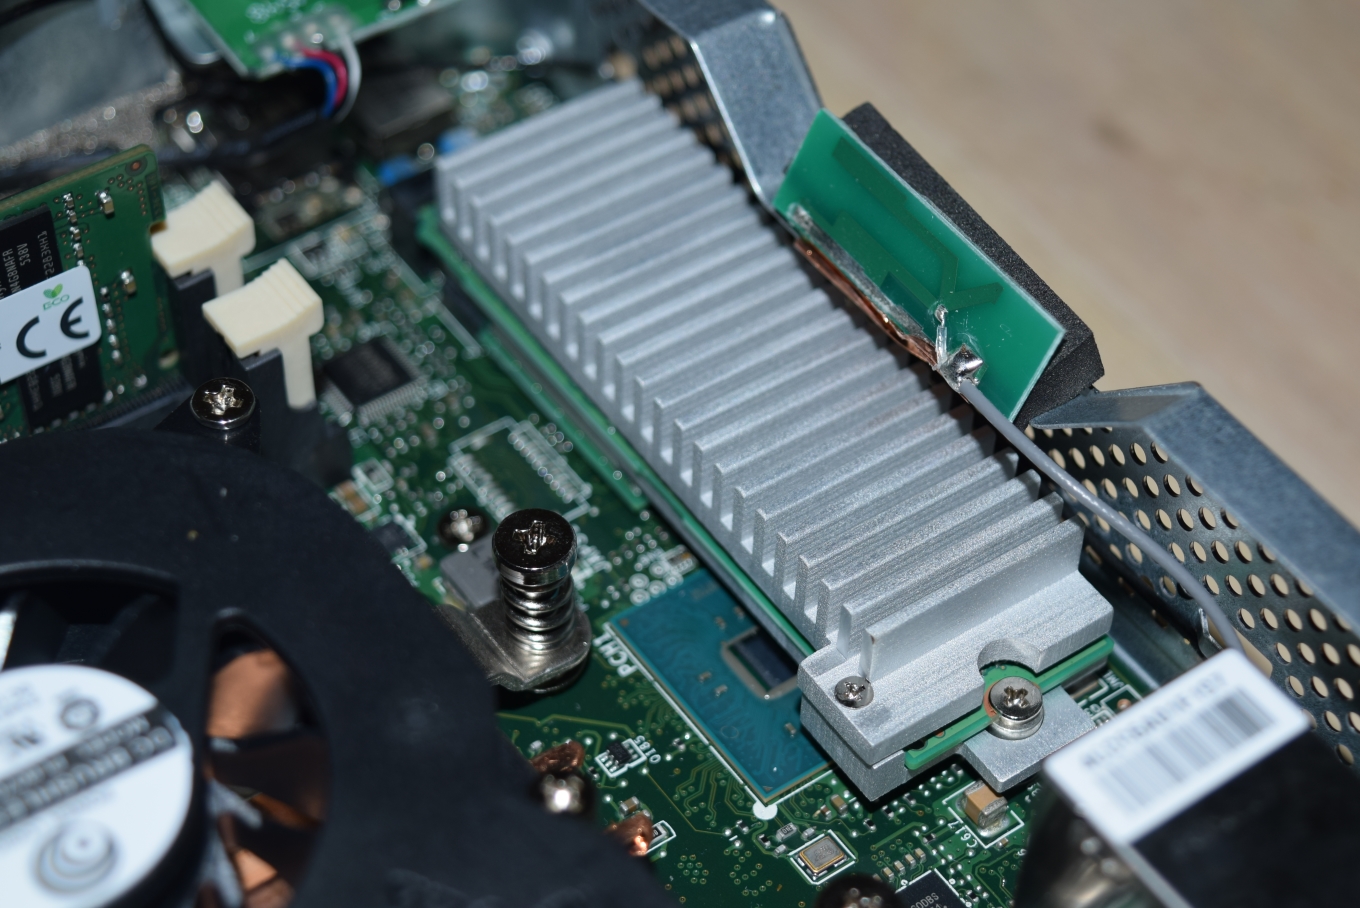
Built-to-order systems can incorporate additional thermal protection for the storage and WLAN components similar to what we got in our first Cubi 2 Plus sample
Coming to the business end of the review, we would like MSI to integrate more USB 3.0 ports on the chassis instead of USB 2.0 ports. As mentioned before in this section, the Type-C port could have used a USB 3.1 Gen 2 bridge chip behind it. The SD card reader could have been behind a USB 2.0 bridge instead of occupying a PCIe lane, particularly considering the fact that it doesn't support UHS-II cards at full speed. The power inlet positioning and adapter output design are a bit tricky to insert fully in the first attempt. However, once installed, this is not much of an issue.
The sizing of the chassis means that only T-series processors can be used. Unfortunately, these processors carry a premium compared to the corresponding full-wattage CPUs. The mini-STX form factor has advantages (small size) and disadvantages (no cutomization possible beyond choice of CPU). We won't go into the details here, but, suffice to say that it is a bit more open to customization compared to the NUCs.
On the positive side, the Cubi 2 Plus has a good industrial design that is aesthetic. The look and feel are solid despite the usage of a plastic chassis. The USB 2.0 port on the top panel is very welcome, though, if we were to nit-pick, having two USB 3.0 ports instead of a single 2.0 port (similar to contemporary computer cases for DIY builds) could offer more benefits. The choice of I/Os in the two models is dictated by the target market. In either case, the design is compact and relatively silent - perfect for office environments and use-cases where a little fan noise is not a big deal. The vPro capability of the Q170 chipset is ideal for small businesses and the H110 chipset enables low cost PCs with socketed CPUs. MSI has put these two chipsets to use in the mini-STX form factor to deliver an effective solution targeting multiple market segments.


