Original Link: https://www.anandtech.com/show/2258
The recent introduction of Intel's new P35 chipset surprised us to some degree. We reviewed the P35 chipset and the new Intel ICH9 Southbridge in detail and found the combination to offer one of the best, if not the best, performance platforms for Intel's Core 2 family of processors. The surprise was the maturity of the boards and chipset at launch, a complete reversal of the P965 introduction last year.
It has been a few weeks since the P35 was officially introduced at Computex 2007 and even more since one of the more confusing product launches in recent history for Intel. We noticed several P35 motherboards were available for sale starting in early May before the press embargo lifted in late May. As such, manufacturers including ASUS and Gigabyte got a jump start over the likes of MSI, abit, Foxconn, ECS, and Biostar in getting boards to market. For the enthusiast crowd, this was even more important as ASUS and Gigabyte were able to offer fairly mature and performance oriented boards by the time others came to market with their first offerings.
That leads us into today's second look at MSI's P35 Platinum motherboard based upon the Intel P35 chipset. This motherboard was launched in late May and our first look at it found a board with a lot of promise but one that was hampered by average memory and overclocking performance - the result of an early BIOS release that emphasized stability over performance. In our initial opinion, the board offered good performance but could not match the ASUS and Gigabyte P35 offerings. In fact, based on performance to price we thought the DFI P965-S offered a better value.
After discussing our results with MSI it was obvious they understood what needed to occur to bring the performance of the board up to the standards set by ASUS and Gigabyte. However, they just had not had enough engineering time with the P35 chipsets and like others had expected the retail launch to happen on June 4th and not the helter-skelter unofficial availability in early May. Still, MSI promised us the performance of this board would improve quickly.
With that promise in mind, we held MSI's feet to the proverbial fire and they responded a couple of weeks ago with the P03 BIOS release. We were excited to see what MSI engineering could do on the performance side with some additional time and our early results show they were at least partially successful. The question is just how successful they were, and did they have to give up stability or overclocking capability for the performance improvements? We hope to provide some early answers that will shed light on these matters today. Let's take a quick second look at the MSI P35 Platinum and see how it performs against the established boards from ASUS and Gigabyte.
QX6700 Quad Core Overclocking
| MSI P35 Platinum Overclocking Testbed |
|
| Processor | Intel Core 2 Extreme QX6700 Quad Core, 2.66GHz, 8MB Unified Cache 1066FSB, 10x Multiplier |
| CPU Voltage | 1.4750V (default 1.3500V) |
| Cooling | Tuniq 120 Air Cooling |
| Power Supply | OCZ ProXStream 1000W |
| Memory | OCZ Reaper PC2-9200 (4x1GB) 5-5-5-18 |
| Video Cards | 1 x MSI HD 2900XT |
| Hard Drive | Western Digital 150GB 10,000RPM SATA 16MB Buffer |
| Case | Cooler Master CM Stacker 830 |
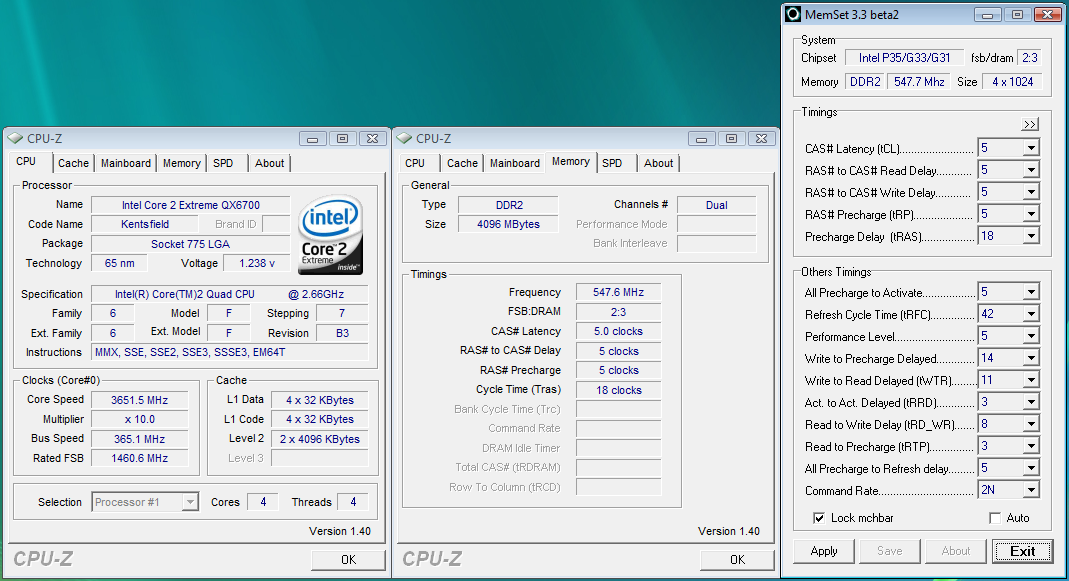
| Maximum CPU OC | 365x10 (5-5-5-18, 1095MHz, 2.30V), CPU 1.4750V 3650MHz (+37%) |
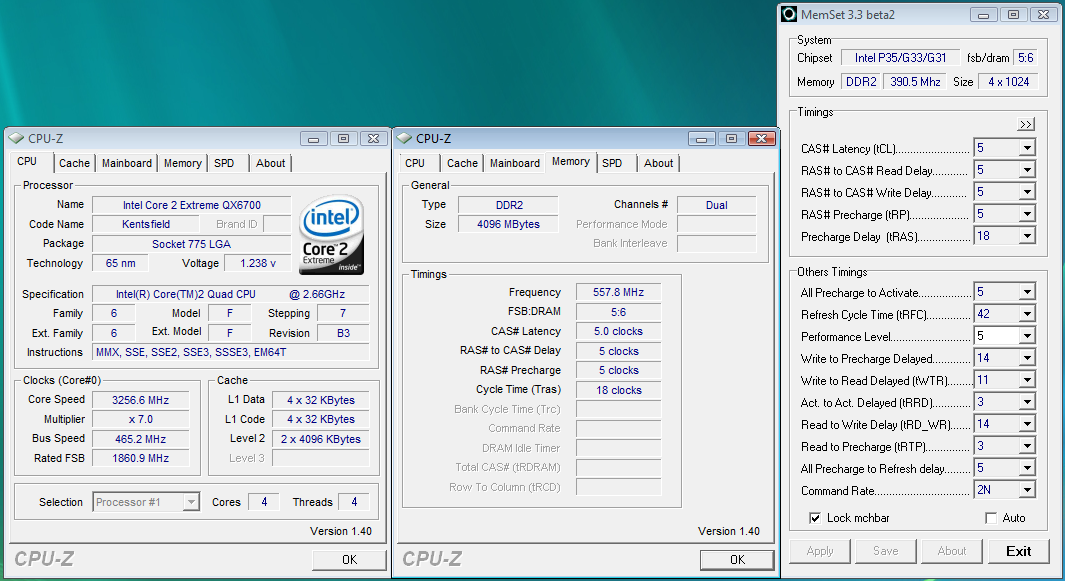
| Maximum FSB OC | 465x7 (5-5-5-18, 1116MHz, 2.30V), CPU 1.4750V 3256MHz (+74% FSB) |
| . | |
 |
| Click to enlarge |
Quad core overclocking on the P35 platforms has turned into a pleasure with the latest BIOS releases from each supplier. The MSI board reached a final 365FSB that we found to be extremely stable during testing and places it at the top of our P35 grouping. Of note, our processor will actually do 3920MHz on water with 1.575V but we reached the limits of air cooling at 3650MHz. Our memory timings once again had to be set to auto with slightly relaxed CAS timings due to the aggressive chipset and memory latencies that MSI implements on the board.
 |
| Click to enlarge |
We dropped the multiplier on our QX6700 to seven and were rewarded with a final 7x465FSB setting compared to a 7x422FSB with the P01 BIOS. However, that is the current limit as we ran into stability problems with our system at anything above 466FSB with the quad core. MSI believes there is a little more left in this board and is currently working on extracting additional performance. We hope to have an update shortly but for now this is the maximum FSB on the board with the quad core. We have reached 540FSB with our E6600 in preliminary testing so the board is certainly capable of the 535~550 FSB range with the right processor, although we have to run the 1333 strap over 500FSB to ensure application stability.
 |
| Click to enlarge |
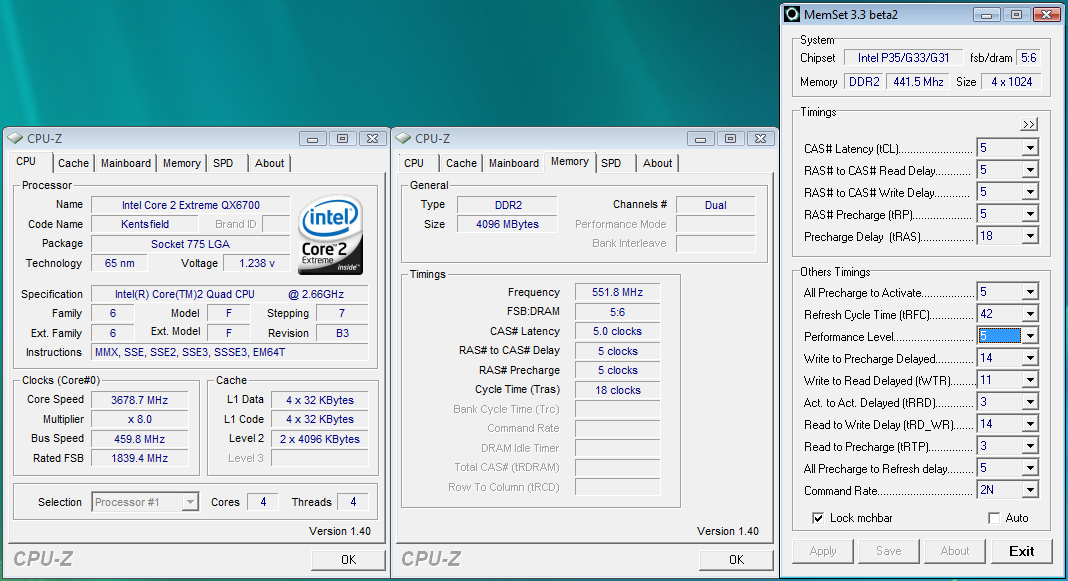
We changed the multiplier on our QX6700 to eight and reached a final 8x460FSB setting that was limited to air cooling. We had to run on the 1333 strap as the memory/chipset latencies are set a little too aggressive on the 1066 strap above 440FSB. The board ran fine on the 1066 strap at 460FSB with the quad core in most instances. However, Quake 4, Prey, and Nero Recode would constantly crash until we backed off the FSB or changed memory straps.
Test Setup
| Standard Test Bed Vista Ultimate 64-Bit Test Configuration |
|
| Processor | Intel Core 2 Duo QX6700 (2.66GHz, 8MB Unified Cache) |
| RAM | OCZ Reaper PC2-9200 (4x1GB) 3-4-3-8 975X, 4-4-4-10 or 5-5-5-18 (MSI) |
| Hard Drive | Western Digital 150GB 10,000RPM SATA 16MB Buffer |
| System Platform Drivers | Intel - 8.3.0.1013 |
| Video Cards | 1 x MSI HD 2900XT |
| Video Drivers | ATI 8.37.4.3 (HD2900XT Release Drivers) |
| CPU Cooling | Tuniq 120 |
| Power Supply | OCZ ProXStream 1000W |
| Optical Drives | Plextor PX-760A, Plextor PX-B900A |
| Case | Cooler Master CM Stacker 830 |
| Motherboards | Intel D975XBX2 (Intel 975X) - BIOS 2692 ASUS P5K Deluxe (Intel P35) - BIOS 0404 MSI P35 Platinum (Intel P35) - BIOS 7345P03 Gigabyte P35-DQ6 (Intel P35) - BIOS F5 DFI Infinity P965 (Intel P965) - BIOS 424B EVGA 680i LT SLI (NVIDIA 680i LT) - BIOS P04 |
| Operating System | Windows Vista Ultimate 64-Bit |
| . | |
Test conditions were maintained the same, as much as possible, over the platforms tested. Our game tests were run at settings of 1280x1024 HQ to ensure our GPU is not the bottleneck during testing. All results are reported in our charts and color-coded for easier identification of results.
We utilize new drive images on each board in order to minimize any potential driver conflicts. Our 3DMark results are generated utilizing the standard benchmark resolution for each program. We run each benchmark five times, throw out the two low and high scores, and report the remaining score. All results are run at stock speeds for this article with memory timings at 5-5-5-18 for the MSI board compared to 4-4-4-10 on our other DDR2 based P35 motherboards. In order for our tests to be fair, we did upgrade to the latest BIOS releases for the ASUS and Gigabyte P35 boards for comparison scores.
Our choice of software applications to test is based on programs that enjoy widespread use and produce repeatable and consistent results during testing. Microsoft Vista has thrown a monkey wrench into testing as the aggressive nature of the operating system to constantly optimize application loading and retrieval from memory or the storage system presents some interesting obstacles. This along with the lack of driver maturity will continue to present problems in the near future with benchmark selections.
Our standard Vista test process is to change our power settings to performance, delete the contents of the prefetch folder, and then reboot after each benchmark run. This is a lengthy process to be sure, but it results in consistency over the course of benchmark testing. All applications are run with administer privileges.
Memory Performance
 |
| Click to enlarge |
We optimized each BIOS to provide the best performance at the same memory timings while still being able to complete our entire benchmark test suite. We will fully optimize each board based upon its best performance potential in our upcoming P35 shootout; however, for now we are comparing like timings on all of our boards except the MSI to show differences in the way each manufacturer implements other BIOS enhancements such as ASUS's Transaction Booster and Gigabyte's Turbo memory enhancement. Marketing speak for sure, but we generally see an improvement in unbuffered memory and latency results of up to 7% when they are implemented.
MSI's latest P03 BIOS brings their DDR2 memory performance up to the same level as our other P35 based DDR2 boards. We tried to set the BIOS to match the other DDR2 boards with 4-4-4-10 timings but stability was an issue without manually backing off the timings with MemSet. In the end, we left the memory settings on auto and let the BIOS work its magic with the chipset latencies and sub-timings.
Even though the memory timings are set to 5-5-5-18 we still see a 10% improvement in Sandra unbuffered scores and a 24% reduction in latency when compared to the P1 BIOS. The MSI P35 Platinum also generates the best Q4 scores out of the DDR2 based boards and we will see this pattern continue throughout our testing. The P03 BIOS will be made available later today in our Motherboard Forum.
 |
| Click to enlarge |
MSI in recent times has set up their BIOS for very tight chipset latencies and memory sub-timings at the expense of overclocking. However, MSI balanced the performance on this board with extremely aggressive chipset latencies and memory sub-timings at stock speeds while adjusting these settings or changing straps at key points when overclocking.
We had to let the BIOS adjust our memory timings based on auto SPD selections; stability/performance suffered to varying degrees when manually setting the memory timings. Usually, we spend time tweaking the BIOS to fine tune a board for best performance but in this case auto settings worked best. In fact, the more time we spent trying to tweak the board, the more our performance or stability worsened so we threw in the towel and let the BIOS do the work for us.
Synthetic Graphics Performance
The 3DMark series of benchmarks developed and provided by Futuremark are among the most widely used tools for benchmark reporting and comparisons. Although the benchmarks are very useful for providing apples-to-apples comparisons across a broad array of GPU and CPU configurations they are not a substitute for actual application and gaming benchmarks. In this sense we consider the 3DMark benchmarks to be purely synthetic in nature but still very valuable for providing consistent measurements of performance.
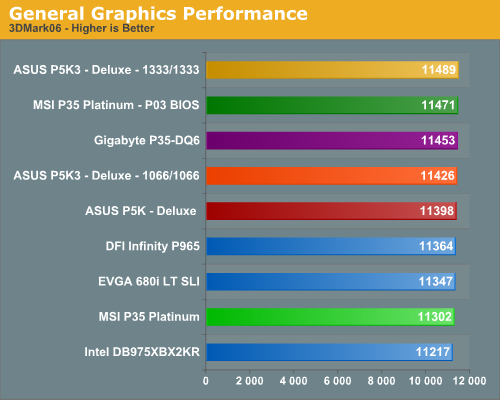
In our 3DMark06 test, all of the boards are bunched together with a 2.4% spread from top to bottom. The 975X board takes last place by a small margin; things have improved with the 7.6 drivers but those test results are not available yet. The MSI board with the new P03 BIOS tops the DDR2 based boards and improves by 1.4% over the board with the P01 BIOS.
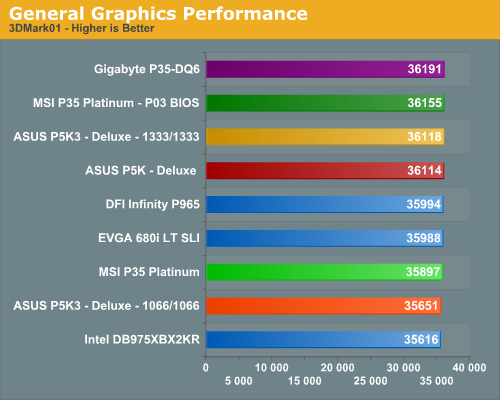
In the more memory sensitive 3DMark01 benchmark we see our Gigabyte P35T-DQ6 board taking top honors with the MSI board finishing second in the DDR2 grouping. Our 975X board is slightly handicapped at the 1066/800 settings, but this chipset continues to offer excellent memory performance in this type of benchmark. The spread from top to bottom is only 2.6%, however, so minor differences in performance are not really noticeable in either 3DMark unless you're looking to reach the top of the ORB.
General System Performance
The PCMark05 benchmark developed and provided by Futuremark was designed for determining overall system performance for the typical home computing user. This tool provides both system and component level benchmarking results utilizing subsets of real world applications or programs. This benchmark is useful for providing comparative results across a broad array of Graphics, CPU, Hard Disk, and Memory configurations along with multithreading results. In this sense we consider the PCMark benchmark to be both synthetic and real world in nature, and it again provides for consistency in our benchmark results.
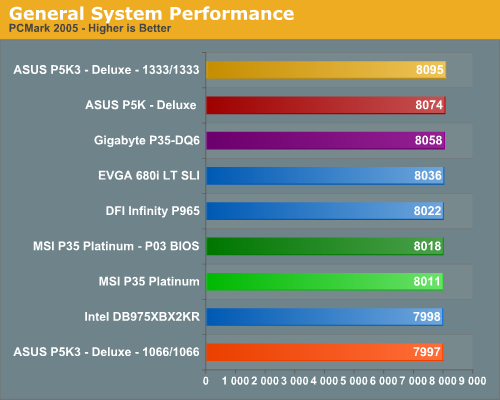
The ASUS boards have always done well in this benchmark due to very strong multitasking performance and the same holds true once again with our MSI board basically scoring the same regardless of BIOS version. We found this to be peculiar considering the improvements noticed in other applications. It turns out the first multitasking test is a disaster for the P03 based board for reasons that we cannot explain at this time; MSI is working to remedy the situation. The spread in overall scores is only 1.5%, although in individual areas the differences between the boards may be more or less pronounced.
Media Encoding Performance
Our first series of multimedia tests is quite easy: we take our original Office Space DVD and use AnyDVD and Nero Recode 2 to copy the full DVD to the hard drive without compression, thus providing an almost exact duplicate of the DVD. We then fire up Nero Recode 2, select our Office Space copy on the hard drive, and perform a shrink operation to allow the entire movie along with extras to fit on a single 4.5GB DVD disc. We leave all options on their defaults except we disable the advanced analysis option. The scores reported include the full encoding process and are represented in seconds, with lower numbers indicating better performance.
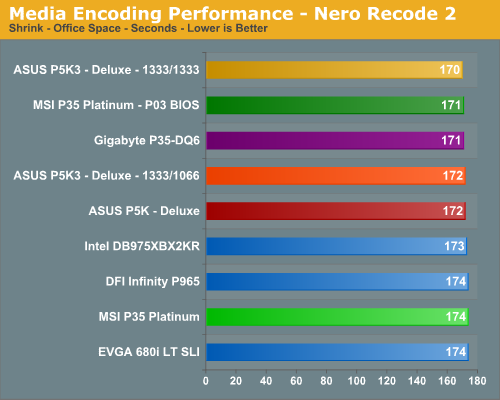
The Nero Recode Shrink results show the MSI P03 BIOS board improving by three seconds. While not a significant improvement in the grand scheme of things, it does bring the board's performance to the top of the DDR2 grouping once again.
Our next test has us converting our day at the beach AVI file into a high definition WMV file suitable for our Grandparents to view on their new high definition TV. Quality settings are set to High Definition. The balance of options is set to standard settings and then we let this program do its magic. We are reporting the numbers in seconds to complete the conversion.
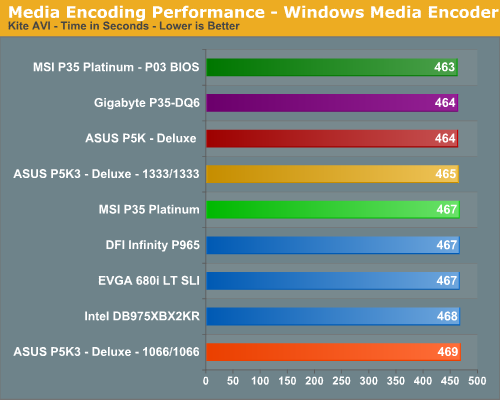
We see the boards with the best memory bandwidth and latency performance once again leading in a test that still favors the DDR2 boards and in this case, our MSI board. Our DDR3 boards finish in the middle of the pack. The overall difference in scores between all boards is a minimal 1.3%.
Audio Encoding Performance
Our previous audio test suite consisted of Exact Audio Copy v095.b4 and LAME 3.98a3. We did run these tests with basically the same results but we will now utilize iTunes 7.1 as it is one of the most utilized audio applications available due to the immense popularity of the iPod. As in previous articles, we are using the INXS Greatest Hits CD for testing, which contains 16 tracks totaling 606MB in size. We run two audio tests with iTunes, converting our WAV files into ACC and MP3 compatible formats. We utilize the 320kbps setting for both tests with the MP3 test also utilizing the variable bit rate option.
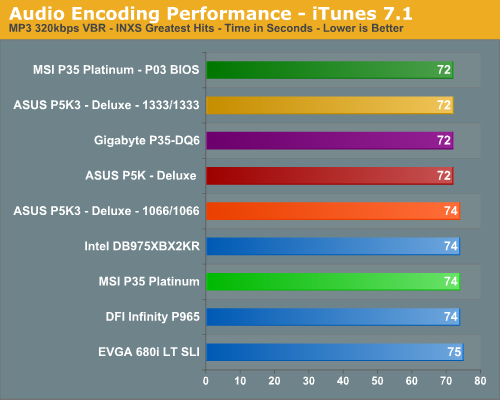
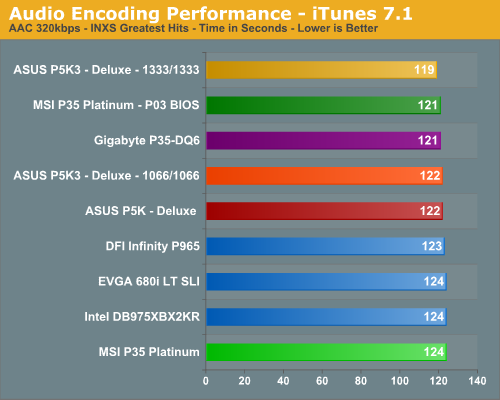
We see iTunes favoring boards with excellent CPU throughput and memory bandwidth with the 1333FSB showing a slight advantage in these tests. All of the P35 boards place ahead of the older chipsets, with the exception of the MSI P01 BIOS board. However, the P03 BIOS brings the performance of the MSI up to speed and results in it now leading the other DDR2 boards.
Media Performance
We utilize the widely available Retouch Artists Photoshop Speed Test for measuring platform performance in Adobe's Photoshop CS3. The benchmark applies a number of actions to a test image while we measure the total time elapsed during the active portion of the test. We set history states to 1, cache levels to 4, and CS3 is configured to make use of all available system memory. The scores reported include the full conversion process and are represented in seconds, with lower numbers indicating better performance.
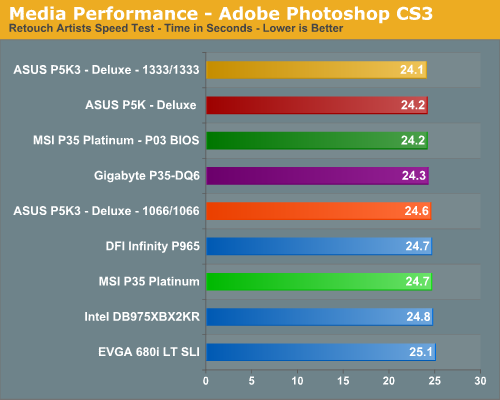
The results are in alignment with the majority of our tests to date. The 1333FSB platforms hold an advantage, although very minor, in tests where CPU throughput and memory bandwidth/latency are important. The MSI P03 based board finishes near the top thanks to greatly improved chipset latencies and memory bandwidth.
Our next test is one recommended by Intel, but the test itself appears to be fair for all platforms and results are very repeatable. This test simply measures the amount of time required to fix and optimize 103 different photos weighing in at 63MB. Time is measured in seconds and lower times indicate better performance:
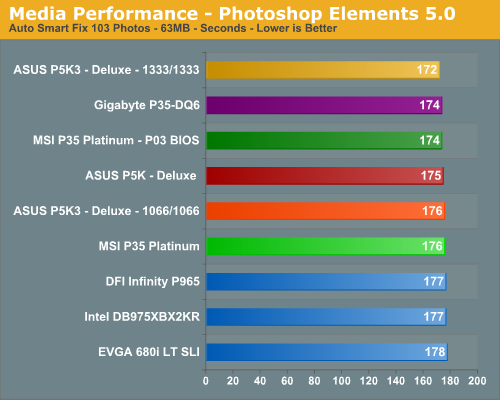
This test not only stresses the CPU/memory pipeline but also gives the storage systems a good workout. However, our results basically mirror those of our other media tests with the 1333FSB boards finishing slightly ahead and the MSI P03 BIOS based board placing at the top of the DDR2 group.
Rendering Performance
We are using the Cinebench 9.5 benchmark as it tends to heavily stress the CPU subsystem while performing graphics modeling and rendering. Cinebench 9.5 features two different benchmarks with one test utilizing a single core and the second test showcasing the power of multiple cores in rendering the benchmark image. We utilize the standard multiple core benchmark demo and default settings.
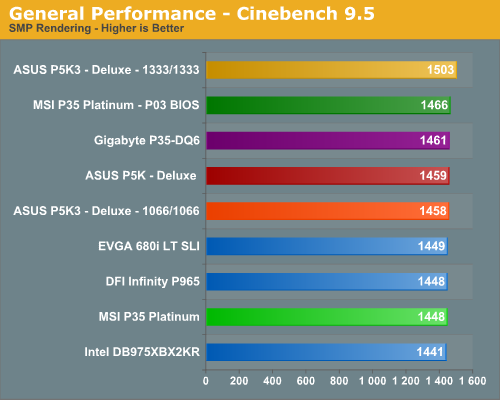
The improved CPU throughput speeds of the P5K3 board results in the top score, putting it 1% ahead of the Gigabyte P35T DDR3 board. The remaining boards are all clustered within 2% of each other, with the MSI P03 based board improving by 18 points over the P01 board. This is one benchmark that clearly benefits from improved front side bus speeds and CPU throughput.
File Compression Performance
In order to save space on our hard drives and ensure we have another CPU crunching utility, we will be reporting our file compression results with the latest version of WinRAR that fully supports multi-treaded operations and should be of particular interest for those users with dual core or multi-processor systems. Our series of file compression tests utilizes WinRAR 3.62 to compress our test folder that contains 444 files, ten subfolders, and 602MB worth of data. All default settings are utilized in WinRAR and our hard drive is defragmented before each test.
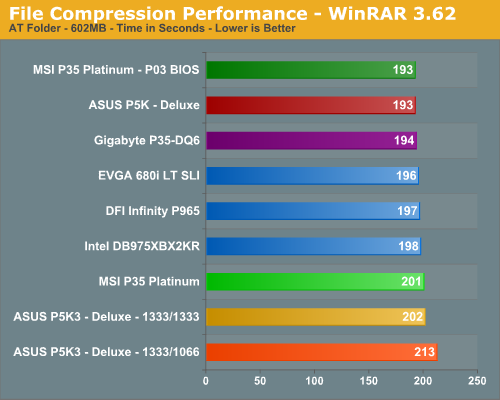
In this test that stresses overall memory latencies and CPU/Memory throughput we see the DDR3 configurations finishing last. The nature of file compression is such that memory is accessed almost constantly in a very random fashion, so page misses requiring additional time as memory banks are swapped is common. The MSI P03 BIOS based board finishes at the top of the DDR2 boards with an eight second improvement over the P01 BIOS.
Gaming Performance
As usual, gaming performance was tested with a variety of current games. We ran benchmarks with our standard 1280x1024 resolution with all games set to High Quality mode. Given the number of users that run 19" LCDs these days, 1280x1024 represents one of the most commonly used resolutions.
Battlefield 2
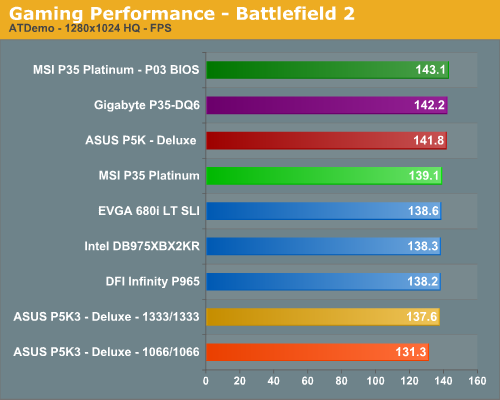
This benchmark is performed using DICE's built-in demo playback functionality with additional capture capabilities designed in house. When using the built-in demo playback features of BF2, frames rendered during the loading screen are counted in the benchmark. In order to get a real idea of performance, we use the instantaneous frame time and frames per second data generated from our benchmark run. We discard the data collected during the loading screen and calculate a result that represents actual game play. While DICE maintains that results over 100fps aren't always reliable, our methods have allowed us to get useful data from high performing systems.
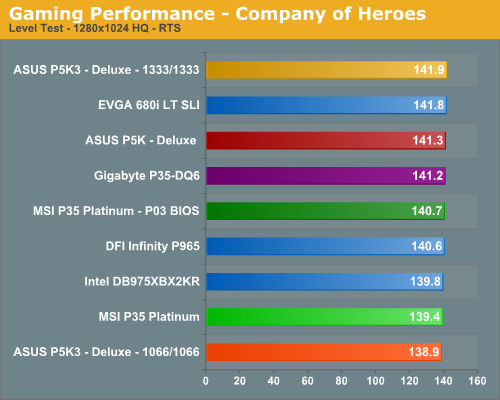
Company of Heroes
Company of Heroes was released last year and is still proving to be a very addictive RTS game around the office. The game is extremely GPU intensive and also requires a hefty CPU at times. The game contains a built-in performance test that utilizes the game engine to generate several different action scenes. We find the performance test gives a good indication of how well your system will perform throughout the game on average. Some of the in-game action sequences can be more demanding than the performance test, however, and we are working on a repeatable game play benchmark. For now, we find the game to be enjoyable with an average frame rate score in the performance test above 35fps.
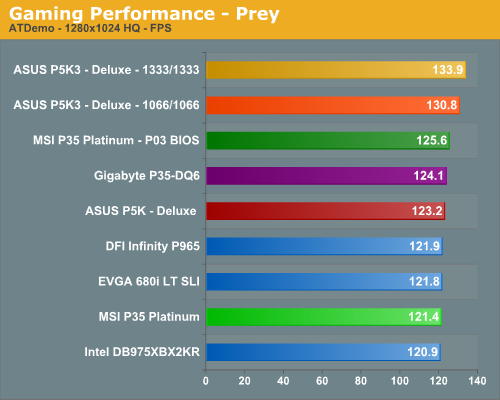
Prey
Prey offers some superb action sequences, unique weapons and characters, and is a visually stunning game at times. (Ed: And for some people, it's a great way to induce nausea!) It still requires a very good GPU to run it with all of the eye candy turned on. We set all graphic settings to their maximum except for AA/AF and utilize a custom timedemo that takes place during one of the more action oriented sequences. We generally find the game to be enjoyable with an average frame rate above 35fps.
Gaming Summary
In our memory sensitive Battlefield 2 and Prey benchmarks we see the MSI P03 BIOS equipped board leading the other DDR2 boards due to improved memory latencies and bandwidth. Our Company of Heroes benchmark is CPU/GPU throughput sensitive and we see our MSI board trailing the ASUS and Gigabyte P35 boards slightly. Gaming performance is driven by the GPU, especially in the latest titles, but every extra bit of performance always helps.
Quick Thoughts
Looking at the first results from the P03 BIOS on the MSI P35 Platinum, it is clear that MSI abided by their promise to bring this board's performance up to par with the top DDR2 offerings from ASUS and Gigabyte. In memory bandwidth or latency sensitive applications at stock speeds, it is every bit equal to or better than the ASUS/Gigabyte boards, even though the differences are minimal in most cases.
As far as the new P03 BIOS goes, there are no additional settings when compared to the P01 BIOS in our first look at the P35 Platinum. When compared to the settings offered in the ASUS and Gigabyte P35 boards, the MSI BIOS looks downright barren. While the options are fairly limited, the basic items generally required for properly overclocking and tuning a board are available. That brings us to our main concern about this BIOS.
We had a very difficult time manually changing our memory timings to settings other than what was available in the SPD. MSI has thoroughly tuned this particular BIOS to offer outstanding memory and chipset latencies but in so doing has ensured the user will have to follow a narrow path when choosing memory settings. The board generated excellent memory performance at or near the stock 1066 memory speeds we utilize even though the memory timings were somewhat handicapped at 5-5-5-18. However, any chance at improving our memory timings while remaining in the 800/1066 strap generally met with frustration or failure.
For certain enthusiasts, this can be very frustrating, but for those users who believe and trust in auto settings this board will reward them with outstanding performance and stability. We generally let the board set itself and after a couple of weeks of testing, we also became believers of the "set and forget" auto performance settings that MSI has built into the board. This did limit us in our attempts to fine tune the board's memory settings or find that extra little bit of performance on the memory strap bubble, but overall any differences other than those for competitive benchmarking purposes would never be noticed in actual usage.
Overclocking with our quad core processor was excellent and in our preliminary testing with an E4300, E6320, E6600, and E6850 we are seeing FSB results in the 535~550 FSB range on the lower multipliers. However, we generally had to run the memory strap at 1333 above 500FSB and have found in testing that staying in the 1066 strap on the board around 485FSB offers the best overall performance if your CPU has the necessary range of multipliers.
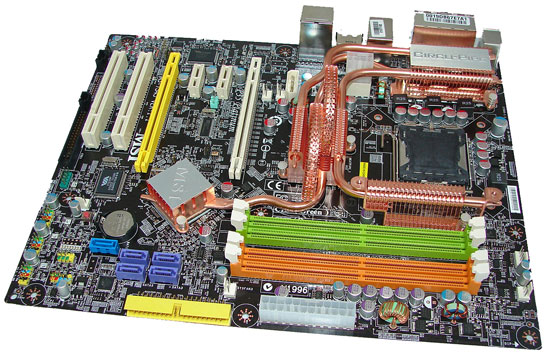
Overall, we are very pleased with the performance that MSI has extracted from this board now. The only question that remains is how well it compares to new P35 boards from Biostar, abit, Foxconn, and Gigabyte in this price range. That question will be answered in our roundup shortly but for now those looking for great "set and forget" stock performance cannot go wrong with this board... unless of course the rollercoaster themed heatpipe system is a deal breaker.


