Original Link: https://www.anandtech.com/show/899
Sub-$200 Video Card Roundup - April 2002
by Anand Lal Shimpi on April 16, 2002 3:51 AM EST- Posted in
- GPUs
Although we almost always tend to focus on the high-end, the GeForce4 Ti 4600s, of the market it's quite the opposite from the perspective of ATI and NVIDIA. While it's always nice to have a performance leading part from a PR and brand-recognition perspective, those high-performance GPUs are often only found on cards priced between $200 - $400. If you were to look at a breakdown of the add-in graphics card market you'd find that over 80% of the market won't pay a penny over $199 for their graphics card, making cards like the GeForce4 Ti 4600 very low volume products.
Then why produce them? Since they are low volume products it is easy to outfit them with extremely fast memory (325MHz DDR), a very large PCB (almost the size of a Voodoo5 5500) and a complex die also running at a high clock speed (300MHz). The culmination of all of these efforts satisfies the very small percentage of the market that is composed of people like us. In turn, we brag about our incredibly fast video cards and help to educate the rest of the masses to buy one brand over another. When everyone else goes out to purchase a video card they don't spend the $320 on a Ti 4600, they buy whatever NVIDIA card they can for $199 or less. Well if you can't get a GeForce4 Ti 4600, then a GeForce4 MX will do just fine, right?
There isn't a single knowledgeable member of our community that hasn't expressed extreme distaste with NVIDIA's GeForce4 MX line. Little more than a glorified GeForce2 MX with a GeForce4-derived memory controller, the GeForce4 MX has been called everything from NVIDIA's first major screw-up in years to 99% marketing and 1% product. From NVIDIA's perspective, the GeForce4 MX is perfect. The entire line of MX cards falls below the $199 mark making it a product for the masses, the GPU is noticeably less complex than the GeForce4 and thus boasts a smaller die size making it cheaper to manufacture, lower memory clocks give NVIDIA the ability to offer ample supply to the market and it carries the GeForce4 brand which is associated with the very highest performance graphics cards around. In terms of performance, we've proven that the cards run the majority of today's games very well so what's all the fuss about? In the end, the biggest compliant from our community and developers alike is the use of the GeForce4 brand name on a part that has the same amount of DirectX 8 features as a GeForce2 thus deliberately misleading the consumer. In fact, had it not been for ATI the sub $200 add-in card market would probably be dominated by non-DX8 compliant cards.
Just days before NVIDIA's GeForce4 and GeForce4 MX launch, ATI introduced the Radeon 8500LE 128MB which would be priced below $200 and offer full DX8 compliance. NVIDIA of course knew very well of ATI's plans (little is kept secret in this industry) and was forced to produce a mass-market GeForce4, the Ti 4200. Neither the Radeon 8500LE 128MB nor the GeForce4 Ti 4200 were available when both companies were talking about them but it's the recent if not soon-to-be availability of both of those cards that makes this article ready for introduction.
If the vast majority of the market spends less than $200 on a video card then we had better round up as many sub $200 cards as possible. The only criterion for this roundup was that the card would carry a street price of $199 or less. Before we get to the benchmarks themselves lets have a quick look at the two new contenders that we haven't talked about in much detail before.
ATI's Radeon 8500LE: Let the people have DX8 compatibility


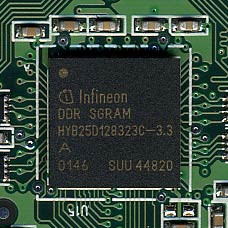
Unlike the Radeon LE that preceded it, the Radeon 8500LE is an officially sanctioned, retail part from ATI that only differs from its bigger brother in its clock speed (250/250 vs 275/275). The 9% drop in clock speed doesn't hurt performance too much and allows ATI to target the critical sub $200 market with the card. In fact, during ATI's initial press briefing of the Radeon 8500LE it was placed head to head with the few specs that were known about NVIDIA's GeForce4 MX line. The goal was to offer the only DX8 solution in the mainstream market and beat NVIDIA where it counted the most. The Radeon 8500LE would also become the only board in this sector to offer 128MB of DDR SDRAM on-board using BGA packaged memory.
The Radeon 8500LE is currently available and is priced at $199.
NVIDIA's GeForce4 Ti 4200: ATI, look what you made them do
NVIDIA would have been quite happy supplying the mainstream market with GeForce4 MX cards but because of the Radeon 8500LE it became necessary for NVIDIA to also have a DX8 card in this sector; and thus the GeForce4 Ti 4200 was born.


The GeForce4 GPU is considerably more expensive to manufacture than the GeForce4 MX so costs had to be cut as much as possible to make the Ti 4200 a profitable offering. The GPU is clocked at 250MHz, making it the highest yielding NV25 GPU coming out of TSMC. As far as memory goes the card can be offered with 222MHz DDR (effectively 444MHz) or 250MHz DDR (effectively 500MHz) SDRAM. The difference in memory clock speeds arises from the fact that the cards will be offered with TSOP packaged memory and not the new BGA packaged memory we've seen on the higher end GeForce4s. In order to offset the costs of the 128MB cards the slower memory is used while the 64MB cards get the benefit of faster memory.
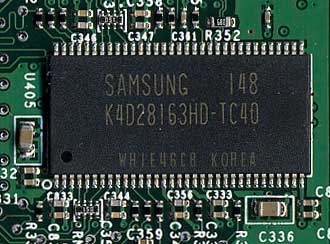
Sticking to TSOP memory allowed NVIDIA to keep to an older board design and you'll notice by the above pictures that the power circuitry is significantly reduced. The Ti 4200 PCBs are also 6-layer boards instead of the much more expensive 8-layer 4400/4600 boards.
The end result is a GeForce4 that is cheap enough to produce that it can be sold for $179/$199 (64MB/128MB). Availability is very scarce at this point, most board manufacturers are waiting for chips from NVIDIA. Most cards will begin to appear in May. One thing that should be made very clear is that the overclocking characteristics of the reference boards being sent out for review now are in no way representative of how final Ti 4200 boards will overclock. NVIDIA's reference boards have historically overclocked much better than shipping cards which also explains why NVIDIA usually encourages reviewers to try overclocking in their reviews.
The Test
You'll notice that this roundup is done a bit differently from graphics roundups in the past. We benchmarked each card at three resolutions, 800x600, 1024x768 and 1280x1024. For those tests we used the fastest available Athlon XP CPU on an KT266A platform (2100+ on an EPoX 8KHA+). Obviously not everyone looking for a sub $200 video card will be running the absolute fastest Athlon XP processor so we benchmarked every card under every game at 1024x768 at 15 different clock speeds.
We kept the FSB speed and CPU architecture constant so we could accurately measure how the various cards scaled with CPU clock speed; while this does produce some unofficial CPU speeds (e.g. 800MHz/133MHz FSB Athlon XP), you can get a good idea of where your CPU will limit your performance with any of these cards.
At the end of each game benchmark section you'll find a CPU Scaling graph that depicts exactly what we've mentioned above. We spent countless days running the CPU scaling tests so we hope they come in handy for you.
|
Windows
XP Professional Test Bed
|
|
|
Hardware
Configuration
|
|
| CPU |
AMD
Athlon XP 2100+ (1.73GHz)
133.3MHz x 13.0 |
| Motherboard |
EPoX
8KHA+ BIOS Revision 11/30/2001
VIA KT266A Chipset |
| RAM |
1
x 256MB DDR266 CAS2 Crucial DIMM
|
| Sound |
None
|
| Hard Drive |
30GB
IBM Deskstar 75GXP
|
| Video Cards (Drivers) |
ATI
Radeon 8500 64MB (6.13.10.6043)
ATI Radeon 8500LE 128MB (6.13.10.6043) ATI Radeon 7500 64MB (6.13.10.6043) NVIDIA GeForce4 Ti 4200 128MB (28.32) NVIDIA GeForce3 Ti 200 64MB (28.32) NVIDIA GeForce4 MX 460 64MB (28.32) NVIDIA GeForce4 MX 440 64MB (28.32) |
Unreal Performance Test 2002 - Build 918
We originally debuted this test months ago but it has been healthily evolving since then. The premise behind the Unreal Performance Test is to take the current build of Epic's Unreal Engine and test today's graphics cards using it. This not only better prepares you for what to expect when games featuring the engine come out (e.g. Unreal Tournament 2003) but it also helps the guys at Epic during the development stage as they can work out driver bugs with the hardware vendors long before the engine's public debut.
The engine we're testing with now is up to build 918, up from build 848 we originally tested with back in January. The benchmark today is much more stressful than even what we used in our GeForce4 review and according to Epic, it's even more stressful than most game scenarios will be but it makes for a wonderful benchmark. A number of optimizations for both ATI and NVIDIA's architectures have also been implemented into the engine. The only thing to keep in mind is to not focus on the actual frame rates themselves but the performance standings as things will be a bit less stressful when UT2003 comes around.
| Unreal
Performance Test 2002 800x600x32 |
|||||||||||||
|
In our GeForce4 review the Ti 4600 completely dominated the UPT benchmarks and although the Ti 4200 is clocked significantly lower, we see the same hints of domination here at 800 x 600. A 17% performance advantage over the GeForce3 is nothing to laugh at, especially for a card that will be made available at the $199 mark.
The two 8500 cards do pretty well in this test but as you'll see we ran into some problems as we upped the resolution a bit. You'll notice that the 10% increase in clock speed the original 8500 holds over the new 8500LE 128MB isn't enough to really separate the two at this low of a resolution. Let's see how things change at 10x7.
| Unreal
Performance Test 2002 1024x768x32 |
|||||||||||||
|
The higher the resolution goes the more the Ti 4200 ends up dominating this test. Although priced similarly to the GeForce4 MX 460, the GeForce4 Ti 4200 makes it very clear that there's more to performing well than just carrying the GeForce4 name.
Earlier we mentioned the performance anomalies at higher resolutions with the ATI cards and here you'll see exactly what we're talking about. Using the latest drivers just released last week the performance on all of the ATI cards is hurt pretty significantly here at higher resolutions. Even the GeForce4 MX 460 is able to pull ahead of the Radeon 8500 and the Radeon 8500LE. We'll be working with Epic and ATI to see if we can resolve these issues.
Luckily there are no visual artifacts by any of the cards/drivers.
| Unreal
Performance Test 2002 1280x1024x32 |
|||||||||||||
|
With 1600x1200 being a bit of a stretch for most of these cards, the highest resolution we tested at was 1280x1024. The picture doesn't change too much here, except for the fact that the GeForce4 MX line drops from competitive to the bottom of the charts.
CPU Scaling under Unreal Performance Test 2002
To kick off our CPU scaling tests we use the Unreal Performance Test 2002 with our barrage of CPUs. The graph is fairly self explanatory so we'll only point out interesting trends.
If you look at the slowest CPU speed (800MHz) you'll realize that with the exception of the GeForce3 and GeForce3 Ti 200, the GeForce4 Ti 4200 can offer a decent performance improvement over any of the competing cards in future games based on the Unreal Engine.
It's also interesting to note that with the exception of the GeForce4 Ti 4200, the rest of the contenders don't really scale well with CPU speed. After the 1.2GHz mark pretty much all of the cards are running on flat scaling curves meaning that they've run out of juice.
Luckily we won't see this strenuous of a situation for some time to come, let's have a look at some currently available games.
Serious Sam 2: The Second Encounter
The publicly available Serious Sam 2 demo was used for this test. We ran the Extreme Quality add-on to override any autodetected graphics settings, then set our resolution and disabled anisotropic filtering for the benchmarks. We picked the first demo as our benchmark level of choice. We recorded the average frame rate without excessive peaks.
| Serious
Sam 2: The Second Encounter 800x600x32 |
|||||||||||||
|
In the past ATI has had some serious (no pun intended) issues with performance under Serious Sam 2 but it seems like the latest drivers fix that quite well. While the Ti 4200 still commands the significant lead, it's the battle occuring below it that is interesting. The original 64MB Radeon 8500 continues to offer no real performance improvement over the newer, cheaper, Radeon 8500LE 128MB leaving both of them approximately on par with the GeForce3 Ti 200.
The GeForce4 MX line is better positioned against the Radeon 7500 here as the MX 460 holds an 8% advantage while the MX 440 is at a 13% disadvantage compared to ATI's DX7 part.
| Serious
Sam 2: The Second Encounter 1024x768x32 |
|||||||||||||
|
As we expected when we first heard of the card, the Ti 4200 continues to do very well especially as the resolution increases. The two 8500 cards manage to move up a bit in the charts as well and the MX line is driven to the bottom three positions.
When compared to the GeForce2 MX 400 the GeForce4 MX is clearly a success, it's the pressure from ATI and bad naming on NVIDIA's part that made the GeForce4 MX less of a success and more of a disappointment. Luckily for NVIDIA, the Ti 4200 more than makes up for it.
| Serious
Sam 2: The Second Encounter 1280x1024x32 |
|||||||||||||
|
Once again, not much changes as we round out the benchmarks at 1280x1024. Let's see how these cards scale in Serious Sam 2.
CPU Scaling under Serious Sam 2
Here we have noticeably flatter CPU scaling curves; after the 1GHz mark even the GeForce4 Ti 4200 begins to flatten out indicating that with all of the visual features turned up at 1024x768, the Serious engine is running into video card bottlenecks. Here we have to look at acceptable frame rate levels and pretty much everything below the GeForce3 Ti 200 and Radeon 8500LE are a bit lower than we'd like to see.
Jedi Knight 2: Jedi Outcast
Jedi Knight 2 is the perfect example of why we have continued to use Quake III Arena in our benchmarks for so long. The game is based on the Quake III Arena engine but receives updated graphics, shader programs and a unique gameplay perspective to fit with the Star Wars theme. The game has built in timedemo functionality and comes with a demo, to run the demo you simply bring down the console (by hitting shift and tilde ~ at the same time) and type in the following:
devmap ffa_bespin
timedemo 1
disconnect
demo jk2ffa
After the demo is complete you can use the page up key to scroll up through the console text to find the average frame rate. We tested with the game's High Quality defaults.
| Jedi
Knight 2: Jedi Outcast 800x600x32 |
|||||||||||||
|
You'll notice that at 800x600 we are clearly CPU limited, almost all of the contenders are performing alike.
| Jedi
Knight 2: Jedi Outcast 1024x768x32 |
|||||||||||||
|
Even at 1024x768 it takes the Radeon 7500 and the GeForce2 MX 400 to really provide any separation among the cards.
| Jedi
Knight 2: Jedi Outcast 1280x1024x32 |
|||||||||||||
|
Finally at 1280x1024 things get a little more interesting but it's clear that Jedi Knight 2 is far from GPU limited, let's have a look at the CPU scaling graphs to see exactly what's going on.
CPU Scaling under Jedi Knight 2
Just as we mentioned on the previous page, under Jedi Knight 2 the performance of the majority of these cards is governed primarily by CPU speed. The Radeon 7500 tapers off after about the 1.53GHz mark and the GeForce2 MX 400 is stuck at its 57fps regardless of CPU speed but other than those two the performance scales very linearly. If you're a big Jedi Knight 2 fan you'd be better off with a more powerful CPU than you would be going after a faster graphics card.
Comanche 4
For years we've searched for a good flight simulator benchmark and we've always run into the same problem, we've never been able to find one with built-in benchmark capabilities. Luckily, NovaLogic released a benchmark demo of their DirectX 8.1 Comanche 4 flight sim. We ran the publicly available demo (which you can get here) with all options set to high and sound disabled.
| Comanche
4 800x600x32 |
|||||||||||||
|
Much like what we saw with Jedi Knight 2, Commanche 4 seems to be very CPU bound at 800x600. Let's see how things fare as we increase the resolution a bit.
|
Comanche
4
1024x768x32 |
|||||||||||||
|
The GeForce4 Ti 4200 manages to pull away from the majority of the contenders but its still clear that this DX8 test isn't very GPU bound. It's also interesting to note that the extra 64MB of memory on the Radeon 8500LE more than makes up for the 9% core/memory speed deficit when compared to the 64MB 8500 in this test.
| Comanche
4 1280x1024x32 |
|||||||||||||
|
Here we have the GeForce4 Ti 4200 go head to head with the Radeon 8500LE and in this case it comes out approximately 22% faster.
CPU Scaling under Comanche 4
Under Comanche 4 it's clear that the game is very CPU dependent but it's also interesting to note that as CPU speed does increase, the performance difference between the Ti 4200 and the rest of the contenders grows considerably. It grows to the point where at 1.73GHz there is a noticeable performance difference between the Ti 4200 and the rest of the pack, a performance difference that is relatively nonexistant at lower speeds.
With the GeForce2 MX 400 thrown in primarily as a reference point, it's clear that if you're running that slow of a video card it's definitely time for an upgrade before you even touch your CPU.
Quake III Arena
This game requires no introduction, the test has been with us for a while and we continue to use it as the engine continues to have a lot of life left in it. We tested with the game's High Quality defaults.
| Quake
III Arena 800x600x32 |
|||||||||||||
|
At 800x600 we are primarily CPU bound in this test and thus the majority of the cards perform very close to one another.
| Quake
III Arena 1024x768x32 |
|||||||||||||
|
The situation changes slightly at 1024x768; you'll notice that this is one of the few cases where there's a small performance difference between the 64MB Radeon 8500 and the 128MB Radeon 8500LE. Quake III Arena doesn't really have a use for the added texture memory so it favors the additional memory bandwidth of the Radeon 8500 over the 8500LE.
This is one benchmark in which the GeForce4 MX does extremely well in, mostly because it is an older game and is mainly dependent on memory bandwidth which the GeForce4 MX has a good amount of at the GPU's disposal.
| Quake
III Arena 1280x1024x32 |
|||||||||||||
|
Even at 1280x1024 the performance of almost all of the contenders is well above respectable, only the old GeForce2 MX 400 is unable to keep up at this high of a resolution.
CPU Scaling under Quake III Arena
You can see that after a certain point these cards begin to run out of juice under Quake III Arena. Even the Ti 4200 exhibits some leveling off while the rest of the contenders are clearly flattening their CPU scaling curves either just after the 1.26GHz mark or well before it.
But with frame rates almost all above 138 fps is there any reason to complain at all?
Return to Castle Wolfenstein
Another game based Quake III Arena engine, RtCW proves to be a much more stressful implementation of the engine. We tested with the game's High Quality defaults. It should be noted that with the texture detail set to high (part of the High Quality defaults), performance on cards with only 64MB of RAM become much more erratic than those with 128MB. There was a considerable amount of swapping which was noticed during the tests.
| Return
to Castle Wolfenstein 800x600x32 |
|||||||||||||
|
The performance standings here are identical to those under Quake III Arena and rightfully so as the two games are based on the same engine and are relatively similar in the types of stress they put on the graphics cards. It's clear that RtCW is much more of a stressful game however and is noticeably more demanding on the video card, you won't see any 250 fps+ scores here; not yet at least.
| Return
to Castle Wolfenstein 1024x768x32 |
|||||||||||||
|
These last two sets of results are pretty straightforward. Once again we see that the GeForce4 MX does relatively well here compared to some of the newer games we started off testing with.
| Return
to Castle Wolfenstein 1280x1024x32 |
|||||||||||||
|
CPU Scaling under Return to Castle Wolfenstein
The CPU scaling chart is very similar to what we saw under Quake III Arena with the exception that the scaling curves are not nearly as smooth. As we mentioned at the start of our RtCW tests, this is mainly due to the swapping that occurs when texture detail is set to high.
Final Words
If it isn't clear by now this should help considerably, NVIDIA's GeForce4 Ti 4200 is by far the best card under the $200 mark for those purchasing in the very near future. It does very well against ATI's Radeon 8500LE and manages to perform well even on slower CPUs. Our CPU scaling charts can help you pick out exactly what would offer you the best bang for your buck depending on your CPU speed but in most situations you'll get very good performance out of the Ti 4200.
Provided that availability isn't an issue, the 128MB GeForce4 Ti 4200 cards should be sought after instead of the 64MB cards. While you should be able to overclock the 128MB cards to the 64MB speeds, you can never add additional memory to a 64MB card which will hurt you down the road. We are already seeing that in some of our tests today and games will only become even more demanding on memory sizes going forward.
Let us not forget about the Radeon 8500LE however as it is the primary reason that we have the GeForce4 Ti 4200 today. If it weren't for the Radeon 8500LE we would be left with a DX7 compliant GeForce4 MX to tend to the mainstream market. Unfortunately for ATI, the card that was designed to put the GeForce4 MX to shame ended up resulting in the pending release of the Ti 4200 which is a bit more than the 8500LE can offer.
This is the perfect example of where competition truly brings us better choices in a market, it'll be interesting to see what happens if a capable third manufacturer returns to the scene. With DirectX 9 on the horizon the major hardware firms are diligently at work on their next-generation GPUs, from R300 to NV30 to something else being shown now behind closed doors - as usual, the graphics market always keeps us busy. Stay tuned.


