Original Link: https://www.anandtech.com/show/4346/ocz-agility-3-240gb-review
OCZ Agility 3 (240GB) Review
by Anand Lal Shimpi on May 24, 2011 2:53 AM ESTOCZ has been at the forefront of each generation of SandForce SSD release since the debut of the SF-1500 based Vertex Limited Edition. More recently the Vertex 3 was the first client SSD to use SandForce's SF-2281 controller. Many of you have written me asking if the Vertex 3 is worth the additional cost over the Vertex 2. Given that you can pick up a 120GB Vertex 2 for $210 ($180 after rebate), and a 120GB Vertex 3 will set you back $300 flat it's tough to recommend the latter despite the performance improvements. If you don't have a 6Gbps platform (e.g. Intel 6-series, AMD 8-series) the Vertex 2 vs. Vertex 3 decision is a little easier to make, otherwise the newer, faster Vertex 3 is quite tempting.
There's another issue holding users back from the Vertex 3: capacity. The Vertex 3 is available in 120, 240 and 480GB versions, there is no 60GB model. If you're on a budget or like to plan frequent but rational upgrades, the Vertex 3 can be a tough sell.
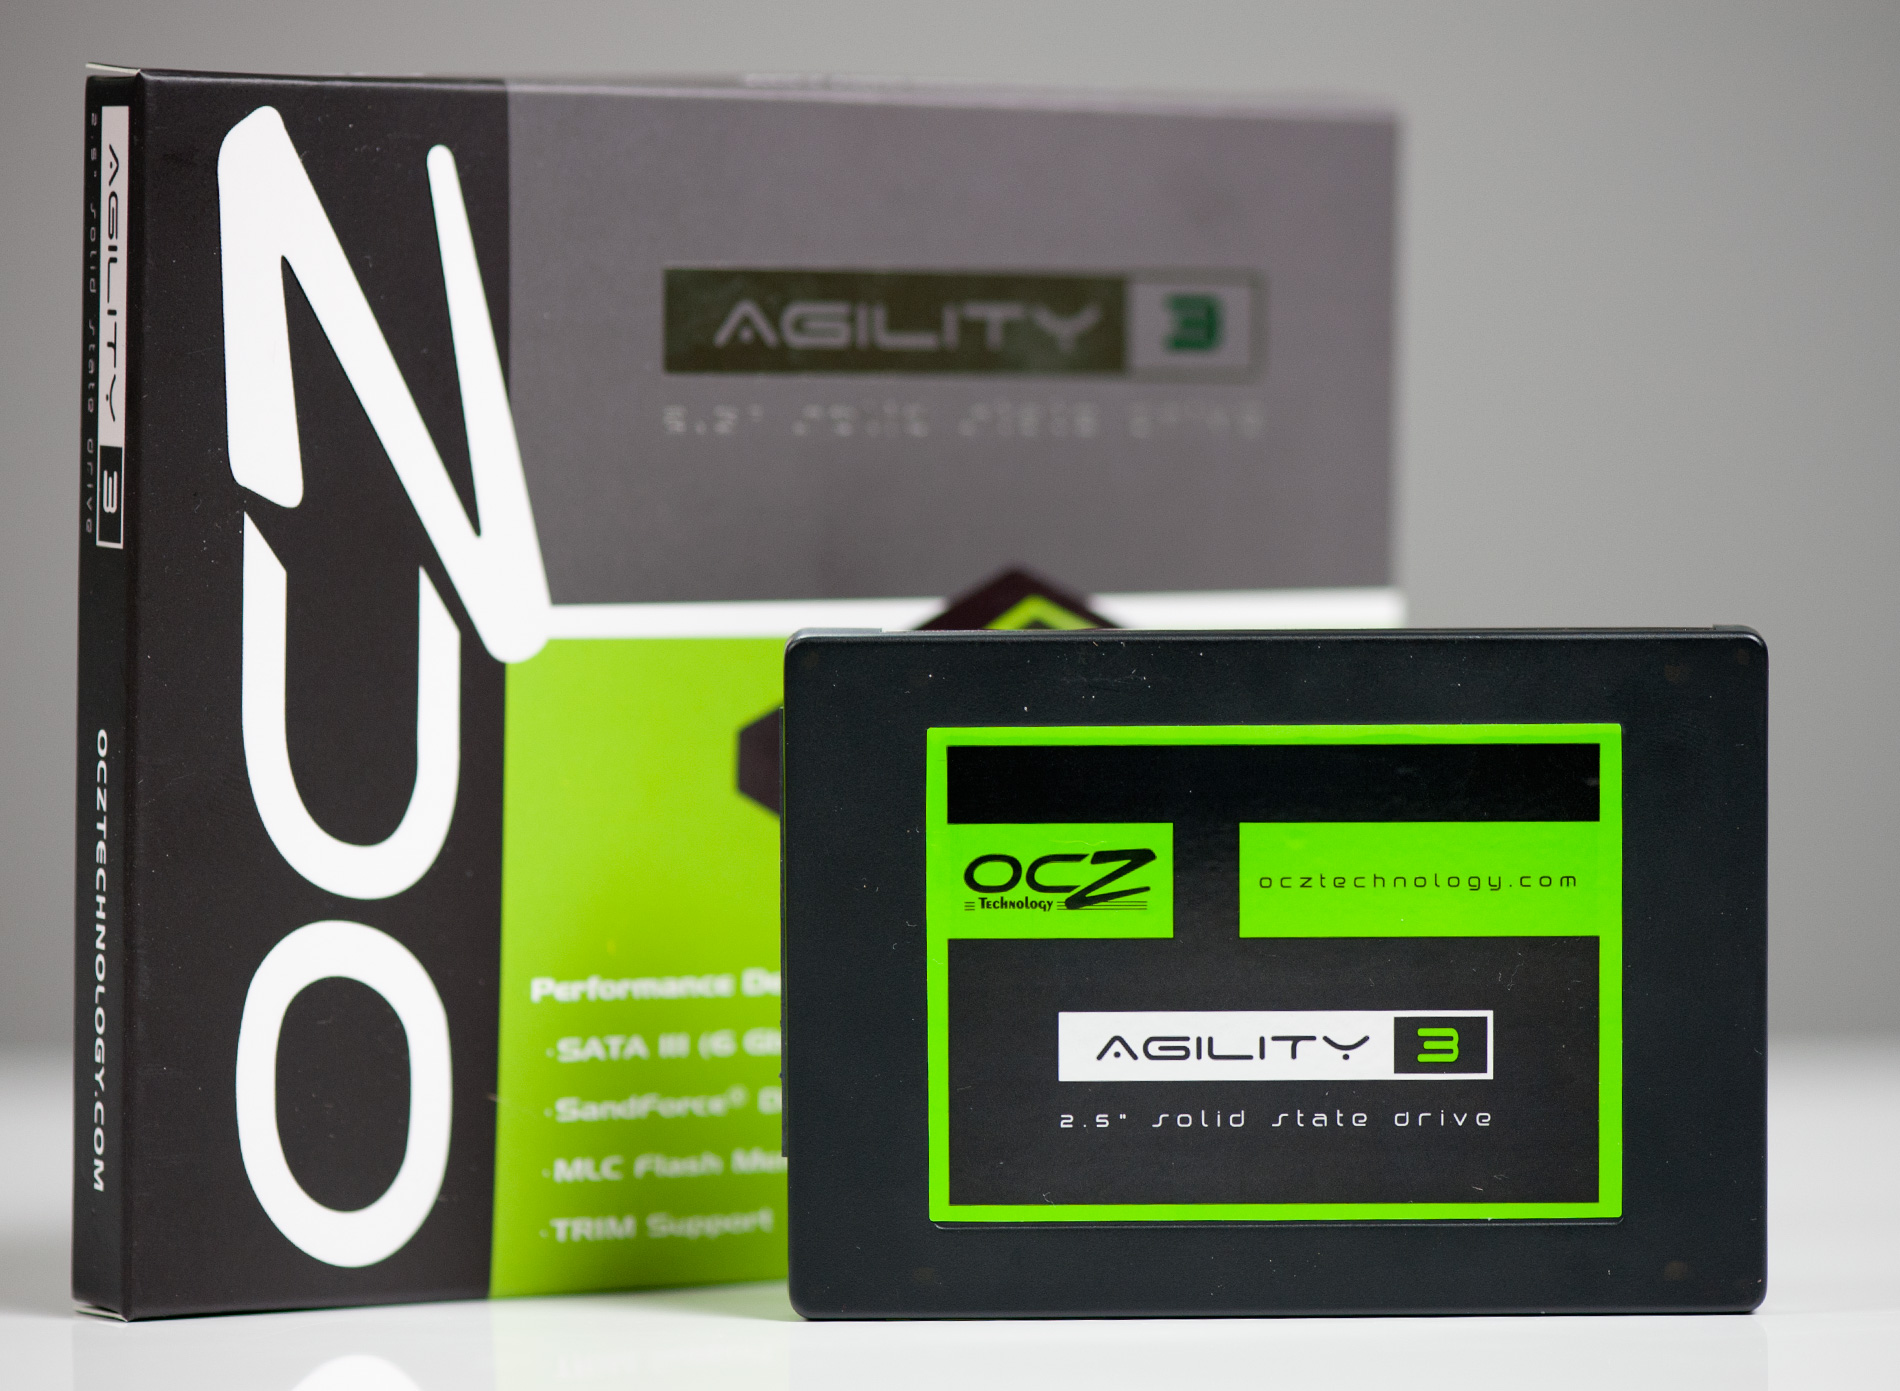
Enter the Agility 3, OCZ's mainstream SF-2281 drive.
Architecturally the Agility 3 is identical to the Vertex 3. You get the same controller running similar firmware, and as a result post similar peak performance stats (note the use of the word peak):
| OCZ SF-2200 Lineup | ||||||||
| Specs (6Gbps) | Agility 3 | Agility 3 120GB | Vertex 3 120GB | Agility 3 240GB | Vertex 3 240GB | Vertex 3 480GB | ||
| Raw NAND Capacity | 64GB | 128GB | 128GB | 256GB | 256GB | 512GB | ||
| Spare Area | ~6.3% | ~12.7% | ~12.7% | ~12.7% | ~12.7% | ~12.7% | ||
| User Capacity | 55.8GB | 111.8GB | 111.8GB | 223.5GB | 223.5GB | 447.0GB | ||
| RAISE | No | Yes | Yes | Yes | Yes | Yes | ||
| Number of NAND Devices | 8 | 16 | 16 | 16 | 16 | 16 | ||
| Number of die per Device | 1 | 1 | 1 | 2 | 2 | 4 | ||
| NAND Type | ONFI 1.0 | ONFI 1.0 | ONFI 2.0 | ONFI 1.0 | ONFI 2.0 | ONFI 2.0 | ||
| Max Read | Up to 525 MB/s | Up to 525 MB/s | Up to 550MB/s | Up to 525 MB/s | Up to 550MB/s | Up to 530MB/s | ||
| Max Write | Up to 475 MB/s | Up to 500 MB/s | Up to 500MB/s | Up to 500 MB/s | Up to 520MB/s | Up to 450MB/s | ||
| 4KB Random Read | 10K IOPS | 20K IOPS | 20K IOPS | 35K IOPS | 40K IOPS | 50K IOPS | ||
| 4KB Random Write | 50K IOPS | 50K IOPS | 60K IOPS | 45K IOPS | 60K IOPS | 40K IOPS | ||
| MSRP | $134.99 | $229.99 | $249.99 | $419.99 | $499.99 | $1799.99 | ||
| Street Price | ? | ? | $299.99 | ? | $559.99 | $1799.99 | ||
OCZ has started publishing both peak and incompressible write performance data, but only on its product sheets. While peak performance isn't affected, incompressible performance is. Using AS-SSD as a benchmark, OCZ claims the Agility 3 is only able to muster about 200MB/s for peak sequential reads/writes on the 240GB drive - that's less than half the score the Vertex 3 gets in AS-SSD's read test. Our benchmarks, as you'll soon see, confirm the deficit.
If it's not the controller causing this, and it's not the firmware - then it's the NAND. The Agility 3 (and Solid 3) both use asynchronous NAND. What does that mean? Let's find out.
Asynchronous NAND: An ONFi History Lesson
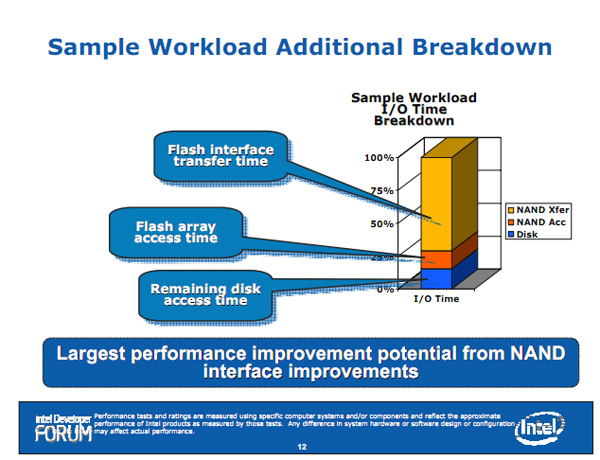
It takes 50µs to read 8KB from a 25nm Intel NAND die. That works out to a staggering 156MB/s, from a single NAND die. Even the old 50nm stuff Intel used in the first X25-M could pull 4KB in 50µs or ~78MB/s. The original X25-M had 10 channels of NAND, giving it the ability to push nearly 800MB/s of data. Of course we never saw such speeds, as it's only one thing to read a few KB of data from a NAND array and dump it into a register. It's another thing entirely to transfer that data over an interface to the host controller.
ONFi 1.0 limited NAND performance considerably
Back in 2006 the Open NAND Flash Interface (ONFi) workgroup was formed with the task of defining a standardized interface for NAND Flash. Today, Intel and Micron are the chief supporters of ONFi while Toshiba and Samsung abide by a separate, comparable standard.
As is typically the case, the first standard out of the workgroup featured very limited performance. ONFi 1.0 topped out at 50MB/s, which was clearly the limiting factor in NAND transfer speed (see my example above). The original ONFi spec called for an asynchronous interface, as in one not driven by a clock signal. Most logic these days is synchronous, meaning it operates off of a host clock frequency. Depending on the architecture, all logic within a synchronously clocked system will execute/switch whenever the clock signal goes high, low or both. Asynchronous logic on the other hand looks for a separate signal, similar to a clock, but not widely distributed - more like a simple enable pin. In the asynchronous NAND world this is the role of the RE, WE and CLE (read/write/command-latch enable) signals.
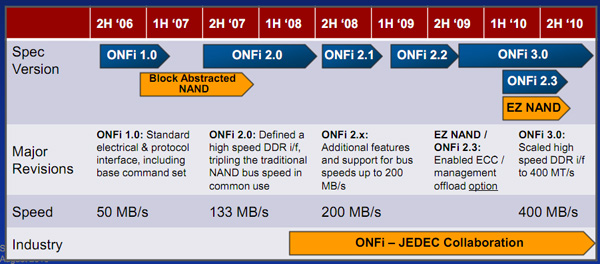
ONFi 2.0 brought the move to source synchronous clocking, as well as double data rate (DDR) operation. Not only were ONFi 2.0 NAND devices tied to a clock frequency, transfers happened on both rising and falling edges of the clock - a similar transition was made in SDRAM over a decade ago. While ONFi 1.0 NAND was good for up to 50MB/s, ONFi 2.0 increased the interface speed to 133MB/s. Present day synchronous ONFi 2.1/2.2 NAND is no longer interface limited as the spec supports 166MB/s and 200MB/s operating modes. Work on ONFi 3.0 is being done now to take the interface up to 400MB/s.
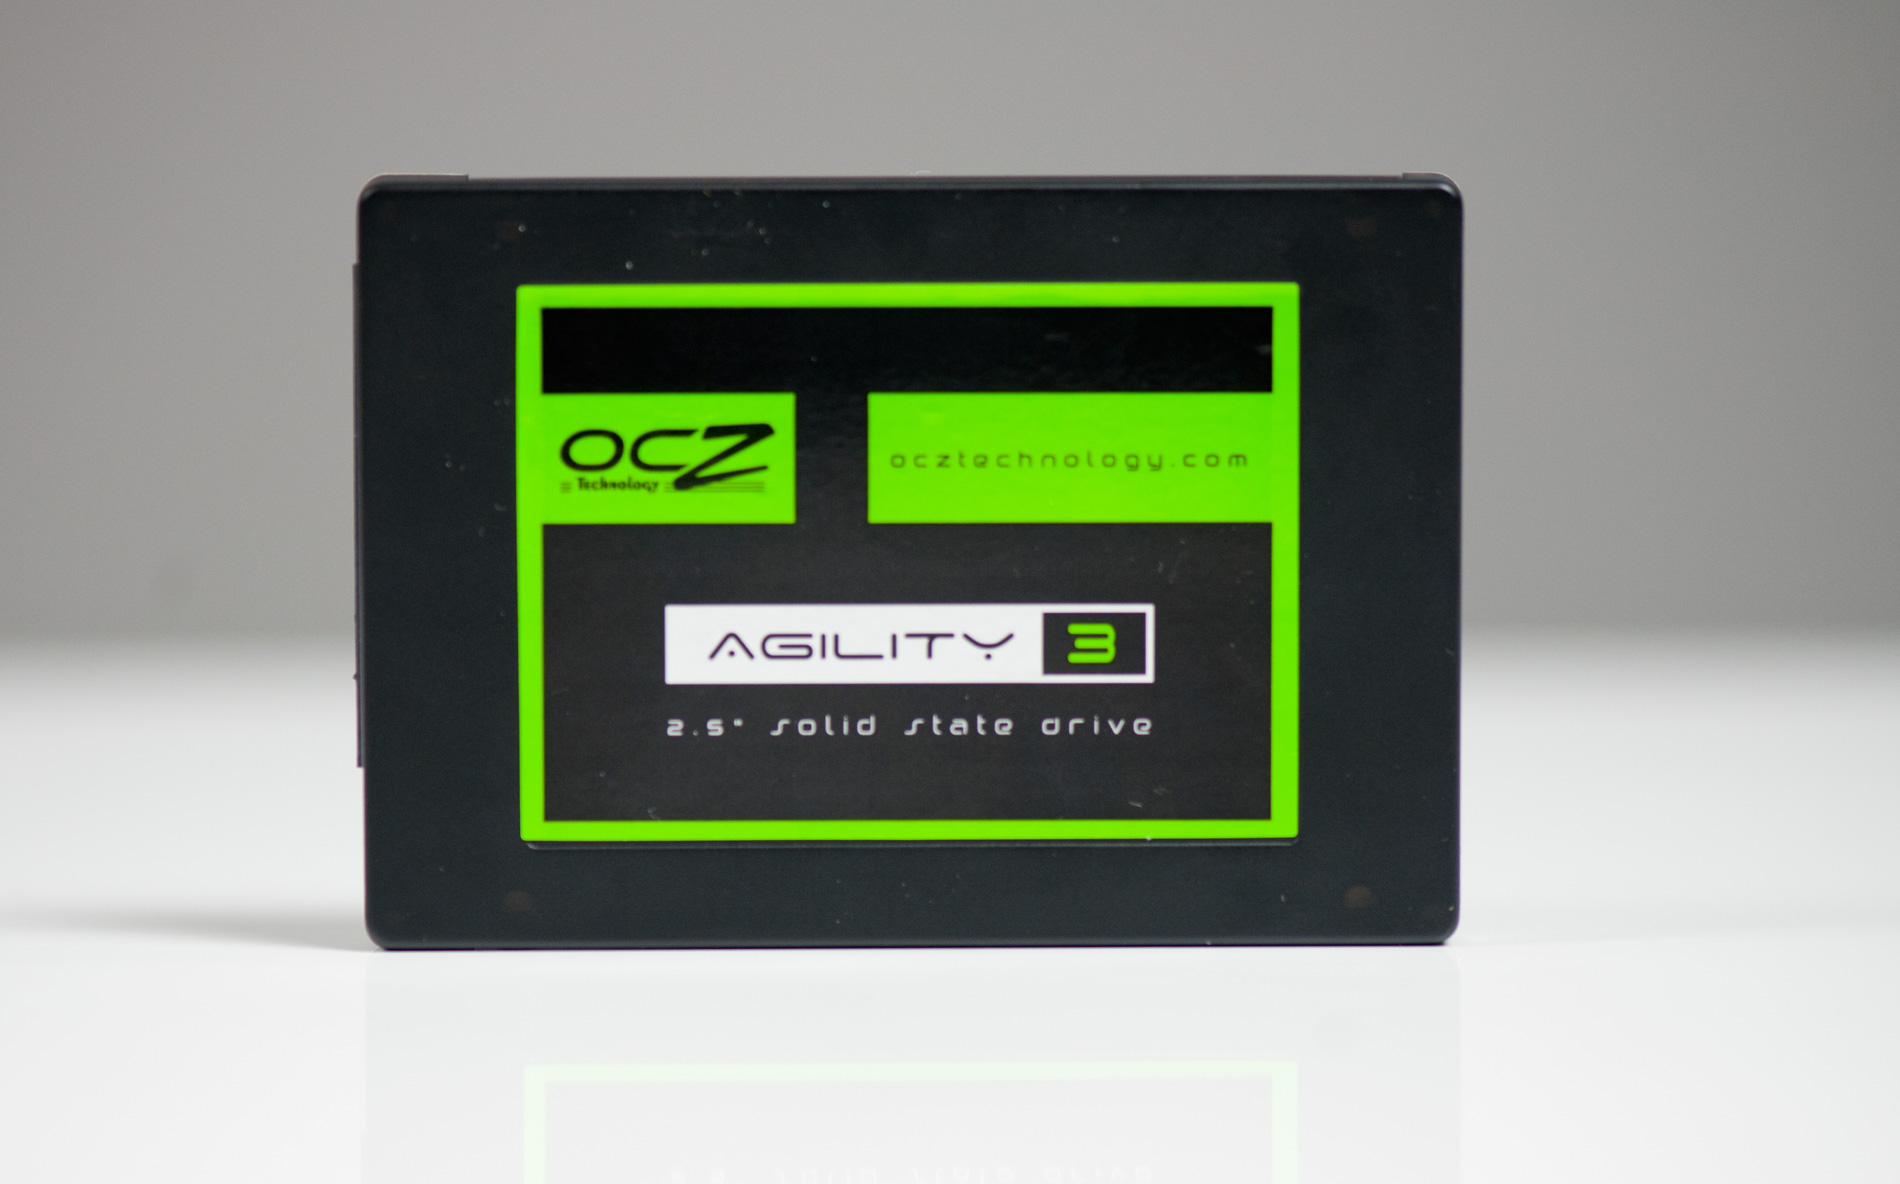
The Agility 3
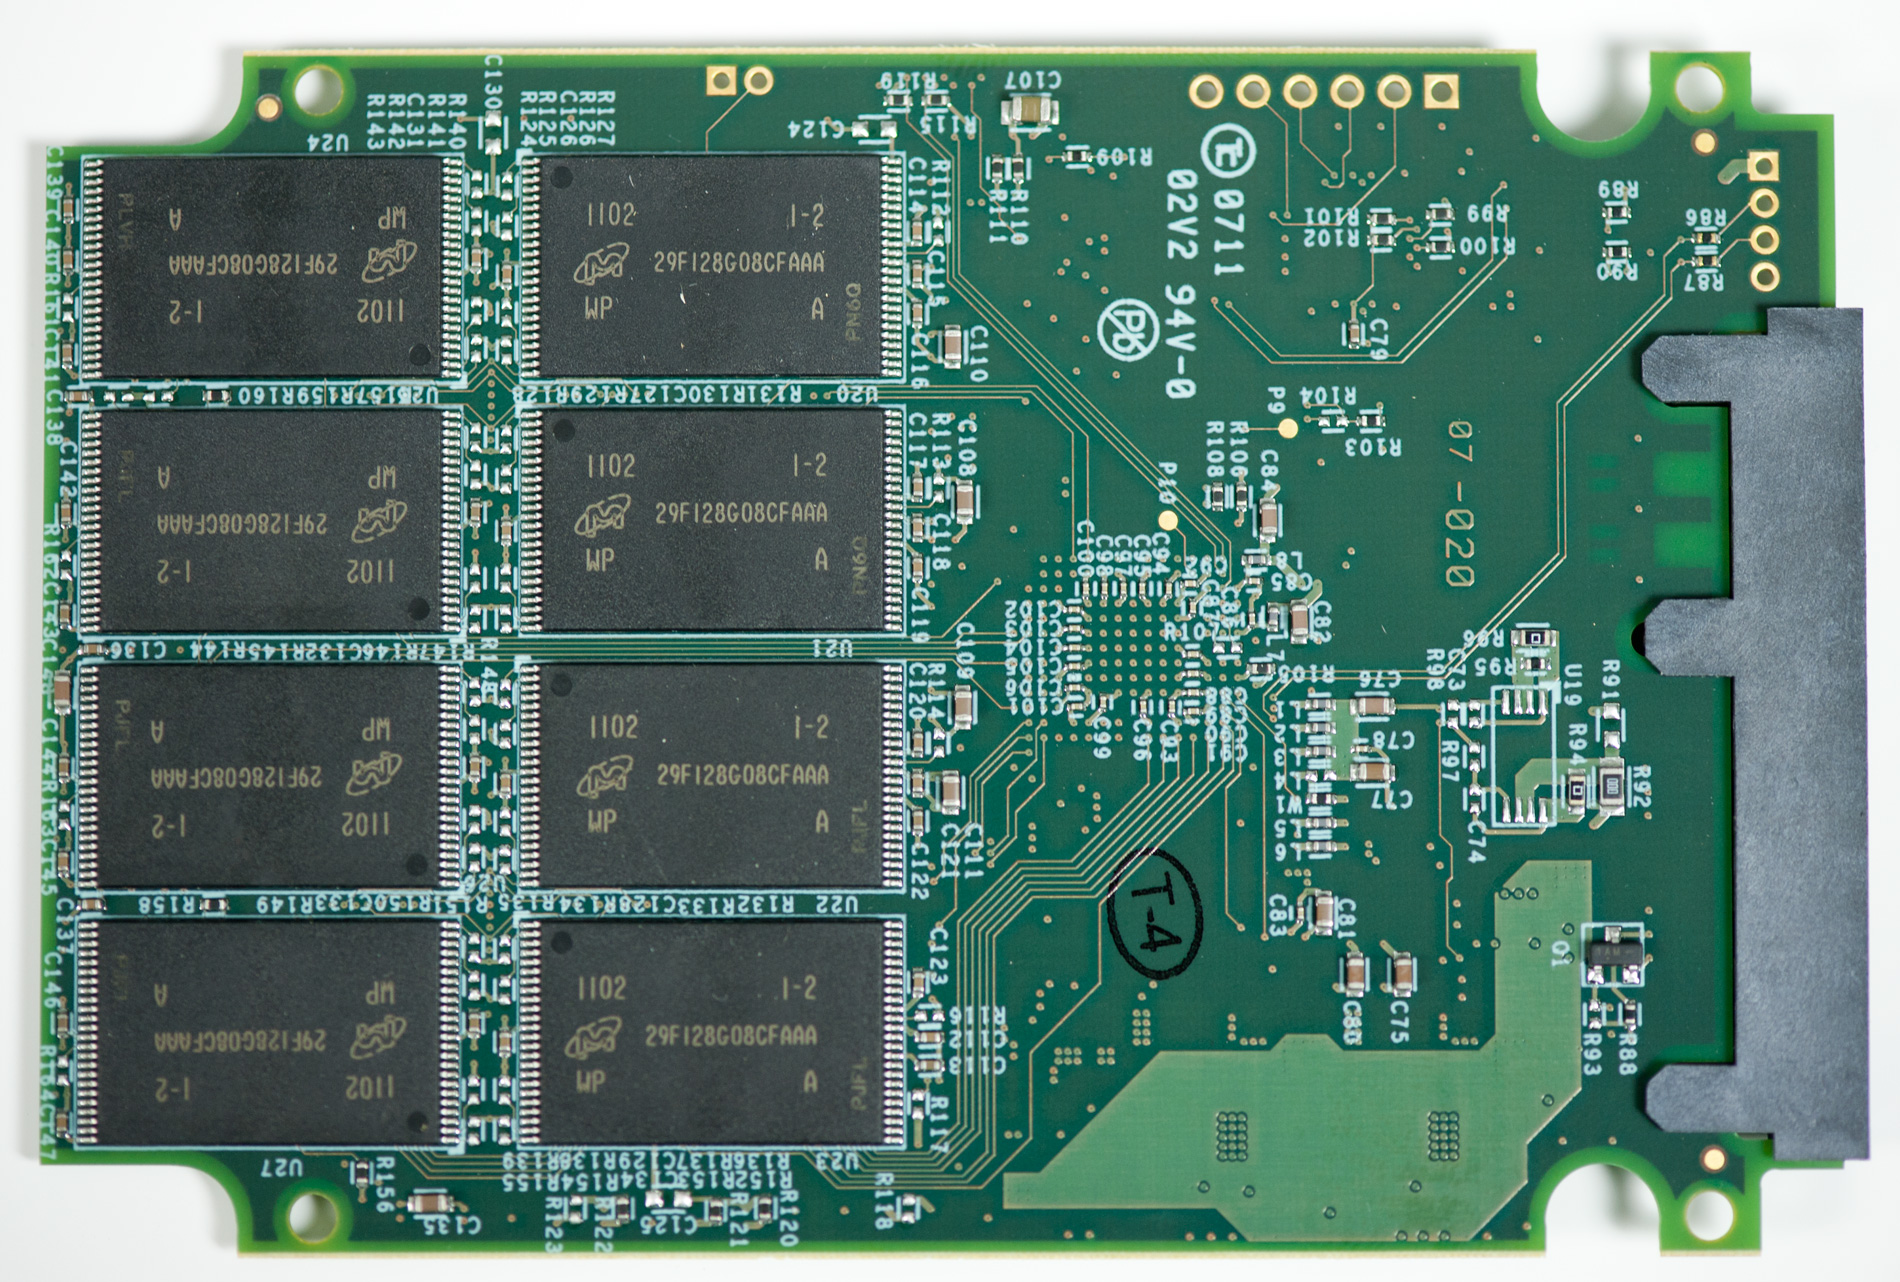
OCZ sent us a 240GB Agility 3 for review. Inside it looks like this:
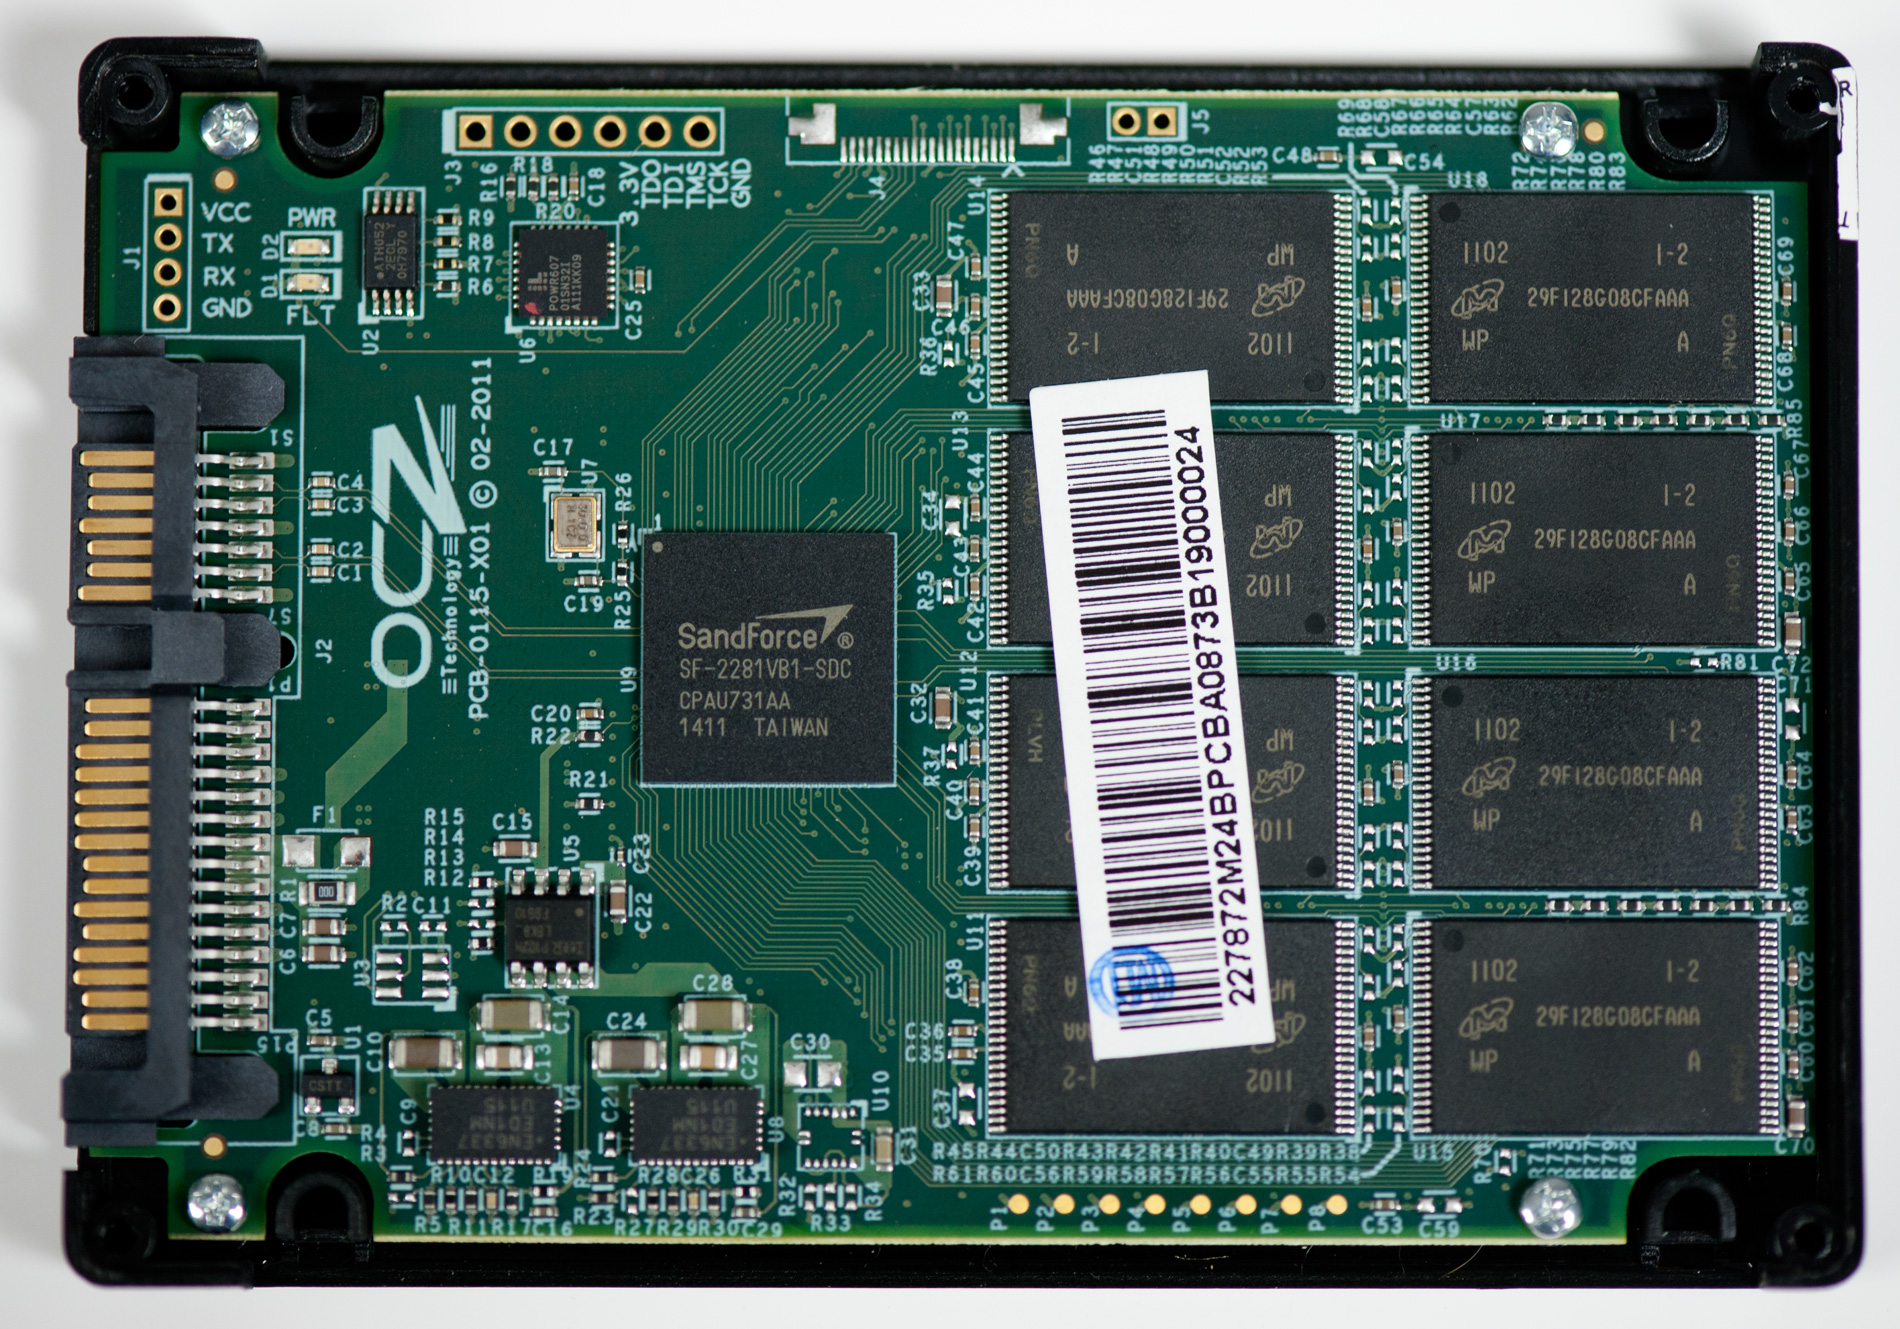
You see the SF-2281 controller in its usual spot and to the right of it are eight 25nm Micron NAND devices. Flip the board over and you get another eight.
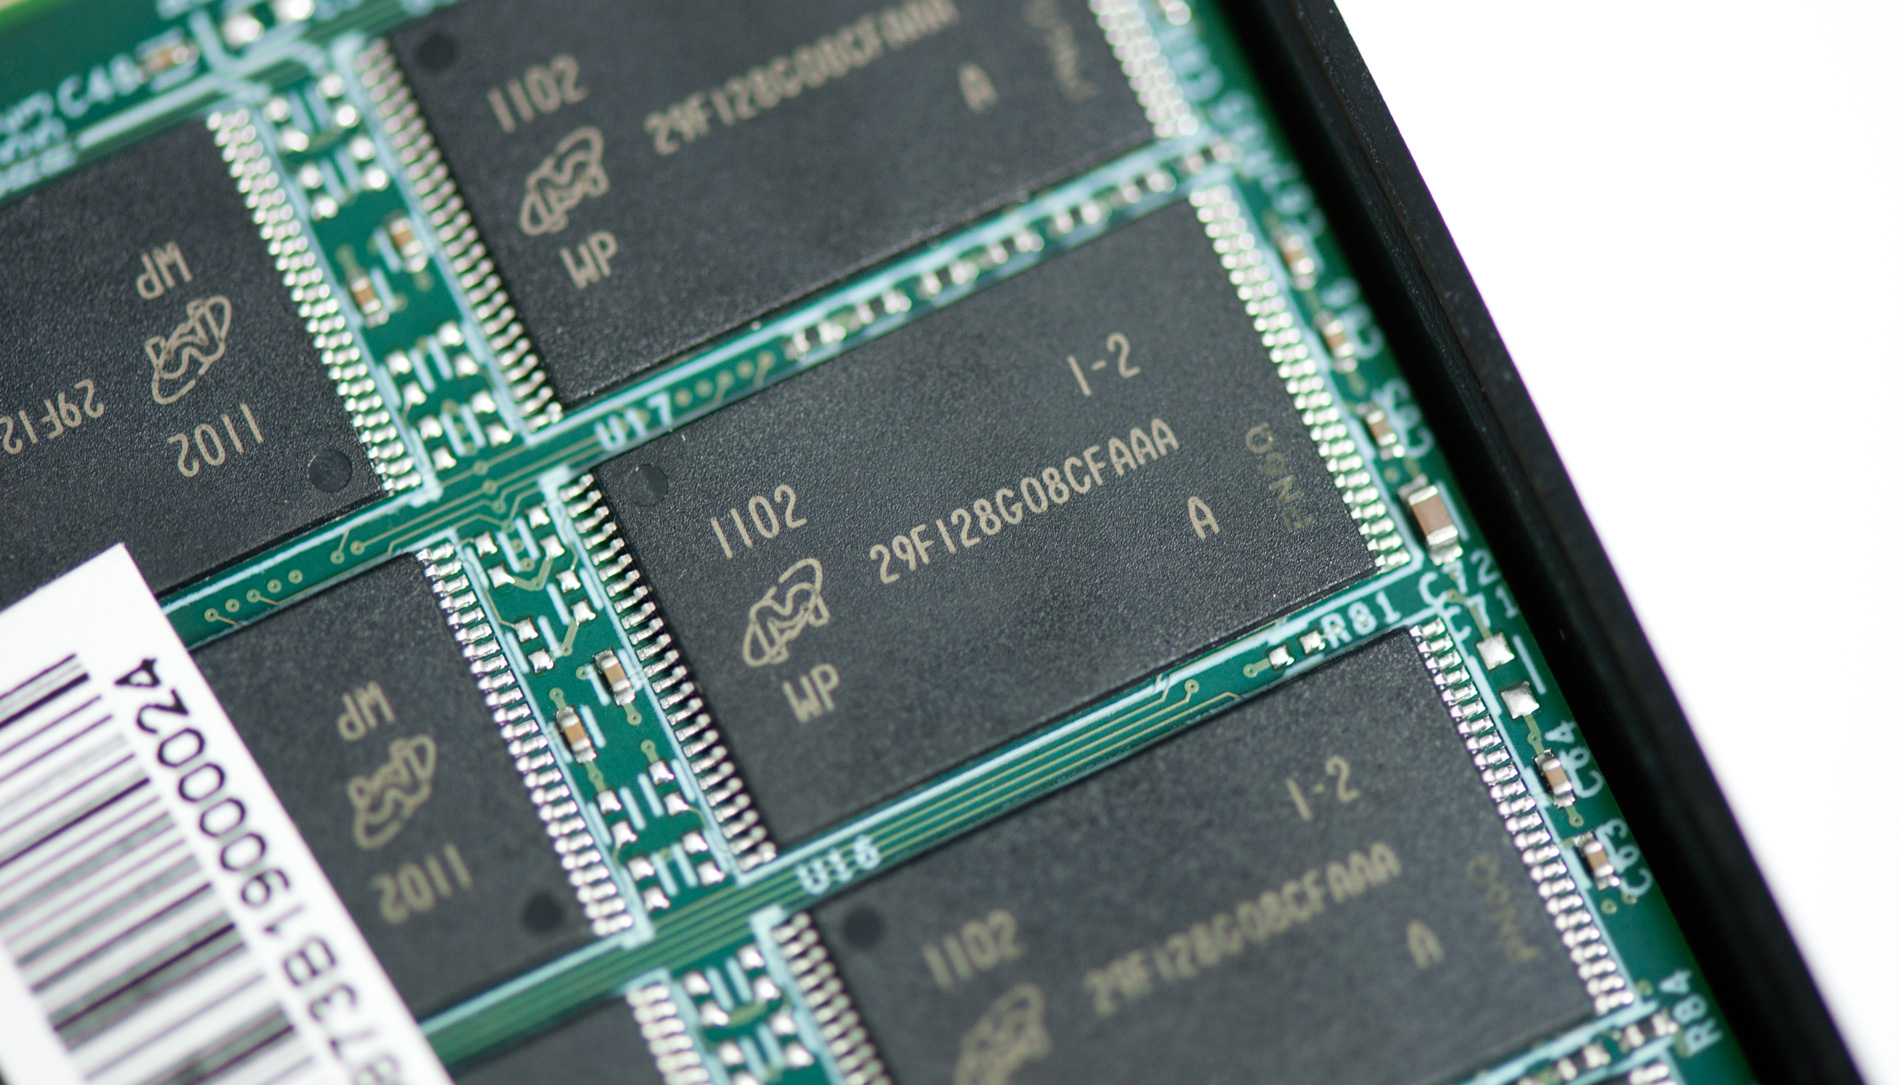
As always, we look at the part number to tell us what's going on. Micron's part numbers are a little different than Intel's but the key things to pay attention to here are the 128G (128Gbit packages, 16GB per package) and characters 11 and 14. Character 11 here is an F, which corresponds to 2 die per package (2 x 8GB 25nm die in each NAND device) while number 14 is an A, indicating that this is asynchronous NAND. To date I've only encountered 25nm synchronous (represented by the letter B) NAND, but as with any other silicon device there's always a cost savings if you can sacrifice performance.
Equipped with asynchronous NAND, the Agility 3's max performance is limited to 50MB/s per channel compared to 200MB/s per channel in the Vertex 3. The Vertex 3 doesn't come close to saturating its per-channel bandwidth so there's a chance that this change won't make much of a difference. To further tilt things in the Agility 3's favor, remember SandForce's controller throws away around 40% of all of your data thanks to its real time compression/deduplication algorithms - further reducing the NAND bandwidth requirements. When a Vertex 3 pushes 500MB/s that's not actual speed to NAND, it's just how fast the SF controller is completing its tasks. In a typical desktop user workload without too much in the way of incompressible data access, the Agility 3 should perform a lot like a Vertex 3.
Cost Savings and a 60GB Drive
I mentioned the only benefit to asynchronous NAND being a cost savings, if we go by OCZ's MSRPs the savings don't look too great at 120GB: here the Agility 3 is $229.99 vs. $249.99 according to OCZ. Street pricing tells a different (more expensive) story for the Vertex 3. The 120GB drive is more like $299.99, which would mean the Agility 3 (if its MSRP is accurate) would be a full $70 cheaper. Move to 240GB and the gap likely widens.
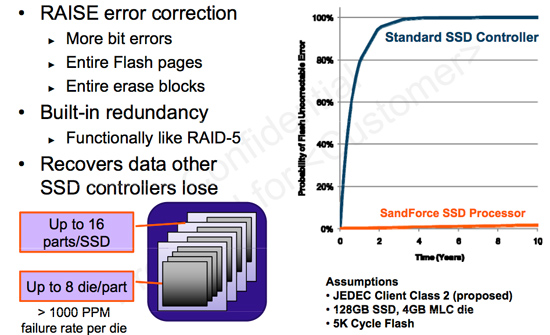
With the Agility 3, OCZ is also introducing a 60GB model. SandForce's NAND redundancy technology called RAISE, requires an entire NAND die be sacrificed and added to the spare area pool in the event of a NAND failure. At 25nm a single die is 8GB, which would mean a 64GB drive would lose 1/8 of its capacity just due to RAISE. Get rid of another 6.3% of the drive for the standard spare area and you're looking at a pretty high cost per usable gigabyte.
One feature of the SF-2200 firmware however is the ability to disable RAISE. I've never advocated it simply because I like the idea of being able to recover from a failed NAND die in the array, but at the 60GB capacity OCZ felt it was better left turned off (otherwise the drive would have to be sold as a 56GB drive instead).
Entire NAND die failures are pretty rare but it's still possible that one could happen. The 60GB Agility 3, as a result, makes a potential reliability tradeoff for capacity. Personally I'd like to see OCZ offer the option to enable RAISE, although I'm not sure if any user accessible utilities exist that would allow you to do that easily.
The Test
| CPU |
Intel Core i7 965 running at 3.2GHz (Turbo & EIST Disabled) Intel Core i7 2600K running at 3.4GHz (Turbo & EIST Disabled) - for AT SB 2011, AS SSD & ATTO |
| Motherboard: |
Intel DX58SO (Intel X58) Intel H67 Motherboard |
| Chipset: |
Intel X58 + Marvell SATA 6Gbps PCIe Intel H67 |
| Chipset Drivers: |
Intel 9.1.1.1015 + Intel IMSM 8.9 Intel 9.1.1.1015 + Intel RST 10.2 |
| Memory: | Qimonda DDR3-1333 4 x 1GB (7-7-7-20) |
| Video Card: | eVGA GeForce GTX 285 |
| Video Drivers: | NVIDIA ForceWare 190.38 64-bit |
| Desktop Resolution: | 1920 x 1200 |
| OS: | Windows 7 x64 |
Random Read/Write Speed
The four corners of SSD performance are as follows: random read, random write, sequential read and sequential write speed. Random accesses are generally small in size, while sequential accesses tend to be larger and thus we have the four Iometer tests we use in all of our reviews.
Our first test writes 4KB in a completely random pattern over an 8GB space of the drive to simulate the sort of random access that you'd see on an OS drive (even this is more stressful than a normal desktop user would see). I perform three concurrent IOs and run the test for 3 minutes. The results reported are in average MB/s over the entire time. We use both standard pseudo randomly generated data for each write as well as fully random data to show you both the maximum and minimum performance offered by SandForce based drives in these tests. The average performance of SF drives will likely be somewhere in between the two values for each drive you see in the graphs. For an understanding of why this matters, read our original SandForce article.
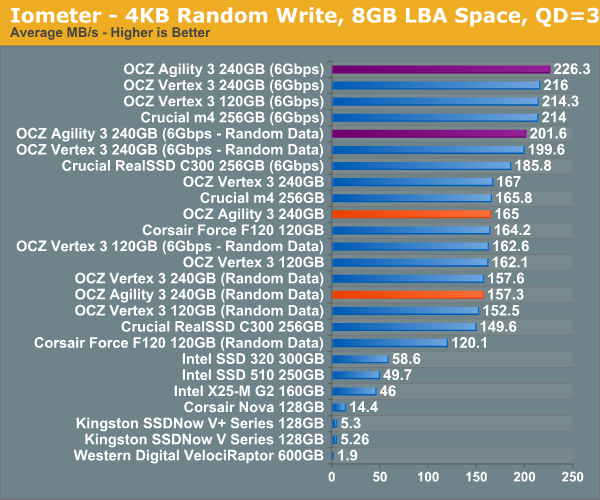
Random write performance looks extremely good on the Agility 3, even with incompressible data (at least at low queue depths). Like the original Agility, it's impossible to tell the performance difference between it and the Vertex 3 here.
Many of you have asked for random write performance at higher queue depths. What I have below is our 4KB random write test performed at a queue depth of 32 instead of 3. While the vast majority of desktop usage models experience queue depths of 0 - 5, higher depths are possible in heavy I/O (and multi-user) workloads:
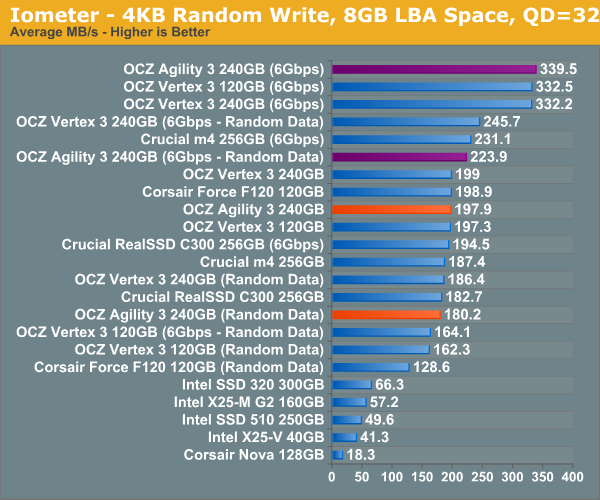
Even as we ramp up queue depth in Iometer, the Agility 3 sticks to the performance of the Vertex 3. It's only with incompressible data that we see the first hint of a performance deficit, but even that isn't much.
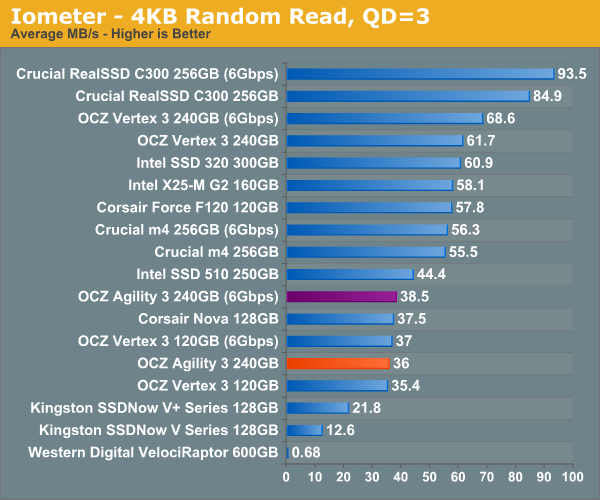
Random read performance is unfortunately limited to 120GB Vertex 3 levels. It's unclear to me whether this is an asynchronous NAND issue or an artificial firmware cap.
Sequential Read/Write Speed
To measure sequential performance I ran a 1 minute long 128KB sequential test over the entire span of the drive at a queue depth of 1. The results reported are in average MB/s over the entire test length.
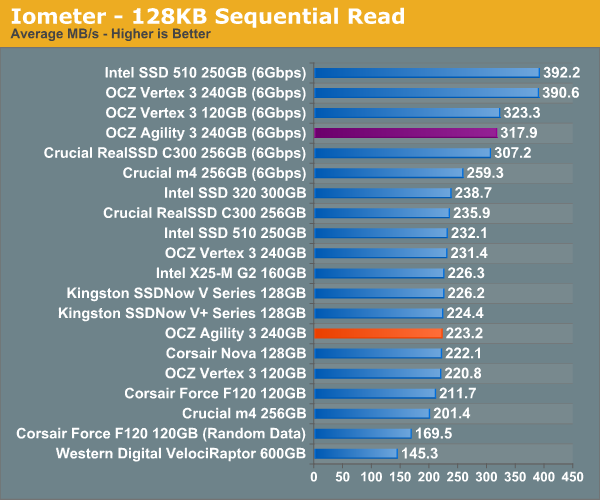
Sequential read performance is lower than the Vertex 3. The 240GB Agility 3 performs more like a 120GB Vertex 2 than its 240GB sibling.
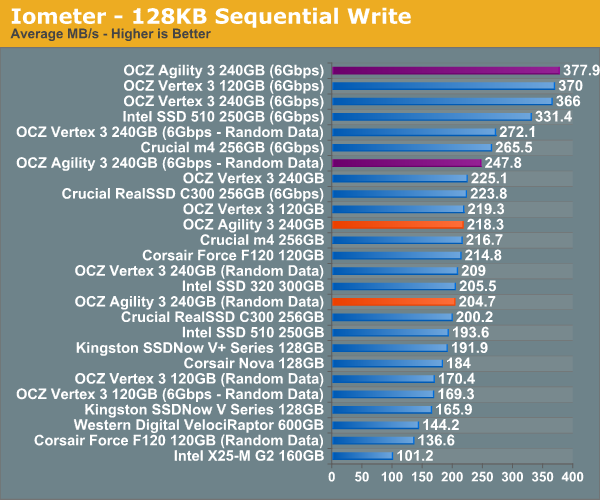
Sequential write speed is competitive but generally not better than the Vertex 3.
AnandTech Storage Bench 2011
I didn't expect to have to debut this so soon, but I've been working on updated benchmarks for 2011. Last year we introduced our AnandTech Storage Bench, a suite of benchmarks that took traces of real OS/application usage and played them back in a repeatable manner. I assembled the traces myself out of frustration with the majority of what we have today in terms of SSD benchmarks.
Although the AnandTech Storage Bench tests did a good job of characterizing SSD performance, they weren't stressful enough. All of the tests performed less than 10GB of reads/writes and typically involved only 4GB of writes specifically. That's not even enough exceed the spare area on most SSDs. Most canned SSD benchmarks don't even come close to writing a single gigabyte of data, but that doesn't mean that simply writing 4GB is acceptable.
Originally I kept the benchmarks short enough that they wouldn't be a burden to run (~30 minutes) but long enough that they were representative of what a power user might do with their system.
Not too long ago I tweeted that I had created what I referred to as the Mother of All SSD Benchmarks (MOASB). Rather than only writing 4GB of data to the drive, this benchmark writes 106.32GB. It's the load you'd put on a drive after nearly two weeks of constant usage. And it takes a *long* time to run.
I'll be sharing the full details of the benchmark in some upcoming SSD articles but here are some details:
1) The MOASB, officially called AnandTech Storage Bench 2011 - Heavy Workload, mainly focuses on the times when your I/O activity is the highest. There is a lot of downloading and application installing that happens during the course of this test. My thinking was that it's during application installs, file copies, downloading and multitasking with all of this that you can really notice performance differences between drives.
2) I tried to cover as many bases as possible with the software I incorporated into this test. There's a lot of photo editing in Photoshop, HTML editing in Dreamweaver, web browsing, game playing/level loading (Starcraft II & WoW are both a part of the test) as well as general use stuff (application installing, virus scanning). I included a large amount of email downloading, document creation and editing as well. To top it all off I even use Visual Studio 2008 to build Chromium during the test.
Update: As promised, some more details about our Heavy Workload for 2011.
The test has 2,168,893 read operations and 1,783,447 write operations. The IO breakdown is as follows:
| AnandTech Storage Bench 2011 - Heavy Workload IO Breakdown | ||||
| IO Size | % of Total | |||
| 4KB | 28% | |||
| 16KB | 10% | |||
| 32KB | 10% | |||
| 64KB | 4% | |||
Only 42% of all operations are sequential, the rest range from pseudo to fully random (with most falling in the pseudo-random category). Average queue depth is 4.625 IOs, with 59% of operations taking place in an IO queue of 1.
Many of you have asked for a better way to really characterize performance. Simply looking at IOPS doesn't really say much. As a result I'm going to be presenting Storage Bench 2011 data in a slightly different way. We'll have performance represented as Average MB/s, with higher numbers being better. At the same time I'll be reporting how long the SSD was busy while running this test. These disk busy graphs will show you exactly how much time was shaved off by using a faster drive vs. a slower one during the course of this test. Finally, I will also break out performance into reads, writes and combined. The reason I do this is to help balance out the fact that this test is unusually write intensive, which can often hide the benefits of a drive with good read performance.
There's also a new light workload for 2011. This is a far more reasonable, typical every day use case benchmark. Lots of web browsing, photo editing (but with a greater focus on photo consumption), video playback as well as some application installs and gaming. This test isn't nearly as write intensive as the MOASB but it's still multiple times more write intensive than what we were running last year.
As always I don't believe that these two benchmarks alone are enough to characterize the performance of a drive, but hopefully along with the rest of our tests they will help provide a better idea.
The testbed for Storage Bench 2011 has changed as well. We're now using a Sandy Bridge platform with full 6Gbps support for these tests. All of the older tests are still run on our X58 platform.
AnandTech Storage Bench 2011 - Heavy Workload
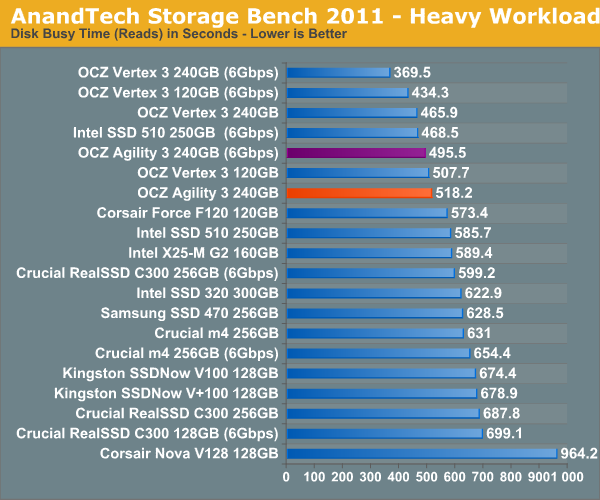
We'll start out by looking at average data rate throughout our new heavy workload test:
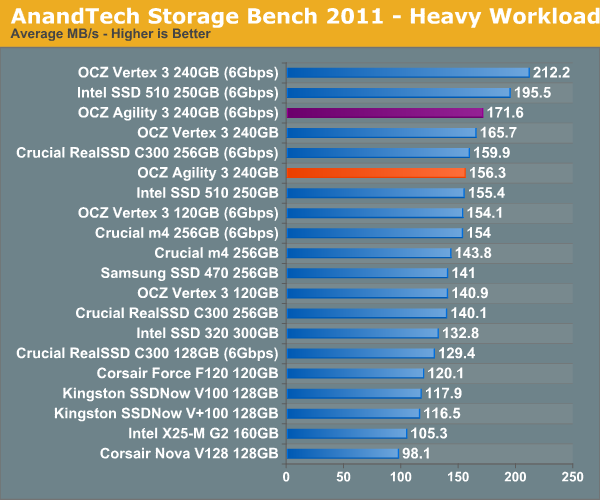
Our heavy workload has quite a bit of compressed reads/writes, which are where the Agility 3 is going to struggle the most. The 240GB Agility 3 performs more like an Intel SSD 510 here rather than a Vertex 3. The Agility 3 is still a respectable performer, definitely faster than the old Vertex 2, but it's definitely not as quick as the new Vertex 3.
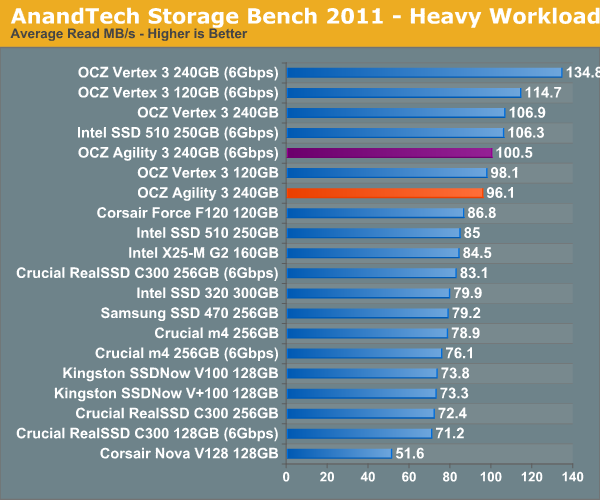
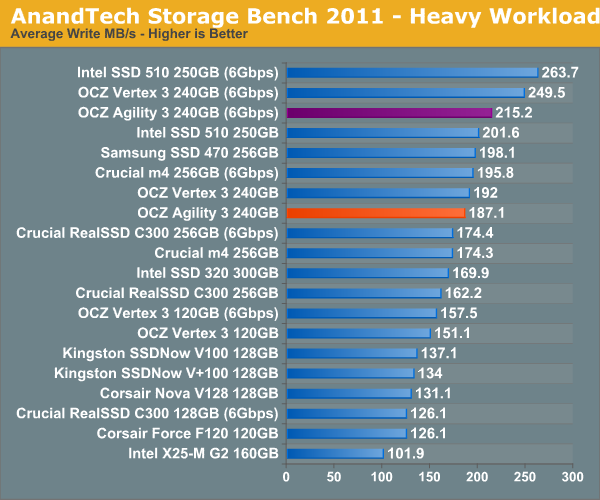
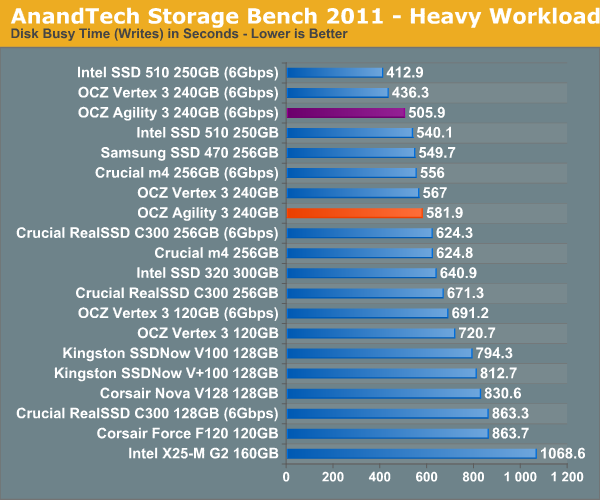
The breakdown of reads vs. writes tells us more of what's going on:
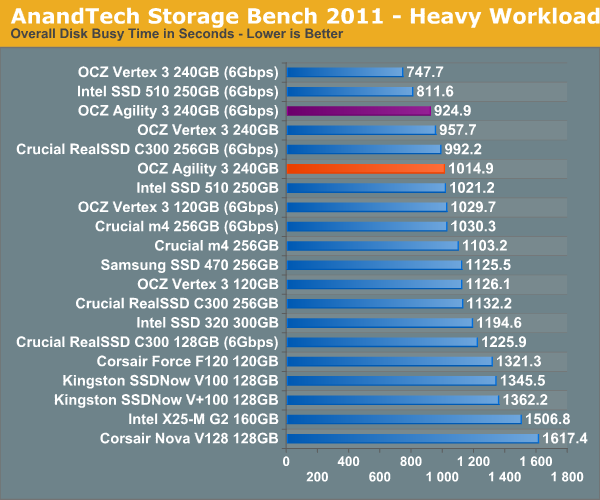
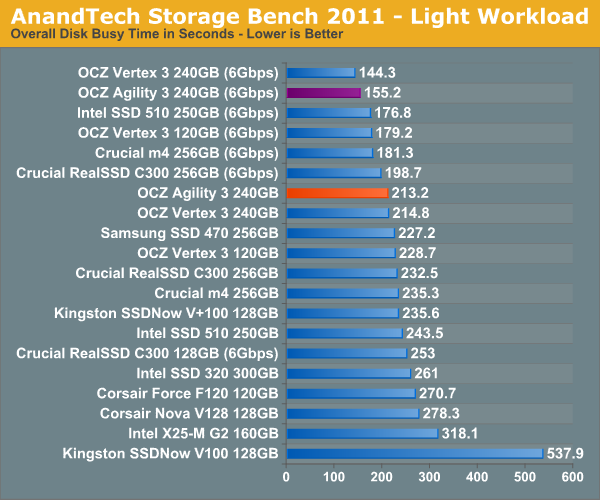
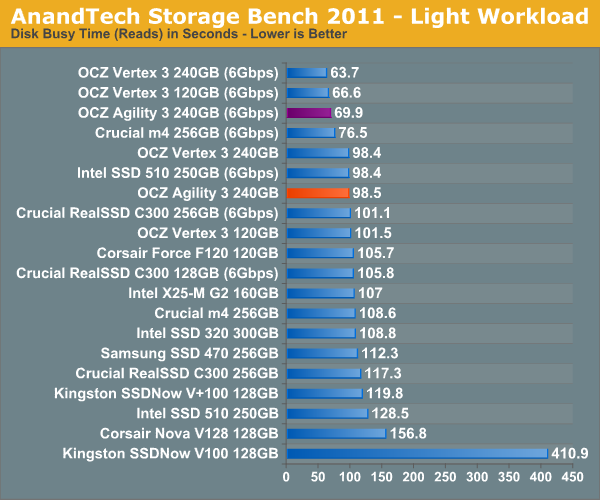
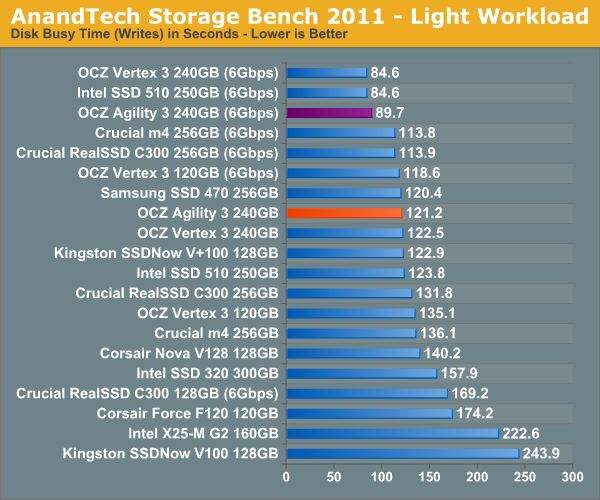
The next three charts just represent the same data, but in a different manner. Instead of looking at average data rate, we're looking at how long the disk was busy for during this entire test. Note that disk busy time excludes any and all idles, this is just how long the SSD was busy doing something:
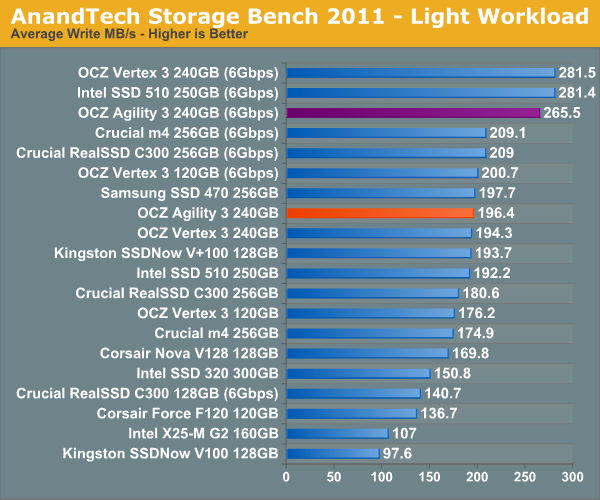
AnandTech Storage Bench 2011 - Light Workload
Our new light workload actually has more write operations than read operations. The split is as follows: 372,630 reads and 459,709 writes. The relatively close read/write ratio does better mimic a typical light workload (although even lighter workloads would be far more read centric).
The I/O breakdown is similar to the heavy workload at small IOs, however you'll notice that there are far fewer large IO transfers:
| AnandTech Storage Bench 2011 - Light Workload IO Breakdown | ||||
| IO Size | % of Total | |||
| 4KB | 27% | |||
| 16KB | 8% | |||
| 32KB | 6% | |||
| 64KB | 5% | |||
Despite the reduction in large IOs, over 60% of all operations are perfectly sequential. Average queue depth is a lighter 2.2029 IOs.
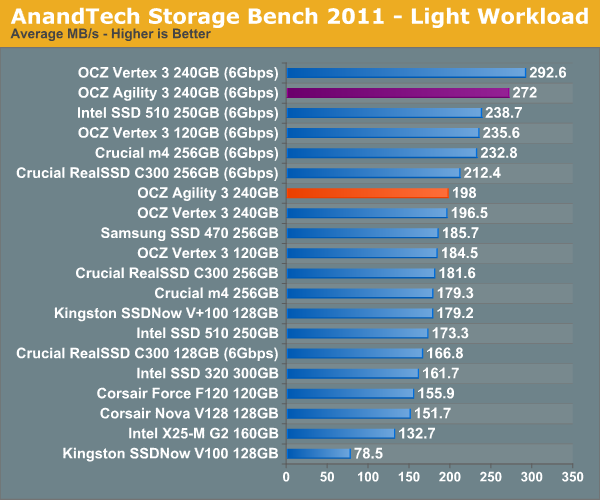
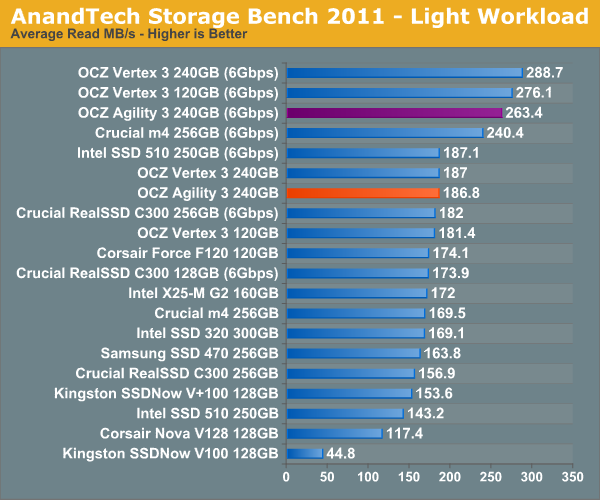
In our light workload the performance gap is a lot closer between the Vertex 3 and Agility 3. For typical desktop usage, the Agility 3 is likely indistinguishable from the Vertex 3.
Performance vs. Transfer Size
All of our Iometer sequential tests happen at a queue depth of 1, which is indicative of a light desktop workload. It isn't too far fetched to see much higher queue depths on the desktop. The performance of these SSDs also greatly varies based on the size of the transfer. For this next test we turn to ATTO and run a sequential write over a 2GB span of LBAs at a queue depth of 4 and varying the size of the transfers.
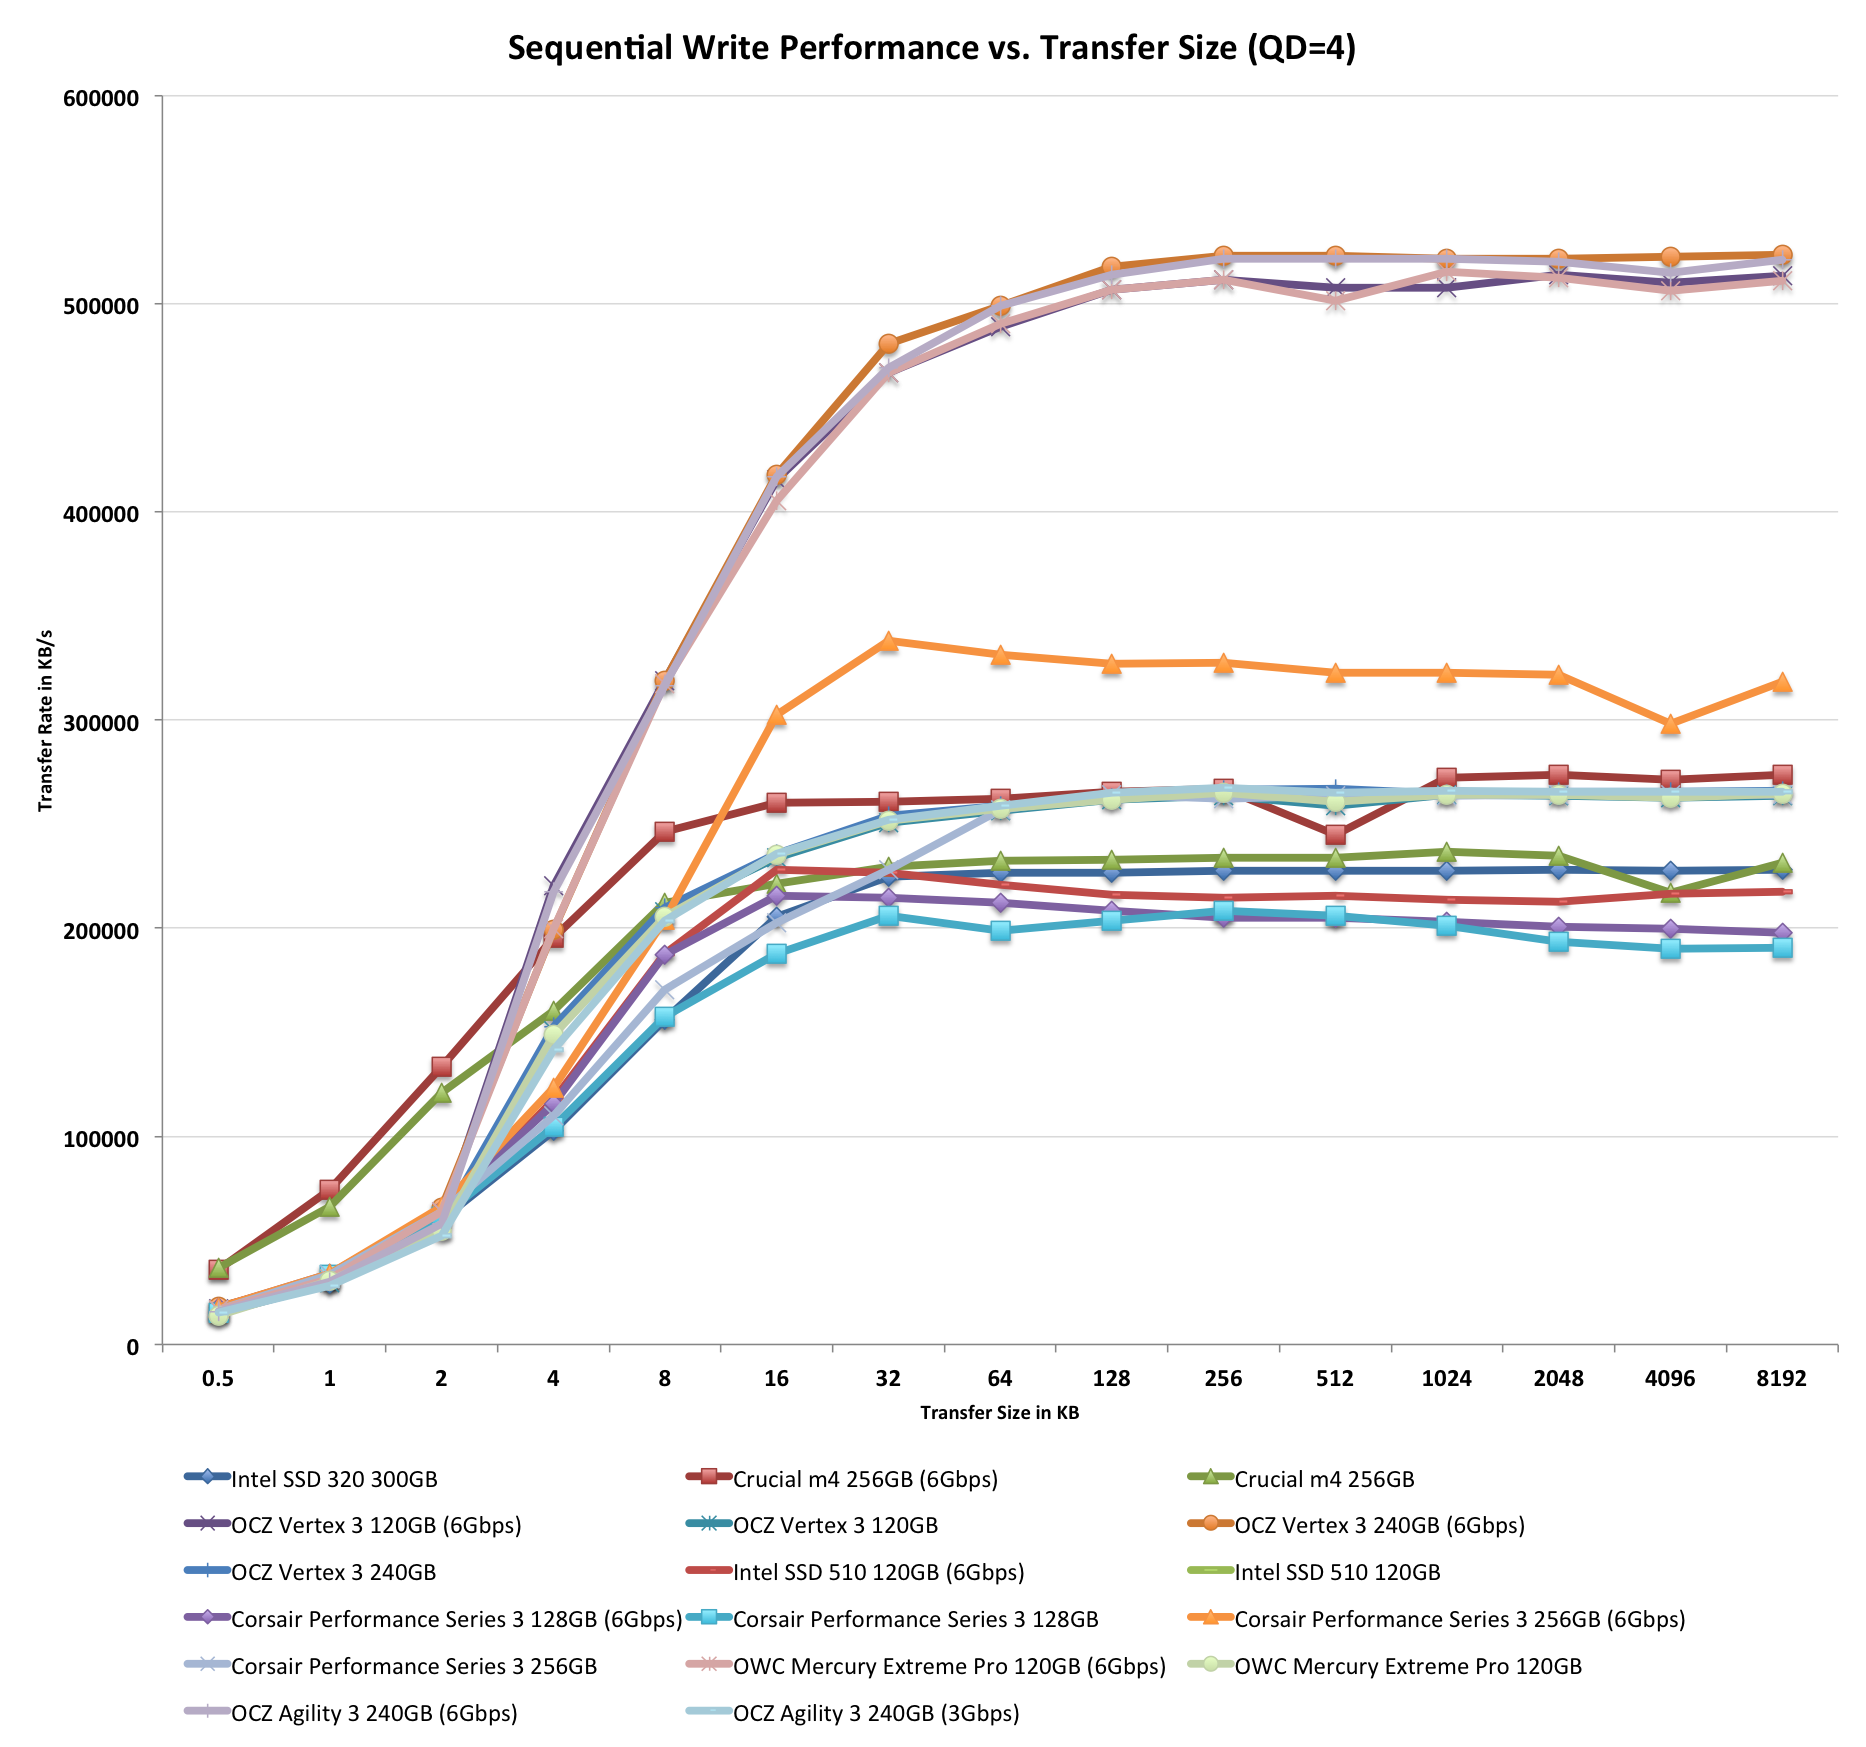
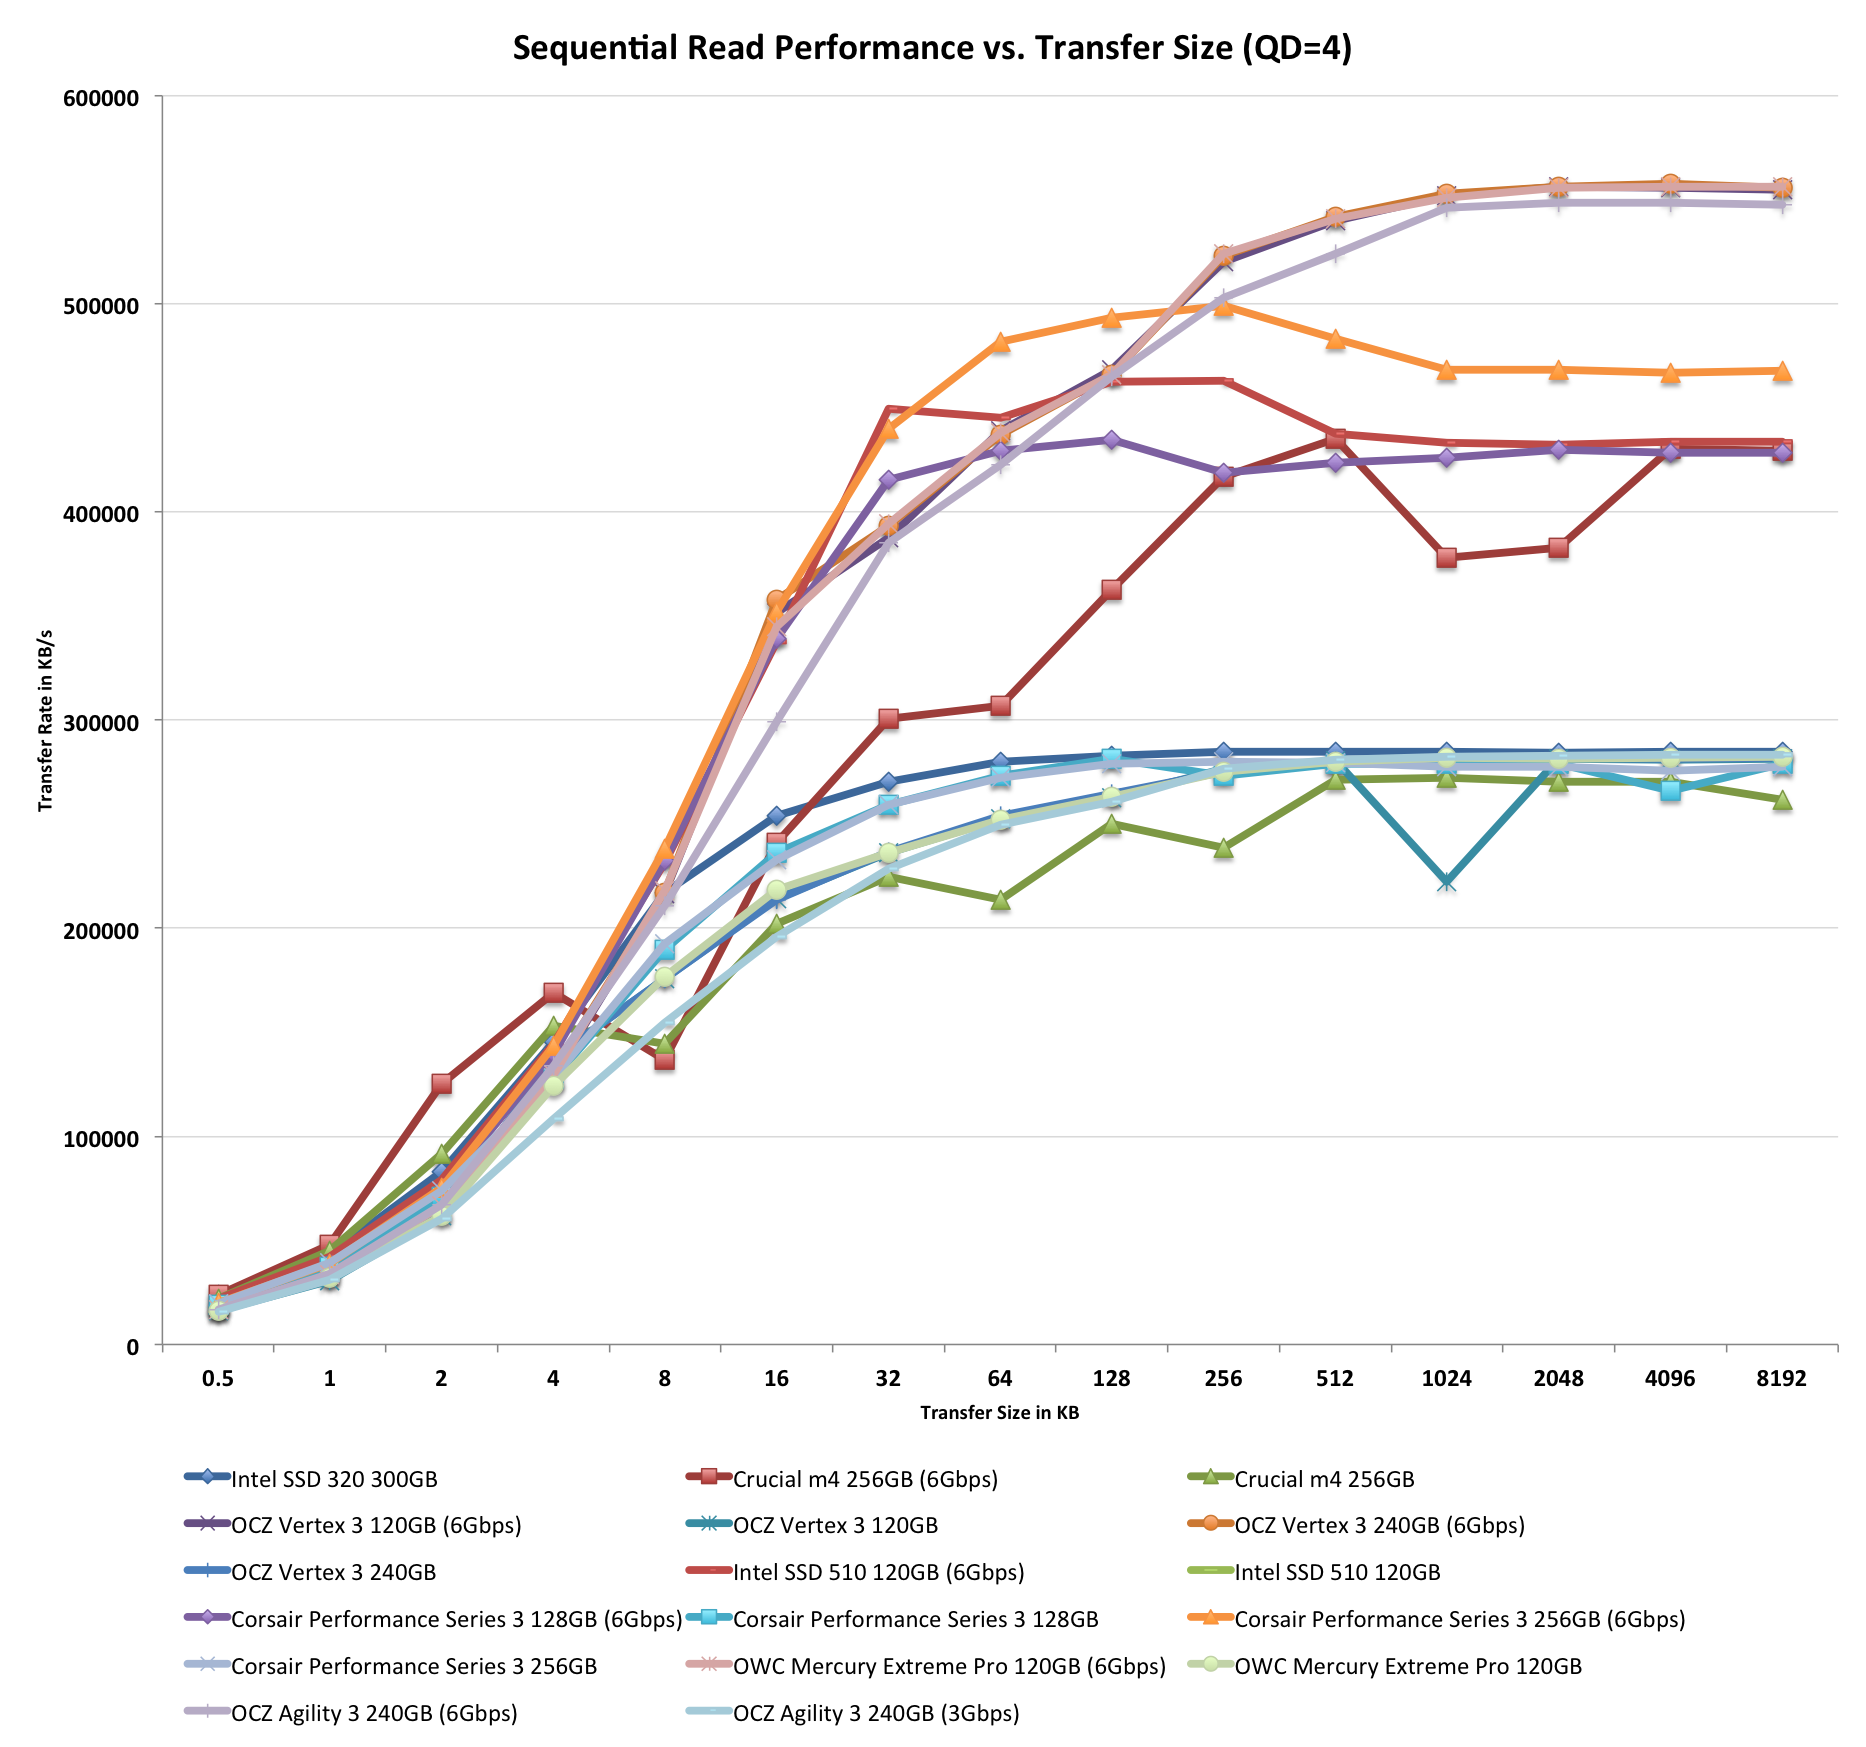
Highly compressible data flies through the Agility 3. With most of the data never touching NAND itself, the asynchronous nature of the Agility 3's array doesn't limit the drive at all - it performs like a Vertex 3.
AS-SSD Incompressible Sequential Performance
The AS-SSD sequential benchmark uses incompressible data for all of its transfers. The result is a pretty big reduction in sequential write speed on SandForce based controllers.
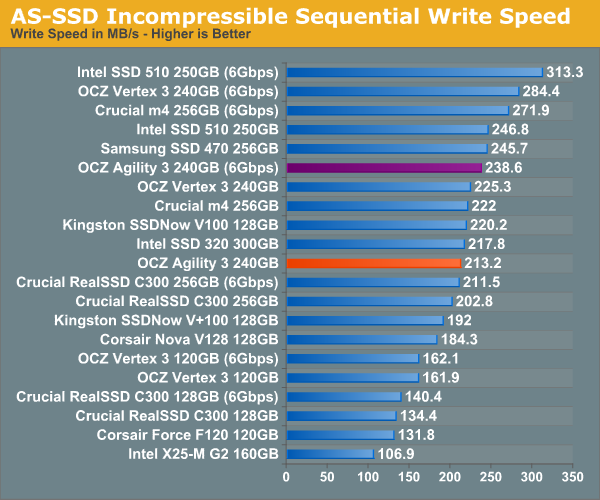
Even Iometer's incompressible data isn't able to completely defeat SandForce's algorithms, but AS-SSD seems to do a better job. Here the Agility 3's performance really suffers, particularly in the sequential read test:
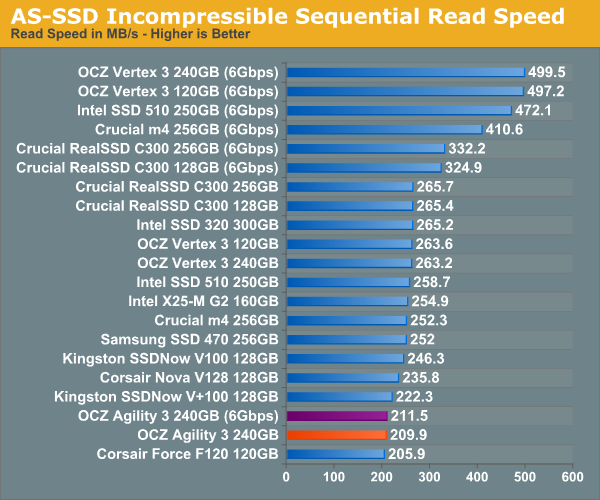
The Agility 3 is about the speed of the old Vertex 2/Corsair Force F120 here.
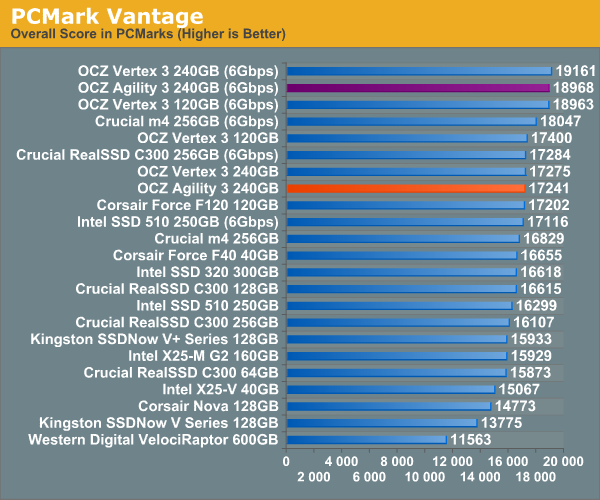
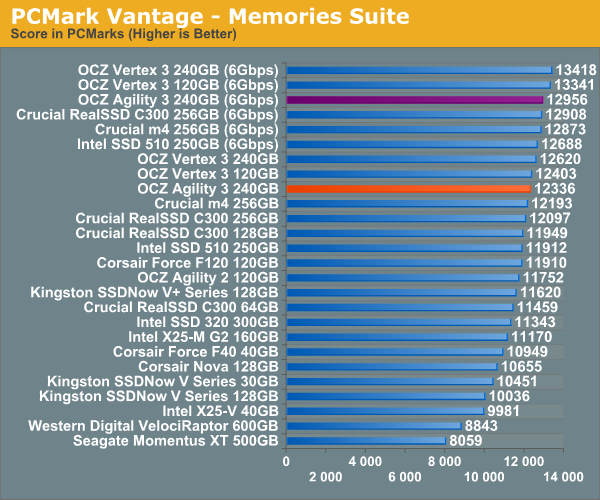
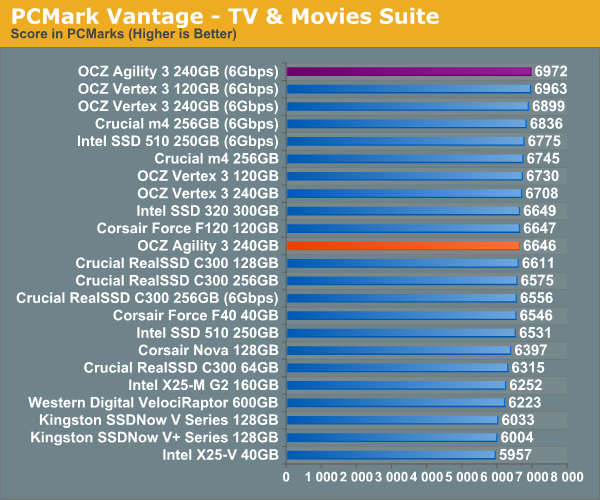
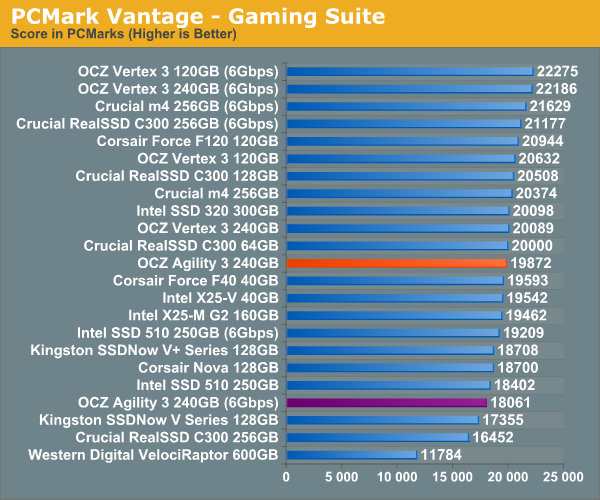
Overall System Performance using PCMark Vantage
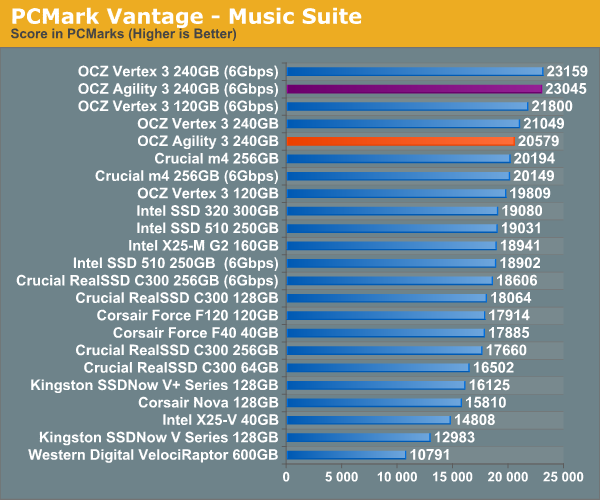
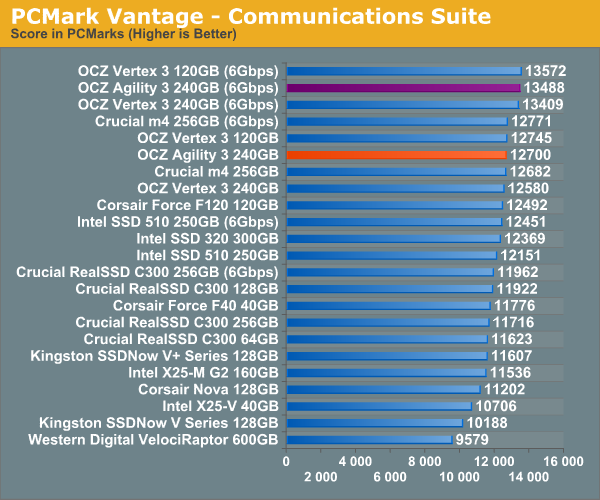
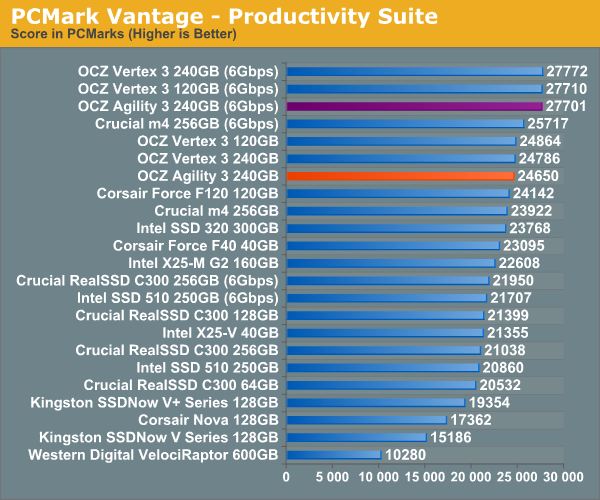
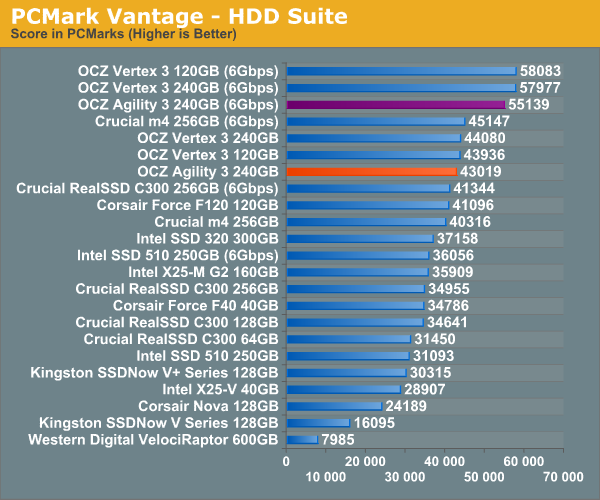
Next up is PCMark Vantage, another system-wide performance suite. For those of you who aren’t familiar with PCMark Vantage, it ends up being the most real-world-like hard drive test I can come up with. It runs things like application launches, file searches, web browsing, contacts searching, video playback, photo editing and other completely mundane but real-world tasks. I’ve described the benchmark in great detail before but if you’d like to read up on what it does in particular, take a look at Futuremark’s whitepaper on the benchmark; it’s not perfect, but it’s good enough to be a member of a comprehensive storage benchmark suite. Any performance impacts here would most likely be reflected in the real world.
AnandTech Storage Bench 2010
To keep things consistent we've also included our older Storage Bench. Note that the old storage test system doesn't have a SATA 6Gbps controller, so we only have one result for the 6Gbps drives.
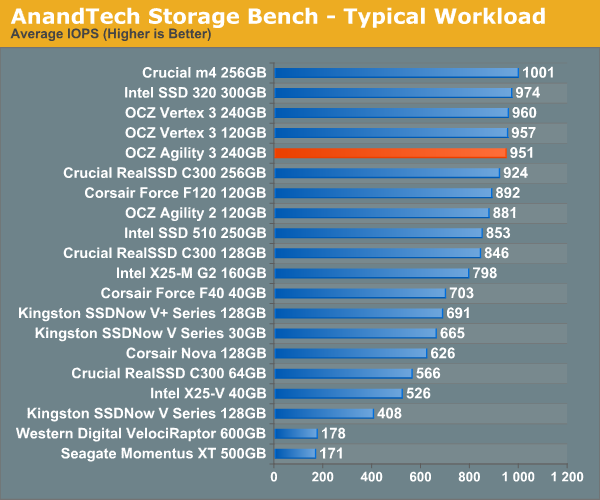
The first in our benchmark suite is a light/typical usage case. The Windows 7 system is loaded with Firefox, Office 2007 and Adobe Reader among other applications. With Firefox we browse web pages like Facebook, AnandTech, Digg and other sites. Outlook is also running and we use it to check emails, create and send a message with a PDF attachment. Adobe Reader is used to view some PDFs. Excel 2007 is used to create a spreadsheet, graphs and save the document. The same goes for Word 2007. We open and step through a presentation in PowerPoint 2007 received as an email attachment before saving it to the desktop. Finally we watch a bit of a Firefly episode in Windows Media Player 11.
There’s some level of multitasking going on here but it’s not unreasonable by any means. Generally the application tasks proceed linearly, with the exception of things like web browsing which may happen in between one of the other tasks.
The recording is played back on all of our drives here today. Remember that we’re isolating disk performance, all we’re doing is playing back every single disk access that happened in that ~5 minute period of usage. The light workload is composed of 37,501 reads and 20,268 writes. Over 30% of the IOs are 4KB, 11% are 16KB, 22% are 32KB and approximately 13% are 64KB in size. Less than 30% of the operations are absolutely sequential in nature. Average queue depth is 6.09 IOs.
The performance results are reported in average I/O Operations per Second (IOPS):
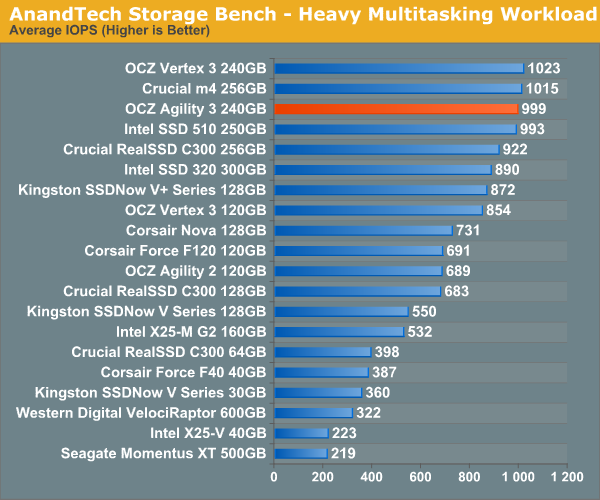
If there’s a light usage case there’s bound to be a heavy one. In this test we have Microsoft Security Essentials running in the background with real time virus scanning enabled. We also perform a quick scan in the middle of the test. Firefox, Outlook, Excel, Word and Powerpoint are all used the same as they were in the light test. We add Photoshop CS4 to the mix, opening a bunch of 12MP images, editing them, then saving them as highly compressed JPGs for web publishing. Windows 7’s picture viewer is used to view a bunch of pictures on the hard drive. We use 7-zip to create and extract .7z archives. Downloading is also prominently featured in our heavy test; we download large files from the Internet during portions of the benchmark, as well as use uTorrent to grab a couple of torrents. Some of the applications in use are installed during the benchmark, Windows updates are also installed. Towards the end of the test we launch World of Warcraft, play for a few minutes, then delete the folder. This test also takes into account all of the disk accesses that happen while the OS is booting.
The benchmark is 22 minutes long and it consists of 128,895 read operations and 72,411 write operations. Roughly 44% of all IOs were sequential. Approximately 30% of all accesses were 4KB in size, 12% were 16KB in size, 14% were 32KB and 20% were 64KB. Average queue depth was 3.59.
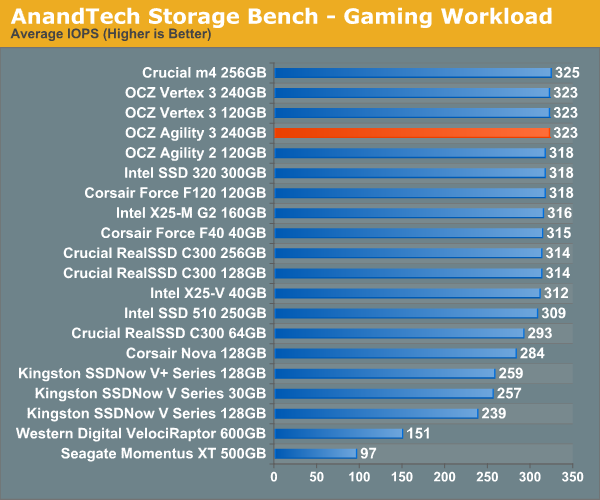
The gaming workload is made up of 75,206 read operations and only 4,592 write operations. Only 20% of the accesses are 4KB in size, nearly 40% are 64KB and 20% are 32KB. A whopping 69% of the IOs are sequential, meaning this is predominantly a sequential read benchmark. The average queue depth is 7.76 IOs.
TRIM Performance
In practice, SandForce based drives running a desktop workload do very well and typically boast an average write amplification below 1 (more writes to the device than actual writes to NAND). My personal SF-1200 drive had a write amplification of around 0.6 after several months of use. However if subjected to a workload composed entirely of incompressible writes (e.g. tons of compressed images, videos and music) you can back the controller into a corner.
To simulate this I filled the drive with incompressible data, ran a 4KB (100% LBA space, QD32) random write test with incompressible data for 20 minutes, and then ran AS-SSD (another incompressible data test) to see how low performance could get:
| OCZ Vertex 3 240GB - Resiliency - AS SSD Sequential Write Speed - 6Gbps | |||||
| Clean | After Torture | After TRIM | |||
| OCZ Agility 3 240GB | 238.6 MB/s | 206.1 MB/s | 213.2 MB/s | ||
| OCZ Vertex 3 240GB | 284.4 MB/s | 278.5 MB/s | 286.3 MB/s | ||
The 240GB Agility 3 behaves similarly to the Vertex 3, although it does lose more ground after our little torture session. There's a sharp drop after about 60 minutes of random writes on these 240GB drives, so performance can definitely go lower if you torture for longer - most users should be just fine though.
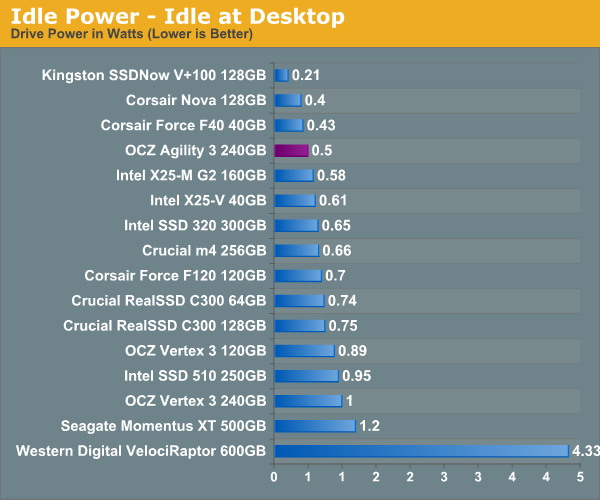
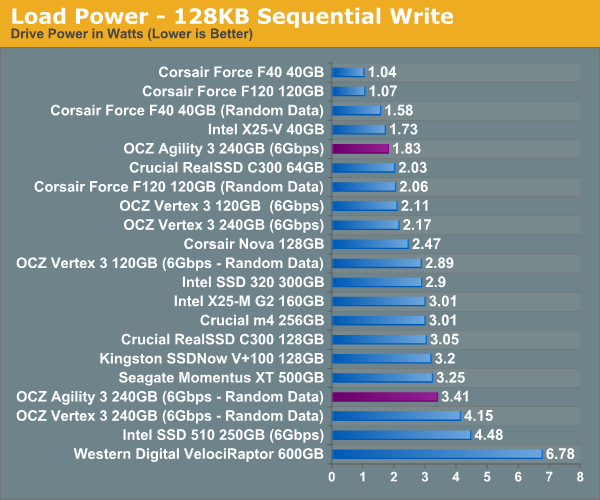
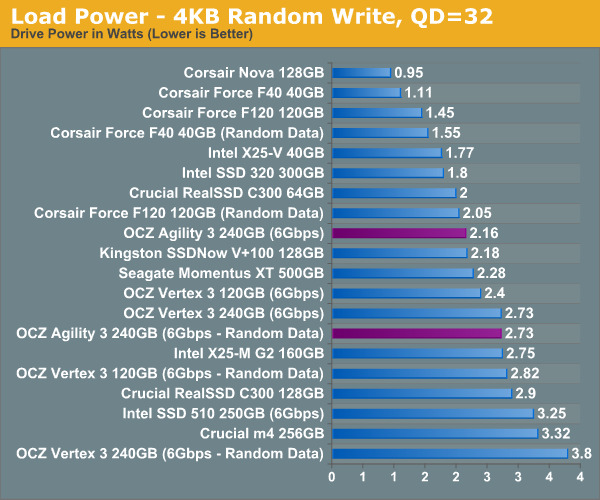
Power Consumption
One benefit of the asynchronous NAND is much lower power consumption. The Agility 3 posted the lowest idle power draw of any modern drive we've tested and load power is better than any other SF-2200 drive.
Final Words
OCZ's Agility 3 is a mixed bag of performance. For typical desktop workloads and light usage, the Agility 3 looks a lot like a Vertex 3. It's only when you start mixing in data that's not easily compressed/deduped that the Agility misbehaves. As a general boot/application drive I'm pretty confident in the Agility 3's abilities, however those of you who work with (more than just play back) a lot of photos, video, music and file archives will want to spend the extra on the Vertex 3.
The Agility 3's viability in the market really boils down to its street pricing. The Vertex 3 is selling for considerably more than its original MSRP, assuming the Agility 3 does the same then I'm not sure I see a ton of value in the drive. However if the Agility 3 can keep to its MSRP, it may be a good alternative for those users interested in the Vertex 3 but put off by its price premium vs. the Vertex 2. Theoretically the Agility line should be able to hit Vertex 2 pricing (assuming the SF-2200 isn't much more expensive than the SF-1200) given that both drives use asynchronous NAND.
Drives just started shipping so unfortunately it's too early to tell how the Agility 3 will price in the market. If history is any indication the Agility 3 and Vertex 3 will be moving targets with the best buy depending on NAND pricing at any given point. Hopefully you understand the performance tradeoffs enough to know when to pull the trigger on the Agility 3 and when the Vertex 3 is a better deal. In short, if the prices are close go Vertex 3, otherwise the Agility 3 should be fine for most light/typical desktop usage.
I have to add that choosing a SF-2200 drive isn't particularly easy. Different configurations result in different performance levels even down to the number of chip enables per NAND device (not just the number of die). Now adding asynchronous NAND back into the mix definitely makes this harder.


