Original Link: https://www.anandtech.com/show/2847
ATI HD 5870 Scaling Performance: X58 vs P55 Showdown
by Gary Key on September 29, 2009 12:00 PM EST- Posted in
- Motherboards
We will start off our P55 coverage this week by answering a question that has been raised numerous times as of late, “Exactly how will the new DX11 cards perform on the Lynnfield/P55 platform compared to the Bloomfield/X58?”. The answer to that question depends on the game engine, settings, and processor choice for the most part. There has been much speculation that the Lynnfield/P55 platform would fail miserably with the next generation cards. That said, the difference in platform performance between the first DX11 capable cards available (ATI HD 5870/5850) is about the same as previous generation cards we tested in the Lynnfield launch article.
This means for single card performance both platforms trade blows for supremacy. However, for those running CF/SLI setups, the X58 continues to be the platform of choice for users wanting the best possible benchmark results. Does that mean the integrated dual x8 PCIe 2.0 logic on Lynnfield is a poor choice compared to the dual x16 PCIe 2.0 sporting X58? Absolutely not based on our initial tests. In fact, it should satisfy most users.
Now for those making an investment into an ultra high-end HD 5870 CrossFireX setup, the Core i7/X58 configuration will simply offer the best possible performance. Of course that performance comes at a cost, particularly power consumption. However, we have a feeling most owners sporting two HD 5870s are not that concerned about Al Gore knocking on their door in the middle of the night.
In the meantime, we have our first performance results comparing the Core i7/860 and P55 against the like priced Core i7/920 and X58 in a variety of games. We are going to state this upfront, this is not a GPU review of the HD 5870. Instead, we decided to pull this information out of the upcoming high-end P55 roundup so it did not get lost in the mix. Our resolution is limited to 1920x1080 that we use in the motherboard test suite. As such, the numbers speak for themselves. So let’s get right to the results today, but first, the test setup.
Test Setup-
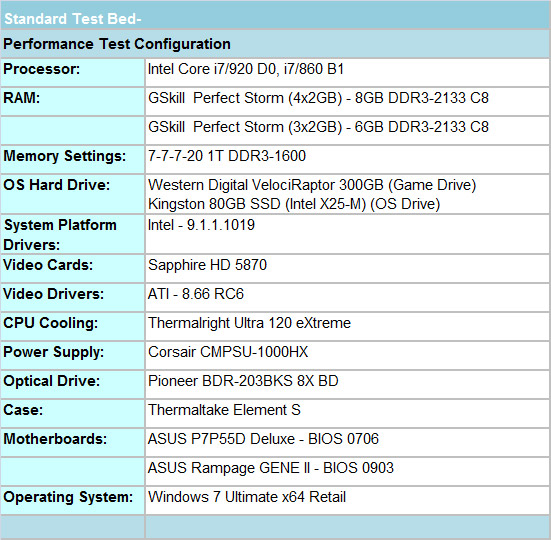
For our test results we setup each board as closely as possible in regards to memory timings and sub-timings. The P55 motherboard utilized 8GB of DDR3, while the X58 platform contained 6GB. The P55 and X58 DDR3 timings were set to 7-7-7-20 1T at DDR3-1600 for the i7/920 and i7/860 processors at both stock and overclocked CPU settings. All power management features were enabled on each board and voltages were set at the lowest possible values when overclocking while still retaining 24/7 stability.
The image gallery below contains our Everest memory results with each processor overclocked at similar memory settings along with voltage/uncore/subtiming options. The 860/P55 offers slightly better throughput and overall latency numbers than the 920/X58 when overclocked. At stock, the latency numbers favor Lynnfield with assistance from the turbo mode.


Our game selection today is varied but is missing a couple of titles we wanted to show. We pulled Crysis Warhead as the CrossFireX scaling numbers were under 8% and Need For Speed: Shift does not have a CrossFire profile yet. AMD is currently working on updated CF profiles for the latest games. We also had some corruption problems when running Empire:Total War and Anno 1404 that is under investigation.
All of our gaming performance results are reported in average frame rates per second in the main bar graph with minimum frame rates reported in the text section. The results are sorted by the average frame rates. We are also reporting single card results with the HD 5870 running at PCIe 2.0 x8 speeds on the P55 platform to compare performance to the x16 single card setup. We installed an Intel CT Gigabit network card in the second physical x16 slot in order to force x8 operation.
FarCry 2
We utilize the Ranch Small demo file along with the Playback Action demo to see the differences between GPU and CPU centric benchmarks. The Ranch demo is GPU centric while the Playback demo tends to be CPU centric. We run each benchmark five times and report the median score.
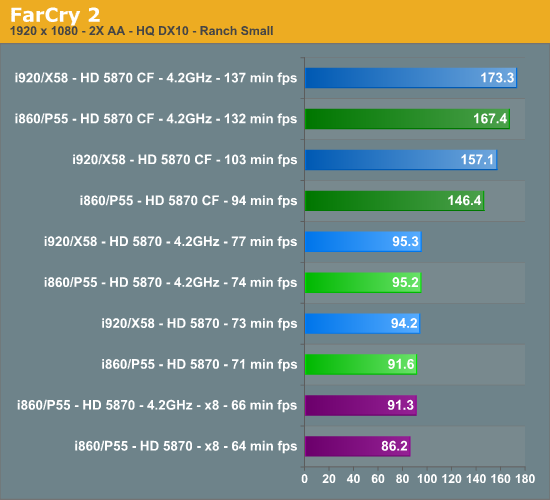
First off, FarCry 2 has always performed extremely well on the X58 chipset compared to other chipsets with the ATI video cards. This game responds very well to PCIe bandwidth, something the X58 has in droves. The stock HD 5870 single card x8 configuration is 6% slower in average frame rates and 10% slower in minimum frame rates in this particular benchmark. Even the 4.2GHz single card result is slower than either the stock P55 or X58 setups.
The stock single card HD 5870 P55 platform is 3% slower than the X58 even with a 100MHz processor advantage in turbo mode. At 4.2GHz, both platforms are about even although minimum frame rates are about 4% better on X58. However, even with this benchmark advantage, there was no difference in actual game play, especially considering minimum frame rates are above 70fps in each instance.
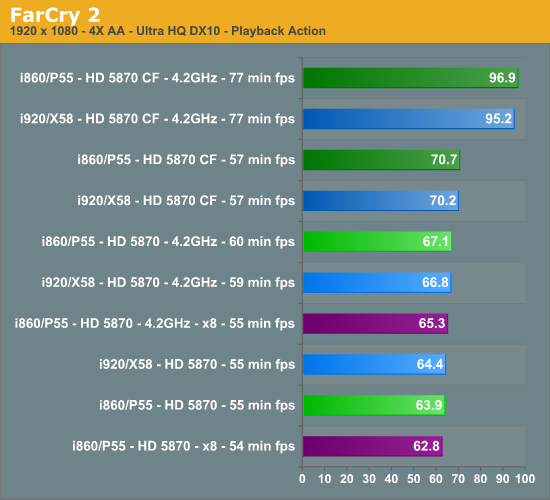
The P55 results improve slightly as we move to a more CPU centric benchmark. The stock HD 5870 single card x8 configuration is only 2% slower in average frame rates and only 1% in the overclocked results. Comparing single card results between the P55 and X58, we see a 2% difference in favor of the X58 at stock speeds while at 4.2GHz the P55 finishes slightly ahead of the X58.
The pertinent data for CrossFire scaling is in the tables below. What we are looking for is the percentage speedup going from one to two HD 5870s on X58 and P55. In theory, X58 should have improved percentages because each GPU gets 16 PCIe 2.0 lanes while Lynnfield only provides 8 PCIe 2.0 lanes per GPU.
FarCry 2 CrossFire Scaling – Average Frame Rates
| ATI HD 5870 CF Scaling | FarCry 2 – Ranch Small | FarCry 2 – Playback Action | FarCry 2 – Ranch Small 4.2GHz | FarCry 2 – Playback 4.2GHz |
| Intel Core i7 920 (X58) | 66.8% | 9% | 81.8% | 42.5% |
| Intel Core i7 860 (P55) | 59.8% | 10.6% | 75.8% | 44.4% |
Based on our single card results, there are not a lot of surprises here. At stock speeds, the X58 has a 7% scaling advantage over the P55 and 6% when overclocked in the GPU centric Ranch demo. In the Playback Action benchmark, the results favor the P55 by almost 2%.
FarCry 2 CrossFire Scaling – Minimum Frame Rates
| ATI HD 5870 CF Scaling | FarCry 2 – Ranch Small | FarCry 2 – Playback Action | FarCry 2 – Ranch Small 4.2GHz | FarCry 2 – Playback 4.2GHz |
| Intel Core i7 920 (X58) | 41.1% | 3.6% | 77.9% | 30.5% |
| Intel Core i7 860 (P55) | 32.4% | 3.6% | 78.4% | 28.3% |
Minimum frame rates and scaling heavily favor the X58 in our stock clock speed results using the Ranch demo. Although frame rates still favor the X58 in this demo when overclocked, the scaling on the P55 is slightly better. The stock results in the Playback Action demo are a dead heat with a 2% advantage to the X58 when overclocked.
When it came to actual game play, there were no differences between either platform in the game. In fact, it was very difficult to discern which system was being utilized. The key giveaway was the foot warming heat coming from our case with the X58 overclocked. Our ambient temperature in the test room rose 2.1C over the course of testing with the X58 installed compared to 0.7C with the P55.
H.A.W.X.
We utilize FRAPS to capture our results in a very repeatable section of the game and report the median score of our five benchmark runs. H.A.W.X. responds well to memory bandwidth improvements and scales well with GPU improvements.

The stock HD 5870 single card x8 configuration is around 1% slower in average frame rates. The 4.2GHz single card x8 setup is slightly slower than either the stock P55 or X58 setups. The stock/overclocked single card HD 5870 P55 platform is 3% slower than the X58. Once again, there was no difference in actual game play, especially considering minimum frame rates are above 65fps in each instance.
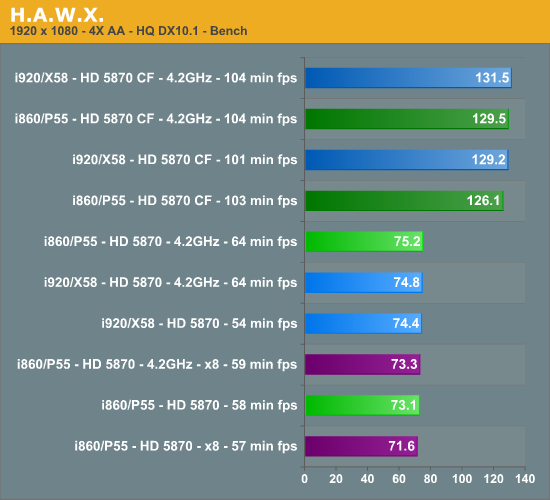
The results with 4xAA enabled improve the P55’s standing against the X58. The stock HD 5870 single card x8 configuration is around 2% slower in average frame rates. The 4.2GHz single card x8 setup is slightly slower than the X58. The overclocked single card HD 5870 P55 platform is slightly faster than the X58 with equal minimum rates. In fact, thanks to the turbo mode on the 860, the stock minimum frame rates are 7% at this setting than the X58.
H.A.W.X. CrossFire Scaling – Average Frame Rates
| ATI HD 5870 CF Scaling | H.A.W.X. 2xAA | H.A.W.X. 4xAA | H.A.W.X. 2xAA 4.2GHz | H.A.W.X. 4xAA |
| Intel Core i7 920 (X58) | 70.8% | 73.7% | 75.2% | 75.8% |
| Intel Core i7 860 (P55) | 70% | 72.5% | 73.2% | 72.2% |
At stock speeds, the X58 has a 3% scaling advantage over the P55 and 5% when overclocked in the 2xAA benchmark.
H.A.W.X. CrossFire Scaling – Minimum Frame Rates
| ATI HD 5870 CF Scaling | H.A.W.X. 2xAA | H.A.W.X. 4xAA | H.A.W.X. 2xAA 4.2GHz | H.A.W.X. 4xAA |
| Intel Core i7 920 (X58) | 72.7% | 87% | 80.3% | 62.5% |
| Intel Core i7 860 (P55) | 68.2% | 66.1% | 71% | 62.5% |
Minimum frame rates and scaling favor the X58 in our stock clock speed results by 4% and 9% when overclocked in the 2xAA bench. In the 4xAA benchmark, the X58 has a 10% advantage at stock speeds and it is dead even when the two platforms are overclocked.
Resident Evil 5
We utilize FRAPs to track minimum and average frame rates using the Fixed benchmark in Resident Evil 5. The median test score out of five benchmark sessions is used for the reported results.
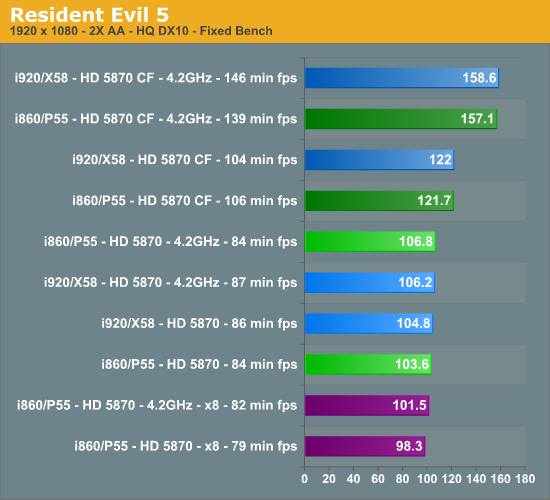
Once again, our single card results at x8 are trailing the x16 results, even when overclocked. Minimum frame rates are about 3% better on the X58 platform at both stock and overclocked settings than the P55. The P55 holds a slight advantage when overclocked in average frame rates and trails by 1% at stock speeds.
Resident Evil 5 CrossFire Scaling – Average Frame Rates
| ATI HD 5870 CF Scaling | Resident Evil 5 | Resident Evil 5 4.2GHz |
| Intel Core i7 920 (X58) | 16.4% | 49.3% |
| Intel Core i7 860 (P55) | 17.5% | 47.1% |
At stock speeds, the P55 has a 1% scaling advantage over the X58 but trails over 2% when overclocked.
Resident Evil 5 CrossFire Scaling – Minimum Frame Rates
| ATI HD 5870 CF Scaling | Resident Evil 5 | Resident Evil 5 4.2GHz |
| Intel Core i7 920 (X58) | 20.9% | 67.8% |
| Intel Core i7 860 (P55) | 26.2% | 65.5% |
Minimum frame rates favor the P55 in our stock clock speed results by about 5%, but trail the X58 around 2% when overclocked.
Company of Heroes - Tales of Valor
We utilize FRAPs once again to track a custom demo in one of our favorite RTS titles.
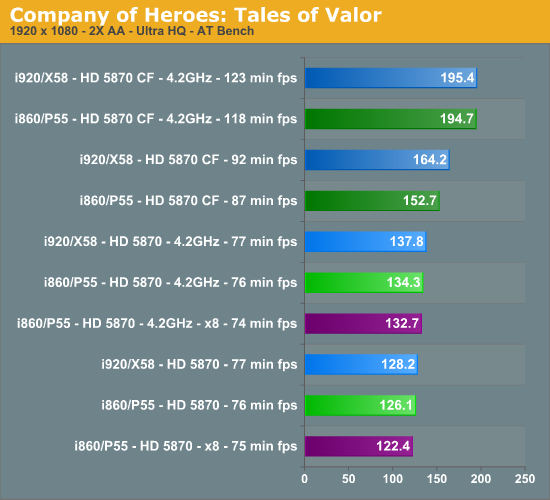
The single card results at x8 is trailing the x16 results by 3% at stock and 1% when overclocked. Minimum frame rates are less than 1% better on the X58 platform at both stock and overclocked settings than the P55 while average frame rates are up to 2% better.
CoH: Tales of Valor CrossFire Scaling – Average Frame Rates
| ATI HD 5870 CF Scaling | CoH: Tales of Valor | CoH: Tales of Valor 4.2GHz |
| Intel Core i7 920 (X58) | 28.1% | 41.8% |
| Intel Core i7 860 (P55) | 21.1% | 44.9% |
At stock speeds, the X58 has a 7% scaling advantage over the P55 but trails almost 3% when overclocked.
CoH: Tales of Valor CrossFire Scaling – Minimum Frame Rates
| ATI HD 5870 CF Scaling | CoH: Tales of Valor | CoH: Tales of Valor 4.2GHz |
| Intel Core i7 920 (X58) | 19.5% | 59.7% |
| Intel Core i7 860 (P55) | 14.8% | 55.3% |
Minimum frame rates favor the X58 in our stock clock speed results by about 5% and right over 2% when overclocked. We did not note any differences in actual game play.
World in Conflict - Soviet Assault
We utilize the built-in benchmark for World in Conflict. We set the advanced options to Very High and manually set AA to 2x and AF to 16x. We take the median score from five benchmark runs.
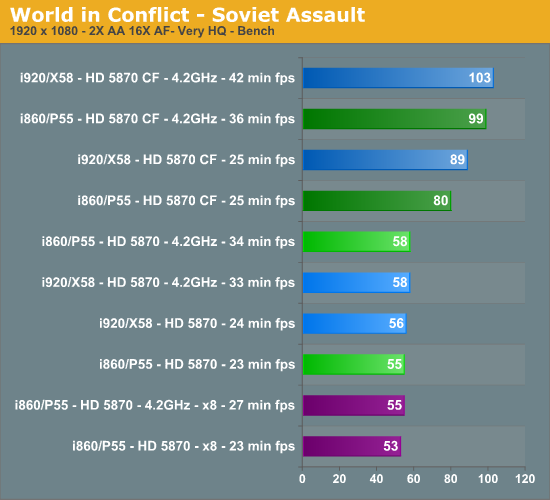
The single card results at x8 is trailing the x16 setups by 3% at stock and 5% when overclocked. Minimum frame rates for the single card results are around 4% better on the X58 platform at stock and trails the P55 by 3% when overclocked .
World in Conflict CrossFire Scaling – Average Frame Rates
| ATI HD 5870 CF Scaling | World in Conflict | World in Conflict 4.2GHz |
| Intel Core i7 920 (X58) | 58.9% | 77.6% |
| Intel Core i7 860 (P55) | 45.5% | 70.7% |
At stock speeds, the X58 has a 13% scaling advantage over the P55 and almost 7% when overclocked.
World in Conflict CrossFire Scaling – Minimum Frame Rates
| ATI HD 5870 CF Scaling | World in Conflict | World in Conflict 4.2GHz |
| Intel Core i7 920 (X58) | 4.2% | 27.3% |
| Intel Core i7 860 (P55) | 8.7% | 5.9% |
Minimum frame rates favor the P55 in our stock clock speed results right over 4% but trail the X58 around 21% when overclocked.
Battle Forge - Renegade
Our first DX11 benchmark comes courtesy of Battle Forge. We set all options to Very High and enable DX11. We take the median score of five benchmark runs utilizing the in-game benchmark.
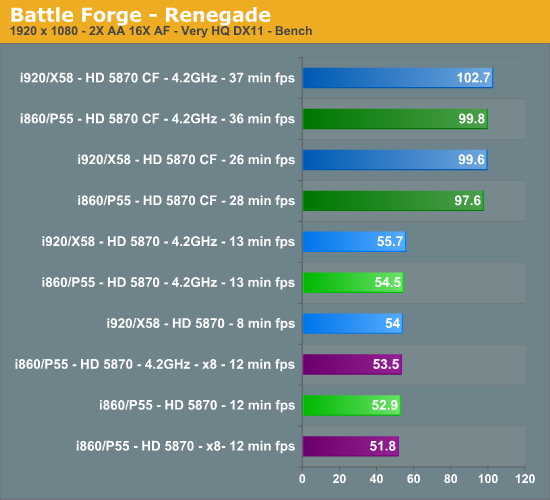
The single card results at x8 trails the x16 results by about 2% at stock and when overclocked. Minimum frame rates for the single card results are around 50% better on the P55 platform at stock and both platforms are even when overclocked.
Battle Forge CrossFire Scaling – Average Frame Rates
| ATI HD 5870 CF Scaling | Battle Forge | Battle Forge 4.2GHz |
| Intel Core i7 920 (X58) | 84.4% | 84.4% |
| Intel Core i7 860 (P55) | 84.5% | 83.1% |
At stock and overclocked speeds, both platforms are practically tied when it comes to scaling in average frame rates.
Battle Forge CrossFire Scaling – Minimum Frame Rates
| ATI HD 5870 CF Scaling | Battle Forge | Battle Forge 4.2GHz |
| Intel Core i7 920 (X58) | 225% | 184.6% |
| Intel Core i7 860 (P55) | 133.3% | 176.9% |
Minimum frame rates favor the X58 in our stock and overclocked speed results. This title thrives on CrossFire for improving minimum frame rates. Although the percentages are large, the minimum frame rates are still in the 36 fps range, more than enough for an enjoyable game experience.
One of our favorite new games is Batman - Arkham Asylum. We set all options as high as they will go and utilize the games built-in benchmark for our results. Both platforms are just stupid fast when running this game.
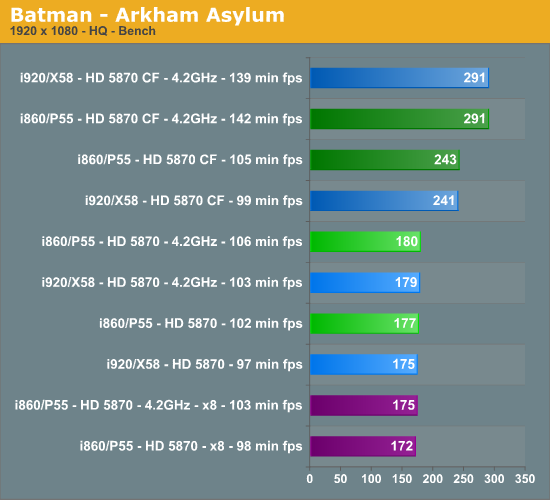
The single card results at x8 trails the x16 results by about 1% at stock and 3% when overclocked. Minimum frame rates for the x16 single card results are around 5% better on the P55 platform at stock and 3% when overclocked.
Batman – Arkham Asylum CrossFire Scaling – Average Frame Rates
| ATI HD 5870 CF Scaling | Batman – Arkham Asylum | Batman – Arkham Asylum 4.2GHz |
| Intel Core i7 920 (X58) | 37.7% | 62.6% |
| Intel Core i7 860 (P55) | 37.3% | 61.7% |
At stock and overclocked speeds, both platforms are practically tied when it comes to scaling in average frame rates.
Batman – Arkham Asylum CrossFire Scaling – Minimum Frame Rates
| ATI HD 5870 CF Scaling | Batman – Arkham Asylum | Batman – Arkham Asylum 4.2GHz |
| Intel Core i7 920 (X58) | 2.1% | 34.9% |
| Intel Core i7 860 (P55) | 7.1% | 33.9% |
Minimum frame rates favor the P55 by 6% and scaling favors the P55 by 5% in our stock results, while the X58 is slightly ahead in the overclocking test.
Power Consumption
Both systems have all power management features enabled and we utilize the Balanced Power option in Windows 7. Our 4.2GHz overclock setting has the Core i7 860 VCore offset option enabled with an ending voltage of 1.3875V. VTT is set to 1.310V, CPU PLL at 1.80V, and VDimm at 1.62V. The Core i7 920 offset is enabled for a final VCore reading of 1.335V. VTT is set to 1.375V, CPU PLL at 1.86V, and VDimm at 1.65V.
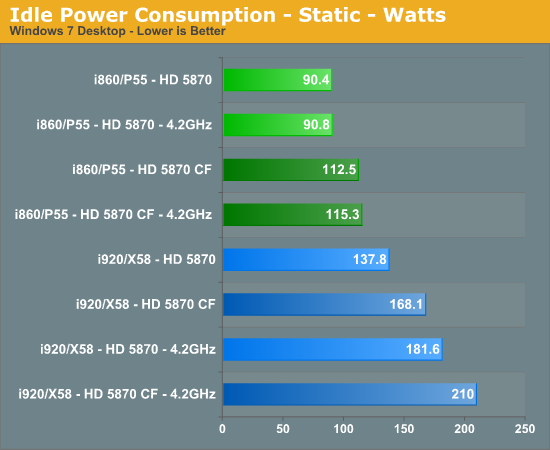
Idle power is Lynnfield's biggest ally and the Radeon HD 5870 plays well here. Even overclocked to 4.2GHz with a pair of 5870s, Lynnfield uses less power than a single 5870 on an i7 920. Bloomfield runs at a 12x multiplier at idle while Lynnfield runs at 9x. Bloomfield also likes to ramp up VTT voltage in a hurry compared to Lynnfield, the result is nearly zero impact at idle power consumption but when Bloomfield is overclocked, the platform just consumes more power thanks to additional circuitry.
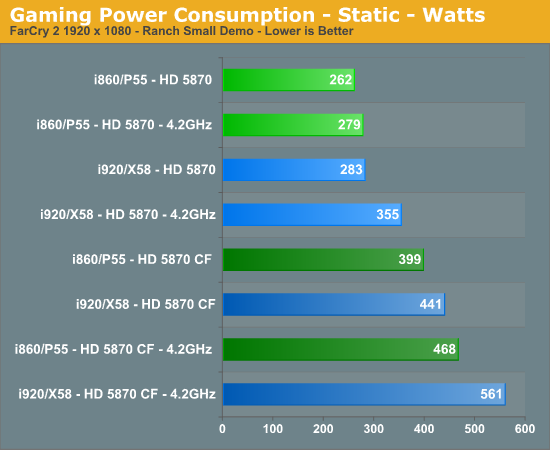
Under load, once again, there's virtually no impact from CPU overclocking on Lynnfield compared to Bloomfield. At stock frequencies however, the GPU power dominates and thus there's less than a 10% power difference between X58 and P55.
In just about every benchmark shown today and even in those not listed the multi-GPU results favor X58. Nothing shocking about that as in previous testing with both Nvidia and ATI video cards, we came to the same conclusion. The only difference today is that we are using the latest generation DX11 capable GPU and the percentage differences are not really any different with previous GPU chipsets. Where we did not have a difference was in actual game play experiences. It was impossible to tell the difference between platforms, except for some additional thermal output from the X58 setup.
If you happen to benchmark Intel platforms for a living, then clearly an X58/Bloomfield platform is the way to go. No questions asked, not even a hint of doubt should enter one’s mind as to the X58 being the logical choice. How about the other 99.9% of us? Well, if you just need that safe feeling that you are getting the maximum benefit out of those $380 HD 5870 cards you just purchased, the X58 paired with a Core i7 is an easy choice. It is an even easier choice if you plan on upgrading to Gulftown next year.
For those of us who are interested in power consumption, heat, noise, and not all that worried about a 2% to 7% difference in the benchmarks, then the Lynnfield platform is an attractive alternative with the latest generation GPUs. In fact, without the 920/X58 hanging around at similar pricing, the general thoughts/concerns regarding 860/P55 would probably be significantly different within the enthusiast community. The 860/P55 is a very good platform, especially for those running at stock or near stock speeds where the aggressive turbo mode will make a difference in daily computing tasks and your pocketbook.
That said, if you are running a single card such as the HD 5870, either platform is fine. However, performance in x8 mode was a bit disappointing for those needing the second slot for purposes other than graphics. In the end, performance in games was still very good and only a benchmark would inform you of less than stellar performance. What we cannot answer right now is if the dual x8 PCIe capability on Lynnfield will become a true bottleneck with the GPUs that follow the current/planned releases from AMD/Nvidia.
So our conclusion still has not changed from a month ago, if you plan on purchasing a high end multi-GPU setup you'll want to go with X58/Bloomfield for the best possible performance. If you want a great combination of application and gaming performance without the power consumption or heat concerns, the Lynnfield platform is a very attractive alternative.


