Original Link: https://www.anandtech.com/show/2207
EVGA nForce 650i Ultra: Performance on a Budget
by Gary Key on April 10, 2007 2:00 AM EST- Posted in
- Motherboards
The 680i SLI motherboards were launched with a tremendous public relations effort by NVIDIA back in November. There was a lot of hype, speculation, and fanfare surrounding NVIDIA's latest chipset for the Intel market, and it promised an incredible array of features and impressive performance for the enthusiast. At the time of launch we were promised the mid to low range 650i SLI and Ultra chipsets would be shipping shortly to flesh out NVIDIA's Intel portfolio. NVIDIA had plans to truly compete against Intel, VIA, ATI, and SIS in the majority of Intel market sectors within a very short period of time after having some limited success earlier in 2006 with the C19A chipset.
However, all of this planning seemed to unravel as the weeks progressed after the 680i launch. It seemed as if NVIDIA's resources were concentrated on fixing issues with the 680i chipset instead of forging ahead with their new product plans. Over the course of the past few months we finally saw the 650i SLI launched in a very reserved manner, followed by the 680i LT launch that offered a cost reduced alternative to the 680i chipset. While these releases offered additional choices in the mid to upper range performance sectors, we still did not know how well or even if NVIDIA would compete in the budget sector.
When discussing current Intel platform chipsets, the phrase "budget sector" is somewhat of an oxymoron. While there are a lot of choices in the $50 to $60 range for Core 2 Duo compatible boards, these are mainly based on older chipsets that do not offer anything in the way of extended overclocking, RAID, or performance oriented designs. This is not to say they are in any way bad, as one of our favorite budget boards in the lab is the VIA based ASRock 4CoreDual-VSTA, but rather these boards are targeted for an audience that is very price sensitive.
As you go up the price ladder there are some very good 945P boards from the likes of EPoX and Gigabyte, followed by the budget P965 boards from ECS, MSI, Foxconn, and Biostar. These boards usually offer solid performance and a decent set of features for prices in the $75 to $105 range. Once again, nothing in this sector is designed to offer mid-range performance capabilities at a price under $100. Well, this all changes with the eerily silent release of the NVIDIA 650i Ultra today. The EVGA 650i Ultra board we are reviewing today will initially be offered at $99 but prices should drop as supply and competition become widespread. What is different about this chipset and does it really offer an attractive alternative to the Intel chipsets in the $100 market? Let's find out in today's review of the EVGA 650i Ultra motherboard.
NVIDIA nForce 650i Ultra Chipset Features
Before we get to our initial performance results and discussion of this budget 650i Ultra board design we need to first explain the differences between it and the other Intel chipset offerings from NVIDIA.
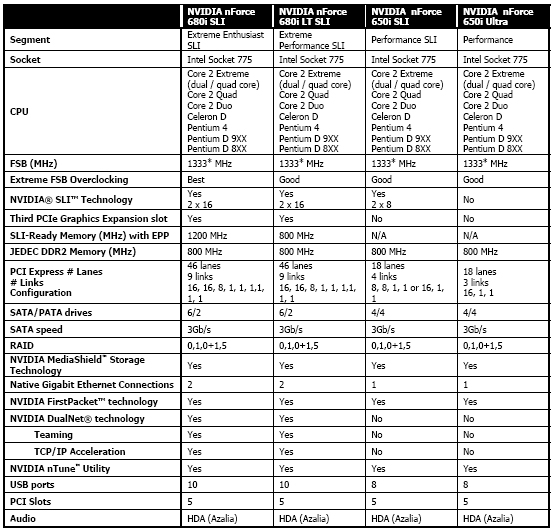
All of the chipsets offer support for the latest Intel Socket 775 based processors along with official 1333FSB speeds for the upcoming 1333FSB based CPUs. The 650i SLI and 650i Ultra chipsets are based on the same 650i SPP and utilize the nF430 MCP. The only differentiator between the two is how this SPP/MCP combination is implemented on a board with the 650i SLI offering SLI operation at 8x8 compared to the single x16 slot on the 650i Ultra.
Other differences between the chipsets center on the features that the 680i offers that are not available on the 650i. These features include two additional USB 2.0 ports, two additional SATA ports, an additional Gigabit Ethernet port, Dual-Net technology, and EPP memory support. Otherwise, depending upon BIOS tuning, the performance of the chipsets is very similar across a wide range of applications, with overclocking capabilities being slightly more pronounced on the 680i chipset. In our testing we have found that the other chipsets also offer very good overclocking capabilities with SLI performance basically being equal at common resolutions on supported chipsets.
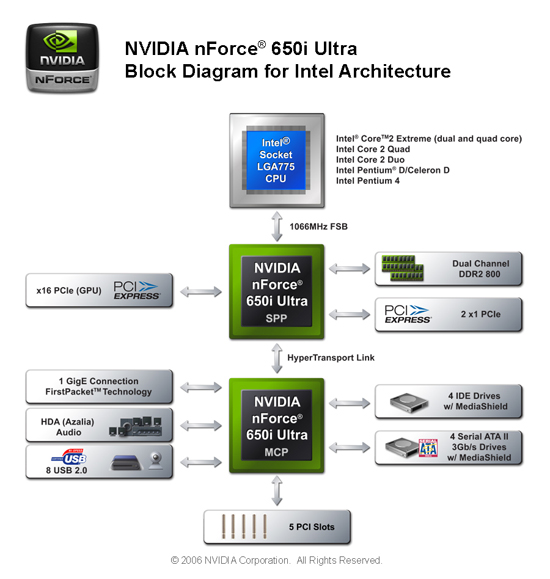
This diagram lists the basic features of the 650i Ultra chipset. The differences between the available options and our EVGA 650i Ultra board is the removal of an IDE port that would support two additional PATA drives and two less PCI slots. The inclusion of the additional IDE port could have benefited this board considering the price range, particularly for those interested in using older IDE hard drives to keep upgrade costs down.
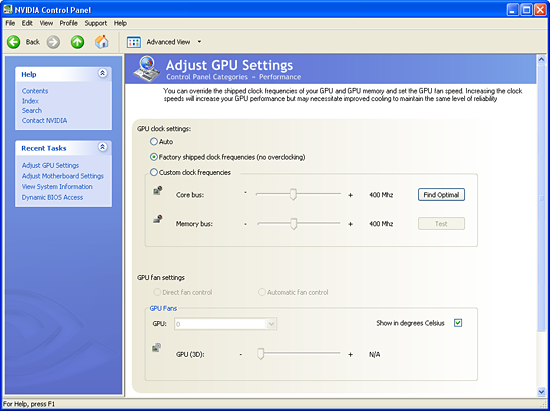
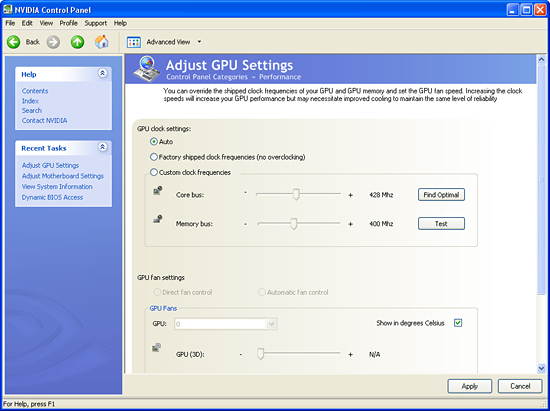
One of the new features being implemented by NVIDIA with the 650i Ultra release is an automatic GPU optimization capability. These optimizations are handled automatically by the GPU and board driver sets based upon the installed GPU and BIOS support. Initial support is for the 7600GS and 7300GT video cards but it will be expanded across a wider range of NVIDIA based graphic cards in the near future. We will also see more aggressive tuning as this technology matures over time.
The drivers will determine a safe overclocking level for the GPU and then implement the changes automatically. This support is transparent to the user and works seamlessly. We tested this feature exhaustively across a wide range of applications and it never once created an issue. These optimizations provided a 2% to 4% improvement in our game benchmark scores.
Obviously, the more astute computer user can get the same or better results by manually overclocking the GPU which is why some users will probably think of this as a gimmick. However, we believe any time you can gain performance at no cost or effort then there's not reason to complain.
EVGA 650i Ultra Basic Features
| EVGA nForce 650i Ultra | |
| Market Segment: | Budget Performance - $99 |
| CPU Interface: | Socket T (Socket 775) |
| CPU Support: | LGA775-based Pentium 4, Celeron D, Pentium D, Pentium EE, Core 2 Duo, Core 2 Extreme |
| Chipset: | NVIDIA 650i Ultra SPP (C55) + nF430 MCP (MCP51) |
| Bus Speeds: | Auto, 400 to 2500 QDR (100~625) in 1MHz increments |
| Memory Ratios: | Auto, Sync., 1:1, 5:4, 3:2 |
| Memory Speed: | 400MHz~1400MHz in various increments |
| PCI Express: | 100MHz~200MHz in 1MHz Increments |
| LDT Frequency: | 1x, 2x, 3x, 4x, 5x |
| Core Voltage: | Auto, 0.80000V to 1.60000 in 0.00625V increments |
| FSB Options: | Auto, Linked, Unlinked |
| CPU Clock Multiplier: | Auto, 6x-11x in 1X increments - Core 2 Duo, downwards unlocked, Core 2 Extreme 6x-50X |
| DRAM Voltage: | Auto, 1.80V to 2.10V in .10V increments |
| DRAM Timing Control: | Optimal, Manual - 10 DRAM Timing Options |
| NB Voltage: | Auto, 1.20V to 1.50V in .10V increments |
| FSB Voltage: | Auto, 1.20V to 1.40V in .10V increments |
| Memory Slots: | Four 240-pin DDR2 DIMM Slots Dual-Channel Configuration, DDR2-400, 533, 667, 800 Regular Unbuffered Memory to 8GB Total |
| Expansion Slots: | 1 - PCIe X16 (x16 electrical) 2 - PCIe x1 3 - PCI Slot 2.2 |
| Onboard SATA/RAID: | 4 SATA 3Gbps Ports - nF430 MCP (RAID 0,1, 0+1, 5, JBOD) |
| Onboard IDE: | 1 ATA133/100/66 Port (2 drives) - nF430 MCP |
| Onboard USB 2.0/IEEE-1394: | 8 USB 2.0 Ports - 4 I/O Panel - 4 via Headers Firewire 400 - not supported |
| Onboard LAN: | NVIDIA Gigabit Ethernet - PCIe - 1 x Marvell 88E1116 PHY - 1 port via 430 MCP |
| Onboard Audio: | Realtek ALC885 - 8-channel HD audio codec |
| Power Connectors: | ATX 24-pin, 8-pin EATX 12V |
| I/O Panel: | 1 x PS/2 Keyboard 1 x PS/2 Mouse 1 x Audio Panel 1 x RJ45 4 x USB 2.0/1.1 |
| BIOS Revision: | Award 731N1P01 |
| Board Revision: | ILL 1.0 |
The EVGA BIOS offers a decent set of options available for tweaking the board with specific emphasis placed on the available memory settings. However, with memory voltages limited to 2.10V we found it difficult to take advantage of the memory options with a vast majority of our modules. Only our high end modules from OCZ, Corsair, and Patriot were able to operate at 1T command rates with absolute stability. We found in memory testing that switching to manual settings and changing the tCAS, tRCD, tRP, tRAS, and command rate was required to ensure optimum performance.
While we understand NVIDIA's reluctance to open up the BIOS options on a board designed for the budget market we do think they made a mistake in this area. Our performance results generated by the board would indicate that a couple of additional voltage options, improved electricals, and an increase to 2.20V for the memory would have transformed this board from very good to exceptional status in the sub-$100 market.
 |
| Click to enlarge |
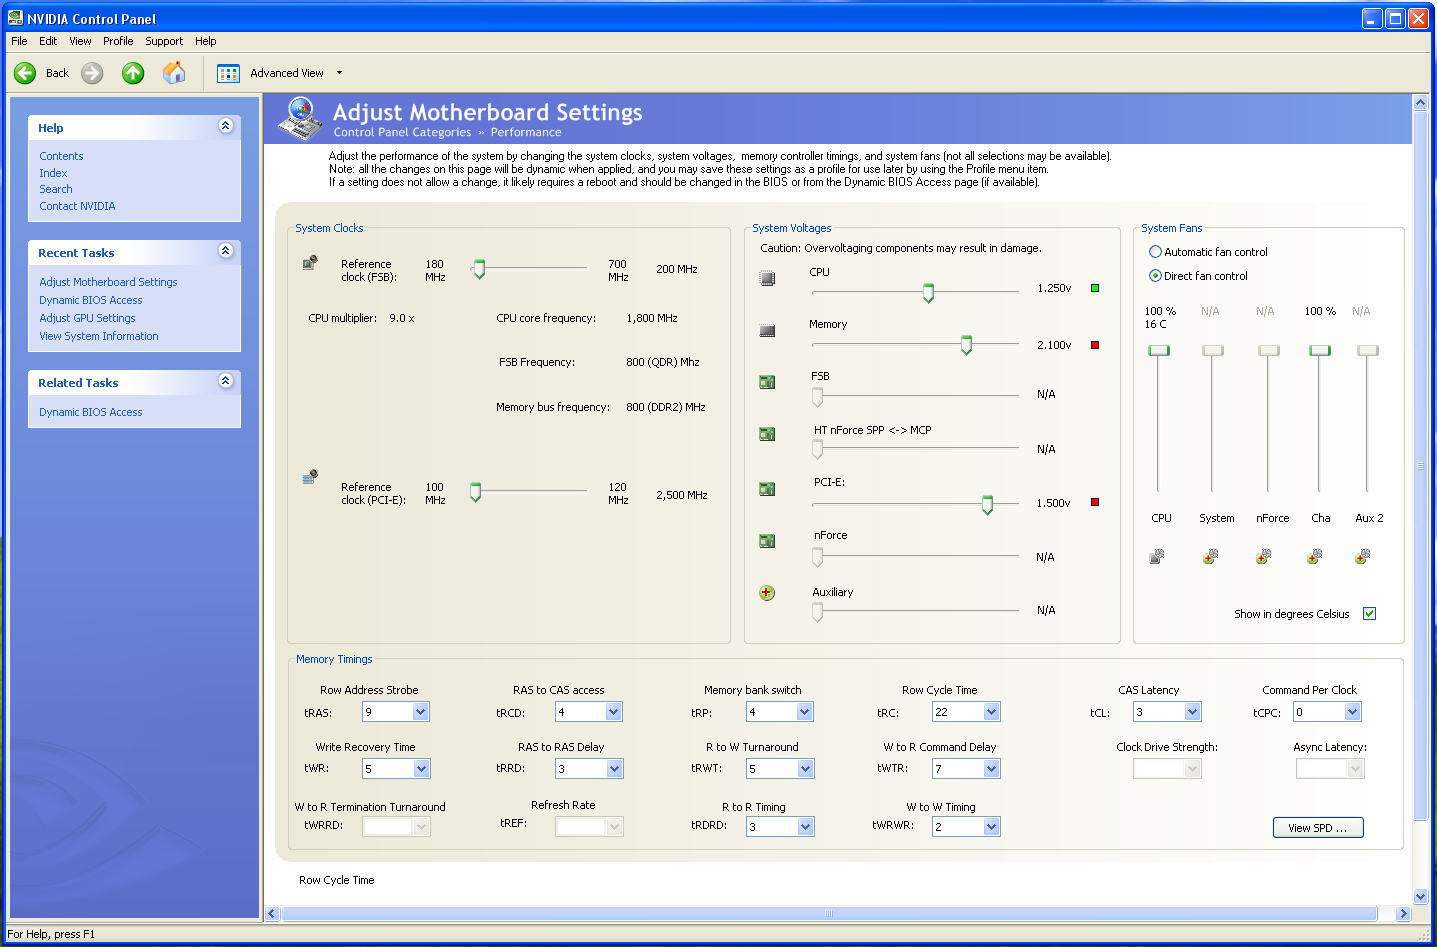
EVGA offers full support for NVIDIA's nTune system utility and we only had a couple of minor problems with it during testing. You need to use the PCI-E slider to change the SPP voltage while the ability to change the FSB voltage is not available. Otherwise, the utility is one of the better vendor supplied programs available, although it's not quite as polished as the uGuru technology from abit.
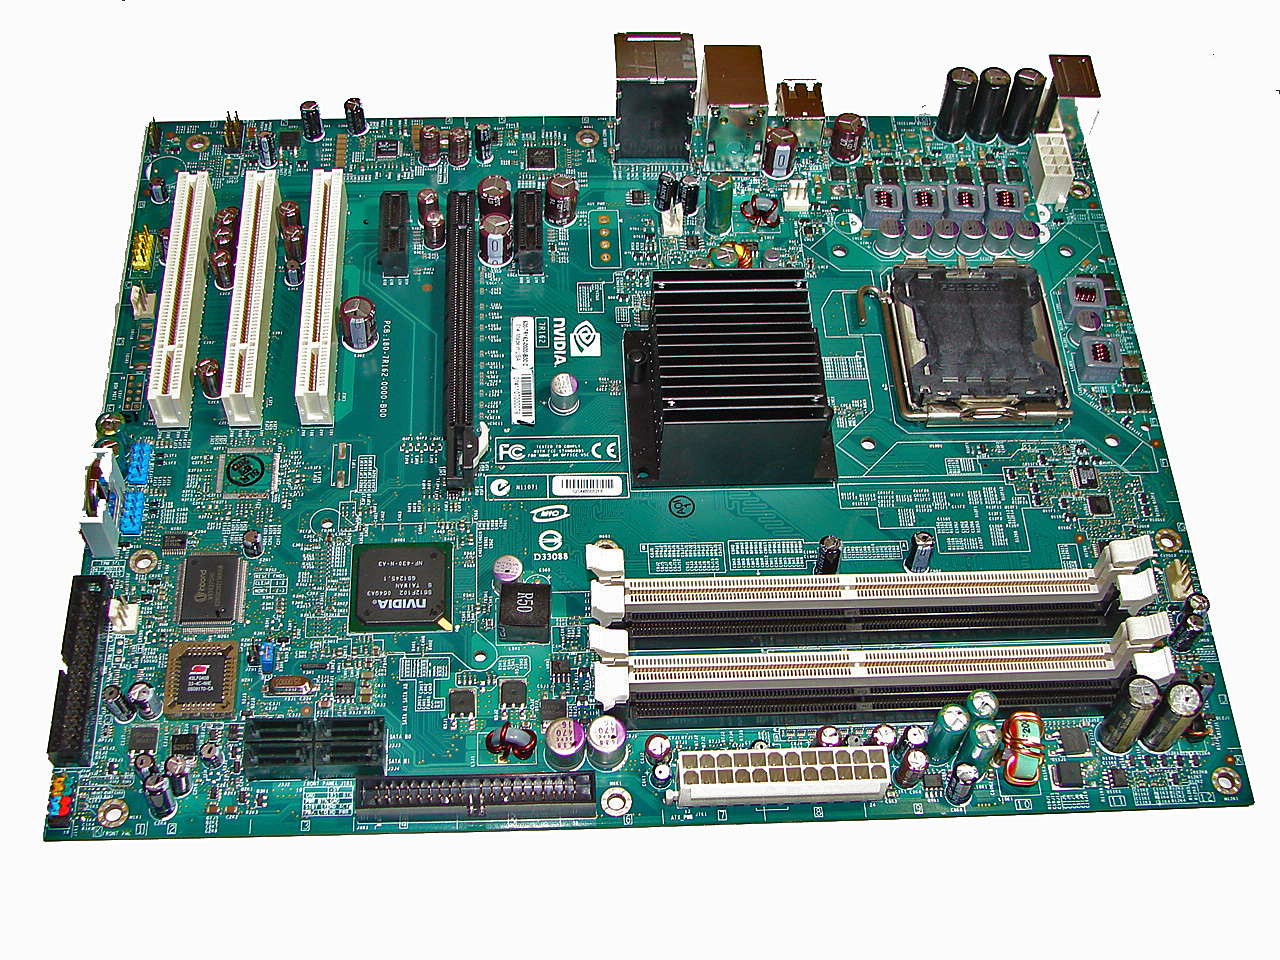
EVGA 650i Ultra Board Layout and Features
 |
| Click to enlarge |
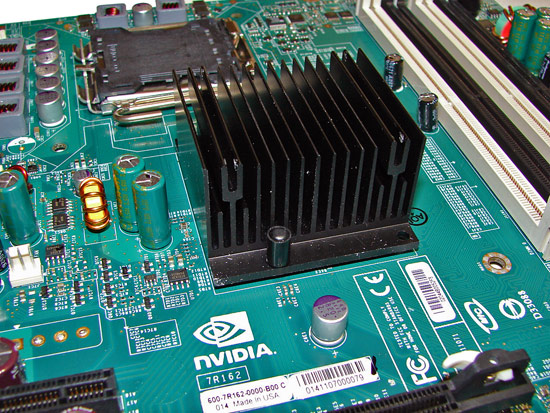
EVGA did a nice job in the layout of this board as all features on the board except for the floppy drive connector were easily reached. This board features a four-layer design along with six-phase power regulation. NVIDIA specified a mix of solid polymer aluminum and high quality electrolyte capacitors that provided excellent stability during testing at stock speeds. During our overclocking tests we found the passive heat sink on the 650i SPP worked well but additional airflow was required to ensure stability. The board installed easily into our Cooler Master CM Stacker 830 case and cable management was very good for power, optical, and hard drives.
There are five fan headers (one 4-pin, four 3-pin) located in easy to reach positions on the board. All of the headers are monitored within nTune but only the CPU fan and one chassis fan header of the user's choice offer automatic fan control capabilities within the BIOS. The automatic control system includes a choice of using temperature ranges or duty cycle speeds to control the CPU fan header, and duty cycle only for the chassis fan.
We initially thought the fan header just north of the CPU socket was defective but it turns out this header will not spin up the fan until the CPU reaches 60C. Also, due to temperature control concerns with the passively cooled SPP, the BIOS will automatically run the CPU fan header at 100% duty cycle to ensure enough airflow when overclocking the board past a 1333FSB setting.
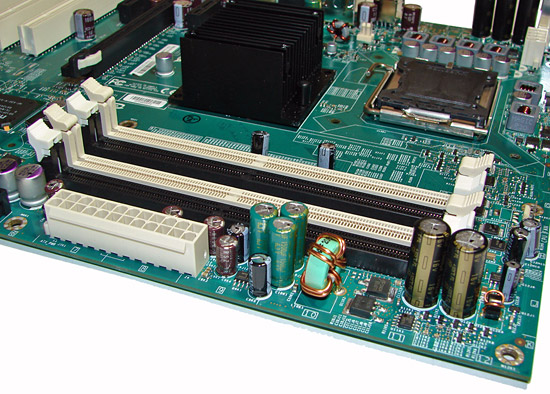
The memory slots are color coded correctly for dual channel operation. The 24-pin ATX power connector is conveniently located on the edge of the board. The CPU fan header is located next to the first memory slot on the right edge of the board and was easily reached by a variety of heatsink/fan cables.
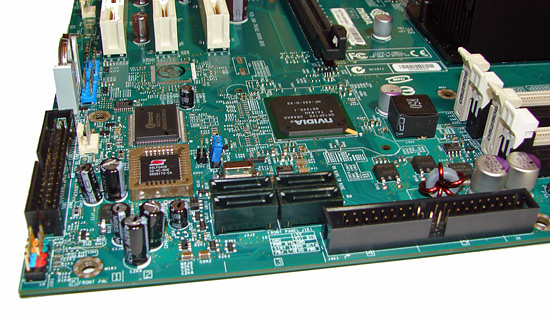
The four black SATA ports are located near the edge of the board. We found the positioning of the SATA ports to be very good when utilizing the PCI-E x16 or PCI slots. The black IDE connector is located on the bottom edge of the board and will be a right angle design on the production level boards. The reason for this is that the connector was not usable with an 8800GTX card installed in it. The black floppy drive connector is located on the left edge of the board along with the chassis connector panel.
The MCP is not actively or passively cooled and remained hot to the touch throughout testing; although additional cooling was not needed it is recommended. We feel like the inclusion of an additional low profile heatsink would have been in EVGA's best interest with temperatures soaring to 83C without airflow and 76C with airflow while overclocking. At stock voltages we witnessed temperatures reaching 71C without airflow while under load and hovering around 64C with airflow. Our idle temperature at stock voltage was 59C without airflow and 53C with airflow. Fortunately, the board has the mounting holes for a heatsink if the user wishes to add one.
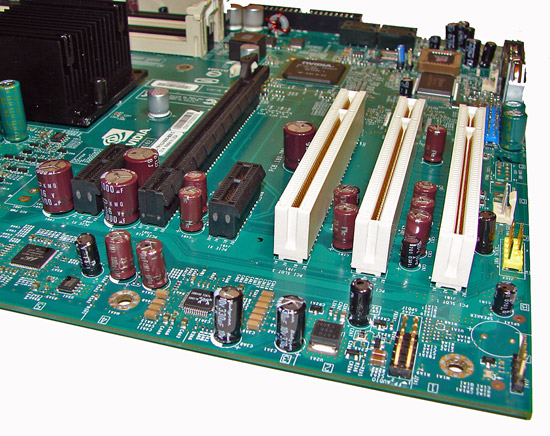
The board comes with one PCI Express x16 connector (x16 electrical), two PCI Express x1, and three PCI 2.2 connectors. This is a very good single x16 connector design. The second PCI Express x1 slot will be physically unavailable if you utilize a double slot card design in the x16 slot.
 |
| Click to enlarge |
Returning to the CPU socket area, we find an excellent amount of room for alternative cooling solutions. We utilized the stock heatsink/fan in our normal testing but also verified a few larger Socket-775 air cooling solutions such as the Tuniq 120 would fit easily in this area during our overclocking tests. The 650i SPP chipset is passively cooled with a mid-rise heatsink unit that did not interfere with any installed peripherals but did run extremely hot without additional airflow over it during overclocking.
We noticed temperatures hitting 103C during overclocking without airflow across the heatsink. Obviously this is a worst case example as we momentarily turned off our heatsink fan but it does show that proper cooling around the SPP area is required. Temperatures with the stock Intel heatsink/fan combination were near 46C during overclocking and dropped to 39C once we turned on our case fans. We recorded temperatures of 54C with the Tuniq 120 during overclocking with a drop to 43C once the case fans were turned on. The 8-pin ATX power connector is ideally situated in an area that will not hinder airflow.
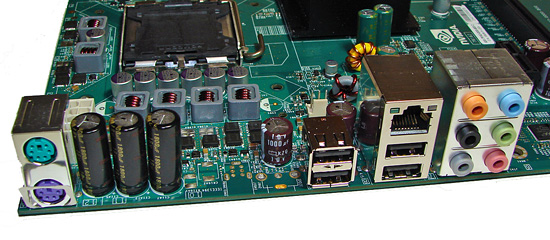
The rear panel contains the standard PS/2 mouse and keyboard ports, one LAN port, and four USB 2.0 ports. The LAN (RJ-45) port has two LED indicators representing Activity and Speed of the connection through the Marvell Gigabit PCI-E PHY controller. The panel also has a six connector panel for the audio system.
The audio subsystem is based on the Realtek ALC885 and offers 8-channel output. While this audio solution will not offer better performance over the Creative X-Fi series, it will suffice for the majority of users needing decent audio output across a variety of requirements that include gaming, music, and DVD playback. The one significant drawback continues to be EAX 2.0 audio quality that is significantly worse than the Creative or ADI solutions.
Overclocking - E4300
| EVGA nForce 650i Ultra E4300 Overclocking Testbed |
|
| Processor: | Intel Core 2 Duo E4300 Dual Core, 1.86GHz, 2MB Unified Cache 800FSB, 9x Multiplier |
| CPU Voltage: | 1.4625V (default 1.30V) |
| SPP Voltage: | 1.40V |
| FSB Voltage: | 1.40V |
| Cooling: | Tuniq 120 Air Cooling |
| Power Supply: | OCZ ProXStream 1000W |
| Memory: | OCZ Flex XLC PC2-6400 (2x1GB) |
| Video Cards: | 1 x MSI 8800GTX |
| Hard Drive: | Western Digital 150GB 10,000RPM SATA 16MB Buffer |
| Case: | Cooler Master CM Stacker 830 |
| Maximum OC: | 380x9 (3-4-4-9 1T, 760MHz) 3420MHz (+84% CPU) |
| . | |
 |
| Click to enlarge |
We were able to reach a final benchmark stable setting of 9x380 FSB resulting in a clock speed of 3420MHz. Our E4300 is not the best of the lot and has not gone above 400FSB on several boards so we consider these results to be very good for our particular sample. We were able to POST and enter XP at 9x390 but could not complete our benchmark test suite.
We were able to run our OCZ Flex PC2-9200, OCZ Flex CAS3 PC2-6400, and our Corsair PC2-8888 at the reported timings with a 1T Command Rate enabled with 2.10 V. However, the memory had to be set to Sync mode in order to utilize these timings and command rate. With the memory voltage being limited to 2.1V, it was very difficult finding memory modules that would allow CAS3 and 1T command rate operation while overclocking the FSB. We also had to set the SPP voltage to 1.30V to ensure stability at 1T operation with all of our processors. Vdroop was very acceptable on this board during overclocking with an average drop of .02V during load testing with our E4300.
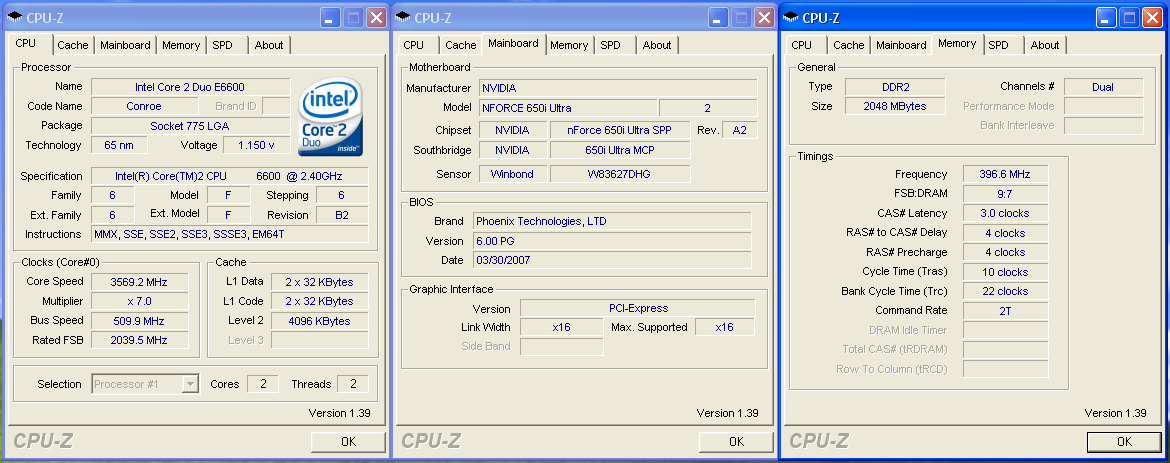
Overclocking - E6300
| EVGA nForce 650i Ultra E6300 Overclocking Testbed |
|
| Processor: | Intel Core 2 Duo E6300 Dual Core, 1.86GHz, 2MB Unified Cache 1066FSB, 7x Multiplier |
| CPU Voltage: | 1.4500V (default 1.3250V) |
| SPP Voltage: | 1.50V |
| FSB Voltage: | 1.40V |
| Cooling: | Tuniq 120 Air Cooling |
| Power Supply: | OCZ ProXStream 1000W |
| Memory: | OCZ Flex XLC PC2-6400 (2x1GB) |
| Video Cards: | 1 x MSI 8800GTX |
| Hard Drive: | Western Digital 150GB 10,000RPM SATA 16MB Buffer |
| Case: | Cooler Master CM Stacker 830 |
| Maximum OC: | 509x7 (3-4-4-10 2T, 793MHz) 3569MHz (+91% FSB/CPU) |
| . | |
 |
| Click to enlarge |
Switching to an E6300, we reached a final setting of 7x509 FSB resulting in a clock speed of 3569MHz. We had to loosen our memory timings slightly while overclocking in order to maintain stability at the higher FSB rates. We were not able to run a command rate of 1T past 450FSB and attribute this to crosstalk on the board due to the four-layer design and a lack of memory voltages past 2.1V. We did notice in 4GB testing that we had to change our OCZ Flex PC2-6400 CAS3 memory timings to 4-4-3-10 2T at 2.10V for stable 24/7 operation in a variety of applications. Vdroop was acceptable during load testing with our E6300 with an average drop of .03V.
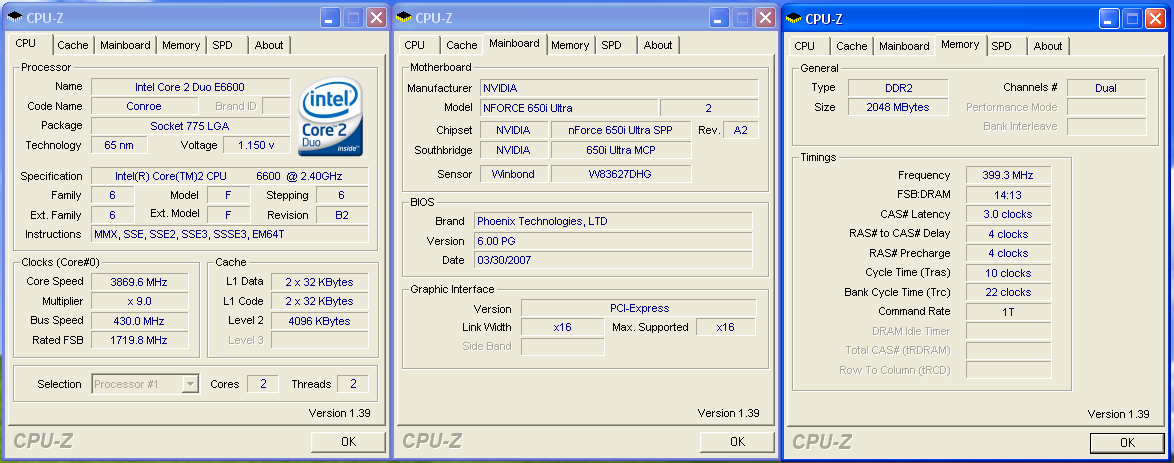
Overclocking - E6600
| EVGA nForce 650i Ultra E6600 Overclocking Testbed |
|
| Processor: | Intel Core 2 Duo E6600 Dual Core, 2.4GHz, 4MB Unified Cache 1066FSB, 9x Multiplier |
| CPU Voltage: | 1.4750V / 1.4500 (default 1.3250V) |
| SPP Voltage: | 1.50V |
| FSB Voltage: | 1.40V |
| Cooling: | Tuniq 120 Air Cooling |
| Power Supply: | OCZ ProXStream 1000W |
| Memory: | OCZ Flex XLC PC2-6400 (2x1GB) |
| Video Cards: | 1 x MSI 8800GTX |
| Hard Drive: | Western Digital 150GB 10,000RPM SATA 16MB Buffer |
| Case: | Cooler Master CM Stacker 830 |
| Maximum CPU OC: | 430x9 (3-4-4-10 1T, 798MHz) 3869MHz (+61% CPU) |
| Maximum FSB OC: | 509x7 (3-4-4-10 2T, 793MHz) 3569MHz (+91% FSB) |
| . | |
 |
| Click to enlarge |
After trying a variety of memory timings and system voltages we discovered our 9x430 FSB setting was the limit for both our board and CPU. This resulted in a final clock speed of 3869MHz at 1.4750V which is the limit for our Tuniq 120 air cooler. We did find the typical FSB hole around 416~422 FSB but did not notice the same issues we had with the 680i LT SLI having several FSB ranges that were unusable. Vdroop was acceptable but not great during overclocking with an average drop of .04V during load testing with our E6600.
 |
| Click to enlarge |
We dropped the multiplier on our E6600 to seven and were able to reach the same 509 FSB level as with the E6300. We were able to enter XP at 7x512 but the board was not stable. We were able to pass all benchmarks at the 7x509 setting but feel like the board is most comfortable around 485FSB. We have been testing the board for only a week so extensive 24/7 testing at 7x509 has not been completed at this time. However, we have not had a failure at this setting in the last 72 hours.
We noticed in overclock testing that we were able to extract an 1133 memory speed at 5-5-5-18 2T timings at 2.10V with our OCZ Flex PC2-6400. This matches the 680i LT SLI speeds at slightly worse timings although performance differences were minimal. Memory performance and stability was excellent once the board was dialed in.
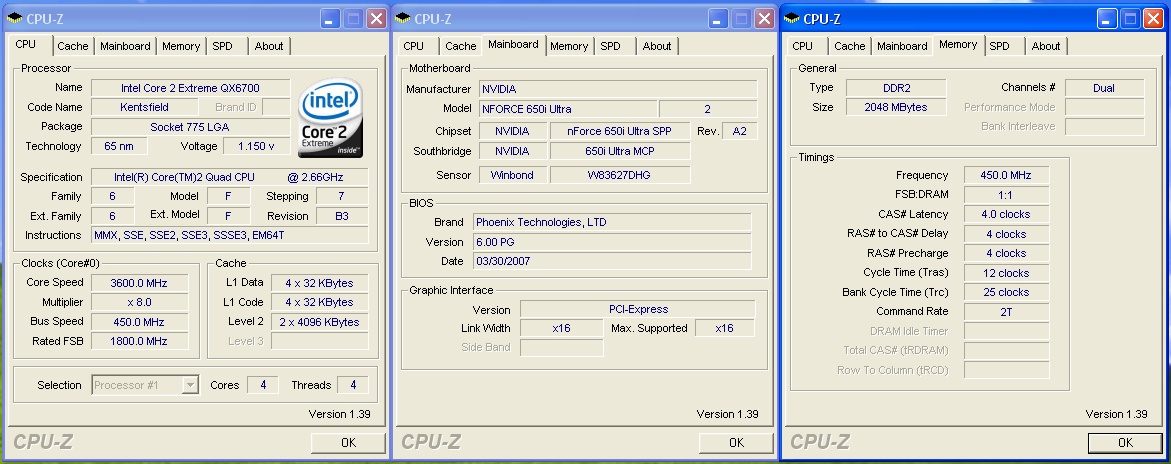
Overclocking - QX6700
| EVGA nForce 650i Ultra QX6700 Overclocking Testbed |
|
| Processor: | Intel Core 2 Extreme QX6700 Quad Core, 2.66GHz, 8MB Unified Cache 1066FSB, 10x Multiplier |
| CPU Voltage: | 1.4500V / 1.4750V (default 1.3500V) |
| SPP Voltage: | 1.50V |
| FSB Voltage: | 1.40V |
| Cooling: | Tuniq 120 Air Cooling |
| Power Supply: | OCZ ProXStream 1000W |
| Memory: | OCZ Flex XLC PC2-6400 (2x1GB) |
| Video Cards: | 1 x MSI 8800GTX |
| Hard Drive: | Western Digital 150GB 10,000RPM SATA 16MB Buffer |
| Case: | Cooler Master CM Stacker 830 |
| Maximum OC: | 360x10 (4-4-4-10 2T, 800MHz, Linked) 3600MHz (+35%) |
| Maximum FSB OC: | 450x8 (4-4-4-12 2T, 900MHz, Sync) 3600MHz (+69% FSB) |
| . | |
 |
| Click to enlarge |
We were extremely pleased with quad core overclocking on this board as its performance was significantly better than some of the more expensive 680i boards in our results. Our board reached a final 360FSB at the stock multiplier. We were able to POST and enter XP at 368FSB but could not complete our benchmark testing.
Our processor voltage was set to 1.450V in order to maintain system stability at 360 FSB. Our processor will normally run in the 3600MHz range at 1.4125V on the 975X and P965 boards. Vdroop was acceptable on this board with the quad core processor. We would see drops as high as .04V under load testing with the average drop being around .03V during extended game testing.
We really had to loosen up the memory timings when compared to the dual core results as there was some significant crosstalk on the board with the quad core at extended FSB settings. In fact, we could not run CAS3 and 1T command rate stable together at stock settings. Our choice was to run 4-4-3-9 1T settings at stock as performance was better than running 3-4-4-10 2T. Since our quad core results with the ASUS and MSI 650i/430 boards are very similar, we believe the 650i SPP is the limiting factor in overclocking this processor.
 |
| Click to enlarge |
This was probably the biggest surprise in our testing as the board had no issues reaching a stable 450FSB, although for 24/7 operation we felt like 8x440 would probably be safer based upon the memory timings being utilized. We were able to POST and enter XP at 474FSB but could not complete any benchmark testing. Until we complete long term 24/7 testing on this board with a quad core CPU, our suggestion is to stay below 430FSB level and run slightly tighter memory timings.
Test Setup
| Standard Test Bed Performance Test Configuration |
|
| Processor: | Intel Core 2 Duo E6600 (2.4GHz, 4MB Unified Cache) |
| RAM: | OCZ Flex XLC PC2-6400 (2x1GB) 2.20V, 3-4-3-9 (1T where applicable) |
| Hard Drive: | Western Digital 150GB 10,000RPM SATA 16MB Buffer |
| System Platform Drivers: | Intel - 8.1.1.1010 NVIDIA - 9.35, 8.43 ATI - 6.10 |
| Video Cards: | 1 x MSI 8800 GTX, 1 x EVGA 7600GS |
| Video Drivers: | NVIDIA 97.92 (8800GTX), 93.71 (7600GS) |
| CPU Cooling: | Tuniq 120 |
| Power Supply: | OCZ ProXStream 1000W |
| Optical Drives: | Plextor PX-760A, Plextor PX-B900A |
| Case: | Cooler Master CM Stacker 830 |
| Motherboards: | ASUS Striker Extreme (NVIDIA 680i) - BIOS 1002 ASUS P5N-E SLI (NVIDIA 650i) - BIOS 0401 ASUS P5N32-E SLI Plus (NVIDIA 650i - BIOS 0602) ASUS P5B-E (Intel P965) - BIOS 0402 DFI LANParty UT ICFX3200-T2R/G (AMD RD600) - BIOS 12/22 EVGA 650i Ultra (650i Ultra) - BIOS Award 731N1P01 EVGA 680i LT SLI (680i LT) - BIOS Award 721N0P01 GIGABYTE GA-N680SLI-DQ6 - BIOS F4B Intel D975XBX2 (Intel 975X) - BIOS 2333 MSI P6N SLI Platinum (nForce 650i) - BIOS 1.22 |
| Operating System: | Windows XP Professional SP2 |
| . | |
A 2GB memory configuration is standard in our XP test beds as most enthusiasts are currently purchasing this amount of memory. Our choice of mid-range OCZ Flex XLC PC-6400 memory represents an excellent balance of price and performance and offers a very wide range of memory settings during our stock and overclocked test runs. We also utilized our Corsair XMS2 Dominator (Twin2x2048-9136C5D) memory on this board to verify DDR2-1066 compatibility with another memory type.
We are currently completing testing several other memory modules ranging from Transcend and Wintec at DDR2-667 and DDR2-800. We will show full compatibility and performance results in our 680i roundup article. Our memory timings are set based upon determining the best memory bandwidth via MemTest 86 and test application results for each board. We only optimize the four main memory settings with sub-timings remaining at Auto settings.
We are utilizing the MSI 8800GTX video card to ensure our 1280x1024 resolutions are not completely GPU bound for our motherboard test results. We did find in testing that applying a 4xAA/8xAF setting in most of today's latest games at our standard resolution did not really change results. Our video tests are run at 1280x1024 resolutions for this article at High Quality settings. We also tested at 1600x1200 and 1920x1200 4xAA/8xAF for our NVIDIA SLI results that will be presented in our MSI P6N Diamond article.
All of our tests are run in an enclosed case with a dual optical/hard drive setup to reflect a moderately loaded system platform. Windows XP SP2 is fully updated and we load a clean drive image for each system to keep driver conflicts to a minimum. We were able to run our memory test modules at 3-4-3-9 1T for our benchmark results but these timings will not be typical on this board unless you are utilizing premium memory modules. The majority of our budget to mid-range memory modules ran fine at 4-4-4-12 1T, 4-4-3-10 2T, or 4-4-4-12 2T with 2.10V on this board.
We are also including performance results with our OEM Intel E4300 processor, EVGA 7600GS video card, and Transcend JetRam DDR2-800 memory set at 4-4-4-12 2T in order to show what this combination is capable of on a board designed for the budget sector. The total price for these components including the board was $486, about $73 less than our single MSI 8800GTX card.
Synthetic Graphics Performance
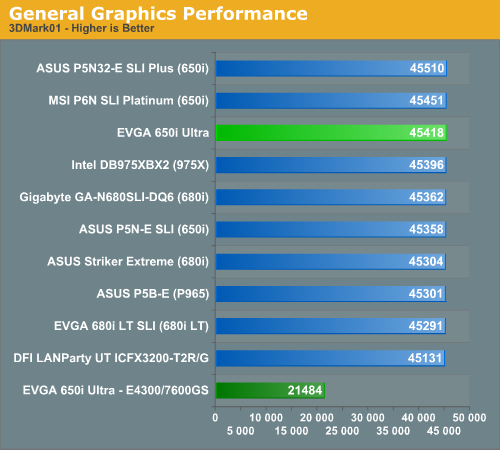
The 3DMark series of benchmarks developed and provided by Futuremark are among the most widely used tools for benchmark reporting and comparisons. Although the benchmarks are very useful for providing apple to apple comparisons across a broad array of GPU and CPU configurations they are not a substitute for actual application and gaming benchmarks. In this sense we consider the 3DMark benchmarks to be purely synthetic in nature but still very valuable for providing consistent measurements of performance.
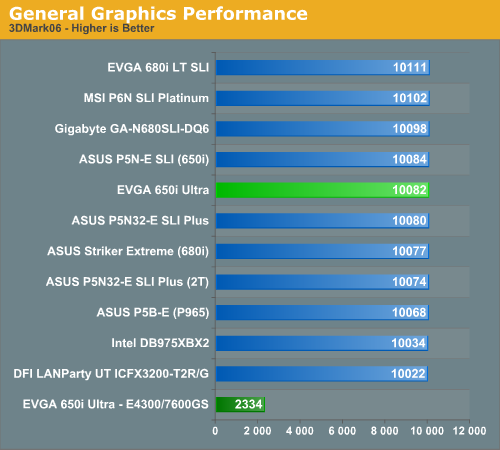
In our 3DMark06 test, all of board are basically even with only an 89 point separation from first to last. Our EVGA 650i Ultra board scored in the middle of the pack and offered an average video score but a top CPU score in this benchmark. This was just the opposite result from our ASUS and MSI based 650i boards.
In the more memory and CPU sensitive 3DMark01 benchmark we see our EVGA 650i Ultra board scoring in the top three spots. This pattern will continue in the balance of our benchmarks and shows that NVIDIA has properly tuned this board for performance oriented results even though its price is fairly inexpensive.
General System Performance
The PCMark05 benchmark developed and provided by Futuremark was designed for determining overall system performance for the typical home computing user. This tool provides both system and component level benchmarking results utilizing subsets of real world applications or programs. This benchmark is useful for providing comparative results across a broad array of Graphics, CPU, Hard Disk, and Memory configurations along with multithreading results. In this sense we consider the PCMark benchmark to be both synthetic and real world in nature, and it again provides for consistency in our benchmark results.
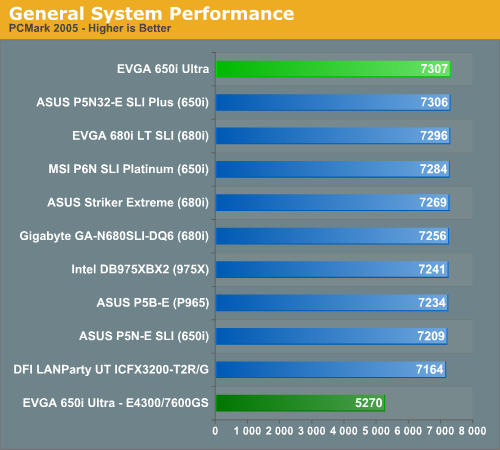
The EVGA 650i Ultra board tops our previous NVIDIA chipset offerings in this very competitive benchmark and we are starting to see a pattern emerge with the latest board releases performing slightly better than the earlier ones. The 650i and 680i chipsets scored very well on the single task disk benchmarks with the 680i performing slightly better in the graphics subsystem tests where they led the field, although the EVGA 650i tied the LT board in this test. Our 975X and P965 chipset boards won the multitasking tests while the RD600 offered middle of the road performance in majority of tests. Our EVGA board scored better in the multitasking tests than the other NVIDIA boards which propelled it into first place.
Multitasking Performance
We devised a script that would compress our standard test folder consisting of 444 files, ten subfolders, and 602MB worth of data, convert a 137MB High Definition QuickTime movie clip to a 37MB MPEG-4 format, play back the first two chapters of Office Space with PowerDVD, and run our AVG anti-virus program in the background. We stop the script when the file compression and video conversion are complete. This is a very taxing script for the CPU, Memory, and Storage subsystem. We also found it to be a good indicator of system stability during our overclocking testing.
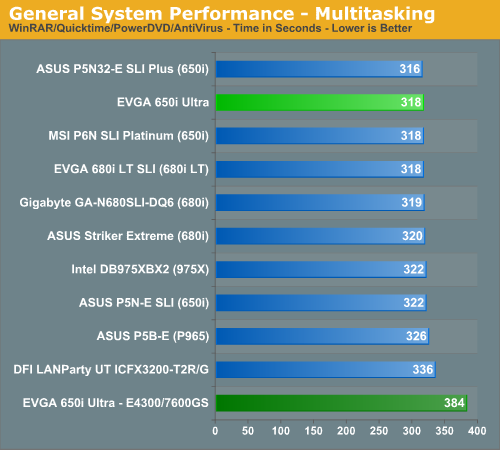
The performance difference basically mirrors our PCMark 2005 tests with the ASUS, MSI, and EVGA boards finishing at the top due to great disk performance, although the Intel boards consistently completed the QuickTime Conversion first. The differences in this test between the ASUS and EVGA boards were minimal with WinRAR showing the only measurable benefits due to tighter memory sub-timings on the ASUS Plus board.
Media Encoding Performance
Our first encoding test is quite easy - we take our original Office Space DVD and use AnyDVD Ripper to copy the full DVD to the hard drive without compression, thus providing an almost exact duplicate of the DVD. We then fire up Nero Recode 2, select our Office Space copy on the hard drive, and perform a shrink operation to allow the entire movie along with extras to fit on a single 4.5GB DVD disc. We leave all options on their defaults except we turn off the advanced analysis option. The scores reported include the full encoding process and are represented in seconds, with lower numbers indicating better performance.
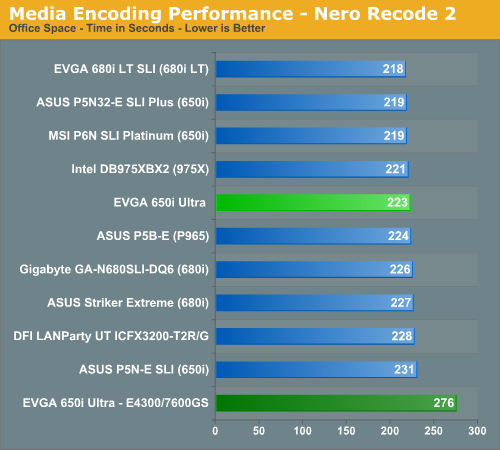
We expected a stronger finish from the EVGA 650i Ultra board in this test based upon previous results. With CPU throughput and disk access times being the critical factors affecting test scores this board should have scored near or at the top. We ran this test with slightly tighter memory sub-timings and also tried 2T timings with 3-3-3-8 settings but the score remained constant at 223 seconds. In this particular test we feel like CPU throughput is slightly hindering the board's performance, although this is not true in every benchmark. We say this because the disk access time and transfer rate for the video files were the best in our secondary tests measuring disk throughput.
Audio Encoding Performance
While the media encoding prowess of the boards was superb in our initial media encoding testing, we wanted to see how they faired on the audio side. Our audio test suite consists of Exact Audio Copy v095.b4 and LAME 3.98a3. We utilize the INXS Greatest Hits CD that contains 16 tracks totaling 606MB of one time '80s hits. We set up EAC for variable bit rate encoding, burst mode for extraction, use external program for compression, and to start the external compressor upon extraction (EAC will read the next track while LAME is working on the previous track, thus removing a potential bottleneck with the optical drive). We also set the number of active threads to two to ensure both cores are active during testing. The results are presented in seconds for the encoding process, with lower numbers being better.
Our Plextor drive consistently took two minutes and nine seconds to read all sixteen tracks. This means our test systems are only utilizing one core during testing until the midway point of the extraction process where the drive speed begins exceeding the capability of the encoder and requires the use of a second thread.
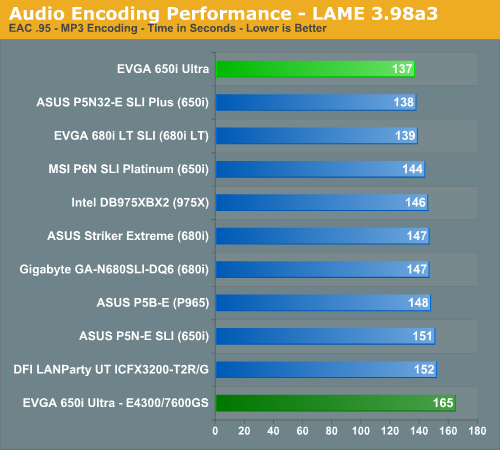
Unlike the media encoding section we see the EVGA 650i Ultra scoring extremely well in a benchmark where CPU and Disk throughput are very important. Based on our previous results we would have to say that disk access and transfer speeds greatly assisted our EVGA board in obtaining the top score in this benchmark.
File Compression Performance
In order to save space on our hard drives and to provide another CPU crunching utility, we will be reporting our file compression results with the latest version of WinRAR that fully supports multi-treaded operations and should be of particular interest for those users with dual core or multi-processor systems. Our series of file compression tests utilizes WinRAR 3.62 to compress our test folder that contains 444 files, ten subfolders, and 602MB worth of data. All default settings are utilized in WinRAR along with our hard drive being defragmented before each test.
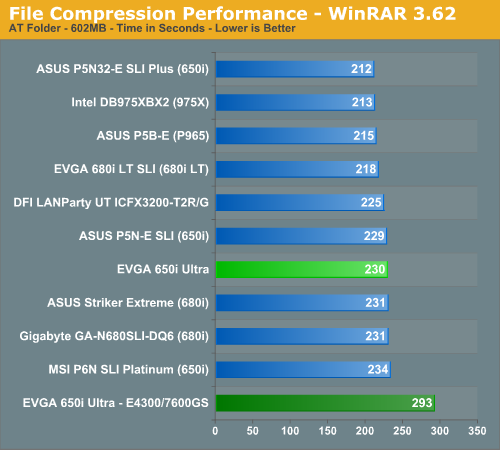
The performance of the EVGA 650i Ultra in this benchmark really disappointed us after the ASUS Plus results in our last article. We thought the code had been cracked on the NVIDIA boards and performance would be more competitive in the future with this benchmark. Our 650i board scored near the bottom of the pack but still bested several other boards with NVIDIA chipsets. We tried several combinations of memory modules and timings to no avail in this benchmark. As they say, "It is what it is." In this case that means it's slow.
Standard Gaming Performance
standard 1280x1024 resolution without antialiasing enabled (and generally without anisotropic filtering, though that varies by game). Given the number of users that run 19" LCDs these days, 1280x1024 represents one of the most commonly used resolutions. We could certainly increase the amount of eye candy being displayed in most of the games, but as this is a motherboard benchmark we aren't particularly interested in maxing out the graphics cards in our tests.
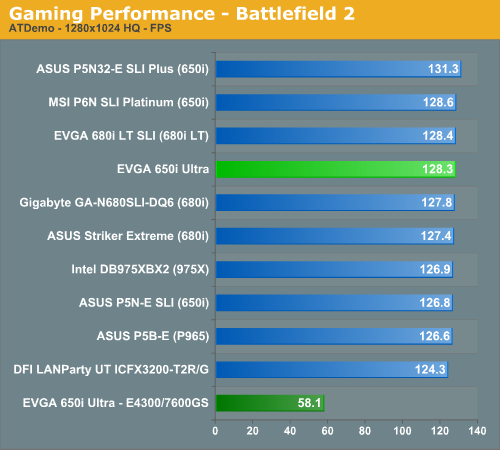
Battlefield 2
This benchmark is performed using DICE's built-in demo playback functionality with additional capture capabilities designed in house. During the benchmark, the camera switches between players and vehicles in order to capture the most action possible. There is a significant amount of smoke, explosions, and vehicle usage as this a very GPU intensive Battlefield 2 benchmark. We run Battlefield 2 using the highest quality graphics settings available in the video settings.
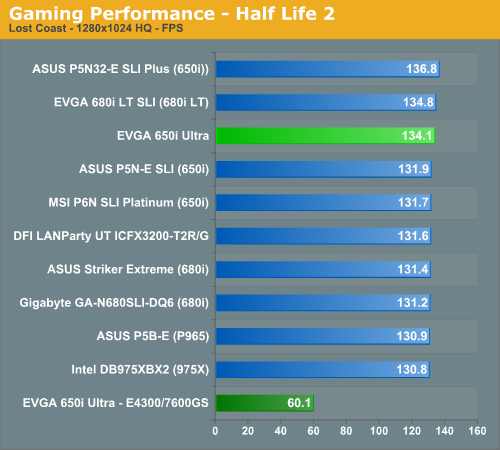
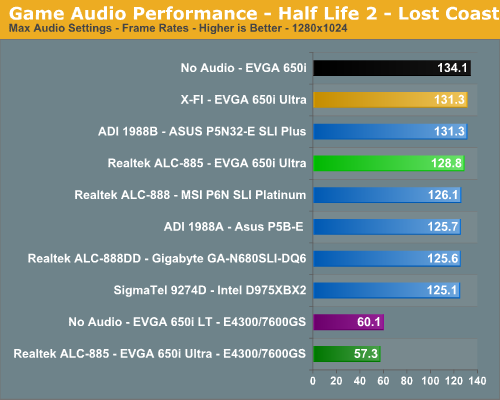
Half Life 2: Lost Coast
We use the built-in timedemo feature to benchmark the game. Our timedemo consists of starting at the bottom of the hill near the lake and ending in the old church. The Source engine timedemo feature is similar to the nettimedemo of Id's Doom 3 engine, in that it plays back more than just the graphics. The highest visual quality settings possible were used with HDR enabled for our tests.
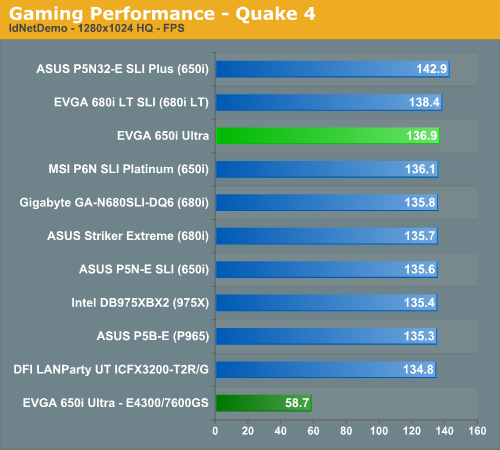
Quake 4
We utilize the nettimedemo test rather than the timedemo option for motherboard benchmarking of Quake 4. To be clear, this means our test results focus mostly on the sort of performance users will experience during actual game play. Additionally, Quake 4 limits frame rate to 60 fps during gameplay whether or not VSync is enabled. Our benchmark utilizes the IdNetDemo. This demo includes mainly outdoor areas with numerous players trying to wipe each other out. We tested the game with High Quality settings (uncompressed normal maps), and we enabled all the advanced graphics options except for VSync.
Company of Heroes
Company of Heroes is a very GPU intensive game and also requires a hefty CPU at times. The game contains a built-in performance test that utilizes the game engine to generate several different action scenes along with a coffee argument as a sideline distraction before the war starts. We found the performance test gives a good indication of how well your system will perform throughout the game. The benchmark may average slightly faster than the worst case battle scenarios, but the difference between gameplay and the cut scene is less than 20%.
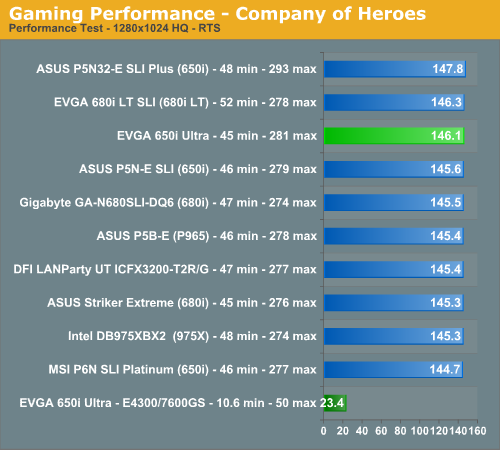
Gaming Summary
We still think it is basically a tossup as to which chipset you select for a gaming machine with feature differences such as SLI or CrossFire potentially being a deciding factor if those technologies are important to you. All of the results are very close and during actual game play we could not tell any real differences between the boards. Our EVGA 650i Ultra board provided top three results but still could not keep pace with the ASUS Plus board due to that board's extremely aggressive sub-timings.
We did not experience any issues during testing or during game play with the EVGA board at stock settings with our particular memory choice. We did encounter some issues with our budget to mid-range memory modules but once we relaxed CAS Latency and tRP timings the board was very stable with a wide range of memory modules. We generally play over a dozen different games for at least a couple of hours on each board to ensure there are no issues such as overheating, stuttering, or network issues when playing online with a various combination of components.
Disk Controller Performance
The AnandTech iPeak test is designed to measure "pure" hard disk controller performance, and in this case we keep the hard drive as consistent as possible while varying the hard drive controller. The idea is to measure the performance of each hard drive controller with the same hard drive. We report the scores as an average number of I/O operations per second so that higher scores translate into better performance. This number is somewhat meaningless as far as hard disk performance is concerned; however, the scores are useful for comparing "pure" performance of the storage controllers in this case. Results are taken from trace files of Winstones 2004.
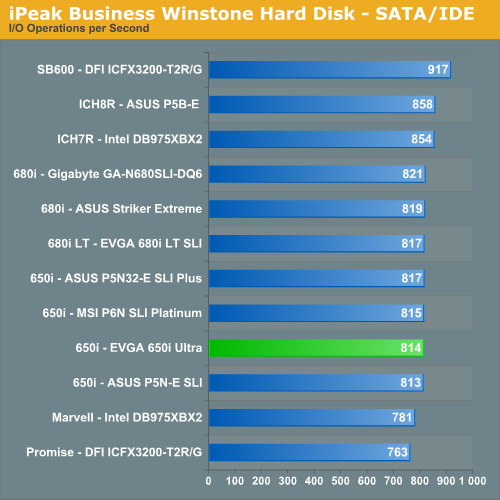
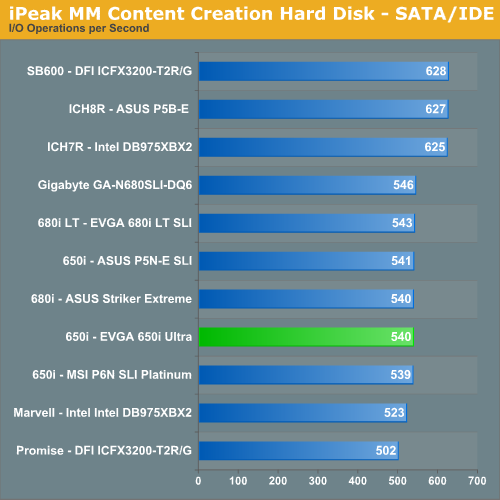
The performance patterns hold steady across both Multimedia Content I/O and Business I/O with the SB600 outperforming the Intel ICH7R, Intel ICH8R, and NVIDIA 680i/650i chipsets in our non-RAID tests. The Promise controller on the DFI board is the slowest of all solutions with the Marvell controller on the Intel 975X performing only slightly better. The 680i and 650i MCP chipsets are different but their disk performance in our tests is basically alike. We also ran RAID 0 and RAID 5 tests on each controller with the results being in favor of the 680i MCP by around 2% over the 680i LT and 650i MCP in these particular benchmarks. Although our NVIDIA boards generally score lower in these "pure" throughput tests, we find their actual performance in disk intensive applications are generally equal to or better than the other solutions.
Power Consumption
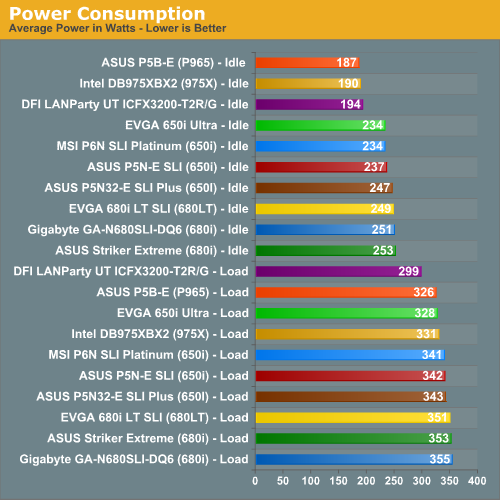
Our power consumption numbers are based on our test setup for this article that consists of the MSI 8800GTX video card and our boards have C1E/EIST turned off. The 680i boards lead all in power consumption with the P965 consuming the least amount of power at idle and the RD600 at load. The EVGA 650i Ultra board has idle numbers similar to the other 650i based boards but its load numbers beat the 975X and are around 3% better than the 650i SLI boards.
FSB Overclocking
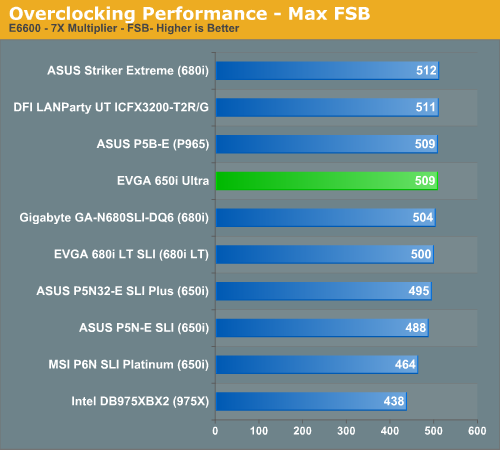
The EVGA 650i Ultra offers excellent overclocking capabilities for a $100 Intel motherboard but it quickly runs out of headroom around the 500FSB level. We believe this is a limitation of the 650i SPP based upon our results with other 650i boards. The board will not satisfy the requirements of the extreme overclocker but should be fine for a majority of users looking to extract additional performance out of their system.
We found during overclocking that we had to set the CPU voltages a little higher than on some other boards to attain the same or better overclocks. We experienced this with the MSI 650i, ASUS 650i, and EVGA 680i LT SLI boards and it was generally due to tighter memory/chipset timings in order to improve the performance of the board at stock speeds. We also had to set the SPP voltage option to 1.30V in order to ensure our memory was stable at 1T command rates due to the lack of memory voltage options over 2.10V. Overall, our overclocking experiences were great given the price, but we felt like a few extra voltage/BIOS options would have transformed the capability of this budget board from very good to excellent when considering the price to performance ratio.
Audio Performance
We are no longer showing the individual CPU utilization rates as the use of a dual core processor means the driver load is balanced between each processor with our audio solutions. The 2.3 version of Rightmark properly supports dual core processors but considering the results they are almost meaningless for most users. We have found the CPU utilization rate improvements with the dual core setup in this test do not have any bearing on actual game benchmarks as the reduction in frame rate percentages are the same on our single core systems.
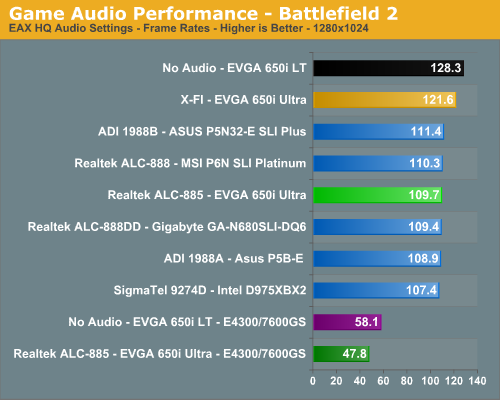
The audio performance numbers remain consistent between the Analog Devices and Realtek Codecs but both finish consistently behind the SoundBlaster X-Fi in the benchmarks. This is to be expected as the ADI and Realtek Codecs are host processing units dependent upon the CPU and drivers for generating their audio streams. The SoundBlaster X-Fi on the other hand has dedicated hardware that generates its audio streams and offloads this burden from the CPU.
We are finding the CPU utilization rates to be constantly decreasing for the onboard solutions as CPU processing power increases and driver optimizations improve, but they still take a toll in certain games. This is reflected in our numbers as Battlefield 2 has an average loss of 17% and Half Life 2: Lost Coast loses 4%. We set Battlefield 2 to utilize EAX 2 in our ADI and Realtek HD results which creates another significant demand on the CPU to process the audio streams, especially with the sound effects quality set to high.
Analog Devices has made news lately claiming other host-based audio solutions (Realtek is obviously in their crosshairs) do not properly generate EAX compatible audio in their drivers. After comparing the ADI 1988B to the Realtek ALC-885 in Battlefield 2 we completely agree and this continues to be an issue even with the latest Realtek 1.64 drivers. The audio quality differences in EAX 2.0 capable games between the ADI and Realtek HD Audio Codecs are almost startling at times.
We firmly believe this is due to obstructions and occlusions still not being implemented correctly in the Realtek drivers although we have found minor improvements in the recent driver releases. There are also some bugs in EAX 2 capable games that feature outdoor areas or vast expanses: we found sounds in BF2 at one end of the map to have the same volume and distance correlation as sounds in front of the character. We suggest turning off EAX 2 in games when utilizing the Realtek solution; the games will just sound better the majority of time.
Obviously, if you are a serious gamer, then a dedicated sound card is still useful to ensure consistent frame rate averages across a wide variety of games, and in the case of the Sound Blaster X-Fi, you also get improved audio quality and EAX3/4/5 support. Unfortunately, users of Vista may have to jump through some extra hoops to get X-Fi support to work properly, due to the changes made to the Vista sound model. If you'd like more details on the Realtek or ADI solutions, you can refer to the Realtek HD Audio Codec Specifications or SoundMAX HD Audio Codec Specifications.
Final Thoughts
This is our first look at a true NVIDIA budget solution for the Intel platform. NVIDIA has done a terrific job combining the 650i SLI SPP and nf430 MCP into a board design that offers extremely competitive performance at a compelling price point. This is the same design philosophy that NVIDIA is using with the 680i LT SLI chipset but we felt like that EVGA board lacked a finishing coat of polish. In some ways we feel the same way about the EVGA 650i Ultra board as well.
Don't get us wrong: we think the performance of the board and the basic features are terrific for an estimated selling price around $95 to $99, especially when looking at other Intel solutions in this price range. However, we firmly believe that a few additions such as memory voltages to 2.2V, CPU VTT / GTL Ref voltage control, Firewire, and maybe a six-layer board design would have placed this board in the exceptional category for those enthusiasts on a budget.
What those extras would have meant in additional cost is something we will never know, but if it only meant a few extra dollars then we firmly believe they would have been well worth it. As it is, we have to judge the board on its own merits against other offerings in the same price range and with that we present it a Silver Editors' Choice Award.
 |
We did not experience any major problems with the board during an intense week long test schedule utilizing Windows XP. We did find a few minor issues with nTune, a fan header that is thermally preset to 60C before the fan will operate, and a few overclocking nuances with our quad core CPU due to crosstalk problems on the board. We just started Vista testing on this board and will provide an update in our upcoming roundup article. We have not experienced issues in Vista yet other than immature driver release problems. It appears from our forums and others that NVIDIA's current driver offerings are not as mature as they need to be for most users, and that problem has also cropped up with other drivers for other users.
We are concerned about the lack of a 2.2V memory setting as we would have liked some additional headroom with our mid to upper range memory modules. As it stands, we are still able to utilize CAS3 and 1T command rates with the SPP voltage increased to 1.30V with our premium memory selection. In all honesty, the application performance differences between our budget memory modules and the higher performing modules were usually less than 5% in extended testing that showed our Transcend JetRam DDR2-800 or Wintec AMPX DDR2-800 being a perfect budget match for this board with a price around $125 for 2GB.
The overclocking aspects of the board are terrific considering the price point and with the asynchronous memory capability you can really push the FSB while retaining budget priced DDR2-800 memory in the system. This is one area where NVIDIA has an advantage over Intel in this price sector as the P965 boards are generally limited to 400FSB and less than stellar memory performance. We typically found that 4-4-4-12 1T or 4-4-3-10 2T timings at DDR2-800 offered a nice balance between memory price considerations and performance on this board.
We feel like the EVGA 650i Ultra offers a high degree of quality, performance, and support in a package that costs a little under $100. This board is certainly not perfect nor is it designed for everyone but it offers almost the perfect package in an Intel market sector that has not had anything real interesting to talk about for a long time. We are left wondering why NVIDIA chose the silent path to introduce this chipset when it's obvious they really have something interesting to discuss this time around.


