Original Link: https://www.anandtech.com/show/2164
Promise VTrak J300s
by Jason Clark & Dave Muysson on February 2, 2007 8:00 AM EST- Posted in
- IT Computing
Introduction
Storage sits at the heart of every system, from a notebook right up to a rack filled with servers. It wasn't long ago that a hard drive was a fairly expensive component that offered significantly less capacity than the massive drives available today. Today, the IT consumer has to decide between SATA/SAS/Fiber Channel, and sizes ranging from 36GB up to 750GB (SATA). But perhaps the most interesting transition that has occurred in the enterprise storage arena in the last few years is the impact that the desktop market has had on the direction of the enterprise storage market.
A few years ago, the enterprise storage market was SCSI or Fiber Channel. If you wanted a chassis full of drives in a DAS (direct attached storage) configuration or in a SAN (Storage Area Network), it came with SCSI or Fiber Channel drives. At the time drives started at 9GB and topped out at 74GB and connected to an Ultra160 SCSI interface, or possibly a 2Gbit Fiber interface. Below is an excellent image from IBM (courtesy of StorageReview), that details 15 years of history for the hard drive.
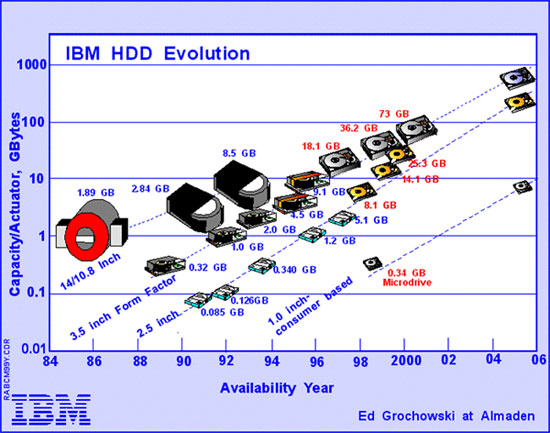
The evolution of today's IT storage
The desktop market has been driving storage higher and higher every year, which of course impacts the IT market, since IT has to back up those drives. Now the enterprise is full of SATA offerings for near-line storage, and even in some more expensive SAN products like EqualLogic. SATA offers decent performance for long term storage and even some small to medium sized back-end applications. However, it can't compete with the latest evolution in high-performance storage for the IT market, SAS (Serial Attached SCSI).
Serial Attached SCSI was introduced into the IT storage market in 2004, and has been growing exponentially every year. We are now at a point where Parallel SCSI is starting to fade very rapidly, with most new servers using SAS instead of Parallel SCSI. Even though there was a specification for Ultra640, most manufacturers skipped right over it and adopted SAS as the next SCSI evolution.
Basic SAS Architecture
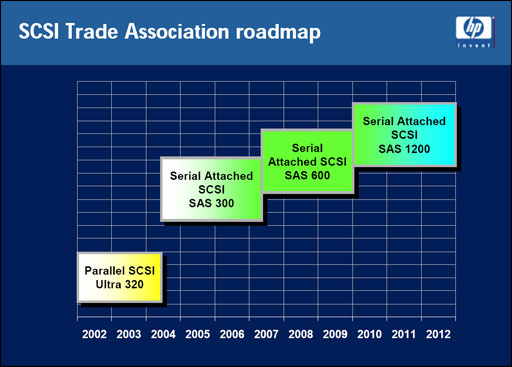
The main advantages for SAS over SCSI are that it has a point to point architecture and much smaller cabling requirements. Modern parallel SCSI operates on a shared bus (every device shared the total bus bandwidth and was limited by the slowest device), ranging in bandwidth from 160MB/s to 320MB/s. SAS is capable of 3Gbit with 6Gbit in the works, and with the 8/10 data encoding that works out to 300MB/s and 600MB/s. More importantly, that bandwidth is per device, so it is unlikely in the near term that any single device will be able to saturate the available bandwidth. One other huge advantage that SAS has is its ability to interoperate with SATA devices. Most of the SAS enclosures sold today offer the ability to mix SAS and SATA drives, which allows for endless possibilities in architecting a storage infrastructure. Below is the SAS roadmap from the SCSI Trade Association.
As you can see from the diagram below, the SAS standard layering is made up of 6 distinct layers, each with a specific purpose.
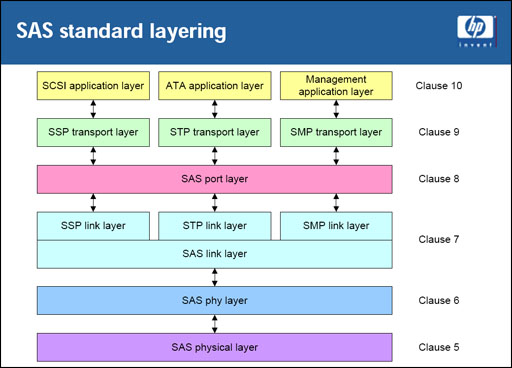
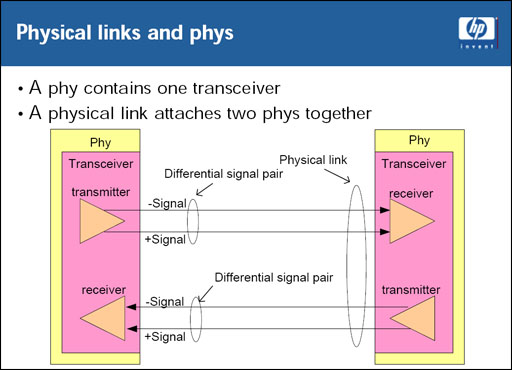
The lowest layer of SAS is the physical link layer, which consists of cables, connections, and the electrical characteristics for the SAS transmitter and receiver in the SAS phy. A SAS phy is a combination of the physical layer, phy layer and the link layer functions. A phy at the target and the initiator make up a physical connection. When multiple phy's are grouped together, it can be referred to as a "Wide Port". Once each pair of phys is connected together to form a physical link, the aggregate bandwidth of the port will incrementally increase.
The link layer is the third lowest layer and it interfaces with the SAS phy layer and the SAS Port layer. Its main purpose is to control the SAS phy layer to manage connections with other SAS devices. Next in the stack is the Port layer; it receives requests from the transport layer, interprets the requests, selects link layers (which in turn select phys that are used to establish connections), and forwards the requests to the selected link layer for transmission.
The second highest layer is the transport layer. This layer receives requests from the application layer, constructs frames and sends them to the port layer, validates the frames and notifies the application layer. Last but certainly not least is the application layer, whose main purpose is to create tasks for the transport layer to process.
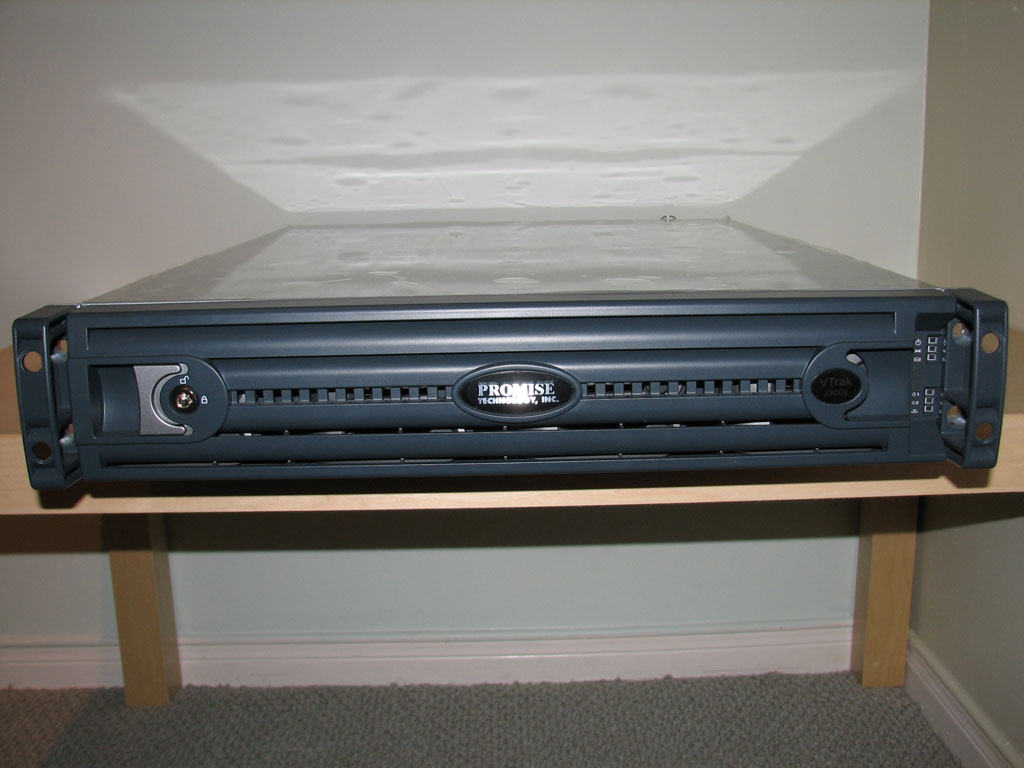
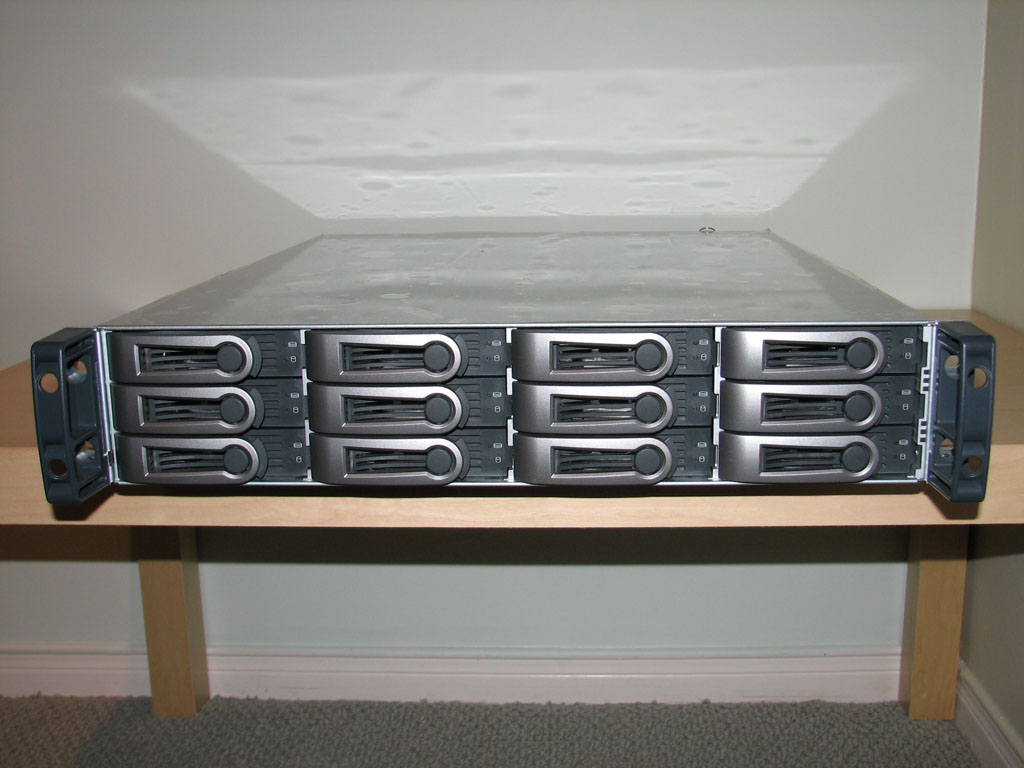
The Promise VTrak J300s
Promise has long been known for their involvement in the storage industry. If you can remember back to the early nineties (Ed: sorry if that makes some of you feel old...), Promise was making VESA EIDE accelerator cards. Maybe unknown to some are their VTrak products targeted at the small to enterprise storage consumer. They have iSCSI SAN solutions and a range of Direct Attached solutions like the VTrak J300s that we're evaluating in this article.
 |
 |
| Click to enlarge | |
The VTrak J300s is a 2U 12 drive RAID/JBOD solution capable of housing either SAS or SATA drives. It has the ability to daisy chain up to three additional chassis off the expansion port on the rear of the device. This would give you a total capacity of 24 TB when using 500GB SATA drives.
 |
 |
| Click to enlarge | |
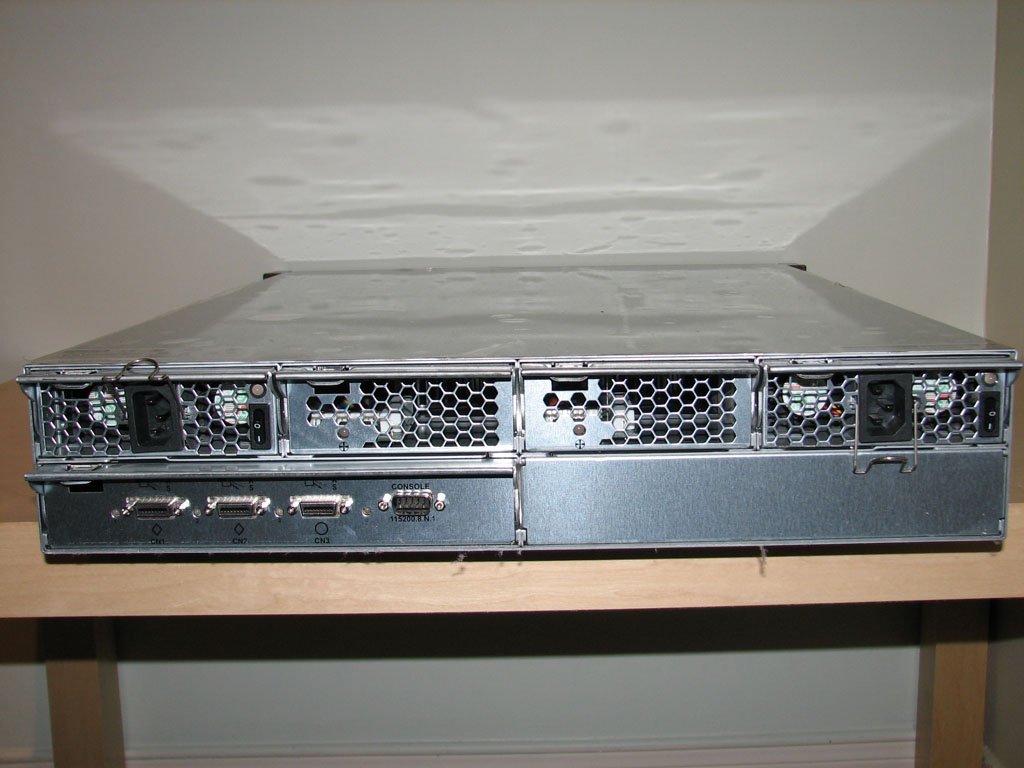
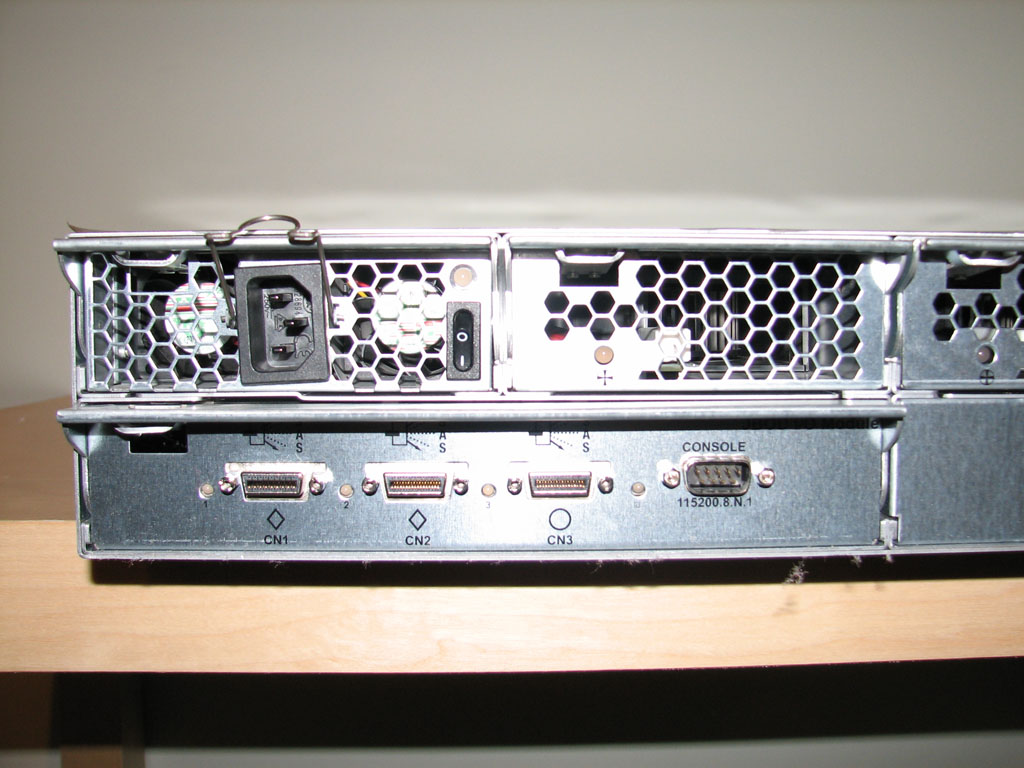
Each chassis has three 3 Gbit SAS 4x ports, two host ports and one expansion port for cascading the chassis together. If you're wondering what 4x ports are, it is another way to describe a wide port. As we discussed earlier in the article a wide port is made up over several links, in this case 4 links each with 3Gbit of bandwidth, which means that the 4x (wide port) is capable of 12 Gbit/sec of overall bandwidth.
Users can purchase an additional I/O module for redundancy, which also has three 3 Gbit 4x ports. Promise took reliability quite seriously with this unit; with redundant I/O, power, cooling, and monitoring there is no single point of failure. At the rear of the unit there is also a serial port that allows the administrator to use the Command Line Interface (CLI) and monitor the device remotely.
Management of the J300s was fairly simple and straightforward. The chassis and drives were identified by the RAID controller without any issue, including the Windows driver for the chassis. The CLI gives you access to a number of things such as fan speeds, voltages, temperature, SAS addresses, phy status, error counters, etc. It also lists vital product data for field replaceable units, current firmware version, uptime, and thermal management control. We found the CLI to be easy to navigate, and complete documentation is provided on its use.
Test configuration
Testing of the VTrak was performed using build 2004.07.30 of the open-source benchmark IOMeter since it has a very large amount of flexibility when testing storage subsystems. The operating system used was Windows 2003 Server R2 since it supports GPT disks, which are necessary when you want to use more than 2TB per physical volume.
We decided to run a variety of tests on the drives that allowed us to scale the amount of random accesses vs. sequential, as well as a low to high disk queue length (DQL). The purpose of this is so we can see how well the interfaces perform from high throughput to high latency, as well as from light to heavy disk loads.
For those of you unfamiliar with Disk Queue Length, it is a performance counter that indicates the number of outstanding disk requests as well as requests currently being serviced for a particular disk. Microsoft recommends a value of no more then 2 per physical drive, though some seem to think this could be as high as 3 per drive.
The Disk Queue Length counter is commonly used to determine how busy a particular drive is, such as the one hosting a database. If the DQL for a database array averages 2 per drive or more, it is a good indication that disk I/O is becoming a bottleneck and that upgrading your disk subsystem could result in increased performance. Alternatively, if it averages less then 2 per drive, upgrading CPU or memory may be more beneficial since the disk subsystem is able to keep up with the current workload.
Using the LSI 8480E / ServeRAID 6M controller, we created a large RAID 10 array using all 12 disks. The operating system was hosted by a separate controller and pair of disks so that it would not impact the results. The drive was then formatted using all of the drive in one NTFS volume with a 64K Allocation Unit size.
For testing purposes, we started with a DQL of 2 (which works out to 0.167 DQL per drive) and then incremented the number by two until we reached 36 (3 DQL per drive). We wanted to see how each interface would scale from light to heavy workloads. We did not test above a DQL of 3 since most experts advise against running a storage system at this level for an extended period of time.
Since the number of ways storage can be accessed is huge, we decided to run tests that would give us a good indication of performance for almost any scenario. For example, we ran tests at 100% Sequential in the event you need to stream lots of sequential data off the drives. On the other hand you may have an application that is extremely random and you want to know how well it performs under this type of load. We also measured with a mix of random/sequential accesses at key points to better understand how much random access impacts a sequential stream.
Lastly, we used 64K access sizes for IOMeter, the NTFS Allocation unit, and RAID Stripe size. We did this to obtain the best performance possible for all drives/interfaces, but this is also beneficial since most databases use 64K access sizes when reading/writing data.
Test hardware
1 x Promise VTrak J300s with single I/O module
1 x LSI Logic 8480E PCI-E SAS HBA
12 x Seagate NL35.1 250GB SATA I Drive
12 x Western Digital 500GB WD5000YS SATA II Drive
12 x Fujitsu MAX3147RC 146GB 15K SAS Drive
1 x IBM EXP400 Chassis
1 x IBM ServeRAID 6M PCI-X SCSI HBA
12 x IBM 146GB 10K SCSI Drives
We'd like to thank Jennifer Juwono and Billy Harrison from Promise, David Nguyen from Western Digital, along with Seagate, Fujitsu and LSI Logic for providing the hardware to conduct this article.
Test results - Read Performance
100% Sequential Reads
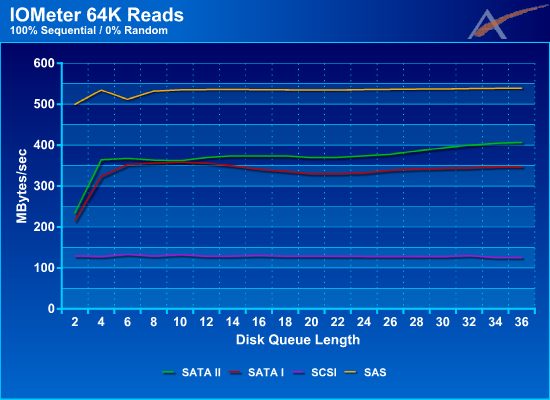
| 100% Sequential Read Performance (MB/Sec) | |||
| 1 DQL/Disk | 2 DQL/Disk | 3 DQL/Disk | |
| SAS | 536 MB/sec | 536 MB/sec | 540 MB/sec |
| SATA II | 370 MB/sec | 374 MB/sec | 407 MB/sec |
| SATA I | 356 MB/sec | 333 MB/sec | 348 MB/sec |
| SCSI | 129 MB/sec | 128 MB/sec | 126 MB/sec |
When we first gathered the test data together, we were very impressed with the results. Both SAS and SATA I/II show extremely high performance with 100% sequential accesses. The SCSI and SAS drives are similar in terms of capacity while the SAS drives offer higher rotational speeds. Meanwhile, the SATA drives are all 7200 RPM models, theoretically offering less performance but higher capacities than either of the other two solutions.
We can really see the benefit a point-to-point architecture has to offer, as well as the impact the shared bus has on performance. All of the SAS/SATA solutions offer much higher read performance than the SCSI offering here, which helps to explain why SAS solutions are rapidly increasing market share. SCSI Ultra320 can't even come near its theoretical 320 MB/s transfer rates due to sharing overhead. Strangely, we see SCSI and SATA I drop slightly as the DQL increases, while SAS and SATA II increase slightly.
It is interesting to note the performance at low Disk Queue Length between the different technologies. Both SAS and SCSI are very close to their peak performance even at a DQL of 2, whereas SATA needs a DQL of 4 before it starts performing well. As the Disk Queue Length increases, both SAS and SCSI hold their performance well, and a gap starts to emerge between SATA I and SATA II.
95% Sequential Reads
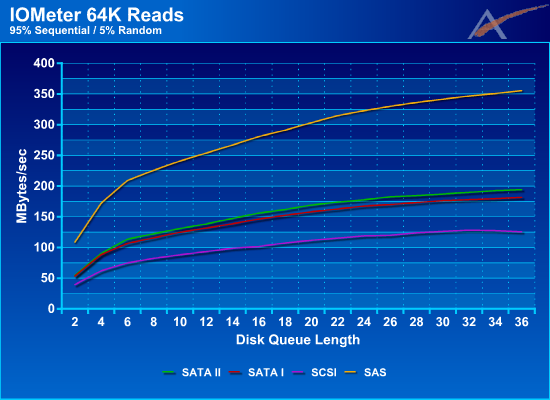
| 95% Sequential Read Performance (MB/Sec) | |||
| 1 DQL/Disk | 2 DQL/Disk | 3 DQL/Disk | |
| SAS | 254 MB/sec | 323 MB/sec | 356 MB/sec |
| SATA II | 138 MB/sec | 178 MB/sec | 194 MB/sec |
| SATA I | 132 MB/sec | 167 MB/sec | 182 MB/sec |
| SCSI | 93 MB/sec | 119 MB/sec | 126 MB/sec |
Here we start to see the impact that randomness has on our read performance. SAS is still in the lead but SCSI is starting to catch up to SATA I/II. The higher rotational speeds of SCSI and SAS solutions can help relative to most SATA offerings, as access times depend in part on rotational latency. Performance continues to grow through the whole range of Disk Queue Length with SAS breaking 350MB/sec around 34. This is significantly higher then the 175-200MB/Sec of SATA I/II and 125MB/Sec that SCSI is able to obtain.
Again, we see the benefit that the point-to-point architecture has to offer over the old shared bus architecture. SATA II maintains a slight lead over SATA I, but both don't even come close to touching SAS. SCSI gains ground, but given the maximum throughput of around 130 MB/s that was measured in the 100% sequential test, it still trails by a large margin in this workload.
80% Sequential Reads
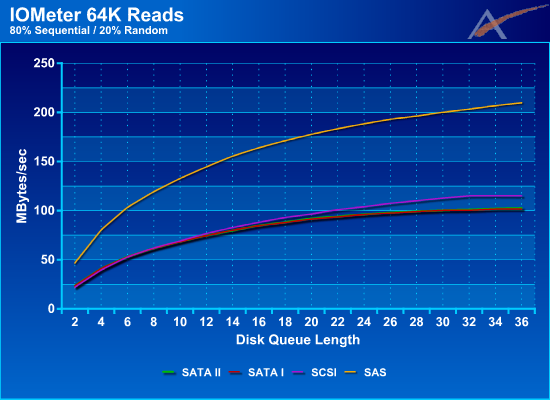
| 80% Sequential Read Performance (MB/Sec) | |||
| 1 DQL/Disk | 2 DQL/Disk | 3 DQL/Disk | |
| SAS | 144 MB/sec | 188 MB/sec | 210 MB/sec |
| SATA II | 75 MB/sec | 96 MB/sec | 103 MB/sec |
| SATA I | 74 MB/sec | 96 MB/sec | 102 MB/sec |
| SCSI | 77 MB/sec | 104 MB/sec | 115 MB/sec |
At 20% Random Reads we start to see SATA I/II losing its performance advantage over SCSI, while SAS clearly remains as the performance leader. We continue to see performance grow as the DQL increases, but it's interesting to see that SAS is ramping up faster then everyone else. SATA I and SATA II are struggling to keep up with SCSI which has now moved into second place. At this point, the performance of SATA I and SATA II are almost identical.
Random (0% Sequential) Reads
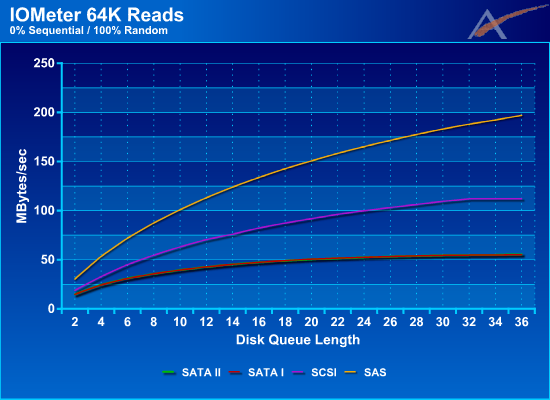
| Random Read Performance (MB/Sec) | |||
| 1 DQL/Disk | 2 DQL/Disk | 3 DQL/Disk | |
| SAS | 113 MB/sec | 165 MB/sec | 197 MB/sec |
| SATA II | 43 MB/sec | 53 MB/sec | 56 MB/sec |
| SATA I | 43 MB/sec | 53 MB/sec | 55 MB/sec |
| SCSI | 70 MB/sec | 100 MB/sec | 112 MB/sec |
In the previous graphs we've seen the impact that random data has on our overall throughput. Now that we are at 100% Random accesses, we get to see how the drives perform in a 'worst-case' scenario. SAS continues to take the performance lead by throughput that's almost double that of SCSI, but now SCSI is almost twice as fast as SATA I/II. Looking at the results through the whole DQL range, SAS continues to grow without showing signs of slowing down, whereas SCSI and SATA I/II appear to level off around 32-36 DQL.
While a point-to-point architecture clearly has advantages with sequential accesses, there is still something to be said about spindle speed and disk firmware. However, given that SCSI maxed out at ~130 MB/s in the sequential testing, higher spindle speeds would only go so far in closing the gap between SCSI and SAS. SATA drives like Western Digital's 10K RPM Raptor should also be able to close the distance with SCSI in highly random usage scenarios.
We've covered the read performance, but what happens when we test writes?
Test results - Write Performance
100% Sequential Writes
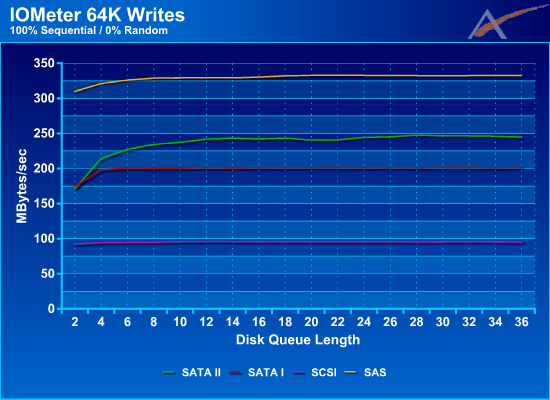
| 100% Sequential Write Performance (MB/Sec) | |||
| 1 DQL/Disk | 2 DQL/Disk | 3 DQL/Disk | |
| SAS | 329 MB/sec | 333 MB/sec | 333 MB/sec |
| SATA II | 242 MB/sec | 245 MB/sec | 245 MB/sec |
| SATA I | 201 MB/sec | 201 MB/sec | 202 MB/sec |
| SCSI | 96 MB/sec | 96 MB/sec | 95 MB/sec |
Using 100% sequential writes we get to see what the 'best-case' is for overall write throughput. SAS has once again taken the lead achieving over 325MB/sec, SCSI falls behind but maintains a solid rate almost reading 100MB/sec, but SATA I/II has a different story to tell. While starting out very close to one another, SATA II quickly jumps ahead of SATA I by almost 50MB/sec and maintains that lead throughout the DQL range. This may be the result of having 16MB of disk cache on the SATA II drives vs. the 8MB cache on SATA I. It will be interesting to see what impact this has as we introduce random access into the tests.
It's worth noting that maximum write performance is substantially lower than maximum read performance. All of the tested drives are at least 20% slower. There is some logic to this, however, as typical storage usage tends to be far more write heavy than read heavy, so optimizing for better read performance makes sense.
95% Sequential Writes
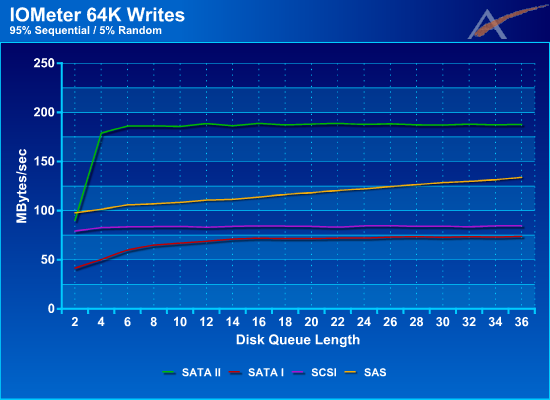
| 95% Sequential Write Performance (MB/Sec) | |||
| 1 DQL/Disk | 2 DQL/Disk | 3 DQL/Disk | |
| SAS | 111 MB/sec | 122 MB/sec | 134 MB/sec |
| SATA II | 189 MB/sec | 188 MB/sec | 188 MB/sec |
| SATA I | 69 MB/sec | 72 MB/sec | 74 MB/sec |
| SCSI | 83 MB/sec | 85 MB/sec | 84 MB/sec |
Now this was very surprising. SATA II has jumped ahead of everyone else and is leading at almost 180MB/sec from a DQL of 6 to 36, whereas SAS is struggling to reach 140MB/sec by the time it gets to a DQL of 36. Both SCSI and SATA I maintain a sub 100MB/sec performance with SATA I being slightly lower then SCSI. This created a lot of discussion inside our team that lead to a lot of testing and retesting of the drives. The results you see here are accurate and reflect what we were able to achieve with IOMeter.
Let's step back for a minute and go back to the 64K Read graphs. If we look at the impact adding 5% random access had to reads, SAS dropped 34%, SATA I 48%, SATA II 52%, and SCSI 0%. When we look at 64K Writes with 5% random access, SAS drops 60%, SATA I 63%, SATA II 23%, and SCSI 11%. We continue to see a significant drop with writes as we did with reads, though SATA II clearly has an advantage with writes.
It appears then that the 16MB cache on the SATA II drives is reducing the performance impact random access has to overall write throughput. Since reads must come right from the platters, this extra cache won't really be that advantageous to reads. Also, the SATA II drive has NCQ, but so do SAS and SCSI. NCQ should only bring us closer to SAS/SCSI but not surpass them. Since writes can be cached and could benefit from a larger cache, this is the only difference we could find that explains the high SATA II performance.
As the data stream becomes more and more random, the advantage the extra cache gives SATA II drives should be reduced since it won't be able to flush the data from cache to the disk as quickly as with 95% sequential writes. Let's find out with empirical testing, though.
80% Sequential Writes
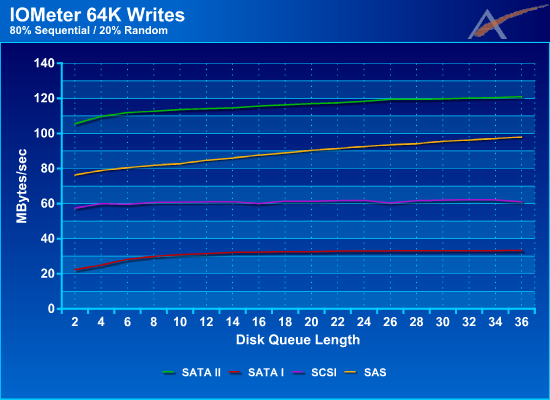
| 80% Sequential Write Performance (MB/Sec) | |||
| 1 DQL/Disk | 2 DQL/Disk | 3 DQL/Disk | |
| SAS | 85 MB/sec | 93 MB/sec | 98 MB/sec |
| SATA II | 114 MB/sec | 118 MB/sec | 121 MB/sec |
| SATA I | 32 MB/sec | 33 MB/sec | 33 MB/sec |
| SCSI | 61 MB/sec | 62 MB/sec | 61 MB/sec |
In this graph we start to see SAS catching up to SATA II. It appears the advantage SATA II had with the extra cache is starting to decrease as the access type becomes more random. SCSI holds fairly steady around the 60MB/sec mark while SATA I drops far behind everyone else.
Random (0% Sequential) Writes
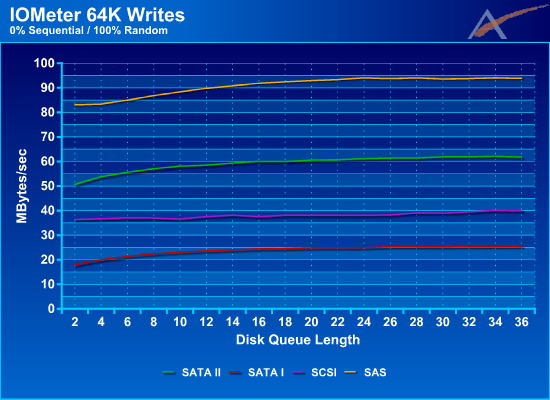
| Random Write Performance (MB/Sec) | |||
| 1 DQL/Disk | 2 DQL/Disk | 3 DQL/Disk | |
| SAS | 90 MB/sec | 94 MB/sec | 94 MB/sec |
| SATA II | 59 MB/sec | 61 MB/sec | 62 MB/sec |
| SATA I | 24 MB/sec | 25 MB/sec | 25 MB/sec |
| SCSI | 38 MB/sec | 38 MB/sec | 40 MB/sec |
Now we see our 'worst-case' scenario, 100% random writes. SAS takes back the lead at 94MB/sec which is rather impressive when you consider it was at 98MB/sec @ 20% random. SATA II is in second place at 62MB/sec, which translates into a 50% drop from the last test. SCSI maintains third place at 40MB/sec, and SATA stays in last place at 25MB/sec.
Again, spindle speeds of the various offerings could help improve performance, but only to a certain extent. Additional cache is also clearly beneficial, as SATA maintains a strong second place showing. There's still a lot to think about, however, so let's take a look at the overall picture.
Closing Thoughts
We've run quite a few tests, and encountered some surprising results. What exactly does all this tell us? We've only truly tested four different drives, each representing one of the current interface standards. Ideally, we would have tested nearly identical drives on each interface, but sometimes that's just not possible. Even with differences in basic features, however, we can draw some meaningful conclusions.
SAS
SAS clearly dominates when it comes to pure I/O throughput with the exception of 5%-20% random writes. With the introduction of a Point-to-Point topology, the performance floodgates have been opened and I/O reads of up to 540MB/sec with just 12 drives are now achievable. Even writes have jumped from 95MB/sec on SCSI to over 330MB/sec with SAS. It's also amazing to see that with just 12 drives in a RAID 10 you can almost guarantee a minimum of 100MB/sec sustained for both reads and writes in any combination.
SATA I/II
It's hard to find a good place for SATA I and II when it comes to performance. Reads for both types can hold their own against SCSI when the access type is between 0 and 20% random, but after that they are slower. SATA II performs extremely well with writes from 0 to 100% random, but SATA I drops below SCSI as soon as you reach 5% random. So why would you want SATA I or II? Put simply, the cost per GB of SATA cannot be touched by SAS or SCSI, which makes SATA the perfect choice for high capacity, albeit slower storage. If you are considering this type of configuration, we would strongly recommend buying drives with a large disk cache, as it appears they can improve your writes significantly.
The Raptor line is also unique at present, as it is the only 10K RPM SATA solution and it also comes with a 16MB cache. It is "only" an SATA I interface, but without further testing it's difficult to say for certain how much of the SATA II performance advantage is due to the interface and how much simply comes from having newer hard drive models with more cache. We're inclined to think the cache and platter density is playing a significant role, along with NCQ support, as each individual drive shouldn't be able to come anywhere near saturating SATA's 150MB/s bandwidth limit per connection.
The simple fact of the matter, however, is that no businesses looking at something like the VTrak J300s (or any other SAS enclosure) are going to really be interested in the Raptor line. Most will want a high performance, low capacity SAS drive array, perhaps complemented by a few high capacity SATA drives. The Raptor is either not fast enough or not large enough; the lower price of the Raptors vs. 15K SAS models doesn't normally enter the picture.
SCSI
SCSI still has its place in the server market when you compare it against SATA I/II, but it simply cannot touch SAS. SCSI has been around for a long time now, and SAS is clearly the next logical step. When you work on a drive by drive basis we're sure the gap between SAS and SCSI will be very small, but as you add more drives to the array the point-to-point architecture clearly wins. As time has progressed, SCSI drives have become faster and faster, but the shared bus architecture is definitely holding them back. This is very apparent when you consider how little SCSI drops from 0% random to 100% random in both reads and writes. Higher RPM drives would drop even less, but they still won't be able to improve on the bandwidth limits we encountered. The only way to improve overall bandwidth is to move to multiple SCSI connections, which can improve performance but comes with increased costs and more cable clutter.
Performance Conclusion
Both SAS and SATA I/II have their place in the Direct Attached Storage market. If your application needs high I/O throughput and can reside on low to medium capacities, then SAS is definitely the way to go. If you need high capacity more than you need high I/O then SATA I/II is the best choice. Of course with 300GB SAS drives (soon to be 600GB) you can still reach very high capacities, but at a cost that is significantly higher than with SATA. In the end you have to balance performance vs. cost and determine which is best for you.
Conclusion
Through our testing the Promise VTrak J300s has proven itself to be a reliable solution with good performance that is well suited for the SMB world. The ability to use high capacity SATA or high performance SAS in the same chassis gives users a new level of flexibility that wasn't an option before. Add to that the new performance levels that SAS can obtain vs. SCSI and DAS becomes a feasible solution again before moving to a full Fiber/SAN infrastructure. Of course when that time comes, it can be filled with high capacity SATA disks and still be useful for hosting a Virtual Tape Library, NAS backend, or long term data storage.
At the time of writing Shopping.com reported a price of $2,100 to $2,500 USD for the VTrak J300s, which is a decent price for an external SAS/SATA chassis. We had a hard time coming up with things to say about our experience with the Promise VTrak because it simply just worked, and in the end, isn't that what we're all looking for?


