Original Link: https://www.anandtech.com/show/2106
Intel P965: Mid-Range Performance Sector Roundup
by Gary Key on October 20, 2006 9:00 PM EST- Posted in
- Motherboards
We have to say that our P965 roundup has taken a lot longer than expected and is certainly one of largest and most comprehensive motherboard articles that we have generated this past year. The reasons for the delays are numerous but the end is finally in sight as over the course of the next ten days we will present results on more than a dozen P965 motherboards in three different categories.
It seemed like every time we were nearing completion on the article another motherboard would arrive for testing or at the very least another BIOS would arrive that promised to fix all issues and save the world at the same time. Call us suckers, but we tested every one and looking at the front page news today none of them saved the world but some of them saved a harsh opinion of the board. Since we started our testing seven weeks ago the size of the article has gone from seven to thirteen, maybe fifteen boards now as two exclusives just arrived in the labs today. We promise no more delays but maybe just maybe with some decent coffee and a trouble free BIOS we can get these two boards into the review.
In the time since we started this article we have tested forty three different BIOS releases and have provided numerous reports back to the motherboard manufacturers. Some have listened, some have not, and a couple did not need any real feedback as they got it almost right the first time. Those are the boards that we really liked and our comments will probably reflect that simple fact. We have fielded hundreds of questions from our readers and in the process we hopefully assisted enough so that the egg patrol will not need to be stationed at the front of the office for anyone upset about the delay in the article.
Even though we have a myriad of reasons both reasonable and some not about the delay in the article we have enjoyed every minute of the process. As the scope of the project grew we determined that a single article could not cover all of the motherboards in detail. It soon grew to two and now three articles. We decided to group the boards by category in order to have boards with similar features and cost compete directly against each other. We felt like this was fair to the motherboard manufacturers and would show the strengths or weaknesses of each board in its market sector. However, at the end of this roundup it comes down to which motherboard offers the best overall price, performance, support, and reliability for the user.
Our first category today has five different motherboards all situated in the midrange performance sector with pricing from $140 to $170 on average. The features on each board are all comparable and each is targeted to the same audience. That audience is typically the group of users that expects to get as much out of their motherboard and CPU as possible and are not willing to spend the additional money for the high end 975X or P965 CrossFire boards.
There are some anomalies in our categories as based upon price the MSI P965 Platinum should be in this first category but due to its features it will go up against the Asus P5B-Deluxe and Gigabyte GA-965P-DQ6, which should make for an interesting shootout. These three boards and the newly arrived ECS PV1 Extreme will make up our third and final category of boards with high end features that are capable of running ATI CrossFire.
Our second category that will be published next week consists of what we consider to be the budget sector and includes boards from ECS, Foxconn, Intel, and Gigabyte. We can tell you right now that there are a couple of surprises in this group that should give the mid-range performance boards a few reasons to worry about their pricing structure.
We will recap the strengths and weaknesses of our boards at the end of each article and provide a complete analysis of all motherboards in our final article. We will determine at that time the winners and losers by category and present Editor's choice awards for the deserving. We will also present for the first time a reliability and support study on each board. Our motherboards for this roundup have at least three hundred hours of benchmark, usability , and stress testing (except for the two that arrived today) completed at this point. We feel like this study is important when considering a purchase decision and to further stir the pot, three of the five boards tested today failed the 100 hour overclocking torture test. They are being inspected by the manufacturer currently and hopefully we will have answers before our final article is published.
With all that said, let's get started and see how well our first set of boards performs today.
Abit AB9 Pro: Feature Set
| Abit AB9-Pro | |
| Market Segment: | Mid-Range Performance |
| CPU Interface: | Socket T (Socket 775) |
| CPU Support: | LGA775-based Pentium 4, Celeron D, Pentium D, Pentium EE, Core 2 Duo, Core 2 Extreme |
| Chipset: | Intel P965 + ICH8R |
| Bus Speeds: | 100 to 600 in 1MHz Increments |
| Memory Speeds: | Auto, 533, 667, 800 |
| PCIe Speeds: | Auto, 100MHz~200MHz in 1MHz Increments |
| PCI: | Fixed at 33.33MHz |
| Core Voltage: | Auto, Base CPU V to 1.7250V in 0.0250V increments |
| CPU Clock Multiplier: | Auto, 6x-11x in 1X increments if CPU is unlocked, downwards unlocked, Core 2 Duo |
| DRAM Voltage: | 1.75V ~ 2.50V in .05V or .10V increments |
| DRAM Timing Control: | SPD, 4 DRAM Timing Options |
| MCH Voltage: | 1.25V ~1.45 in .05V increments |
| ICH Voltage: | 1.50V ~1.70 in .05V increments |
| Memory Slots: | Four 240-pin DDR2 DIMM Slots Dual-Channel Configuration Regular Unbuffered Memory to 8GB Total |
| Expansion Slots: | 1 - PCIe X16 2 - PCIe X1 2 - PCI Slot 2.3 |
| Onboard SATA/RAID: | 6 SATA 3Gbps Ports - (RAID 0,1,5, 1+0,JBOD) - Intel ICH8R 2 SATA 3Gbps Ports - (RAID 0,1,JBOD) - JMicron JMB363 1 SATA 3Gbps Ports - Silicon Image 3132 1 e-SATA 3Gbps Ports - Silicon Image 3132 |
| Onboard IDE: | 1 ATA133/100/66 Port (2 drives) - JMicron JMB363 |
| Onboard USB 2.0/IEEE-1394: | 10 USB 2.0 Ports - 4 I/O Panel - 6 via Headers 2 Firewire 400 Ports by TI TSB43AB23 |
| Onboard LAN: | Gigabit Ethernet Controller - PCI Express Interface Realtek RTL 8168 |
| Onboard Audio: | Realtek ALC882D HD-Audio 8-channel CODEC |
| Power Connectors: | ATX 24-pin, 4-pin EATX 12V, 4-pin 12V Molex |
| I/O Panel: | 1 x PS/2 Keyboard 1 x PS/2 Mouse 1 x S/PDIF Optical In 1 x S/PDIF Optical Out 1 x Audio Panel 2 x RJ45 1 x eSATA 4 x USB 2.0/1.1 |
| BIOS Revision: | Award 1.5 |
Abit has delivered a well optioned and performance oriented P965 board that sells for around US $145. We tested with the 1.5 beta BIOS release after having some issues with overclocking utilizing the 1.4 BIOS. Also, the 1.5 BIOS allows downward multipliers with the Core 2 Duo processors while further improving system performance and stability. Our issues with the BIOS revolved around its pinkish display color but more importantly the fact that Abit only allows the basic four memory timings to be changed (tCAS, tRCD, tRP, tRAS). For a board of this caliber we believe this is definitely a mistake. The ability to increase the CPU voltage to 1.725V and memory to 2.50V is impressive considering the offerings on the other P965 based boards. However, we wish the memory settings above 2.30V were available in .05V increments.
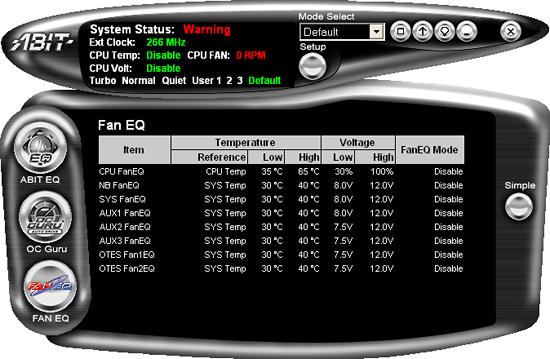
One area where Abit has constantly led all others is in the ability to overclock and monitor most system functions from Windows. Abit once again includes their excellent µGuru Windows utility that allows the user to overclock the system, change certain voltages, adjust fan speeds, and monitor hardware settings in real time without the need for rebooting. The OC Guru worked very well during our overclock testing and was a pleasure to use without resorting to the constant reboot procedure utilized by other Windows based utilities.
We also set the automatic overclocking to the Turbo setting and were greeted with a 7x288FSB setting for a CPU speed of 2016MHz that we would not consider turbo speed. Our memory was set to DDR2-800 but with 5-5-5-15 settings. This represents an 8% overclock of our component choices. Further information about this class leading utility can be found here.
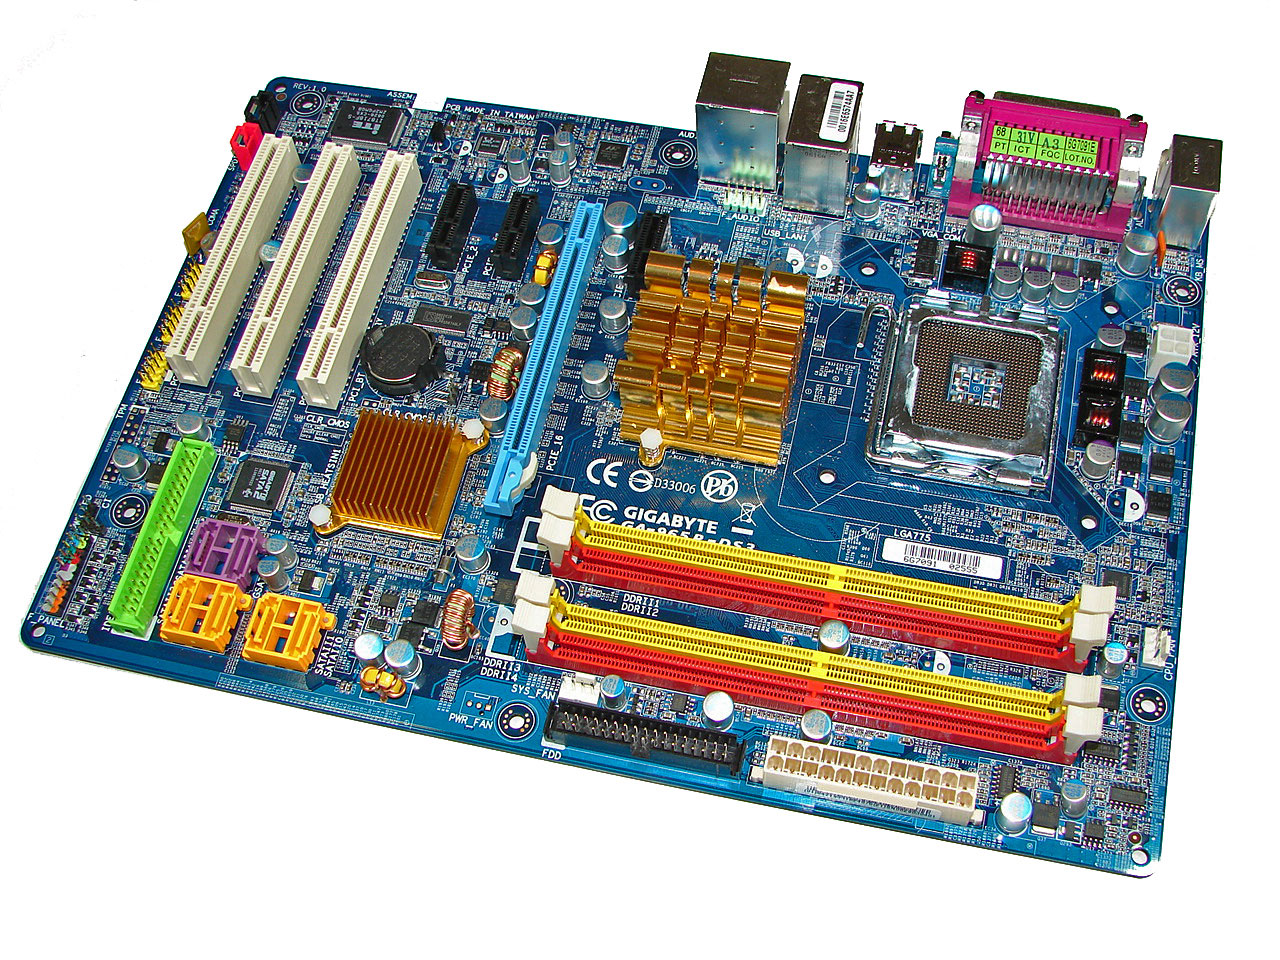
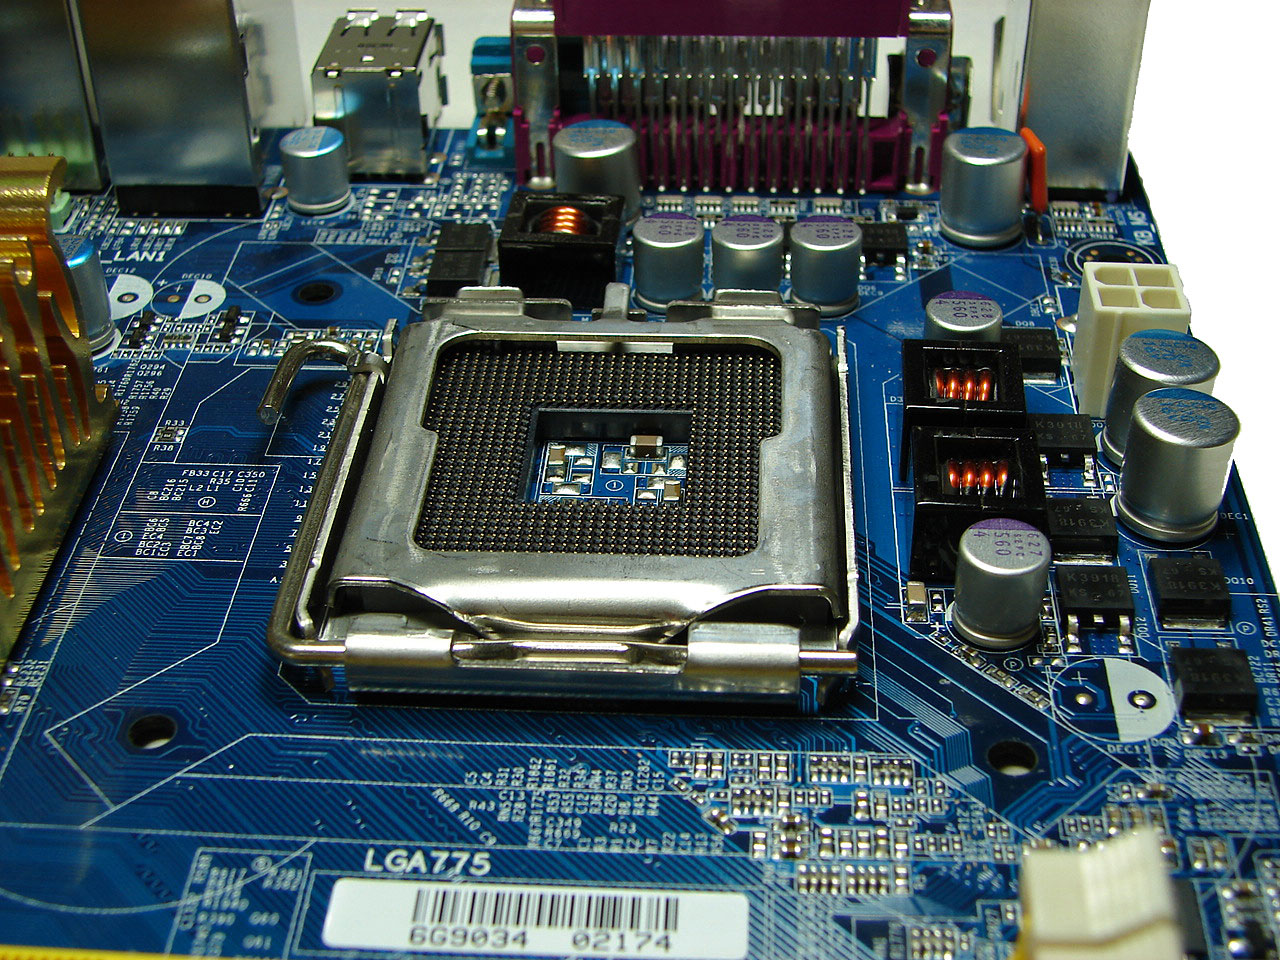
Abit AB9 Pro: Board Layout and Features
 |
| Click to enlarge |
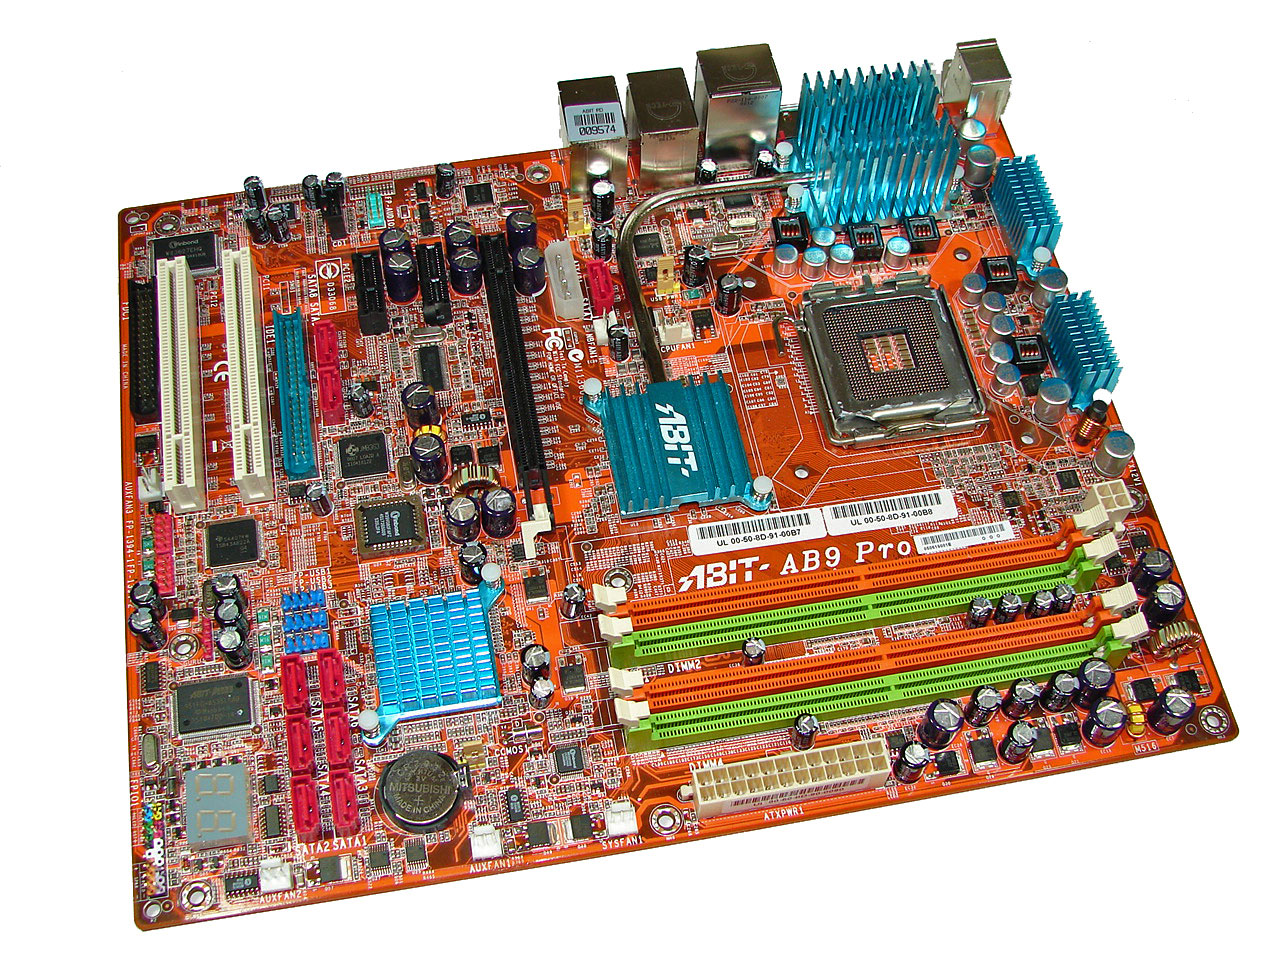
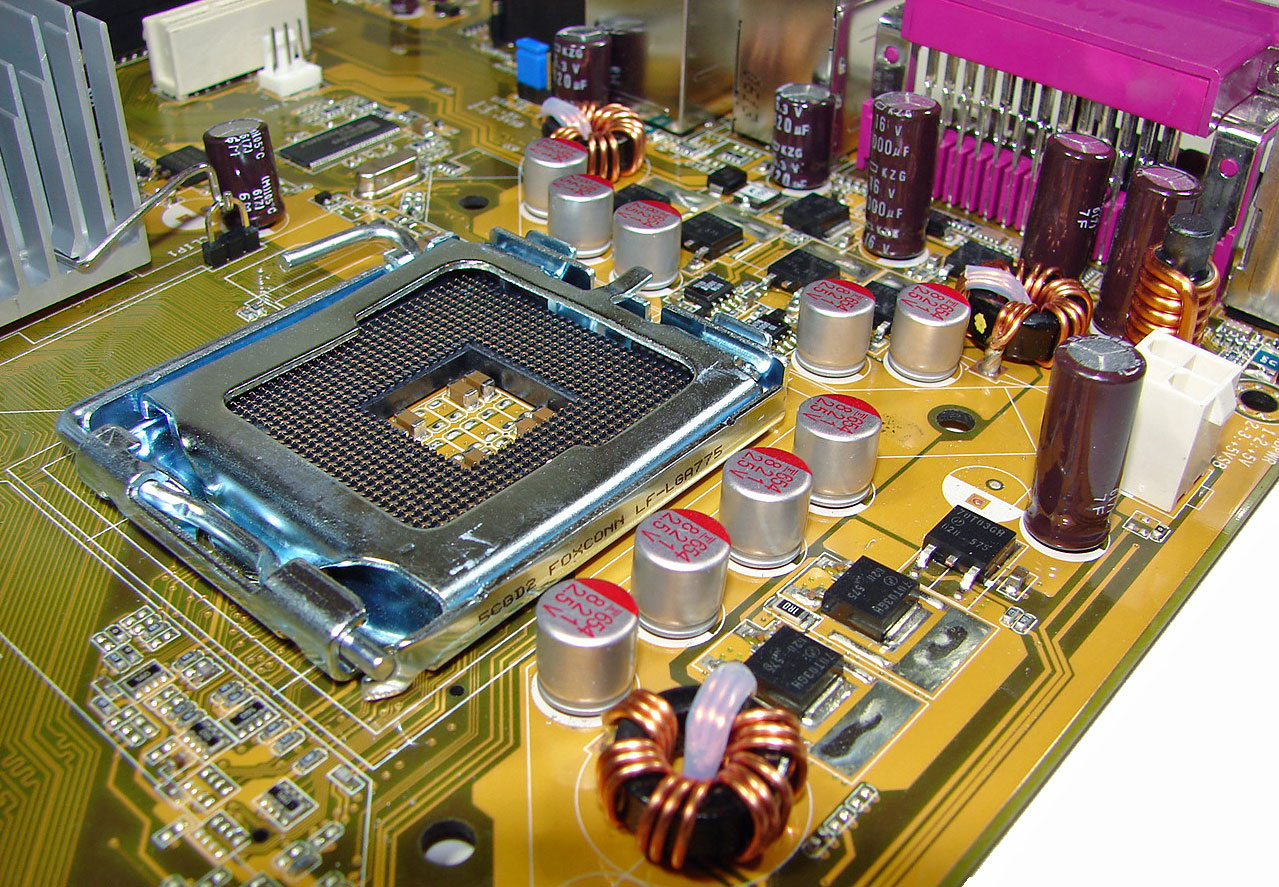
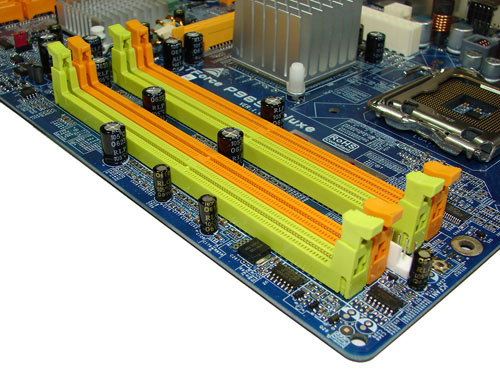
Abit designed a board that has one of the more interesting layouts we have seen in a long time. While the board was very easy to install in our mid-size ATX case we did have some issues with utilizing our Optical drive in the top bay due to the location of the JMicron powered IDE port that is located in between the number two PCI Express x1 slot and the number one PCI slot. There are six fan headers on the board that can be controlled by the µGuru Windows utility. The Abit board features an excellent five-phase voltage regulator power design with high quality capacitors located in each major component section of the board that yielded superb stability.
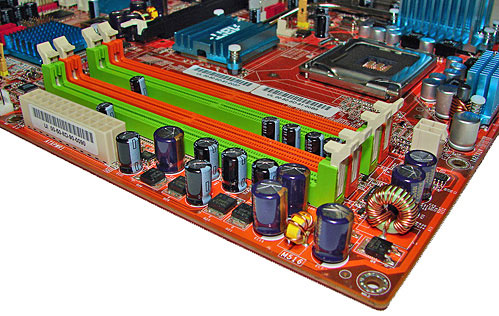
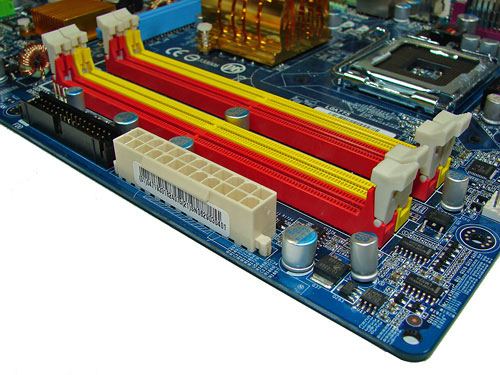
The DIMM module slots' color coordination is correct for dual channel setup based upon the premise of installing DIMMs in the same colored slots for dual-channel operation. The memory modules are easy to install with a full size video card placed in the first PCI Express x16 slot. The 24-pin ATX power connector is located along the edge of the board along with a series of capacitors for the memory modules. Abit places the four-pin 12v auxiliary power connector at the top of the first memory module but completely out of the way of aftermarket cooling solutions we utilized.
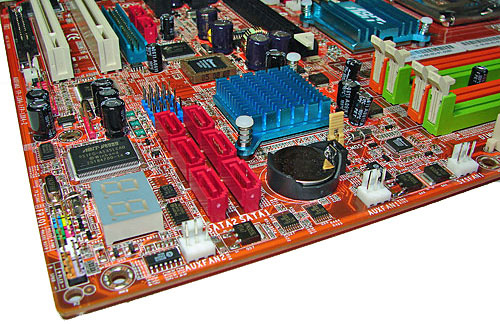
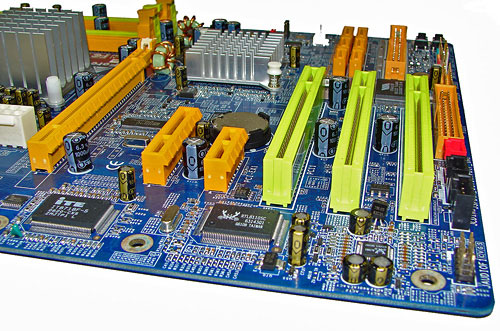
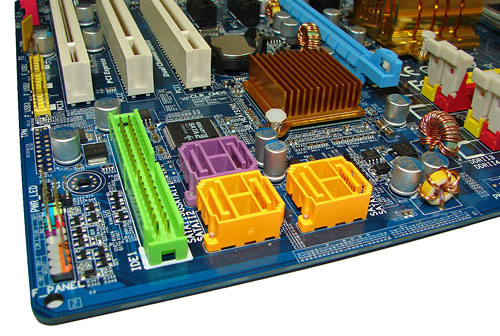
The six Intel ICH8R SATA ports are color coded red and are conveniently located to the left of the ICH8R Southbridge and battery. The SATA ports feature the newer clamp and latch design. We found the positioning of the SATA ports to be excellent when utilizing either the PCI-E x1 or PCI 2.3 slots. The ICH8R is passively cooled and remained cool to the touch throughout testing.
The first three of five auxiliary fan connectors are located at the bottom edge of the board. The clear CMOS jumper is color coded yellow and is located in between the battery and ICH8R chipset. The CP80P post port debug LED, chassis panel, µGuru chipset, and red 1394a connectors are located along the left edge of the board. The blue USB 2.0 connectors are located above the SATA ports.
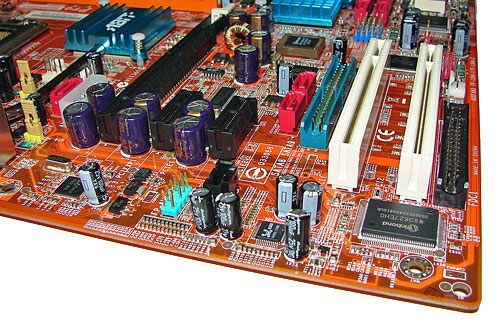
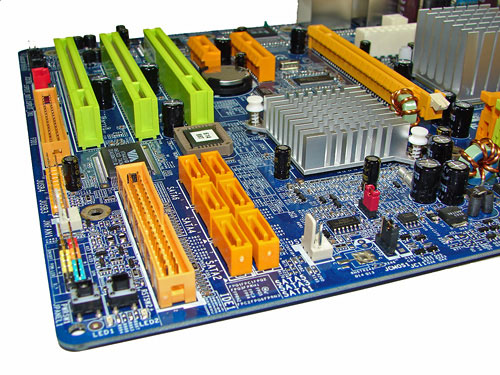
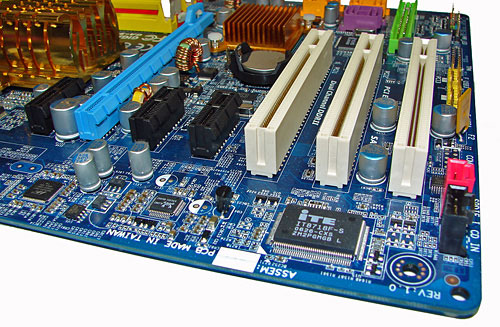
The board comes with (1) physical PCI Express x16 connector, (2) PCI Express x1 connectors, and (2) PCI 2.3 connectors. The layout of this design offers a very good balance of expansion slots for a mainstream board while providing excellent clearance space for graphics card utilization. However, the layout in this area is very unusual if not a bit chaotic. Our main issue is the location of the floppy drive connector at the bottom of the board along with the JMicron JMB363 IDE and SATA ports being sandwiched in between the PCI-E and PCI slots in the middle of the board.
The four-pin Molex power connector that will be required for future GPU products is located above the PCI-E x16 slot along with the Silicon Image 3132 SATA port. Abit informed us some of the unusual port locations were predicated upon ensuring proper power delivery, stability, and trace layouts based upon the capacitor locations. However, we still have to wonder if some of these layout choices were design gaffe that accidentally made it into production.
 |
| Click to enlarge |
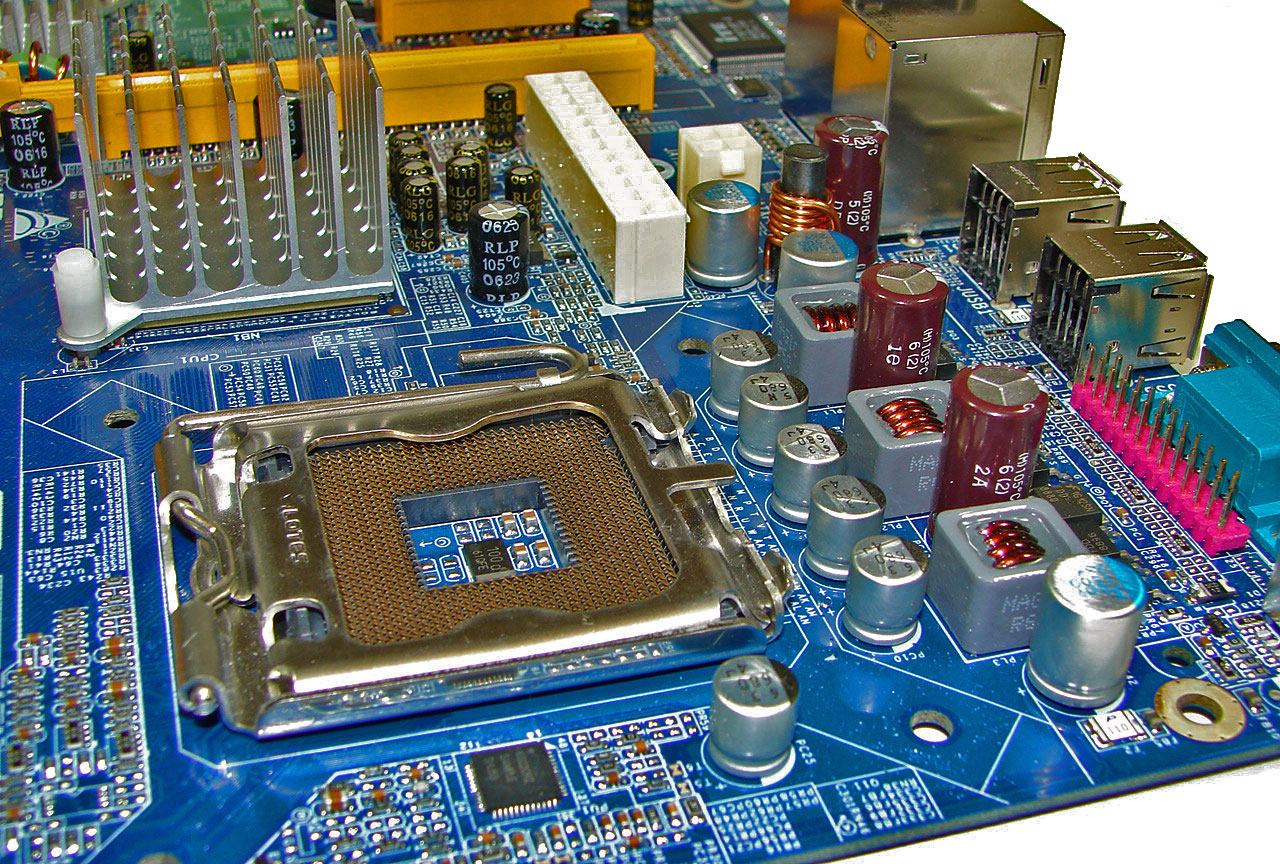
Returning to the CPU socket area, we find an ample amount of room for alternative cooling solutions. We utilized the stock heatsink/fan in our normal testing but also verified a couple of larger Socket-775 cooling solutions such as the Tuniq Tower 120 would fit in this area during our overclocking tests.
The Intel P965 MCH chipset is passively cooled with a low rise heatsink unit that did not interfere with any installed peripherals. This heatsink is part of the Abit Silent OTES technology that includes a heatpipe system and additional passive cooling for the VRM components. This system kept the MCH cool enough that additional chipset voltage was not a factor in our overclocking tests.
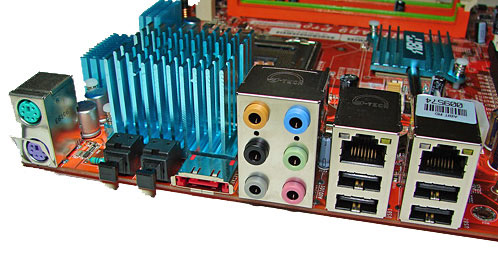
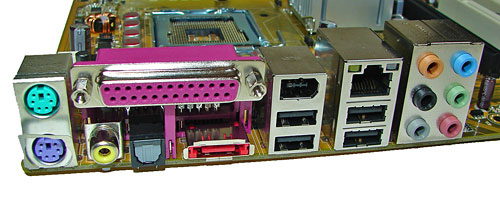
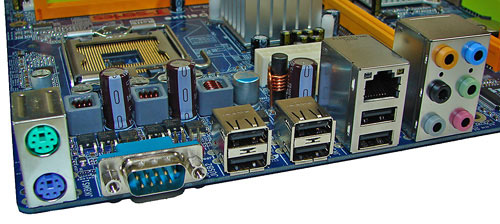
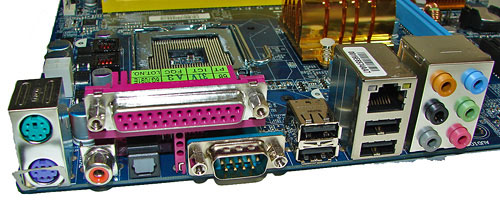
The rear panel contains the standard PS/2 mouse and keyboard ports, LAN ports, and 4 USB ports. The LAN (RJ-45) ports have two LED indicators representing Activity and Speed of the connection through the Realtek RTL8168 Gigabit PCI-E chipset. The audio panel consists of 6 ports that can be configured for 2, 4, 6, and 8-channel audio connections for the Realtek ALC 882D HD codec. The panel also consists of two S/PDIF (optical in/optical out) ports, and an external SATA 3Gb/s port via the Silicon Image 3132 chipset. All in all, Abit included an excellent combination of ports although another two USB ports would have been handy for additional peripherals.
Abit AB9-Pro: Overclocking
FSB Overclocking Results
| Abit AB9-Pro Overclocking Testbed |
|
| Processor: | Intel Core 2 Duo E6300 Dual Core, 1.86GHz, 2MB Unified Cache 1066FSB, 7x Multiplier |
| CPU Voltage: | 1.4375V (default 1.3250V) |
| Cooling: | Scythe Infinity Air Cooling |
| Power Supply: | OCZ GameXStream 700W |
| Memory: | Geil PC2-6400 800MHz Plus (2x1GB- GX22GB6400PDC) (Micron Memory Chips) |
| Video Cards: | 1 x MSI X1950XTX |
| Hard Drive: | Seagate 320GB 7200RPM SATA2 16MB Buffer |
| Case: | Cooler Master CM Stacker 830 |
| Maximum CPU OC: (Standard Ratio) |
436x7 (4-4-4-12, 1:1, 2.3V) 3052MHz (+64%) |
| . | |
 |
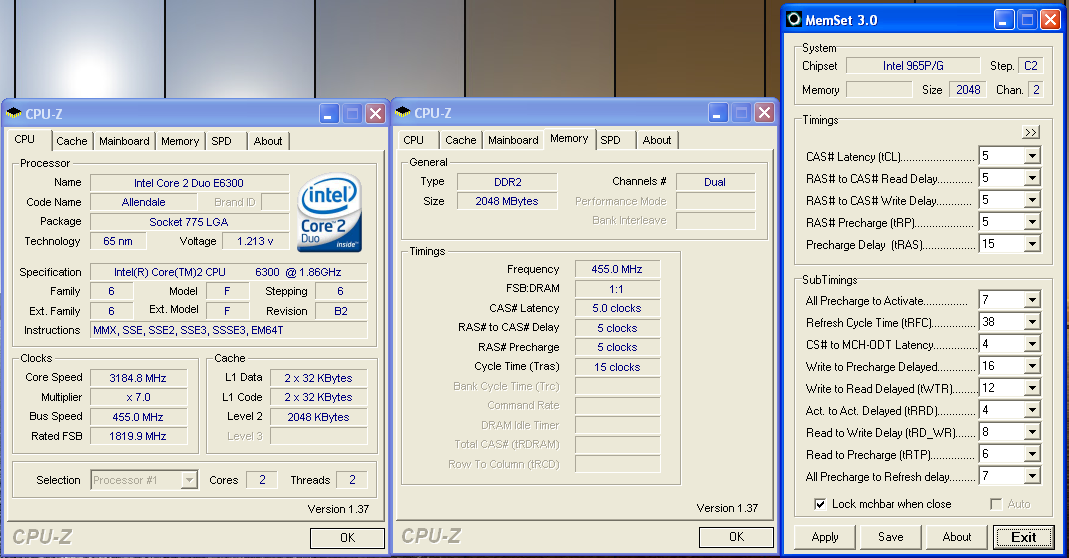
| Click to enlarge |
Our E6300 posted very good results when compared to our earlier overclocking test results that resulted in a maximum FSB speed of 366. However, the 7x436FSB level is the lowest of our test group today and does not match up to the promise of this board's performance. We also have an issue with our CPU requiring 1.4375V on this board to reach a stable 3.05GHz. We normally only require 1.40V in order to reach this level and noticed the board would not boot without an increase to 1.4375V although it was rock stable at this setting. Vdroop averaged around .02V to .03V during overclocking and heavy system loads. Our memory is usually very stable up to DDR2-900 at 4-3-3-10 settings but required slightly looser timings on this board. Although the overclocking results are not as high as our other boards, the ability to now run up to 436FSB in a stable manner is fine for the majority of people who want to overclock.
Memory Stress Testing
 |
| Click to enlarge |
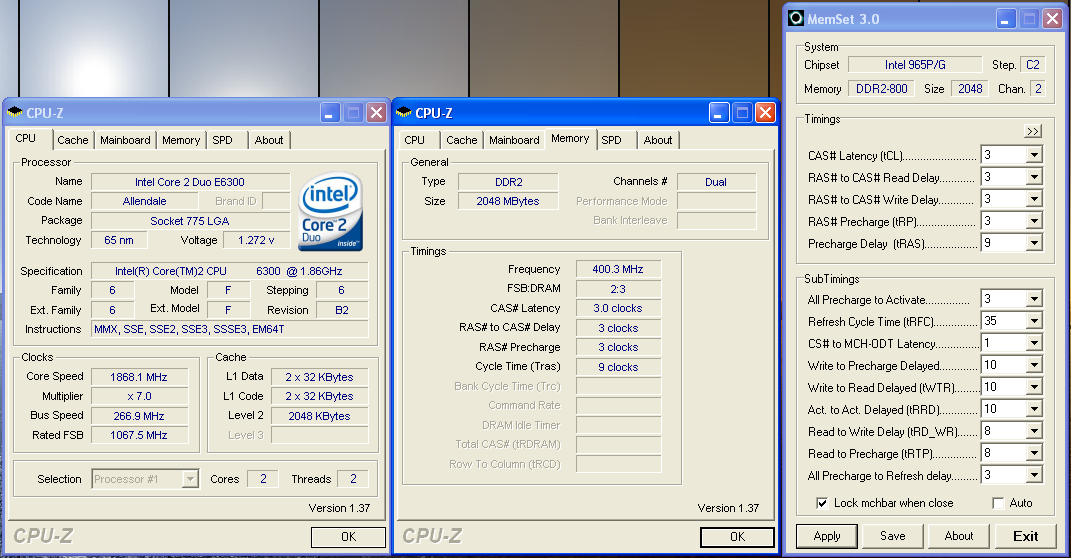
Memory stress tests look at the ability of the Abit AB9-Pro to operate at the official DDR2-800 memory frequency at the best performing memory timings our GEIL PC2-6400 can achieve on this board.
| Abit AB9-Pro Stable DDR2-800 Timings - 2 DIMMs (2/4 slots populated - 1 Dual-Channel Bank) |
|
| Clock Speed: | 800MHz |
| CAS Latency: | 3 |
| RAS to CAS Delay: | 3 |
| RAS Precharge: | 3 |
| RAS Cycle Time: | 9 |
| Voltage: | 2.20V |
The Abit AB9-Pro was very stable with 2 DDR2 modules in Dual-Channel mode at the settings of 3-3-3-9 at 2.2V with the 1.4 and above BIOS. By increasing the voltage to 2.25V we could run at 3-3-3-6 timings although there were not any real performance improvements unless we utilized MemSet to change other latency settings.
| Abit AB9-Pro Stable DDR2-800 Timings - 4 DIMMs (4/4 slots populated - 2 Dual-Channel Bank) |
|
| Clock Speed: | 800MHz |
| CAS Latency: | 3 |
| RAS to CAS Delay: | 4 |
| RAS Precharge: | 3 |
| RAS Cycle Time: | 10 |
| Voltage: | 2.20V |
We had to change our timings to 3-4-3-10 from 3-3-3-9 when installing two additional modules. We were able to keep our voltage set to 2.20V at this setting. We were able to maintain these settings up to a 7x405FSB, DDR2-810, setting with 2.30V. Our maximum overclock with four DIMMs installed was 7x418FSB, DDR2-836 4-4-3-12, with the memory set at 2.30V. Once again, we had to use BIOS 1.4 or higher in order for these settings to work.
In fact, on the first two BIOS releases this particular memory would not even boot when installed in this board. The memory itself is designed to run at 2.0V or higher depending upon the latencies selected. GEIL actually rates this memory at 2.4V for 3-4-3-8 operation at DDR2-800 although we have not required voltages above 2.2V at this setting.
ASUS P5B-E: Feature Set
| ASUS P5B-E (1.01G and 1.02G Revision) | |
| Market Segment: | Mid-Range Performance |
| CPU Interface: | Socket T (Socket 775) |
| CPU Support: | LGA775-based Pentium 4, Celeron D, Pentium D, Pentium EE, Core 2 Duo, Core 2 Extreme |
| Chipset: | Intel P965 + ICH8R |
| Bus Speeds: | 100 to 650 in 1MHz Increments |
| Memory Speeds: | Auto, 533, 667, 800, 889, 1067 |
| PCIe Speeds: | Auto, 90MHz~150MHz in 1MHz Increments |
| PCI: | Auto, Fixed at 33.33 |
| Core Voltage: | Base CPU V to 1.7000V in 0.0125V increments |
| CPU Clock Multiplier: | Auto, 6x-11x in 1X increments if CPU is unlocked, downwards unlocked |
| DRAM Voltage: | Auto, 1.80V ~ 2.10V in .10V increments on 1.01G, 1.80V ~ 2.45V on 1.02G |
| DRAM Timing Control: | Auto, 10 DRAM Timing Options |
| NB Voltage: | Not available 1.01G, 1.4V~1.7V on 1.02G |
| Memory Slots: | Four 240-pin DDR2 DIMM Slots Dual-Channel Configuration Regular Unbuffered Memory to 8GB Total |
| Expansion Slots: | 1 - PCIe X16 3 - PCIe X1 3 - PCI Slot 2.3 |
| Onboard SATA/RAID: | 6 SATA 3Gbps Ports - Intel ICH8R (RAID 0,1,5, 1+0,JBOD) 1 SATA 3Gbps Ports - JMicron JMB363 1 e-SATA 3Gbps Port - JMicron JMB363 |
| Onboard IDE: | 1 ATA133/100/66 Port (2 drives) - JMicron JMB363 |
| Onboard USB 2.0/IEEE-1394: | 10 USB 2.0 Ports - 4 I/O Panel - 6 via Headers 2 Firewire 400 Ports by VIA VT6307 - 1 I/O Panel, 1 via Header |
| Onboard LAN: | Gigabit Ethernet Controller - PCI Express Interface Attansic L1 |
| Onboard Audio: | ADI 1988A 8-channel High Definition Audio CODEC |
| Power Connectors: | ATX 24-pin, 4-pin EATX 12V |
| I/O Panel: | 1 x PS/2 Keyboard 1 x PS/2 Mouse 1 x Parallel Port 1 x S/PDIF Optical 1 x S/PDIF Coaxial 1 x IEEE 1394a 1 x Audio Panel 1 x RJ45 1 x eSATA 4 x USB 2.0/1.1 |
| BIOS Revision: | AMI 0601 |
| Board Revision: | 1.01G, 1.02G |
ASUS is replacing the P5B (non-deluxe) with the P5B-E. The improvements in the board have centered around better performance and overclocking capabilities. ASUS has improved the BIOS while upgrading or adding additional capacitors on the board. Our opinion is that they have succeeded based upon our test results. The current motherboard that is shipping is a 1.01G revision with either the C1 or C2 P965 stepping. As we witnessed in an earlier article there is not a real difference in performance between the two chipsets.
The current P5B-E 1.01G is very well optioned and sells for around US $160. ASUS will be launching a new revision of the motherboard oriented to the enthusiast crowd in the near future and it sports a new PLL controller that allows up to 1.7V for the MCH and 2.45V for the memory. The current 1.01G board does not offer voltage selections for the MCH and memory is limited to 2.10V. The board revision is 1.02G and we do not know if the name will change at this time or not. However, this should not deter the majority of users from considering the 1.01G motherboard as there is no difference in the performance of the boards except in overclocking when utilizing mid to lower range memory modules that require additional voltage.
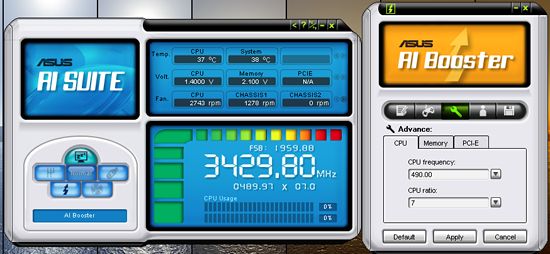
ASUS supports their AI Suite of utilities with the P5B-E that include AI N.O.S., AI Gear, AI Nap, AI Booster, and Q-Fan applications. ASUS AI Gear allows for four different fixed settings ranging from maximum performance to maximum power saving. ASUS AI Nap is a power savings utility and Q-Fan controls the CPU and chassis fans. AI Booster allows you to overclock the CPU to a certain level without rebooting to the BIOS. AI N.O.S. determines the load on the system and automatically overclocks the system up to 20%.
We found when setting the AI N.O.S. setting to auto that the system would boot our E6300 at 7x266 with the memory set at DDR2-800 with timings of 5-5-5-15. Once in XP and stressing the system with game play or 3DMark06 it would automatically raise the FSB to 275 with the memory at DDR2-824. If we set the AI N.O.S. from Auto to Sensitive then we could predetermine the percentage of overclock capability with the Turbo setting up to 20%. At the 20% setting the system would lock up due to our memory running at DDR2-958, something not possible with our GEIL DDR2-800 being limited to 2.1V. The FSB setting was 7x319 with memory timings at 5-5-5-18.
Once we backed down to a 15% overclock setting then the system would operate normally. This resulted in a 7x306 FSB with the memory speed at DDR2-920 with timings of 5-5-5-18. We found this to be strange as the system would operate with the memory set manually to 4-4-4-12 at DDR2-980 in our overclock tests. Overall, we still suggest you manually adjust the BIOS for optimum settings with your components.
ASUS P5B-E: Board Layout and Features
 |
| Click to enlarge |
After viewing the Abit AB9-Pro, the layout on the ASUS seems almost mundane. However, we have no real complaints about the layout except for the location of the IDE port and 24-pin ATX power connector. We feel like the IDE port connector should have been placed next to the floppy drive connector or replaced it. It would have been nice to have the 24-pin ATX connector located further to the right behind the memory slots. The motherboard was very easy to install and remove from our case. The four fan headers were within easy reach and can be controlled by the Q-Fan utility. The P5B-E replaces the P5B model. We tested both the 1.01G and 1.02G revision level boards and they are identical except for the BIOS changes and a PLL controller. Both boards feature an excellent three-phase voltage regulator power design along with high quality capacitors that yielded exceptional stability.
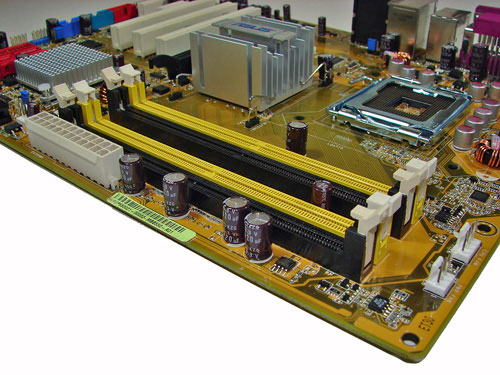
The DIMM module slots' color coordination is correct for dual channel setup based upon the premise of installing DIMMs in the same colored slots for dual-channel operation. The memory modules are slightly difficult to install with a full size video card placed in the PCI Express x16 slot. The 24-pin ATX power connector is located along the edge of the board along with a series of capacitors for the memory modules. We would have moved the 24-pin ATX connector to the upper right corner of the board to allow for easier access to the memory modules and CPU area in our case. It would also help to facilitate installation of PSUs with cables that are not longer than normal.
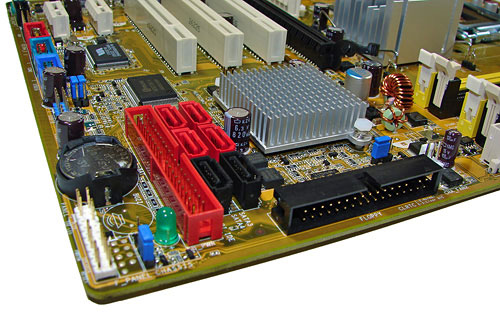
The four primary Intel ICH8R SATA ports are red along with the two secondary ports being black. These ports are conveniently located to the left of the ICH8R Southbridge and right of the battery and IDE port connector. We found the positioning of the SATA ports to be excellent when utilizing either the PCI-E x1 or PCI 2.3 slots. The ICH8R is passively cooled with a low rise heatsink and remained cool to the touch throughout testing.
The black floppy drive connector is located on the edge of the board and should have been switched with IDE port connector, as IDE cables are used far more than floppy cables these days. This switch would have eased installation of the IDE cable when using both the IDE and SATA ports. The clear CMOS jumper is color coded blue and is located in between the floppy drive connector and ICH8R chipset. This jumper was very difficult to use when utilizing a double slot video card. The chassis panel is located at the far left corner of the board.
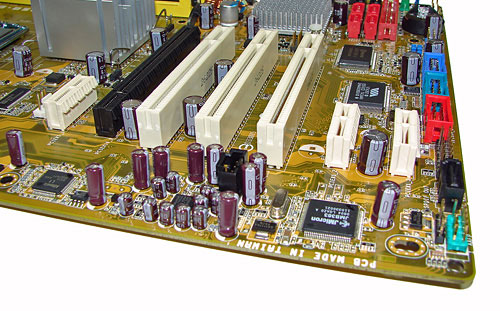
The board comes with (1) physical PCI Express x16 connector, (3) PCI Express x1 connectors, and (3) PCI 2.3 connectors. The layout of this design offers an excellent balance of expansion slots and provides very good clearance for most of the slots. When utilizing a double slot video card the first PCI slot is physically blocked and cannot be used. However, this still leaves two open PCI slots for use and all three PCI Express x1 slots. The black JMicron SATA port is on the right edge of the board along with the Firewire, COM1, and USB headers.
 |
| Click to enlarge |
Returning to the CPU socket area, we find an ample amount of room for alternative cooling solutions that include most air and water cooling solutions. The Intel P965 MCH chipset is passively cooled with a mid-rise heatsink that did not interfere with any installed peripherals. This heatsinsk kept the MCH temperatures in check so that additional chipset voltage was not a factor in our overclocking tests. ASUS places the 4-pin ATX connector in the upper right section of the board and out of the way of the CPU area.
The rear panel contains the standard PS/2 mouse and keyboard, Parallel, LAN, and four USB 2.0 ports. The LAN (RJ-45) port has two LED indicators representing Activity and Speed of the connection through the Attansic L1 Gigabit PCI-E chipset. The audio panel consists of 6 ports that can be configured for 2, 4, 6, and 8-channel audio connections for the ADI 1988A HD codec. The panel also has two S/PDIF (optical out/coaxial out) ports, and an external SATA 3Gb/s port via the JMicron JMB383 chipset.
ASUS P5B-E 1.01G: Overclocking
FSB Overclocking Results
| ASUS P5B-E Overclocking Testbed |
|
| Processor: | Intel Core 2 Duo E6300 Dual Core, 1.86GHz, 2MB Unified Cache 1066FSB, 7x Multiplier |
| CPU Voltage: | 1.4750V (default 1.3250V) |
| Cooling: | Scythe Infinity Air Cooling |
| Power Supply: | OCZ GameXStream 700W |
| Memory: | Geil PC2-6400 800MHz Plus (2x1GB- GX22GB6400PDC) (Micron Memory Chips) |
| Video Cards: | 1 x MSI X1950XTX |
| Hard Drive: | Seagate 320GB 7200RPM SATA2 16MB Buffer |
| Case: | Cooler Master CM Stacker 830 |
| Maximum CPU OC: (1.01G) |
490x7 (4-4-4-12, 1:1, 2.10V), CPU 1.4750V, C2 Stepping 3430MHz (+84%) |
| Maximum CPU OC: (1.02G) |
520x7 (4-4-4-12, 1:1, 2.35V), CPU 1.5250V, C2 Stepping 3640MHz (+96%) |
| . | |
 |
| Click to enlarge |
 |
| Click to enlarge |
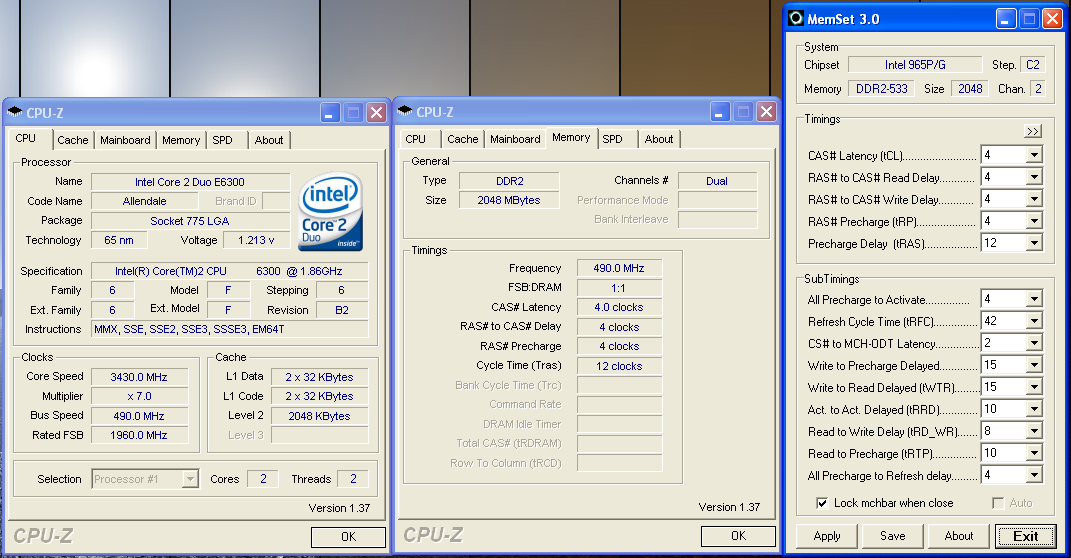
We were able to reach a final setting of 7x490FSB with our 1.01G board with a clock speed of 3430MHz. In previous testing with different memory this board reached 7x515MHz. Our FSB results were limited by the maximum memory voltage setting at 2.1V. Our memory voltages were set higher than normal for our CPU but this is due to the Vdroop on both boards being around .03~.05V during testing.
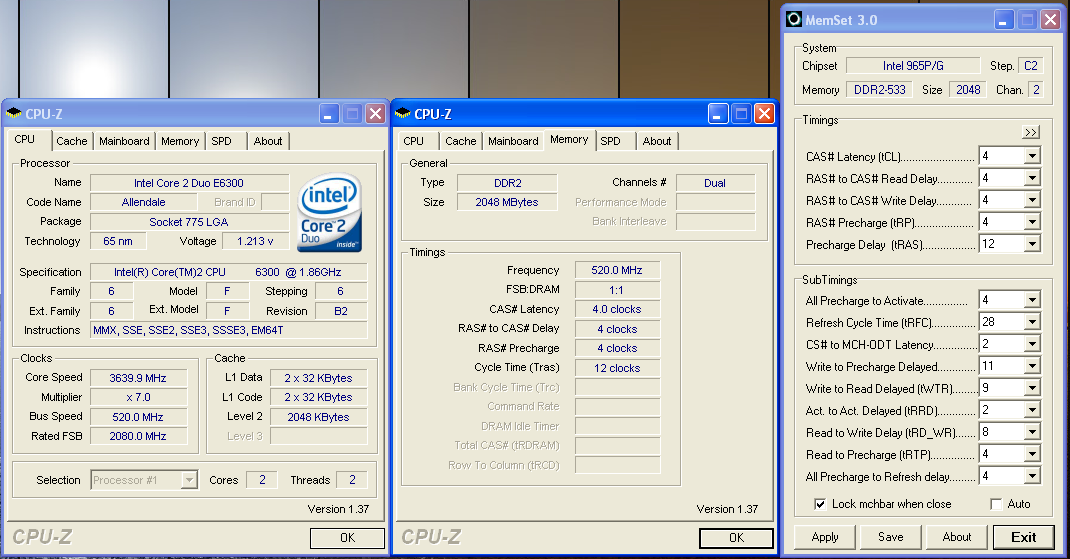
Our 1.02G board faired better as we could increase our memory voltage to 2.35V in order to reach the final stable setting of 7x520FSB resulting in a clock speed of 3640MHz. Both ASUS boards provided the best memory timings during overclocking although we noticed certain latency settings like tRFC were very relaxed when compared to other boards.
Memory Stress Testing
Memory Tests - ASUS P5B-E 1.01G
 |
| Click to enlarge |
Memory stress tests look at the ability of the ASUS P5B-E to operate at the officially supported memory frequencies of DDR2-800 at the best performing memory timings our GEIL PC2-6400 will support.
| ASUS P5B-E 1.01G Stable DDR2-800 Timings - 2 DIMMs (2/4 slots populated - 1 Dual-Channel Bank) |
|
| Clock Speed: | 800MHz |
| CAS Latency: | 4 |
| RAS to CAS Delay: | 4 |
| RAS Precharge: | 3 |
| RAS Cycle Time: | 8 |
| Voltage: | 2.10V |
Due to the 2.1V limitation on this board we had to settle for 4-4-3-8 timings at DDR2-800 with our particular memory choice. This also held true for our G.Skill, Super Talent, Transcend, and OCZ PC2-6400 memory modules. We were able to run our Corsair PC2-6400-C3 or OCZ-8000VX modules at 3-4-3-9 at 2.1V but considering the current price of these modules we think the minor performance differences are not worth the extra cost for this board.
| ASUS P5BE 1.01G Stable DDR2-800 Timings - 4 DIMMs (4/4 slots populated - 2 Dual-Channel Bank) |
|
| Clock Speed: | 800MHz |
| CAS Latency: | 4 |
| RAS to CAS Delay: | 4 |
| RAS Precharge: | 4 |
| RAS Cycle Time: | 10 |
| Voltage: | 2.10V |
The ASUS 1.01G board was stable with four DIMMs at 4-4-4-10 with 2.1V. However, we were limited to an overclock of 7x445FSB, DDR2-890 4-5-4-10, with four DIMMs installed due to the 2.1V limitation. We are still very impressed with the ASUS P5B-E 1.01G board even with the 2.1V memory setting considering its ability to almost reach 500FSB with DDR2-800 memory.
Memory Stress Testing
Memory Tests - ASUS P5B-E 1.02G
 |
| Click to enlarge |
We now take a look at the 1.02G revision motherboard to see if additional memory voltage can improve our timings on the GEIL PC2-6400 modules.
| ASUS P5B-E 1.02G Stable DDR2-800 Timings - 2 DIMMs (2/4 slots populated - 1 Dual-Channel Bank) |
|
| Clock Speed: | 800MHz |
| CAS Latency: | 3 |
| RAS to CAS Delay: | 3 |
| RAS Precharge: | 3 |
| RAS Cycle Time: | 9 |
| Voltage: | 2.20V |
We were able to set our timings to 3-3-3-9 by increasing the memory voltage to 2.20V with our GEIL memory. This also held true for several other DDR2-800 modules that required at least 2.2V for improved memory settings. Although the performance differences are negligible, the additional memory voltage will assist in overclocking and allowing most memory modules to run at tighter timings at like memory speeds.
| ASUS P5BE 1.02G Stable DDR2-800 Timings - 4 DIMMs (4/4 slots populated - 1 Dual-Channel Bank) |
|
| Clock Speed: | 800MHz |
| CAS Latency: | 3 |
| RAS to CAS Delay: | 4 |
| RAS Precharge: | 3 |
| RAS Cycle Time: | 10 |
| Voltage: | 2.20V |
The 1.02G board allowed us to run four DIMMs at 3-4-3-10 with only 2.2V which matched the Abit board. However, we were able to overclock the board to a very impressive 7x483FSB, DDR2-966 4-4-4-15, with four DIMMs installed; however, this required us to increase our memory voltage to 2.35V. Our maximum overclock at 3-4-3-10 with four DIMMs was 7x410FSB (DDR2-820) at 2.30V which means we were already near our maximum limit at these timings. We were able to reach 7x440FSB (DDR2-880) with our memory set to 4-4-3-10 at 2.3V.
Biostar TForce P965 Deluxe: Feature Set
| Biostar TForce 965 Deluxe | |
| Market Segment: | Mid-Range Performance |
| CPU Interface: | Socket T (Socket 775) |
| CPU Support: | LGA775-based Pentium 4, Celeron D, Pentium D, Pentium EE, Core 2 Duo, Core 2 Extreme |
| Chipset: | Intel P965 + ICH8R |
| Bus Speeds: | 200 to 500 in 1MHz Increments |
| Memory Speeds: | Auto, 533, 667, 800 |
| PCIe Speeds: | Auto, CPU, Fixed at 100MHz, 100MHz~200MHz |
| PCI: | Fixed at 33.33MHz |
| Core Voltage: | Startup, 1.10000V to 1.80000V in 0.00625V increments |
| CPU Clock Multiplier: | Auto, 6x-11x in 1X increments for Core 2 Duo |
| DRAM Voltage: | 1.8V, 2.0V, 2.1V, 2.2V |
| DRAM Timing Control: | SPD, 8 DRAM Timing Options |
| NB Voltage: | Auto,1.5V, 1.6V, 1.7V, 1.8V |
| Memory Slots: | Four 240-pin DDR2 DIMM Slots Dual-Channel Configuration Regular Unbuffered Memory to 8GB Total |
| Expansion Slots: | 1 - PCIe X16 1 - PCIe X4 1 - PCIe X1 3 - PCI Slot 2.3 |
| Onboard SATA/RAID: | 6 SATA 3Gbps Ports - Intel ICH8R (RAID 0,1,5, 1+0,JBOD) |
| Onboard IDE: | 1 Standard ATA133/100/66/33 Port (2 drives) - VIA VT6410 |
| Onboard USB 2.0/IEEE-1394: | 10 USB 2.0 Ports - 4 I/O Panel - 6 via Headers No Firewire Support |
| Onboard LAN: | Gigabit Ethernet Controller - PCI Express Interface Realtek RTL 8110SC |
| Onboard Audio: | Realtek ALC883 HD-Audio 8-channel CODEC |
| Power Connectors: | ATX 24-pin, 4-pin EATX 12V |
| I/O Panel: | 1 x PS/2 Keyboard 1 x PS/2 Mouse 1 x Serial 1 x Audio Panel 1 x RJ45 6 x USB 2.0/1.1 |
| BIOS Revision: | AWARD ip96a803 |
We really liked the Biostar TForce P965 Deluxe motherboard when we reviewed it in our Conroe Buying Guide as we thought it had the best blend of performance and price at the time. One omission in this motherboard is the lack of Firewire support that we found in both the Asus and Abit boards. Considering this motherboard is in the $150 price range we find this to be perplexing. Also, the memory voltage only goes to 2.2V but this did not hinder its overclocking capabilities during testing.
The only real change in the motherboard since its release has been a significant upgrade to the BIOS that cleared any remaining memory compatibility issues along with an increase in overclocking capability to 500FSB. The motherboard is the only one in our roundup to use the VIA VT6410 IDE chipset instead of the now standard JMicron JMB363. While it does not offer additional SATA ports like the JMicron, the IDE performance and compatibility was better in our testing. Our original feelings about the performance and compatibility of this board have not changed but we have noticed the board to be in very short supply. Biostar assures us this supply issue will be solved by early November.
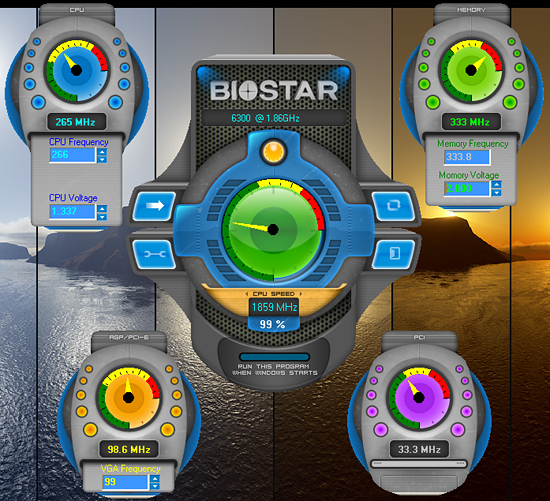
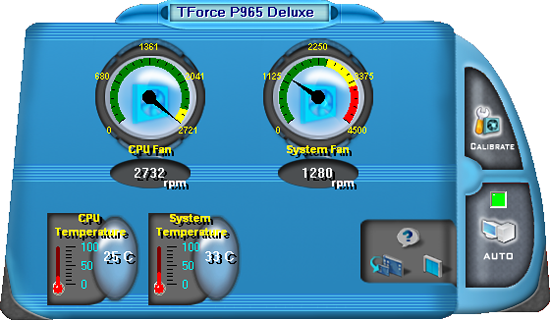
Biostar includes several software utilities with the board: an Overclock Program, Hardware Monitoring application, Smart Fan Utility, and an online BIOS update applet. The overclock utility allows for changes to the FSB and basic system voltages. The smart fan utility allows control of the CPU and main system fan header within Windows. The Hardware monitoring utility allows for real time monitoring of CPU temperature, CPU fan speeds, and basic system voltages. Biostar includes an automatic overclocking utility in their BIOS that offers three different settings named V6, V8, and V12.
We naturally selected the V12 setting in the BIOS and after a reboot were greeted with Ford Pinto performance. Okay, it was not that bad but the final results were a blistering 2009MHz CPU speed via a 7x287FSB with the memory speed at DDR2-715. However, the system was smart enough unlike our other boards to actually set the memory timings at something other than an ultra safe 5-5-5-15 setting with actual timings at 4-4-4-10. This is unusual as the BIOS will default to DDR2-667 (4:5) settings with timings at 5-5-5-15 when left on auto settings. Overall, the automatic overclocking worked without any issues and provided a small increase in speed just as Biostar intended it to work.
Biostar TForce P965 Deluxe: Board Layout and Features
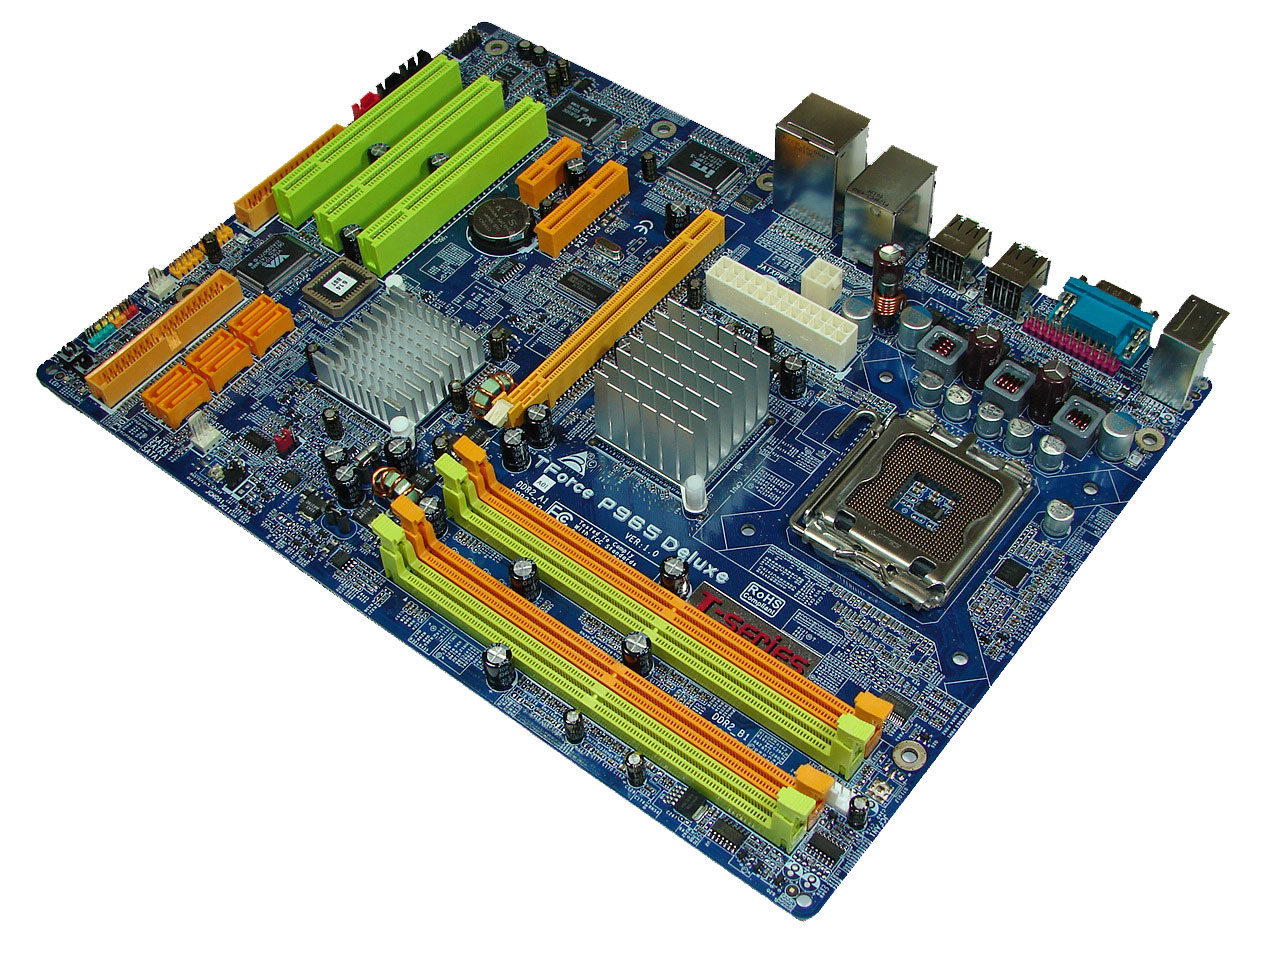 |
| Click to enlarge |
Biostar designed a well laid out board with an interesting color combination that grabs your attention without being overly aggressive. The board was extremely easy to install in our Cooler Master CM Stacker 830 case with all connections easily reached. However, the location of the 24-pin and 4-pin ATX connectors near the CPU area could cause cable management issues with larger air coolers like the Scythe Infinity. We also recommend installing the 4-pin ATX connector first as it is difficult to attach it with the 24-pin cable already installed. Biostar includes three fan headers although we wish there was an additional fan header near the I/O panel. The board features a three-phase voltage regulator system that provided excellent stability throughout our testing.
The DIMM module slots' color coordination is correct for dual channel setup based upon the premise of installing DIMMs in the same colored slots for dual-channel operation. It is nearly impossible to install memory modules with a full size video card placed in the PCI Express x16 slot. Biostar places the CPU fan header in between the number two and three memory module and it is a fair distance to reach for most CPU fan/heatsink cables. The board features a total of three fan headers. A fourth one would have been preferred near the I/O panel.
The six Intel ICH8R SATA ports are orange and are conveniently located to the left of the ICH8R Southbridge and second fan header. The SATA ports feature the newer clamp and latch design. We found the positioning of the SATA ports to be very good when utilizing the PCI 2.3 slots. The ICH8R is passively cooled and remained cool to the touch throughout testing.
The clear CMOS jumper is color coded black and is located in an easy access location at the edge of the board near the second fan header. Biostar includes a power on and reset button at the bottom corner of the board next to the VIA IDE connector. The chassis panel, third fan header, and USB connectors are located along the left edge of the board.
The board comes with (1) physical PCI Express x16 connector, (1) PCI Express x4, (1) PCI Express x1, and (3) PCI 2.3 connectors. The layout of this design offers one of the best single x16 connector designs we have worked with as none of the slots are blocked when using a dual slot video card in the x16 slot. We have to give credit to Biostar for this impressive layout and combination of slots on a mid-range board. However, the sacrifice for this layout is the inability to change memory modules with most video cards installed. The floppy drive connector is located at the edge of the board next to the last PCI slot. We would just as well have this connector disappear at this time.
 |
| Click to enlarge |
Getting back to CPU socket area, we find a fair amount of room for alternative cooling solutions. We utilized the stock heatsink/fan in our normal testing but also verified a few larger Socket-775 air cooling solutions would fit in this area during our overclocking tests. The Intel P965 MCH chipset is passively cooled with a mid-rise heatsink unit that did not interfere with any installed peripherals. However, it was very difficult routing the ATX power cables to their connectors with a cooling solution like the Tuniq Tower 120 installed. Fortunately our power supply had cables that were sleeved that allowed us to bend the cables around the heatsink area without worry about ripping a wire open.
The rear panel contains the PS/2 mouse and keyboard ports, LAN port, and 6 USB 2.0 ports. The LAN (RJ-45) port has two LED indicators representing Activity and Speed of the connection through the Realtek RTL8110SC Gigabit PCI-E chipset. The audio panel consists of 6 ports that can be configured for 2, 4, 6, and 8-channel audio connections for the Realtek ALC 883 HD codec. The panel also has a serial port and we would have preferred a S/PDIF optical out port to have been included in this area.
Biostar TForce P965 Deluxe: Overclocking
FSB Overclocking Results
| Biostar TForce 965 Deluxe Overclocking Testbed |
|
| Processor: | Intel Core 2 Duo E6300 Dual Core, 1.86GHz, 2MB Unified Cache 1066FSB, 7x Multiplier |
| CPU Voltage: | 1.4750V (default 1.3250V) |
| Cooling: | Scythe Infinity Air Cooling |
| Power Supply: | OCZ GameXStream 700W |
| Memory: | Geil PC2-6400 800MHz Plus (2x1GB- GX22GB6400PDC), (Micron Memory Chips) |
| Video Cards: | 1 x MSI X1950XTX |
| Hard Drive: | Seagate 320GB 7200RPM SATA2 16MB Buffer |
| Case: | Cooler Master CM Stacker 830 |
| Maximum CPU OC: (Standard Ratio) |
500x7 (4-4-4-12, 1:1), 2.20V 3500MHz (+88%) |
| . | |
 |
| Click to enlarge |
We were easily able to reach a final setting of 7x500FSB resulting in a clock speed of 3500MHz. We know the board can do better but the BIOS is locked at a 500FSB maximum currently. We were able to run at a very acceptable 1.475V at this setting with Vdroop being around .02~.03V during load testing. We were also able to run our memory at 4-4-4-12 at 2.2V on this board. We thoroughly enjoyed the overclocking aspects of this board as it only took a couple of reboots to get the system dialed in for our benchmark testing.
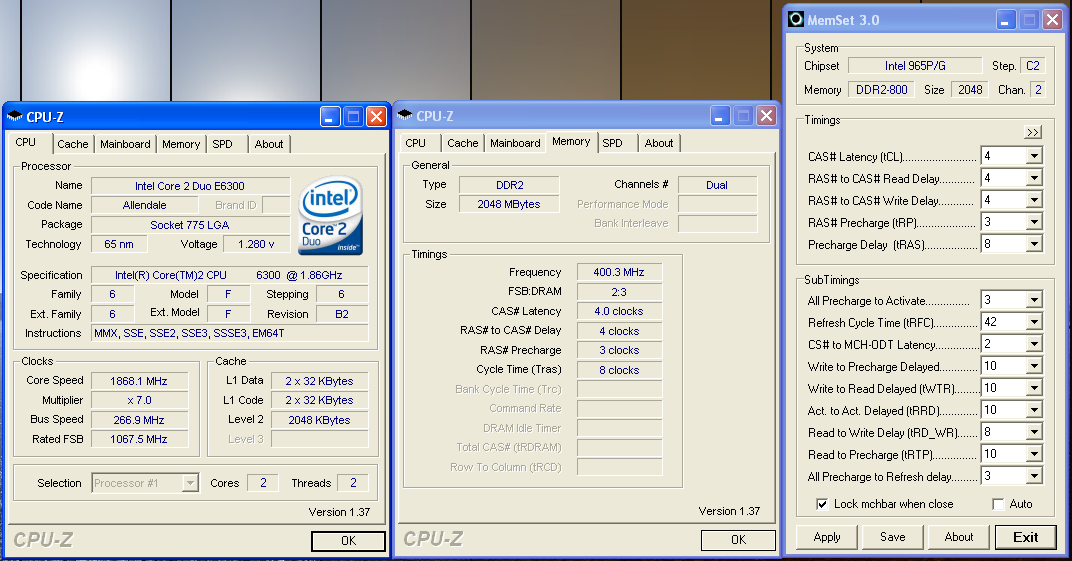
Memory Stress Testing
 |
| Click to enlarge |
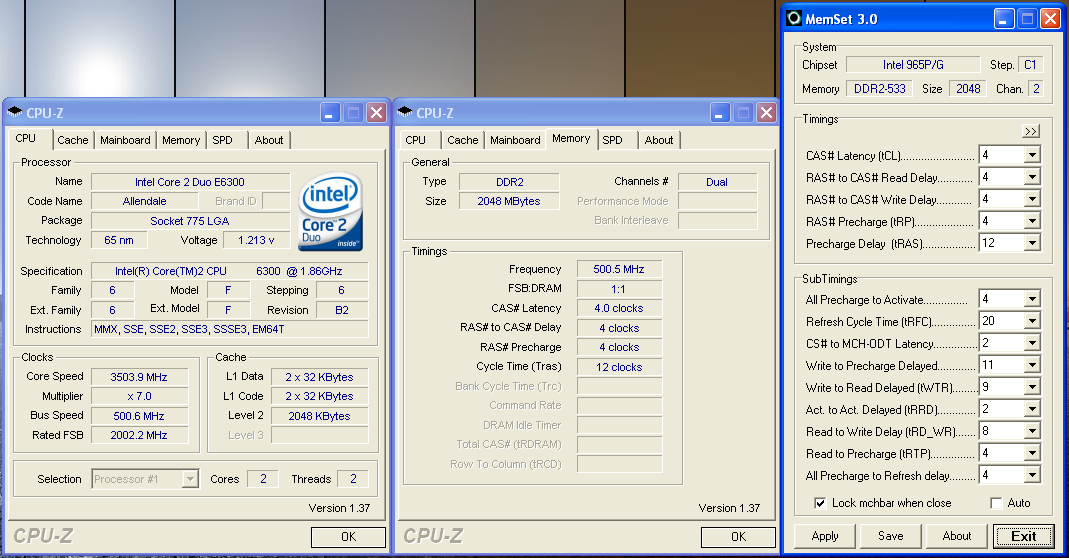
We take a look now at seeing how well our GEIL PC2-6400 memory operates in this board in both two and four DIMM testing. The screenshot above shows the actual memory settings used in our benchmark tests of the board. We do not modify the memory timings beyond the four major settings in our charts. The balance of the settings is implemented automatically via the BIOS. Biostar implements slightly tigher memory and MCH timings than the ASUS or Abit resulting in minor performance differences in our benchmark testing.
| Biostar TForce P965 Deluxe Stable DDR2-800 Timings - 2 DIMMs (2/4 slots populated - 1 Dual-Channel Bank) |
|
| Clock Speed: | 800MHz |
| CAS Latency: | 3 |
| RAS to CAS Delay: | 3 |
| RAS Precharge: | 3 |
| RAS Cycle Time: | 9 |
| Voltage: | 2.20V |
We were able to set our timings to 3-3-3-9 by increasing the memory voltage to 2.20V with our GEIL memory. We were able to hold these timings up to DDR2-840 on this board along with timings of 3-4-4-9 up to DDR2-860. The board ran at 4-4-3-10 up to DDR2-920 before switching to the final overlclock settings of 4-4-4-12.
| Biostar TForce P965 Deluxe Stable DDR2-800 Timings - 4 DIMMs (4/4 slots populated - 2 Dual-Channel Bank) |
|
| Clock Speed: | 800MHz |
| CAS Latency: | 3 |
| RAS to CAS Delay: | 4 |
| RAS Precharge: | 4 |
| RAS Cycle Time: | 9 |
| Voltage: | 2.20V |
Our settings of 3-4-4-9 at 2.20V were not quite as good as the ASUS 1.02G settings of 3-4-3-10 but due to tighter overall memory latencies the benchmarks were slightly improved across the board. We were able to keep this setting up to DDR2-830 before switching over to 4-4-3-10 settings that held stable until we reached DDR2-900. We then kept a setting of 4-4-4-12 at 2.20V up to our final overclock setting of 7x478, 3346MHz, with four DIMMs installed.
Gigabyte GA-965P-DS3: Feature Set
| Gigabyte GA-965P-DS3 | |
| Market Segment: | Mid-Range Performance |
| CPU Interface: | Socket T (Socket 775) |
| CPU Support: | LGA775-based Pentium 4, Celeron D, Pentium D, Pentium EE, Core 2 Duo, Core 2 Extreme |
| Chipset: | Intel P965 + ICH8 |
| Bus Speeds: | 100 to 600 in 1MHz Increments |
| Memory Ratios: | Auto, 2, 2.5, 3, 2.66, 3.33, 4 |
| PCIe Speeds: | Auto, 90MHz~150MHz in 1MHz Increments |
| PCI: | Fixed at 33.33MHz |
| Core Voltage: | Normal, 1.0250V to 1.6000V in 0.00625V increments, 1.80V, 2.0V |
| CPU Clock Multiplier: | Auto, 6x-11x in 1X increments if CPU is unlocked, downwards unlocked, Core 2 Duo |
| DRAM Voltage: | Normal, +.1V ~ +.7V in +.1V increments |
| DRAM Timing Control: | Normal, 9 DRAM Timing Options, Memory Performance Enhance Mode |
| FSB Termination Voltage: | Normal, +.1V ~ +.3V in +.1V increments |
| MCH Voltage: | Normal, +.1V ~ +.3V in +.1V increments |
| Memory Slots: | Four 240-pin DDR2 DIMM Slots Dual-Channel Configuration Regular Unbuffered Memory to 8GB Total |
| Expansion Slots: | 1 - PCIe X16 3 - PCIe X1 3 - PCI Slot 2.3 |
| Onboard SATA/RAID: | 6 SATA 3Gbps Ports - Intel ICH8 2 SATA 3Gbps Ports - (RAID 0,1,JBOD) - JMicron JMB363 |
| Onboard IDE: | 1 ATA133/100/66 Port (2 drives) - JMicron JMB363 |
| Onboard USB 2.0/IEEE-1394: | 10 USB 2.0 Ports - 4 I/O Panel - 6 via Headers no firewire support |
| Onboard LAN: | Gigabit Ethernet Controller - PCI Express Interface Marvel 88E8053 |
| Onboard Audio: | Realtek ALC-883 8-channel High Definition Audio CODEC |
| Power Connectors: | ATX 24-pin, 4-pin EATX 12V |
| I/O Panel: | 1 x PS/2 Keyboard 1 x PS/2 Mouse 1 x Parallel Port 1 x S/PDIF Optical 1 x S/PDIF Coaxial 1 x Serial Port 1 x Audio Panel 1 x RJ45 4 x USB 2.0/1.1 |
| BIOS Revision: | Award F7 |
The Gigabyte GA-965P-DS3 is one of the more value priced offerings in our mid-range lineup with a street price around $145. Unlike the other boards in our roundup it does not use the Intel ICH8R which means two additional SATA ports and RAID capabilities come from the JMicron JMB363 chipset that also serves as the IDE controller. The DS3 also does not come with Firewire capability which is a mistake in our opinion.
The BIOS is feature rich and is geared towards the enthusiast with a significant amount of voltage/memory timing options provided you remember to enter Ctrl-F1 while in the BIOS setup screen. Why Gigabyte continues to force the user to remember this keystroke sequence for additional BIOS options is beyond us. This motherboard is marketed to the performance crowd so why not let us have access to these commands without the secret code?
Gigabyte also includes a full suite of utilities for the board: EasyTune5, M.I.T. (Motherboard Intelligent Tweaker), Download Center, Xpress Install, @BIOS, Smart LAN, Smart Fan, and Virtual Dual BIOS. We found the @BIOS utility to be very handy for downloading and then updating the BIOS while in Windows. For those who are squeamish about updating their BIOS within Windows, Gigabyte has the Q-Flash utility built into the BIOS that allows updating from a floppy drive.
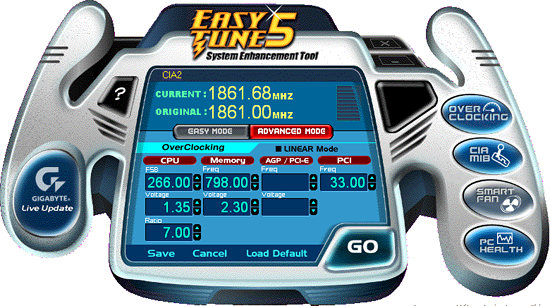
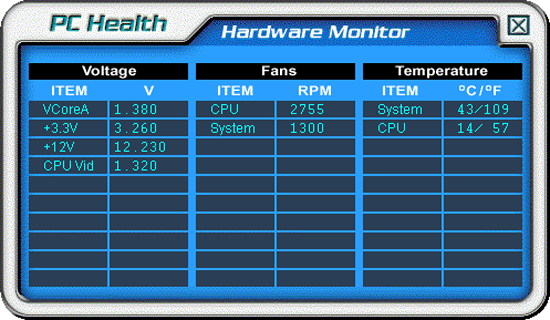
EasyTune5 is probably one of the most utilized utilities in the Gigabyte arsenal and allows for control of the FSB and certain voltages within Windows although a reboot is required for most voltage settings. We found the utility worked well for squeezing out those last few FSB increases but we still found ourselves tweaking the BIOS the majority of the time. The PC Health monitor provided basic readings of the system but for some odd reason our CPU temperature liked to blip under 20C when capturing our screenshots. Our actual idle temps at stock settings were 27C on this board. The Smart Fan utility allows control over the two fan headers.
Like our other boards in this roundup Gigabyte includes a dynamic overclocking capability dependent up system load or preset attributes. This capability can be located within the BIOS under the C.I.A.2 setting and is no way affiliated with the US government. The settings range from Cruise (5% increase) to Full Thrust (17% increase). We decided to see how well this motherboard performed at Full Thrust and were treated with a blank screen on reboot. After a quick CMOS clear event we backed down to the Turbo (15% increase) setting and were able to complete our benchmark testing. C.I.A.2 determined our Turbo settings would end at a final 7x308FSB providing a CPU speed of 2156MHz and our memory running at DDR2-924 with 5-5-5-15 settings. Just as predicted by C.I.A.2 an increase of over 15% in the FSB speed was realized.
Gigabyte GA-965P-DS3: Board Layout and Features
 |
| Click to enlarge |
Gigabyte has provided us with a well engineered board with a very good layout, though we would say the color combination does not have a central theme and lacks cohesiveness. We just feel if a manufacturer is going to take the time to add colors to a motherboard then at least do it with a graphics artist nearby. However, the board was a breeze to install in our case and all connections were easily reached. The board features a three-phase voltage regulator system that provided excellent stability throughout our testing. Gigabyte has recently switched their upper end boards to 100% use of Conductive Polymer Aluminum Solid Capacitors instead of the typical Electrolytic Capacitor. The purpose for this is to improve system durability and to provide for added stability under heavy load operations such as overclocking. With the latest BIOS release this board is also ready for the new Intel Core 2 Extreme Quad-Core (Kentsfield) processors.
The DIMM module slots' color coordination is once again correct for dual channel setup based upon the premise of installing DIMMs in the same colored slots for dual-channel operation. The memory modules are slightly difficult to install with a full size video card placed in the PCI Express x16 slot. The 24-pin ATX power connector and black floppy drive connector are located along the edge of the board and behind the DIMM slots. The board only comes with two fan headers with the CPU fan header being located to the right of the first DIMM slot.
The four Intel ICH8 SATA ports are color coded yellow and the two JMicron JMB363 SATA ports are in a wonderful shade of lavender next to the green IDE connector. We found the positioning of the SATA ports to be excellent when utilizing the PCI 2.3 slots although we still prefer the IDE connector on the edge of the board to facilitate better cable management. The ICH8 is passively cooled with a gold colored low-rise heatsink and remained fairly cool to the touch throughout testing.
The chassis panel is located at the bottom left corner of the board. The clear CMOS jumper is located in between the battery and ICH8 chipset. This is a two pin configuration and requires the use of a pen to reach and is blocked if a card is installed in the first PCI slot. It seems to be a trend lately of the various manufacturers to place this jumper in the most inconvenient locations. Until the BIOS recovery programs work 100% of the time it would be nice to have this jumper out in the open, or even better go with the "button" design that we've seen used by a few manufacturers.
The board comes with (1) physical PCI Express x16 connector, (3) PCI Express x1 connectors, and (3) PCI 2.3 connectors. The layout of this design offers a very good balance of expansion slots for a mainstream performance board while providing excellent clearance space for graphics card utilization. The second PCI Express x1 slot will be blocked by a dual slot graphics card but considering the dearth of PCI Express peripherals this is fully acceptable. The first PCI Express x1 slot is a tight fit as a card installed in this slot will have minimal clearance between the MCH heatsink and video card.
 |
| Click to enlarge |
Upon entering the CPU socket area, we find an ample amount of room for the majority of cooling solutions. We utilized the stock heatsink/fan in our base testing but also verified several of the larger Socket-775 cooling solutions would fit in this area during our overclocking tests. The 4-pin ATX power connector is placed on the far right side of the board and did not interfere with our various cooling units.
The Intel P965 MCH chipset is passively cooled with a mid-rise heatsink unit that did not interfere with any installed peripherals. Unfortunately, this heatsink is not very good at keeping the MCH cool during heavy overclocking. Gigabyte has used this design for the past year but has generally shipped a small fan that attaches to it for additional cooling. This heatsink needs it when running the system above 400FSB. However, even if it were included this board only has two fan headers which is not representative of a performance oriented board.
The rear panel contains the standard PS/2 mouse and keyboard ports along with serial and parallel ports for those who still require legacy peripherals. The panel also includes a LAN port, 4 USB ports, and two S/PDIF (optical out/coaxial out) ports. The LAN (RJ-45) port has two LED indicators representing Activity and Speed of the connection through the Marvell 88E8053 Gigabit PCI-E chipset. The audio panel consists of 6 ports that can be configured for 2, 4, 6, and 8-channel audio connections for the Realtek ALC 883 HD codec. The only item missing from our wish list would be a Firewire port if the board supported it.
Gigabyte GA-965P-DS3: Overclocking
FSB Overclocking Results
| Gigabyte GA-965P-DS3 Overclocking Testbed |
|
| Processor: | Intel Core 2 Duo E6300 Dual Core, 1.86GHz, 2MB Unified Cache 1066FSB, 7x Multiplier |
| CPU Voltage: | 1.4750V (default 1.3250V) |
| Cooling: | Scythe Infinity Air Cooling |
| Power Supply: | OCZ GameXStream 700W |
| Memory: | Geil PC2-6400 800MHz Plus (2x1GB- GX22GB6400PDC), (Micron Memory Chips) |
| Video Cards: | 1 x MSI X1950XTX |
| Hard Drive: | Seagate 320GB 7200RPM SATA2 16MB Buffer |
| Case: | Cooler Master CM Stacker 830 |
| Maximum CPU OC: (Standard Ratio) |
455x7 (5-5-5-15, 1:1, 2.2V), CPU 1.4750V, C2 Stepping 3185MHz (+71%) |
| . | |
 |
| Click to enlarge |
We were able to reach a final setting of 7x455FSB resulting in a clock speed of 3185MHz. This board is fully capable of 500FSB rates with the correct memory installed. We still have an issue with the D9 Micron based 1GB modules not wanting to go above the 460FSB range in a stable manner. This issue will be fixed in an upcoming BIOS release and we will retest at that time. We did not have any issues reaching 510FSB with a set of D9 based 512MB modules in testing.
Our CPU voltages were set higher than normal but this is due to the VDroop on the board being around .02~.04V during testing. Also, the voltage was increased slightly to compensate for being on the edge with our memory at the 7x450FSB or higher settings. At 7x440FSB we had the CPU set at 1.4250V without issue. Although we are limited at this time in FSB rates we feel like this board offers one of the better overclocking experiences for the money.
Memory Stress Testing
Memory Tests
 |
| Click to enlarge |
We take a look now at seeing how well our GEIL PC2-6400 memory operates in this board in both two and four DIMM testing. The screenshot above shows the actual memory settings used in our benchmark tests of the board. We do not modify the memory timings beyond the four major settings in our charts. The balance of the settings is implemented automatically via the BIOS. Gigabyte is fairly aggressive with their internal memory and MCH timings as our testing will reveal today.
| Gigabyte GA-965P-DS3 Stable DDR2-800 Timings - 2 DIMMs (2/4 slots populated - 1 Dual-Channel Bank) |
|
| Clock Speed: | 800MHz |
| CAS Latency: | 3 |
| RAS to CAS Delay: | 3 |
| RAS Precharge: | 3 |
| RAS Cycle Time: | 9 |
| Voltage: | 2.20V |
We were able to set our timings to 3-3-3-9 by increasing the memory voltage to 2.20V with our GEIL memory. We were able to hold these timings up to DDR2-830 on this board and held timings of 3-4-3-9 up to DDR2-860. The board ran at 4-4-3-10 up to DDR2-880 before switching to the final overlclock settings of 5-5-5-15. We noticed that any memory timings above DDR2-880 required the use of auto settings to ensure a stable system. This goes back to our issue with the 1GB D9 Micron modules that will be resolved shortly.
| Gigabyte GA-965P-DS3 Stable DDR2-800 Timings - 4 DIMMs (4/4 slots populated - 2 Dual-Channel Bank) |
|
| Clock Speed: | 800MHz |
| CAS Latency: | 3 |
| RAS to CAS Delay: | 4 |
| RAS Precharge: | 4 |
| RAS Cycle Time: | 9 |
| Voltage: | 2.20V |
Our settings of 3-4-4-9 at 2.20V were not quite as good as the Asus 1.02G settings of 3-4-3-10 but the Gigabyte board runs tighter overall memory latencies. We were able to keep this setting up to DDR2-840 before switching over to 4-4-3-10 settings that held stable until we reached DDR2-860. We then kept a setting of 4-4-4-12 at 2.30V up to our final overclock setting of 7x438, 3066MHz DDR2-876, with four dimms installed. This board will overclock higher with four DIMMs once the D9 Micron issue is solved.
Test Systems: Benchmark Setup
All boards support current socket 775 Intel processors. We chose an E6300 for testing as we feel this will be a very popular Core 2 Duo CPU choice with the P965 motherboards. We also chose GEIL PC2-6400 for our memory choice as it represents an excellent blend of performance at today's inflated prices although we are starting to see some price stabilization after six weeks of continued price increases in the DDR2 market. We are utilizing the MSI X1950XTX video card to ensure our 1280x1024 resolutions are not completely GPU bound for our motherboard test results. We did find in testing that applying a 4xAA/8xAF setting in most of today's latest games created a situation where the performance of the system starts becoming GPU limited.
| Standard Test Bed Performance Test Configuration |
|
| Processor: | Intel Core 2 Duo E6300 (1.86GHz, 2MB Unified Cache) |
| RAM: | Geil PC2-6400 800MHz Plus (2x1GB- GX22GB6400PDC), 2.30V (Micron Memory Chips) |
| Hard Drive: | Seagate 320GB 7200RPM SATA2 16MB Buffer |
| System Platform Drivers: | Intel - 8.1.1.1001 |
| Video Cards: | 1 x MSI X1950XTX |
| Video Drivers: | MSI/ATI Catalyst 6.10 |
| CPU Cooling: | Scythe Infinity |
| Power Supply: | OCZ GameXstream 700W |
| Optical Drive: | Sony 18X AW-Q170A-B2 |
| Case: | Cooler Master CM Stacker 830 |
| Motherboards: | Asus P5B-E (Intel P965 C2, 1.01G) - BIOS 0601 Asus P5B-E (Intel P965 C2, 1.02G) - BIOS 0601 Abit AB9-Pro (Intel P965 C1) - BIOS 1.5 BioStar T-Force 965 Deluxe (Intel P965 C1) - BIOS Gigabyte GA-965P-DS3 (Intel P965 C2) - BIOS F7 Asus P5NSLI (NVIDIA 570SLI) - BIOS 0601 Asus P5W-Deluxe (Intel 975X) - BIOS 1407 |
| Operating System: | Windows XP Professional SP2 |
| . | |
A 2GB memory configuration is now standard in the AT test bed as most enthusiasts are currently purchasing this amount of memory. We chose memory from GEIL that would offer a wide range of memory settings during our stock and overclocked test runs. Our memory timings are set based upon determining the best memory bandwidth via MemTest 86 and our test application results for each board.
Our revision 1.01G Asus P5B-E motherboard will operate at memory settings of 4-4-3-8 compared to 3-3-3-9 for the other motherboards. This is due to the 2.1V memory limitation and our choice of memory for the P965 roundup. The Asus P5B-E 1.02G offers identical performance at the same memory settings as the 1.01G board so our results will be comparable regarding motherboards.
All other components in our test configurations are exactly the same with the boards being set up in their default configurations. Our video tests are run at 1280x1024 resolution for this article at standard settings. We will not report on 1600x1200 4xAA/8xAF single and ATI CrossFire until part three of the roundup. Since our games are GPU limited at that setting all initial results in our testing are within one percent of each other.
Synthetic Graphics Performance
The 3DMark series of benchmarks developed and provided by Futuremark are among the most widely used tools for benchmark reporting and comparisons. Although the benchmarks are very useful for providing apples to apples comparisons across a broad array of GPU and CPU configurations they are not a substitute for actual application and gaming benchmarks. In this sense we consider the 3DMark benchmarks to be purely synthetic in nature but still valuable for providing consistent measurements of performance.
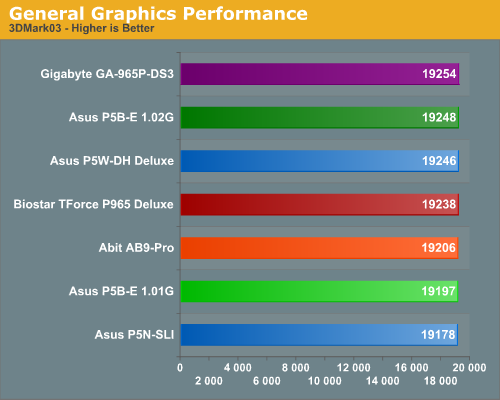
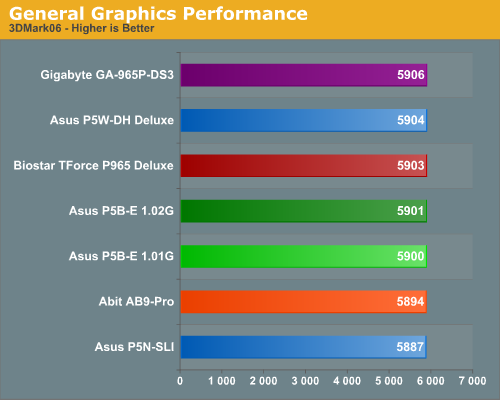
General System Performance
In our first tests, each P965 platform score is so close that there is no real winner here. In the more memory and CPU sensitive 3DMark03 benchmark we see the same trend with the P965 boards scoring extremely close with the Gigabyte board leading in both benchmarks. We really did not expect to see any real differences but we do know the P965 is very competitive with the 975X in our synthetic benchmarks. Our only real disappointment is the performance of the ASUS P5NSLI board as generally the NVIDIA chipsets shine in the 3DMark scores. We attribute the scores to the fact that the board is based in the budget sector and is tuned for stability and overall system performance rather than games/graphics. As we recognized in our preview of this board, it was very sensitive to memory speed and timings with DDR2-800 being a minimum requirement before the board would perform well. We expect the upcoming 680i to change the results in this test.
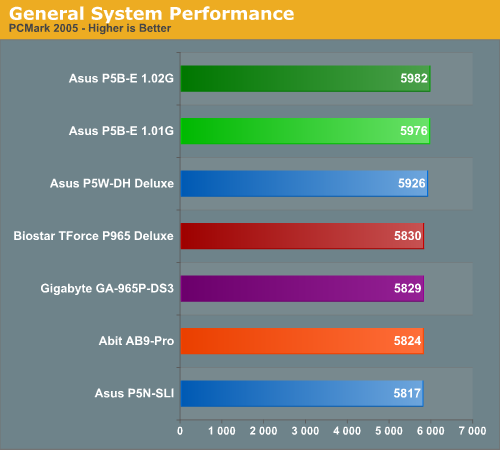
Considering our 3DMark results we really did not expect a difference in this benchmark but we found one. The Intel based ASUS boards walked off and left the other boards in a cloud of dust. We typically find some variations in this benchmark due to Hard Disk performance with the NVIDIA chipsets consistently scoring about 9% better than the Intel chipsets. In this case the overall difference was around 4% in the HDD tests where the P965 based boards were performing better than the 975X board. Our 570SLI board did not score well in the multitasking tests where the ASUS P965 boards shined.
After reviewing the individual results we noticed all of the scores between the P965 boards were essentially the same until we reached the final test which consists of multitasking three different applications. The ASUS P965 boards and to some extent the 975X board scored up to 58% better in the File Encryption and HDD Virus section of the test. The File Compression number was around 16% better. We ended up running this particular test on each board several times with different memory and hard drive configurations with the same result. We continued to play detective and once all possible causes were researched we decided to create our own multitasking script to determine if ASUS had tuned their BIOS for this test or if they really had better multitasking performance. The results are on the next page.
General System Performance
We devised a script that would compress our standard test folder consisting of 444 files, ten subfolders, and 602MB worth of data, convert a 137MB High Definition QuickTime movie clip to a 37MB MPEG-4 format, play back the first two chapters of OfficeSpace with PowerDVD, and run our AVG anti-virus program in the background. We stop the script when the file compression and video conversion are complete. This is a very taxing script for the CPU, Memory, and Storage subsystem. We also found it to be a good indicator of system stability during our overclocking testing.
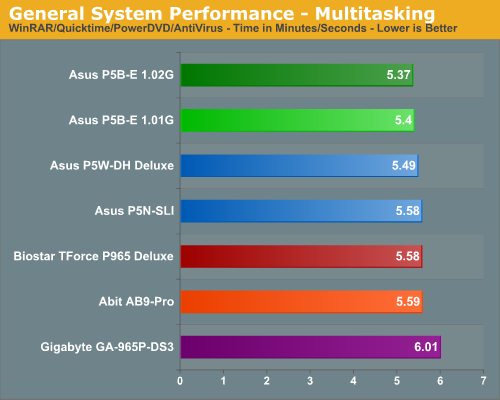
The performance difference basically mirrors our PCMark 2005 tests with the ASUS P965 boards scoring about 3% better overall in our multitasking test. While a 3% margin is not earth shattering it does show the ASUS boards are better adept at handling multiple tasks with the P965 chipset. The other P965 motherboards basically scored the same with the ASUS P5NSLI making a decent showing in this test.
PCMark 2005, together with two benchmarks that use rendering to test system performance - Cinebench 9.5 and POV-Ray 3.6 - have replaced the Winstones for testing general performance. Cinebench 9.5 and POV-RAY 3.6 benchmarks both heavily stress the CPU subsystem while performing graphics modeling and rendering. We utilize the standard benchmark demos in each program along with their default settings. Cinebench 9.5 features two different benchmarks with one test utilizing a single core and the second test using the power of multiple cores to render the benchmark image. We utilize the dual core test for our results.
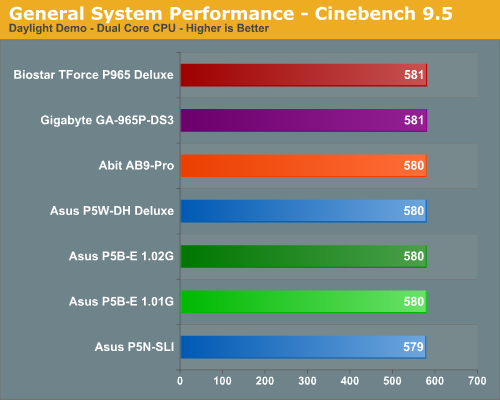
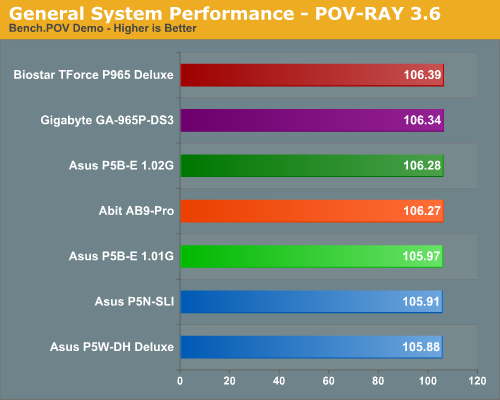
Returning back to normal we see the P965 motherboards grouped closely together and finishing slightly ahead of the 975X and 570SLI offerings. In this case, the Biostar board takes top honors in both tests with the Gigabyte board following closely. These test results bear out our memory test results where the Gigabyte and Biostar boards lead the other boards in our Sandra Unbuffered test results. Our Sandra Unbuffered test results generally inidicate which system will perform best in CPU or Memory intensive tasks.
Media Encoding Performance
Our first test is quite easy - we take our original Office Space DVD and use AnyDVD Ripper to copy the full DVD to the hard drive without compression, thus providing an almost exact duplicate of the DVD. We then fired up Nero Recode 2, selected our Office Space copy on the hard drive, and performed a shrink operation to allow the entire movie along with extras to fit on a single 4.5GB DVD disc. We left all options on their defaults except we checked off the advanced analysis option. The scores reported include the full encoding process and are represented in minutes and seconds, with lower numbers providing better performance.
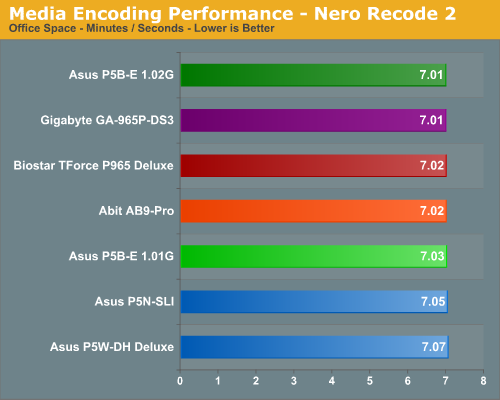
The results were interesting as the P965 boards scored better than the 975X board. We have seen this in previous testing with this benchmark and it appears the improved memory controller on the P965 is making a difference. The Gigabyte and ASUS 1.02G board score first with the other boards slightly behind. The ASUS 1.01G board consistently scored behind the 1.02G board in each of the test results due to the relaxed memory timings. If we set the memory timings on the 1.02G board to the 1.01G settings we produced the same test results.
Audio Encoding Performance
While the media encoding prowess of the P965 boards were superb in our initial media encoding testing, we wanted to see how they faired on the audio side. Our audio test suite consists of Exact Audio Copy v095.b4 and LAME 3.98a3. We utilize the INXS Greatest Hits CD that contains 16 tracks totaling 606MB of one time '80s hits.
We set up EAC for variable bit rate encoding, burst mode for extraction, use external program for compression, and to start the external compressor upon extraction (EAC will read the next track while LAME is working on the previous track, thus removing a potential bottleneck with the optical drive). We also set the number of active threads to two to ensure both cores are active during testing. The results are presented in minutes/seconds for the encoding process, with lower numbers being better.
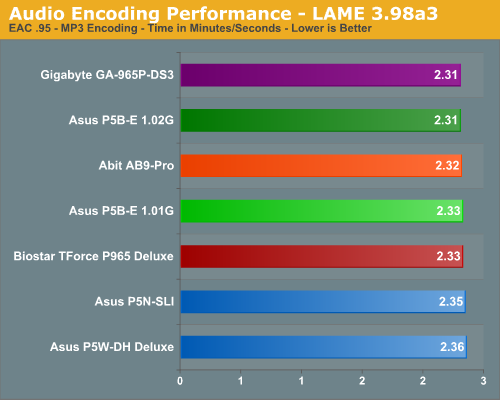
As in the media encoding section, the more intensive CPU and storage system tests seem to favor the P965 over the i975X when running at the same memory timings. We basically see the same results again with the Gigabyte and ASUS 1.02G board taking top honors with the other P965 boards close on their heels. Once again the reworked/enhanced memory controller on the P965 offers better performance than the 975X and 570SLI although you need a benchmark to tell the differences. Our ASUS 1.02G and 1.01G boards scored identically when utilizing the same memory timings in our offline tests.
File Compression Performance
In order to save space on our hard drives and ensure we had another CPU crunching utility, we will be reporting our file compression results with the latest version of WinRAR that fully supports multi-treaded operations and should be of particular interest for those users with dual core or multi-processor systems. Our series of file compression tests utilizes WinRAR 3.61 to compress our test folder that contains 444 files, ten subfolders, and 602MB worth of data. All default settings are utilized in WinRAR along with our hard drive being defragmented before each test.
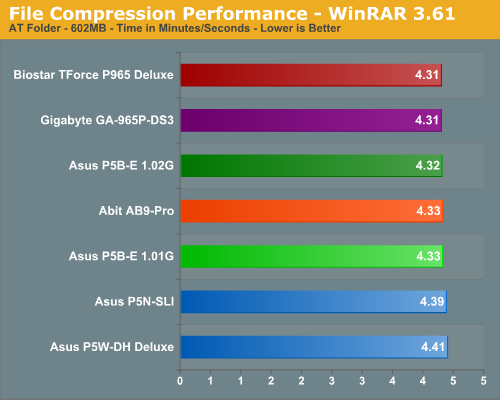
The results speak for themselves with the Intel P965 once again leading in our CPU intensive compression test. The Gigabyte and Biostar boards share first place honors with the Abit and ASUS boards finishing right behind them. The margins are once again extremely close between our P965 boards just reiterating the fact that boards based on the same chipset are going to offer the same performance. The 975X and 570SLI boards trail slightly and these results mirror the same scores we saw in our preview of the P965 chipset a couple of months ago.
Gaming Performance- FPS
As usual, gaming performance was tested with a variety of current games. We ran benchmarks with our standard 1280x1024 resolution. Given the number of users that run 19 inch LCDs these days, 1280x1024 represents one of the most commonly used resolutions. We will show 1600x1200 4xAA/8xAF and 1920x1200 4xAA/8XAF results in part three of our roundup when we test the motherboards that are capable of running CrossFire.
Battlefield 2
This benchmark is performed using DICE's built-in demo playback functionality with additional capture capabilities designed in house. During the benchmark, the camera switches between players and vehicles in order to capture the most action possible. There is a significant amount of smoke, explosions, and vehicle usage as this a very GPU intensive Battlefield 2 benchmark. We run Battlefield 2 using the highest quality graphics settings available in the video settings. The game itself is best experienced with average in-game frame rates of 35 and up.

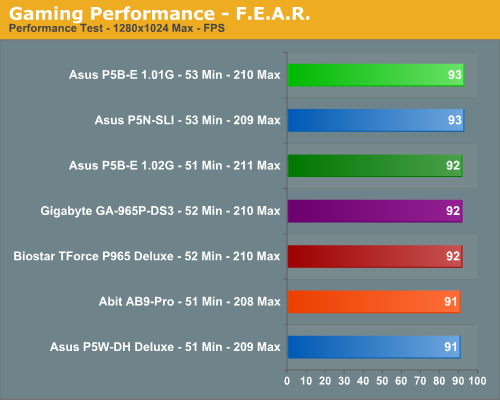
F.E.A.R.
F.E.A.R. uses a built-in performance test that generates graphical test scenes based upon the actual game engine. This test consists of a couple of different action sequences, a stressful water flyby, and heavy use of shadows while traveling through hallways. F.E.A.R. is a very graphics intensive game and we switch all settings to maximum. An average frame rate for F.E.A.R. that can dip into the teens is not good for a first person shooter, but the game is still playable to around 25 fps, although we prefer 35fps.
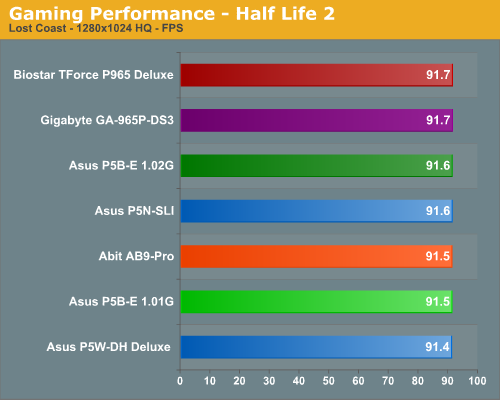
Half-Life 2: Lost Coast
We use the built-in timedemo feature to benchmark the game. Our timedemo consists of starting at the bottom of the hill near the lake and ending in the old church. The Source engine timedemo feature is similar to the nettimedemo of Id's Doom 3 engine, in that it plays back more than just the graphics. The highest visual quality settings possible were used with HDR turned on. While the Source engine is notorious for giving great frame rates for almost any hardware setup, we find the game isn't as enjoyable if it isn't running at 35fps or above.
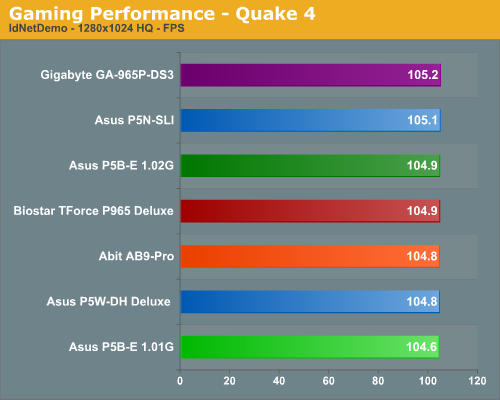
Quake 4
There has always been a lot of debate in the community surrounding pure timedemo benchmarking. We have opted to stick with the nettimedemo test rather than the timedemo option for motherboard benchmarking of Quake 4. To be clear, this means our test results focus mostly on the performance one would experience during actual game play. Additionally, Quake 4 limits frame rate to 60 fps during gameplay whether or not VSync is enabled. Our benchmark utilizes the IdNetDemo. This demo includes mainly outdoor areas with numerous players trying to wipe each other out. We tested the game with High Quality settings (uncompressed normal maps), and we enabled all the advanced graphics options except for VSync.
Serious Sam II
This benchmark is performed using Croteam's built-in demo capability in the Serious Sam II engine. We utilize the included Branchester Demo and capture the playback results using the Ctrl-~ function. The benchmark features a large number of combatants, explosions, and general mayhem. The benchmark is primarily GPU sensitive with the actual percentage of GPU/CPU/Audio activity being displayed during the benchmark run. We typically find this game is very playable at average in-game rates of 60 and above. We maximize all settings except antialiasing and anisotropic filtering within the general and advanced video settings.
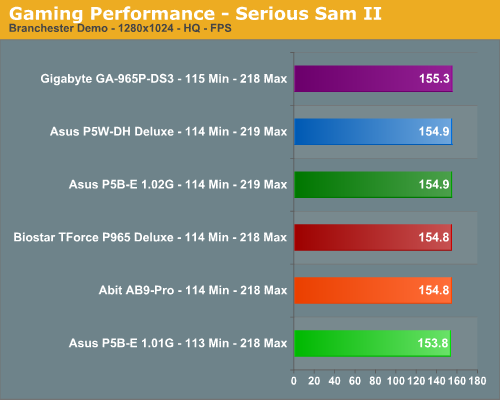
FPS Gaming Summary
Our test results basically speak for themselves. If you utilize the same chipset you can expect the same results during benchmark testing. The differences between each board are minor and during actual game play we could not tell any differences amongst the motherboards tested today. We did not experience any issues during testing or during game play with each board. We generally play games for a couple of hours with each board to ensure there are no issues such as overheating, stuttering, or network issues when playing on-line. The one result that did catch our eye is that the performance of the Gigabyte GA-965P-DS3 was very consistent throughout testing as the board scored near or at the top in every game. We attribute this to Gigabyte programming in slightly tighter memory and MCH timings than the other manufacturers. Of course this is affecting their overclocking capability at this time.
Gaming Performance- RTS & Simulation
While our previous tests were based around First Person Shooters we are going to take a look at how our motherboards perform with Real Time Strategy and Simulation games.
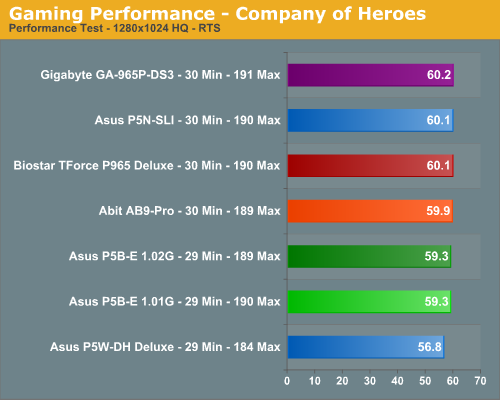
Company of Heroes
Company of Heroes was recently released and is proving to be a very addictive RTS game around the office. The game is extremely GPU intensive and also requires a hefty CPU at times. The game contains a built-in performance test that utilizes the game engine to generate several different action scenes along with a coffee argument as a sideline distraction before the war starts. We found the performance test gives a good indication of how well your system will perform throughout the game on average. Some of the in-game action sequences are more demanding than the performance test, but we generally found the game to be enjoyable with an average performance test frame rate above 35fps.
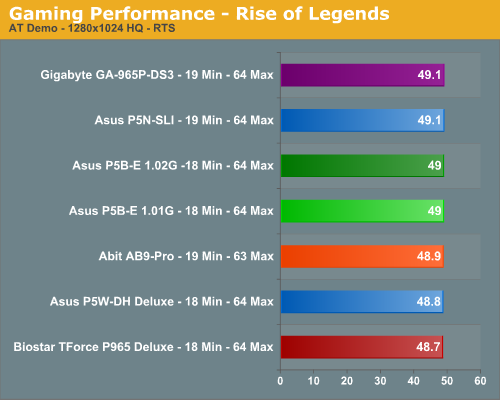
Rise of Legends
This game was released a few months back and like most real time strategy games is very CPU intensive but still offers a very visual experience. In order to experience the game properly you need a fast CPU, very good memory subsystem, and a decent GPU to play at the higher resolutions. This game has also proved to be very addictive around the office. We utilize FRAPs to capture the results from our replay file. Our benchmark consists of a one on one player game that takes approximately an hour to complete with some significant action throughout the game. Our camera movements are constant as we try to out play each other with a general tank rush between the two Vinci sides every few minutes. We set all video options to high but disable AA although we found it makes very little difference in the performance of the game at the lower resolutions. We generally found the game to be enjoyable with an average frame rate above 35fps.
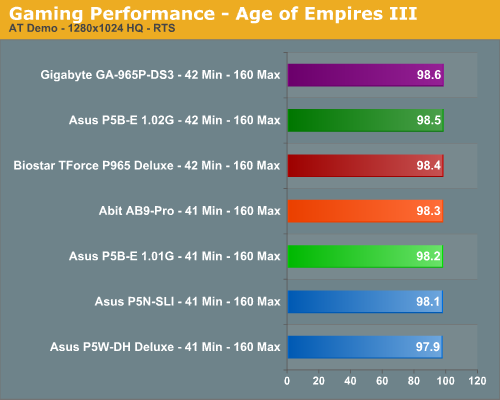
Age of Empires III
Age of Empires III was released last fall and will soon be updated with The WarChiefs expansion pack. This particular game requires a decent CPU and a very capable GPU when utilizing the antialiasing options. We once again utilize FRAPS to capture the results from our replay file. Our benchmark consists of a four player scenario that takes approximately an hour to complete. Our playback file follows the action of the best player on our staff as he generally is involved in attacks from an early point in the game until he decimates everyone at the end. The camera movements are constant as is the action so we feel like this benchmark represents the typical game. We set all video options to high but disable AA. We generally found the game to be enjoyable with an average frame rate above 40fps.
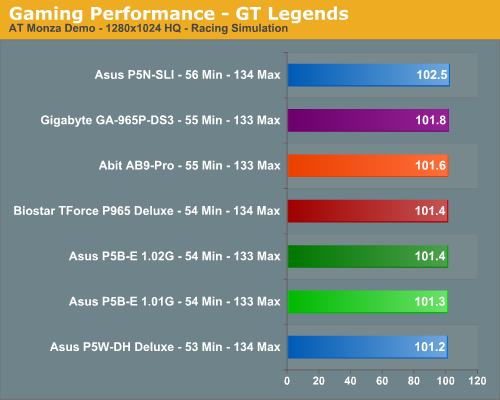
GT Legends
Our final game is a racing simulation introduced last year that generally delivers a very accurate portrayal of driving the top sports cars in the 1960s and 1970s on some of the world's finest race tracks. The game is an update to GTR with improved physics and graphics. GTR2 was recently released but we were unable to test it in time for this roundup. Our test consists of racing our Mustang around the Monza GP track for three laps and capturing the results with FRAPS. We set all in-game options to their highest settings but disable AA although the game requires it for an enjoyable experience from the cockpit. The performance penalty on level three AA is minimal. We generally found the game to be enjoyable with an average frame rate above 45fps.
RTS Gaming Summary
Our results mirror the FPS benchmark scores with all of the P965 boards bunched together with the 975X board trailing slightly. However, in a reversal we see our 570SLI board being very competitive with the P965 offerings. Once again, the Gigabyte GA-965P-DS3 motherboard places first or second in our RTS/Simulation benchmarks while providing the best overall minimum frame rates. We spent numerous hours testing each game in single player and on-line multiplayer modes with and without audio enabled. We did not note any issues during our game play experiences with this group of motherboards at stock or overclocked settings. Once you have setup any board here properly you can expect near trouble free operation during gaming.
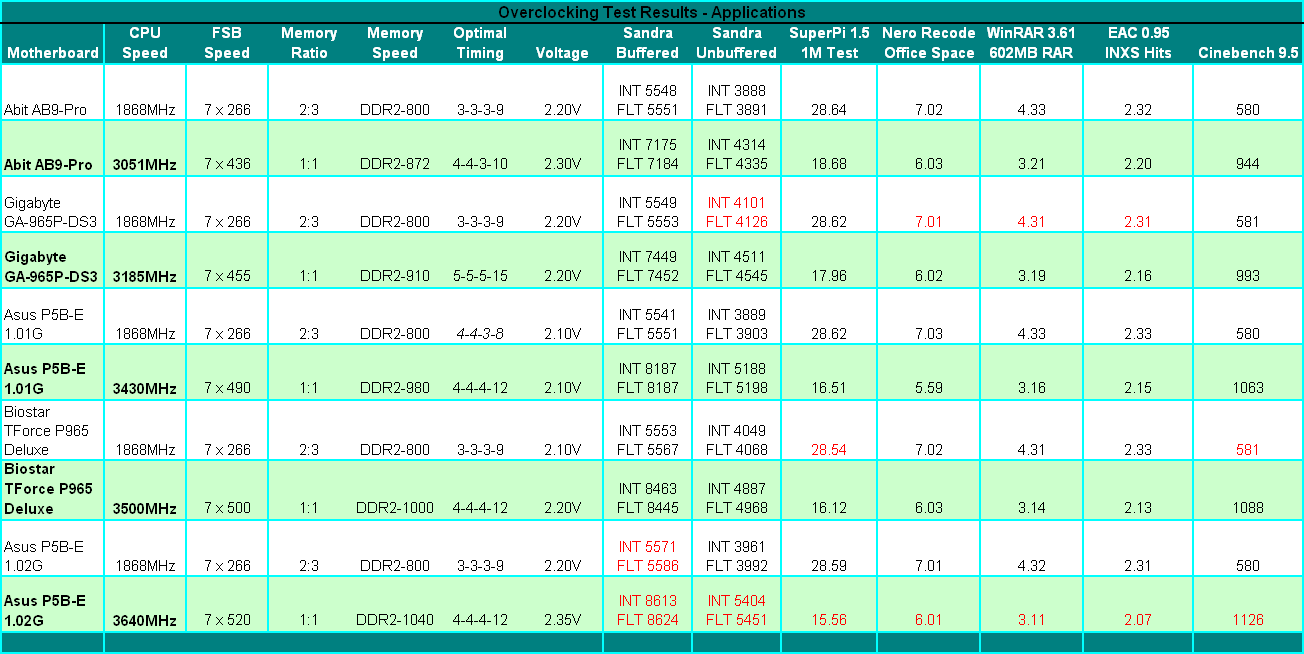
Overclocking Performance
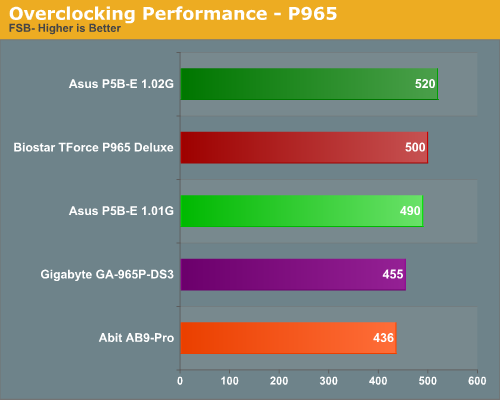
We have already reviewed the overclocking capabilities of each board in detail during our review of the boards' feature sets if addtional information is required about the results. As a recap our ASUS P5B-E 1.02G motherboard is our top overclocking board. It is able to overclock further with our GEIL PC2-6400 memory than the ASUS P5B-E 1.01G board due to the additional memory voltage options. The Biostar TForce P965 board is limited to 500FSB due to its BIOS options. Our Gigabyte GA-965P-DS3 is limited to the 450FSB range due to issues overclocking our Micron D9 1GB modules and the Abit AB9-Pro is just limited at this time. We will now take a look at how our boards performed in a few of our standard benchmarks while overclocked.
 |
 |
| Click to enlarge |
Our end results are not that surprising as the higher you overclock a system the greater its performance will be and in this case that means the ASUS P5B-E 1.02G walks away with the trophy. In our application benchmarks that tend to be very CPU intensive we see the benefits of overclocking as our Nero Recode test shows an improvement of 16% on average with our WinRAR tests showing upwards of a 36% increase in performance. Our audio encoding test only showed an improvement of 11% but this is due to the fact that the CPU was waiting on the optical drive during the encoding process as it takes two minutes and three seconds to extract the audio files. In our Sandra memory results we see the Gigabyte GA-965P-DS3 having the highest Unbuffered results which directly translates to its class leading performance in our benchmarks. We also took notice of the very consistent performance from the Biostar TForce P965 Deluxe board which has the second highest Sandra Unbuffered test results.
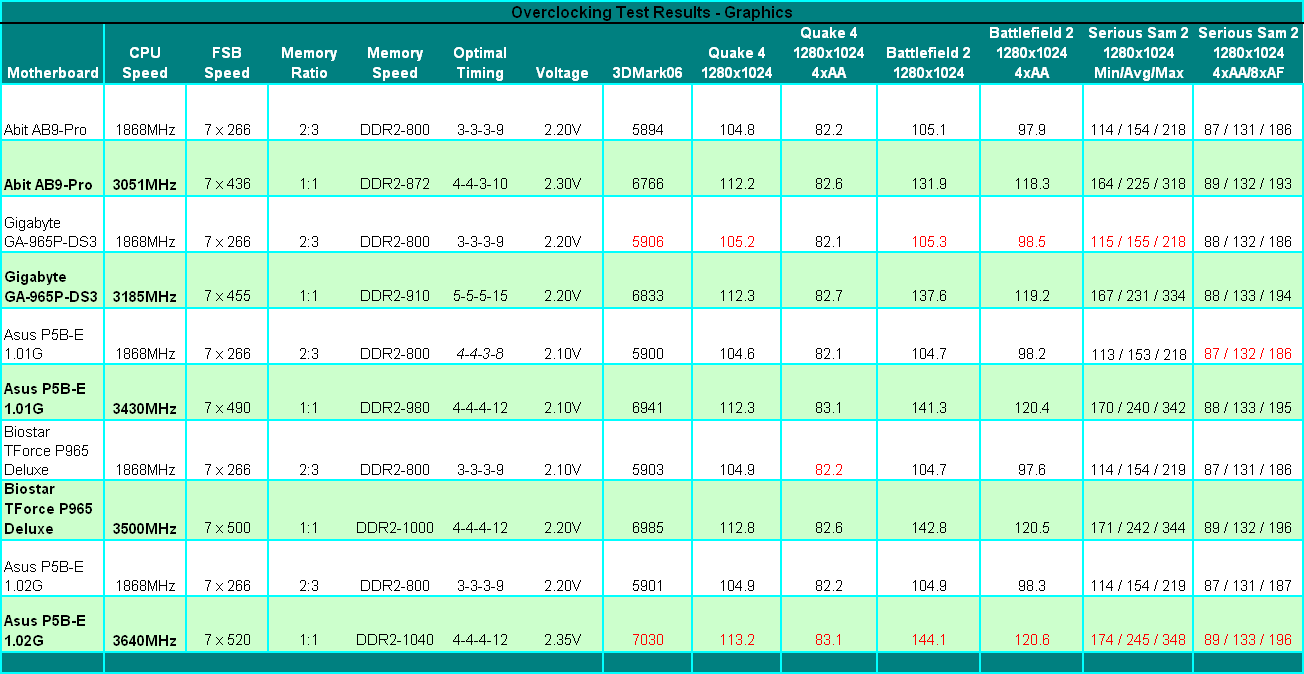
In our gaming benchmarks we see differences of 7% in Quake 4, up to 38% in Battlefield 2, and 59% in the older Serious Sam II title. This trend shows a definite improvement in the CPU/GPU balanced titles with little improvement in a title like Quake 4 that is already becoming GPU limited at 1280x1024. We implemented 4xAA in Quake 4 and the game shows no real differences in performance once it becomes GPU limited. Battlefield 2 still shows a 22% improvement but the spread between the Abit board and the ASUS 1.02G board is only 1% even though there is a 19% difference in the overclocking speed of the boards. Serious Sam II becomes GPU limited in a hurry when implementing 4xAA/8xAF settings although the frame rates are still very good.
Our opinion is that unless you are benchmarking to impress your friends and colleagues or are not GPU limited then there are few real gaming advantages to overclocking a system with the latest components. This basically means that to a certain degree you should invest in a very good GPU first and then start looking at the platform components based upon your timeline for keeping the system. Over time overclocking can become advantageous as you upgrade the GPU and simply overclock the system to improve CPU and memory performance. This can help extend the life of your main system components while allowing you to spend your money wisely during an upgrade cycle. Of course, there are those of us who throw this entire theory out the window (Ed: the author does this everyday!) every time a new component is introduced.
Disk Controller Performance
The AnandTech iPeak test is designed to measure "pure" hard disk controller performance, and in this case, we keep the hard drive as consistent as possible while varying the hard drive controller. The idea is to measure the performance of each hard drive controller with the same hard drive.
We played back our raw files that are recorded I/O operations when running a real world benchmark - the entire Winstone 2004 suite. Intel's iPeak utility was then used to play back the trace file of all I/O operations that took place during a single run of Business Winstone 2004 and MCC Winstone 2004. To try to isolate performance differences to the controllers that we are testing we use the Seagate 7200.10 Barracuda 320GB 7200 RPM drive in both SATA and IDE offerings for our tests. The drive is formatted before each test run and a composite average of three tests on each controller interface is tabulated in order to ensure consistency in the benchmark.
iPeak gives a mean service time in milliseconds; in other words, the average time that each drive took to fulfill each I/O operation. In order to make the data more understandable, we report the scores as an average number of I/O operations per second so that higher scores translate into better performance. This number is meaningless as far as hard disk performance is concerned, as it is just the number of I/O operations completed in a second. However, the scores are useful for comparing "pure" performance of the storage controllers in this case.
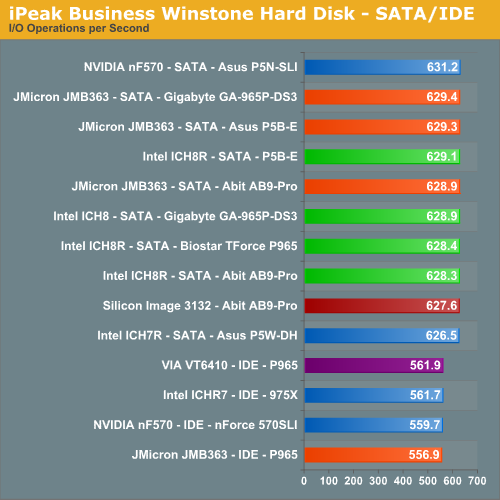
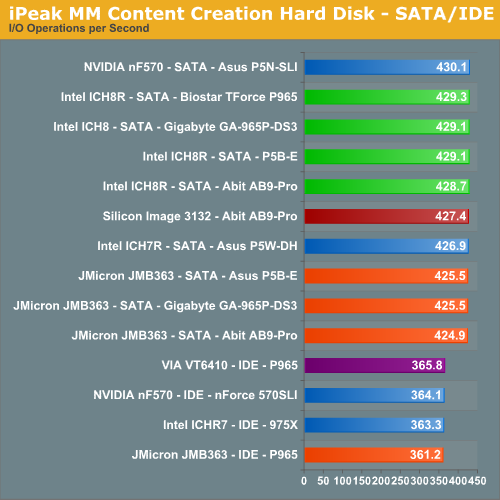
The performance patterns hold steady across both Multimedia Content I/O and Business I/O, with the NVIDIA nForce 500 based SATA controllers providing a slight improvement in I/O operations over the Intel, JMicron, and Silicon Image SATA controllers. This has been a historical trend between the two manufacturers with the NVIDIA controllers generally having a higher throughput than the Intel chipsets. We look forward to seeing how well the ATI SB600 will perform with an Intel processor in the upcoming DFI ICFX-3200 based on the RD600 chipset.
Of note in our SATA tests is the excellent performance generated by the JMicron controller logic that scored higher than the Intel ICH7R or ICH8 based SATA controllers in the Business Winstone test. However, in the read and write heavy Content Creation tests we see the Intel SATA controllers placing ahead of the JMicron offerings. After reviewing the test script results we noticed the write operations of the JMicron JMB363 chipset was about 3% slower than the Intel ICH chipsets while being around 2% faster in read operations.
The VIA VT6410 controller offered the best performance in the IDE tests with the JMicron JMB363 finishing last. During initial testing with the JMicron chipset we noticed several boards having issues with the optical drives being stuck in PIO mode resulting in terrible performance. However, this issue was solved with BIOS updates from the motherboard suppliers. We do want to note that unless you utilize the JMicron JMB363 for RAID operation then do not load the JMicron driver or allow Windows Update to install the newly released driver. Installing this driver will usually result in sporadic operation of the IDE port or failure to recognize your optical drive.
Disk Controller Performance - RAID
Due to the fact that we are testing two new chipsets in the form of the Intel ICH8R and JMicron JMB363 we decided to present a variety of RAID results in our P965 roundup. We utilize the same AnandTech iPeak test that is designed to measure "pure" hard disk controller performance. This consists of the Business Winstone 2004 and MCC Winstone 2004 benchmarks that provide a very good representation of general desktop performance. We also use the same Seagate 7200.10 Barracuda 320GB 7200 RPM SATA drive and average three test runs for the results. In our RAID 1+0 (10) and 0+1 testing, we utilize a four hard drive setup and a three drive combination for our RAID 5 testing.
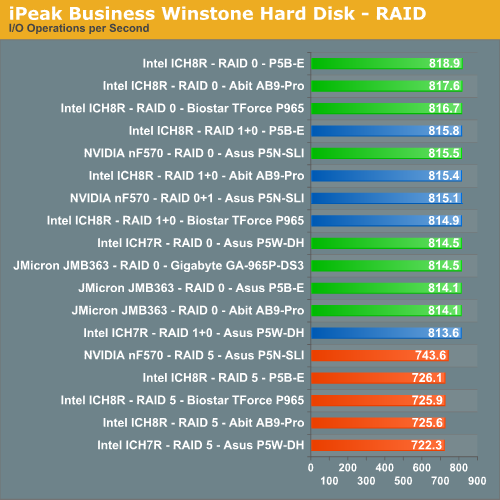
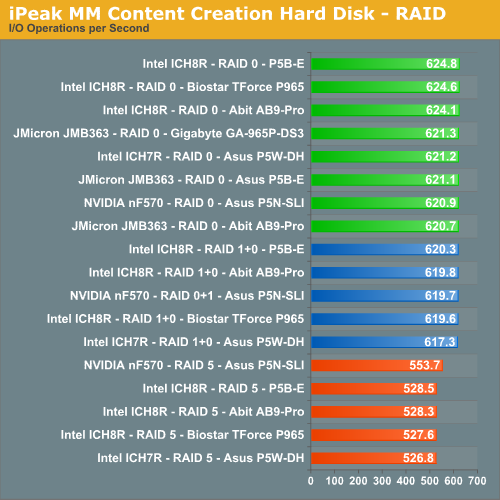
In a reversal of our single drive tests we see the Intel ICH8R leading the NVIDIA nForce 500 controller in our RAID 0 and RAID 1+0 test results. While the NVIDIA controller still finished ahead of the older ICH7R we see enough improvements in both the ICH8R chipset and drivers to finish first. This surprised us and after running our tests on the ASUS P5N32-SLI Premium (nF590SLI Intel) motherboard we found NVIDIA back in first place with results about 2% better than the ICH8R. However, since this board was not available in time for our roundup the results stand with Intel placing first. We feel like our ASUS P5N-SLI board is just not performing up to par in these particular hard drive tests.
We see the JMicron JMB363 controller finishing behind both the NVIDIA and Intel chipsets in both RAID 0 tests resulting in a slight role reversal from our single drive results. In our Business Winstone test the JMicron results fall behind the ICH8R RAID 1+0 results and NVIDIA 0+1 tests compared to our single SATA drive tests where this controller almost finished first. After reviewing our test scripts we noticed that the 2% read performance advantage this chipset had over the Intel offerings in single drive testing was flipped to a disadvantage of around 1% in RAID 0. We feel like this is a driver issue as the JMicron performed very well in our Content Creation tests where it finished ahead of the NVIDIA chipset in RAID 0.
Our RAID 1+0 and 0+1 tests were slightly surprising as we did not expect our on-board controllers to perform as well as they did when compared to the RAID 0 setup. This is due to our Seagate test drive as our Western Digital 150GB Raptor setup on the same controllers typically showed a 2% to 4% advantage for the RAID 0 setup. Our RAID 5 results were not a surprise as the CPU overhead incurred from either the NVIDIA or Intel drivers generally result in dismal write performance when compared to dedicated hardware based solutions from Highpoint, Broadcom, or Areca.
What we did not expect was the NVIDIA controller performing up to 5% better in RAID 5 after reviewing the RAID 0, 1+0, and 0+1 results between the chipsets. The difference turned out to be improved write speeds with the NVIDIA controller especially in the Content Creation test. Our test scripts showed excellent read speeds from our native chipset based controllers but write speeds were sometimes up to 55% less than our HighPoint RocketRAID 2320 dedicated hardware controller we will be reviewing in the near future. We found the Intel Matrix software interface was generally easier to use to setup up our various RAID arrays although the revised NVIDIA control panel with the nForce 500 series is significantly better now.
Firewire and USB Performance
After looking at many options for Firewire and USB testing, we finally determined that an external USB 2.0, Firewire 400, and Firewire 800 hard disk would be a sensible way to look at USB and Firewire throughput. We utilize a RAM disk as our "server", since memory removes almost all overhead from the serving end. We turn off disk caching on the USB and Firewire side by setting up the drives for "quick disconnect" so our results are consistent.
We use 2GB of system memory with timings of 3-3-3-9 and set our RAM disk to 450MB with system memory at 1550MB. Our standard file is the SPECviewPerf install file, which measures 432,533,504 bytes (412.4961MB). After copying this file to our RAM disk, we measured the time for writing from the RAM disk to our external USB 2.0, Firewire 400, or Firewire 800 drive utilizing our internal Windows based timing program. The copy times in seconds were then converted into Megabits per second (Mb) to provide a convenient means of comparing throughput. Higher Rates therefore mean better performance in this particular test.
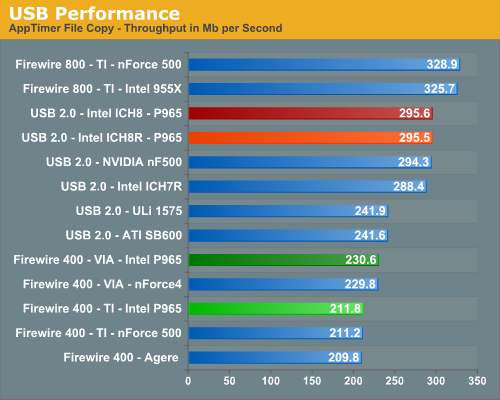
Possibly the most interesting finding in our Firewire and USB throughput tests is the outstanding performance of an external hard drive connected to Firewire 800. Our benchmarks show Firewire 800 is up to 42% faster than a drive connected to the more common Firewire 400, and about 11% faster than the fastest USB 2.0 solution.
We see our Intel ICH8 chipset finally overtake perennial champion NVIDIA in USB 2.0 performance. We see the USB performance on the ATI SB600 still trailing the other solutions but it has vastly improved compared to the SB450. The Firewire soltuion from VIA is still slightly faster than the TI solutions normally used.
Ethernet Performance
The current motherboard test suite includes LAN performance measurements. All of these boards utilize PCI or PCI Express based controllers with the only difference being the supplier of the core logic.
The Windows 2000 Driver Development Kit (DDK) includes a useful LAN testing utility called NTttcp. We used the NTttcp tool to test Ethernet throughput and the CPU utilization of the various Ethernet Controllers used on the Intel motherboards.
We set up one machine as the server; in this test, an Intel system with an Intel CSA Gigabit LAN connection. Intel CSA has a reputation for providing fast throughput and is a logical choice for our Gigabit LAN server.
On the server side, we used the following Command Line as suggested by the VIA whitepaper on LAN testing:
Ntttcpr -m 4,0,‹server IP› -a 4 -l 256000 -n 30000
On the client side (the motherboard under test), we used the following Command Line:Ntttcps -m 4,0,‹client IP› -a 4 -l 256000 -n 30000
At the conclusion of the test, we captured the throughput and CPU utilization figures from the client screen.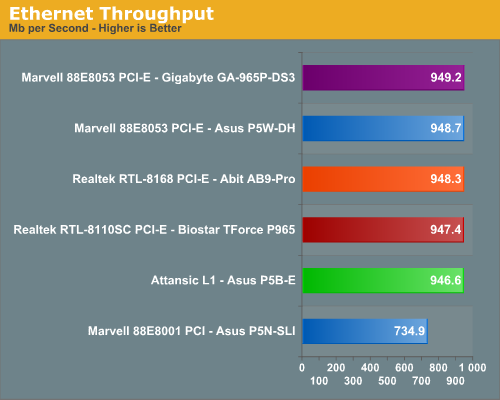
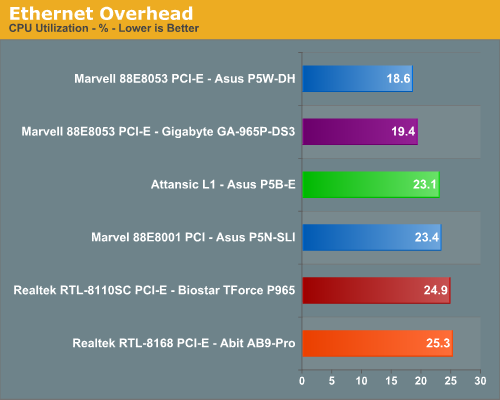
The CPU utilization performance favors the Marvell Gigabit controllers with the Realtek solutions having the highest utilization numbers. The throughput numbers also favor the Marvell Gigabit controllers with the Realtek options close behind. ASUS recently switched to the Attansic L1 PCI Express based controller chip with it posting decent results in each test. We do not understand ASUS's decision to utilize a PCI based Gigabit controller on the 570SLI when the NVIDIA chipset has native support for Gigabit operations. This decision results in the worse throughput and average CPU utilization numbers. However, even with throughput at 646Mb/s it still exceeds what most home networks are capable of and certainly any DSL or Cable based Internet connection.
Audio Performance
We limited audio testing to the Rightmark 3D Sound version 2.3 CPU utilization test and tested with sound enabled to show the performance effects on several games. The Rightmark 3D Sound benchmark measures the overhead or CPU utilization required by a codec or hardware audio chip.
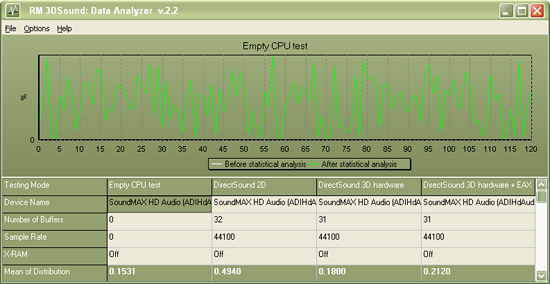
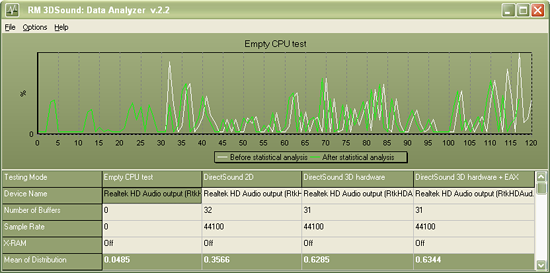
We are no longer showing the individual CPU utilization rates as the use of a dual core processor means the driver load is balanced between each processor with either audio solution. The 2.3 version of Rightmark properly supports dual core processors now but considering the results presented for review they are almost meaningless for these users at this time. We have found the CPU utilization rate improvements with the dual-core setup in this test do not have any bearing on actual game benchmarks as the reduction in frame rate percentages are the same on our single core systems.
ASUS has recently switched over to the Analog Devices SoundMAX series of HD Audio Codecs with the balance of manufacturers still using the Realtek ALC-88x HD Audio Codecs. Both audio chipset manufacturers offer equal settings in their applications although we prefer the look of the ADI control panel and the fact that most of the settings are available on the front screen. We are using the 4530 driver release for the ADI codecs and the 1.47 driver release for the Realtek codecs.
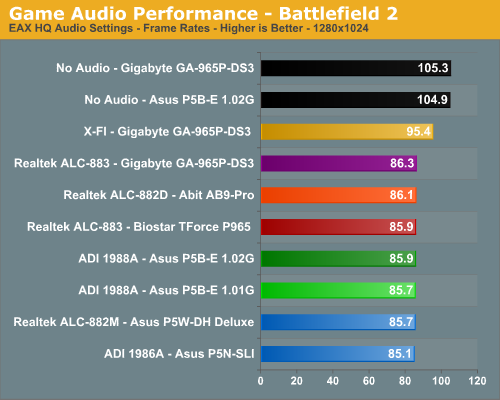
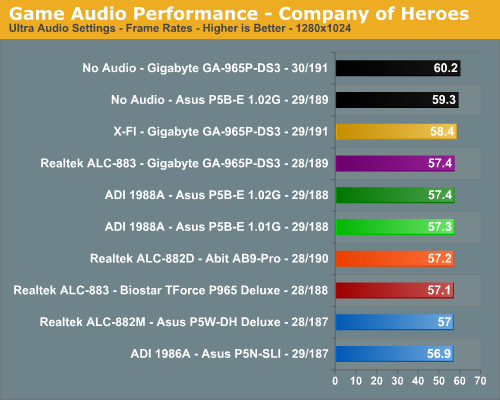
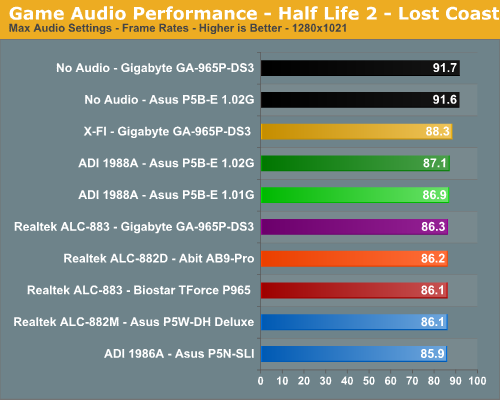
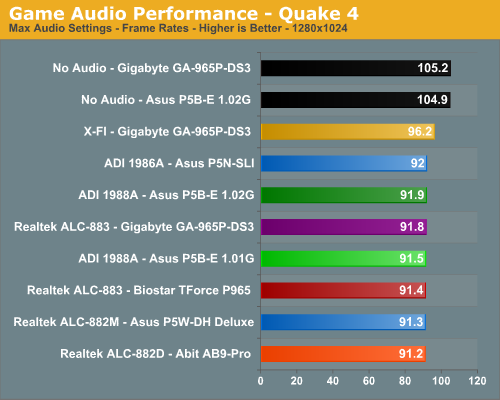
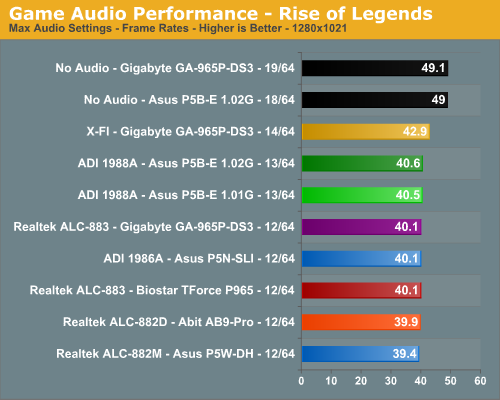
The audio performance numbers remain consistent between the Analog Devices and Realtek Codecs but both finish consistently behind the SoundBlaster X-FI in the benchmarks. This is to be expected as the ADI and Realtek Codecs are host processing units dependent upon the CPU and drivers for generating their audio streams. The SoundBlaster X-FI on the other hand has dedicated hardware that generates its audio streams and off loads this burden from the CPU. We are finding the CPU utilization to be constantly decreasing for the on-board solutions as CPU processing power increases and driver optimizations improve but they still take a toll in certain games. This is reflected in our numbers as Battlefield 2 has an average loss of 22% (was 28%), Quake 4 at 14% (was 21%), Half Life 2- Lost Coast at 5%, Company of Heroes at 5%, and Rise of Legends at 22%.
Rise of Legends is a very CPU intensive game with numerous sound effects and as such the CPU hit for generating audio is significant although we did not notice any stuttering during game play. Battlefield 2 utilizes EAX 2 for our ADI and Realtek HD Codecs which creates another significant on the CPU to process the audio streams, especially with the sound effects set to high. Quake 4 is the exception to the rule as it is generally GPU limited leaving additional CPU cycles for audio processing. In this case the ADI and Realtek solutions still create a large hit on frame rates in this game where frame rates are everything.
Analog Devices has made news lately claiming other host-based audio solutions (aimed at Realtek) do not properly generate EAX compatible audio in their drivers. During our testing we found this to be true to some degree. Since our previous Realtek testing always compared EAX 2 to the X-FI series we basically assumed some of the muddy audio (complete lack of obstructions and occlusions) we encountered in Battlefield 2 as an example were just issues with the Codec or a poor implementation of EAX 2 in the drivers. After comparing the ADI 1988A to the Realtek ALC-882D in Battlefield 2 we completely agree the issues we heard before are strictly driver related. In fact, the ADI 1988A generated EAX 2 sound effects that were very close or equal to our Audigy 2 and within hearing distance of our X-FI. The audio quality difference in EAX capable games between the ADI and Realtek HD Audio Codecs were almost startling. We firmly believe this is due to obstructions and occlusions not being implemented correctly in the Realtek drivers.
The audio differences in other games such as Company of Heroes were minimal although you could still tell the difference. This was especially true in the CoH benchmark where the two Ammerican soldiers are treading through the water to meet their group. You could hear the water gently move as they walked while with the Realtek solution the water sounded like a wet mop. This pattern held true for all of our games we tested throughout the benchmark process including twenty five games that we tested off-line. While ADI has had some driver issues in the past we found both the 4530 and 4570 drivers to be very stable and almost problem free. We have some reports of ADI driver issues from our readers that we are still investigating at this time with the ASUS P5B-Deluxe board. We believe ASUS made the right decision to switch to ADI for their more enthusiast level boards at this time.
Obviously, if you are a serious gamer, then a dedicated sound card is still useful to ensure consistent frame rate averages across a wide variety of games, and in the case of the Sound Blaster X-FI, you also get improved audio quality and EAX3/4/5 support. If you'd like more details on the Realtek or ADI solutions, you can refer to the Realtek HD Audio Codec Specifications or SoundMAX HD Audio Codec Specifications .
Final Words
After twenty five pages of information we can safely say that an Intel P965 is still an Intel P965 no matter which motherboard you place it in. This should come as no big surprise as the days of one motherboard manufacturer truly outperforming another one at stock clock speeds with the same chipset are over. The basis of competition is now on features, price, warranty, appearance, overclocking capability, accessories, availability, support, and reliability. If that sounds a lot like the motherboard being a commodity item, it is, as the consumer now expects or demands a certain level of performance and support from all motherboards. They will pay extra for the features that are deemed important based upon their needs. One only has to look at the fallout and consolidation of the motherboard suppliers over the past couple of years to realize this simple fact.
While we believe performance is still extremely important, it is no longer the only reason to consider a particular motherboard supplier. In our opinion, the features, price, support, and reliability of the motherboard should be first on your list as base performance will generally be equal among all motherboards based on the same chipset. To a lesser degree even the performance amongst various chipsets for the same CPU family is almost identical now. It always comes back to features and support for making that final decision in our opinion.
We would love to make a final decision on the boards we tested today but we have another eight or so left to present to you. We can draw a few conclusions from the results and information we presented after testing these boards for the past few weeks. Our first conclusion is that the P965 was released too early, and the first motherboards, while being very solid from a features and quality viewpoint, had very immature BIOS releases.
The inability of several boards to boot with most performance oriented memory modules was inexcusable. Do not get us wrong as it took two to tango this dance. We blame the memory manufacturers also as they were just as guilty by having modules in the market with SPD settings that assumed the board would boot at 2.0V or higher. While the motherboard manufacturers will state they followed Intel's 1.8V requirement they are still guilty for not having the BIOS cycle properly to recognize the memory speed, voltage, or timings after the initial POST issue. The majority of these issues have been solved with the latest BIOS or SPD releases. We still cringe when installing a new memory module but now concentrate on how well it performs instead of crossing our fingers and calling the psychic hotline.
Other issues included incompatibilities with the new SATA/IDE controller chips resulting in PIO mode operation or failure to see the drive at all. This goes back to quality control and pushing an early release. It also brings up the point that Intel in their infinite wisdom decided to pull PATA support from this chipset when over 98% of optical drives are still based on PATA technology. They could have waited for the Bearlake chipset next year to do this as the switch to SATA based optical drives is just now beginning. This change also increased the cost and complexity of the motherboards as you now introduce another chipset on each and every motherboard sold.
Overall, the BIOS releases have greatly matured and the amount of issues have declined sharply over the last two months. In this case we have to give credit to the motherboard and memory suppliers for acting quickly... but only after upsetting an untold number of customers. While there are still a few nagging issues here and there, like getting AHCI to work on the Intel ICH8R equipped boards without an engineering degree and a day off, we are seeing most of the issues being reduced now to what we have come to live with in an open PC hardware world. Those issues would be where a combination of parts that you would never expect to be used together creates an issue that is extremely difficult to fix or even diagnose. We still get mail on a fair share of those and will report our findings in the final article. We can safely say that with the list of components used in our test bed, our motherboards were virtually free of issues that would cause instability or create a no-POST situation.
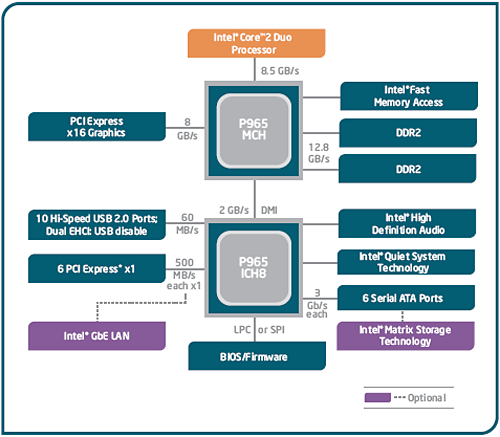
Overall, the Gigabyte GA-965P-DS3 performed the best in our benchmarks when not overclocked. This is a very good accomplishment and shows a level of consistency and fine tuning that was not matched by the other suppliers. However, the total margin of victory over the other P965 motherboards is less than one percent. It took several hundred hours of benchmarking to come to this conclusion and without those benchmarks it would have been impossible to tell the difference between any of the P965 motherboards tested today. Gigabyte has not solved their Micron D9 1GB module issue yet so they are stuck in the 450FSB range with our test components. So please guys, get this fixed. In the end we still congragulate Gigabyte on their accomplishment with the GA-965P-DS3. This board and a few others released this summer have restored our faith in Gigabyte.
The overclocking capability of the ASUS motherboards continue to be impressive in their mid-range series. If you are looking to get the highest possible overclocking results with an E6300 or E6400 processor then we would recommend the ASUS P5B-E 1.02G at this time. Of course it is not available yet (it will be shortly) and unless you have expensive PC2-8000 RAM then chances of going over 500FSB are not that great with the ASUS P5B-E 1.01G board. However, it is hard to complain about the ASUS 1.01G board with 7x490FSB results using mid-range PC2-6400 memory. Even though we no longer care for the base ASUS color scheme (please switch to black across the board) we really found this board to be a significant improvement over the P5-B when overclocking.
Biostar engineered a beautiful motherboard but it has a 500FSB level BIOS limit and more importantly you cannot find the board for sale in most locations. That brings us to Abit, which has improved the AB9-Pro overclocking capabilities a great deal since we first reviewed the board but apparently has reached its limits at this time. If you have an E6400 or E6600 then this board still has great overclocking potential for the majority of users.
When it comes to features we really liked the ASUS and Abit boards as they provided just about every possible option on a midrange/performance motherboard that one could want. While the Gigabyte and Biostar boards are also feature rich, they both lack Firewire support which should be a given on boards in this price range. We have to give Biostar a gold star for overall layout design although the location of the 24-pin and 4-pin ATX power connectors are a detraction. The ASUS and Gigabyte motherboards have fairly standard layouts that we could live with on a daily basis but we have to wonder what the layout design group at Abit was thinking when they placed the IDE and two SATA connectors between the PCI Express x1 and PCI slots. We will call it a creative design inspiration at this time to be nice as we still like the board's overall capabilities.
The Analog Devices AD1988A HD Audio Codec really put the screws to the Realtek ALC-88x series of HD Audio Codecs in our EAX 2 gaming tests. The EAX sounds were clear and concise unlike some of the warbling and muddy sound generated by the Realtek codecs in our Battlefield 2 test. While the audio quality of both codecs was almost equal in our standard game, DVD video, and audio tests we still think the ADI solution had the superior overall audio quality. However, if you are into serious gaming or enjoy your music on a PC then a dedicated sound card is still highly recommended. For the balance of users the current on-board HD audio solutions are more than adequate although we wonder why C-Media is no longer an option.
Wrapping up part one, there was not a real loser in this group. Each board has its strengths and weaknesses so it comes down to what the individual user wants in a board that will meet their needs. We received varying support from each supplier and not in the way you would think. Our direct support was excellent but we wanted to find out how well the manufacturers supported a retail customer so we acted like one. We logged on to their support forums if available and asked questions about our issues or those of other users. We purchased retail boards (when possible) and called technical support. We emailed, faxed, or otherwise bugged the hell out of some customer support personnel for the last six weeks. We will provide our results in the final article and these results will help determine our Editor's Choice awards. After all, it's not just about performance anymore.


