Original Link: https://www.anandtech.com/show/14223/the-western-digital-wd-blue-sn500-ssd-review
The Western Digital WD Blue SN500 SSD Review: Moving The Mainstream To NVMe
by Billy Tallis on April 19, 2019 9:30 AM EST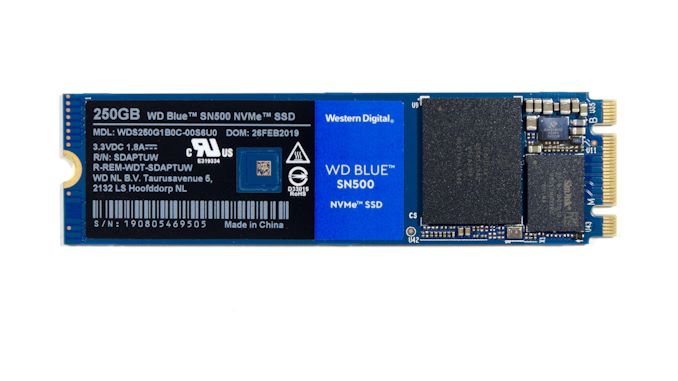
Western Digital's mainstream consumer drives have long been branded as WD Blue drives, and this carried over to SSDs after their acquisition of SanDisk. The first two generations of WD Blue SSDs were SATA drives using TLC NAND and were worthy competitors for the Crucial MX series and Samsung 850 EVO. The WD Blue SN500 is the third generation WD Blue SSD, and it moves the WD Blue brand over to a very different market segment: the SN500 is an entry-level M.2 NVMe drive.
Western Digital has been selling consumer NVMe drives for a few years using their high-end WD Black branding, but NVMe isn't just for enthusiast products any more. For the past year we've been seeing most SSD brands offering a lower tier of NVMe products that sit between their SATA and high-end NVMe offerings, both in terms of price and performance. This entry-level NVMe niche has at times been squeezed down to almost nothing when there are particularly well-priced high-end drives, but the general idea of splitting the consumer NVMe SSD market into two tiers isn't going away. SATA is starting to be phased out of use for primary storage in client PCs. Western Digital started supporting that trend over a year ago with the PC SN520 SSD for OEMs, which the WD Blue SN500 is derived from.
| WD Blue SN500 Specifications | ||||
| Capacity | 250 GB | 500 GB | ||
| Form Factor | M.2 2280 Single-Sided | |||
| Interface | NVMe PCIe 3 x2 | |||
| Controller | Western Digital in-house | |||
| NAND | SanDisk 64-layer 3D TLC | |||
| DRAM | None (Host Memory Buffer not supported) | |||
| Sequential Read | 1700 MB/s | 1700 MB/s | ||
| Sequential Write | 1300 MB/s | 1450 MB/s | ||
| 4KB Random Read | 210k IOPS | 275k IOPS | ||
| 4KB Random Write | 170k IOPS | 300k IOPS | ||
| Power | Peak (10µs) | 5.94 W | 5.94 W | |
| PS3 Idle | 25 mW | 25 mW | ||
| PS4 Idle | 2.5 mW | 2.5 mW | ||
| Endurance | 150 TB 0.3 DWPD |
300 TB 0.3 DWPD |
||
| Warranty | 5 years | |||
| Current Retail Price | $52.99 (21¢/GB) |
$72.99 (15¢/GB) |
||
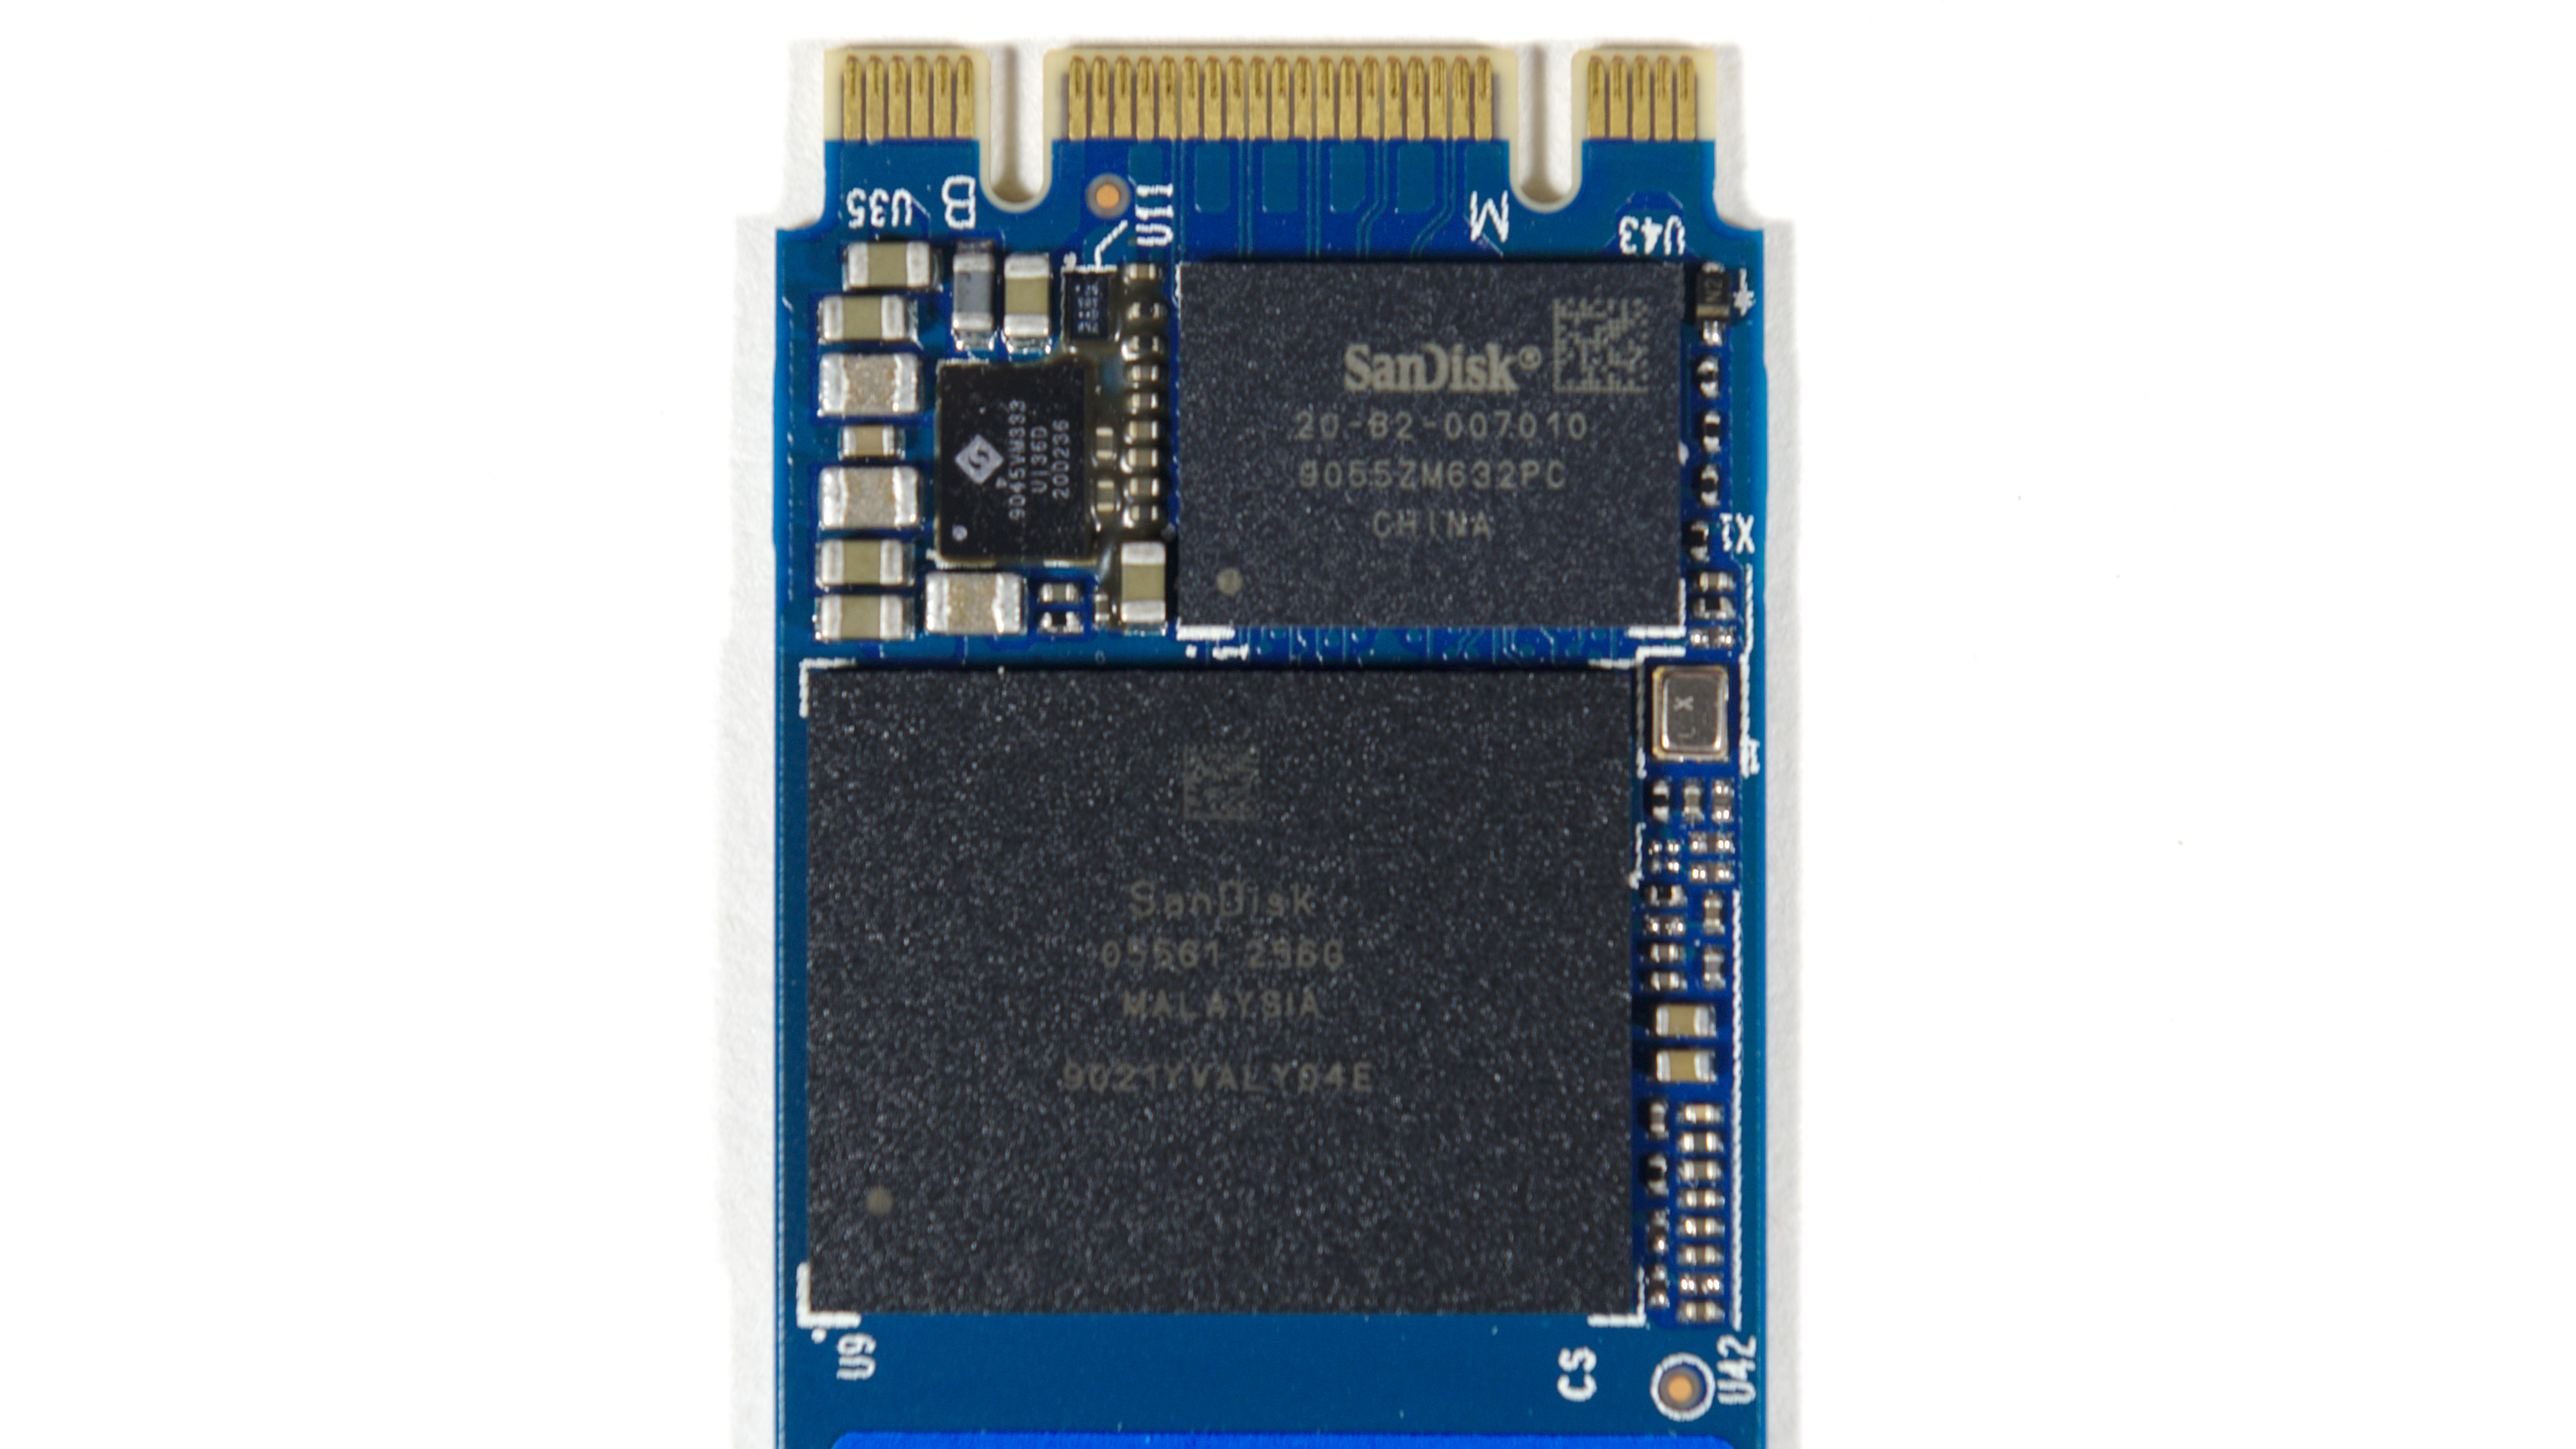
Despite bearing the WD Blue name, the SN500 is functionally not a direct replacement for the SATA WD Blue SSDs. The SATA predecessors offered capacities up to 2TB, while the SN500's only capacity options are currently 250GB and 500GB. Those are the most common and important capacity points for consumer SSDs, but the absence of 1TB and 2TB options are a glaring omission, especially now that 1TB drives are approaching $100. The lack of high-capacity versions of the SN500 make sense when considering the OEM SN520 it is based on: that drive was intended to compete against the smallest form factor SSDs used tablets and the thinnest notebooks. The OEM SN520 is available in form factors as small as M.2 2230, and even though the retail SN500 uses the more typical 80mm length that offers the broadest compatibility with consumer systems, it retains the same layout that puts all the electronics in the first 30mm of the card. The SN500 uses a design that was never intended to accommodate more than 512GB of flash. The extra length on the card is occupied only by the drive's label.
Like many entry-level NVMe SSDs the SN500 uses only two PCIe lanes for its host interface, which ensures it cannot match the peak performance of high-end drives with PCIe x4 connections. The lower lane count helps keep the pin count and power consumption of the controller down, which are important factors for a M.2 2230 drive but matter considerably less for a retail drive like the SN500.
The other major compromise in the SN500's design is that it does not feature a DRAM buffer for caching the mapping tables for translating logical block addresses (LBAs) into physical memory addresses. A DRAMless SSD usually has significantly lower performance than a mainstream drive with enough DRAM to store the mapping information for the entire SSD. In the NVMe world, the Host Memory Buffer feature allows SSDs to borrow a small amount of the main system RAM (usually a few tens of MB) for this purpose, offsetting the performance loss that DRAMless SATA drives cannot avoid. Western Digital chose not to use the Host Memory Buffer (HMB) feature for the SN500 and SN520, instead opting to include a few MB of memory in the controller itself, but nowhere near the 256MB or 512MB that would be included on drives with discrete DRAM chips.
Aside from those two limitations, the SN500's controller shares the same basic architecture that the WD Black SN750's controller uses. Western Digital designed this architecture to scale across a wide range of products, so the cut-down configuration we find on the SN500 was part of the plan all along. These are the first generation of in-house NVMe controller designs from Western Digital, but based on our experience with the WD Blacks it doesn't feel like a 1.0 product: they skipped over all the disappointments that Silicon Motion and Phison had with their first NVMe controllers, and instead the WD Black went toe to toe with Samsung's NVMe SSDs. The WD Blue SN500 won't be setting any performance records with just a PCIe x2 interface, but it does have the opportunity to continue the impressive track record on power efficiency that Western Digital has been building.
The WD Blue SN500 may be a bit low-end by NVMe standards, but its performance specifications are still far above what SATA SSDs can provide. The SN500's write endurance rating of 0.3 DWPD over a 5-year warranty is standard for mainstream and many high-end SSDs. The current retail pricing is about 10-15% higher than the good deals on mainstream SATA SSDs of comparable capacity, so Western Digital is only charging a small premium for delivering NVMe performance. There are other DRAMless NVMe SSDs and some QLC-based NVMe SSDs on the market that are cheaper than the WD Blue SN500, so the new WD Blue has to do more than just outperform SATA in order to be competitive.
| AnandTech 2018 Consumer SSD Testbed | |
| CPU | Intel Xeon E3 1240 v5 |
| Motherboard | ASRock Fatal1ty E3V5 Performance Gaming/OC |
| Chipset | Intel C232 |
| Memory | 4x 8GB G.SKILL Ripjaws DDR4-2400 CL15 |
| Graphics | AMD Radeon HD 5450, 1920x1200@60Hz |
| Software | Windows 10 x64, version 1709 |
| Linux kernel version 4.14, fio version 3.6 | |
| Spectre/Meltdown microcode and OS patches current as of May 2018 | |
- Thanks to Intel for the Xeon E3 1240 v5 CPU
- Thanks to ASRock for the E3V5 Performance Gaming/OC
- Thanks to G.SKILL for the Ripjaws DDR4-2400 RAM
- Thanks to Corsair for the RM750 power supply, Carbide 200R case, and Hydro H60 CPU cooler
- Thanks to Quarch for the XLC Programmable Power Module and accessories
- Thanks to StarTech for providing a RK2236BKF 22U rack cabinet.
Whole-Drive Fill
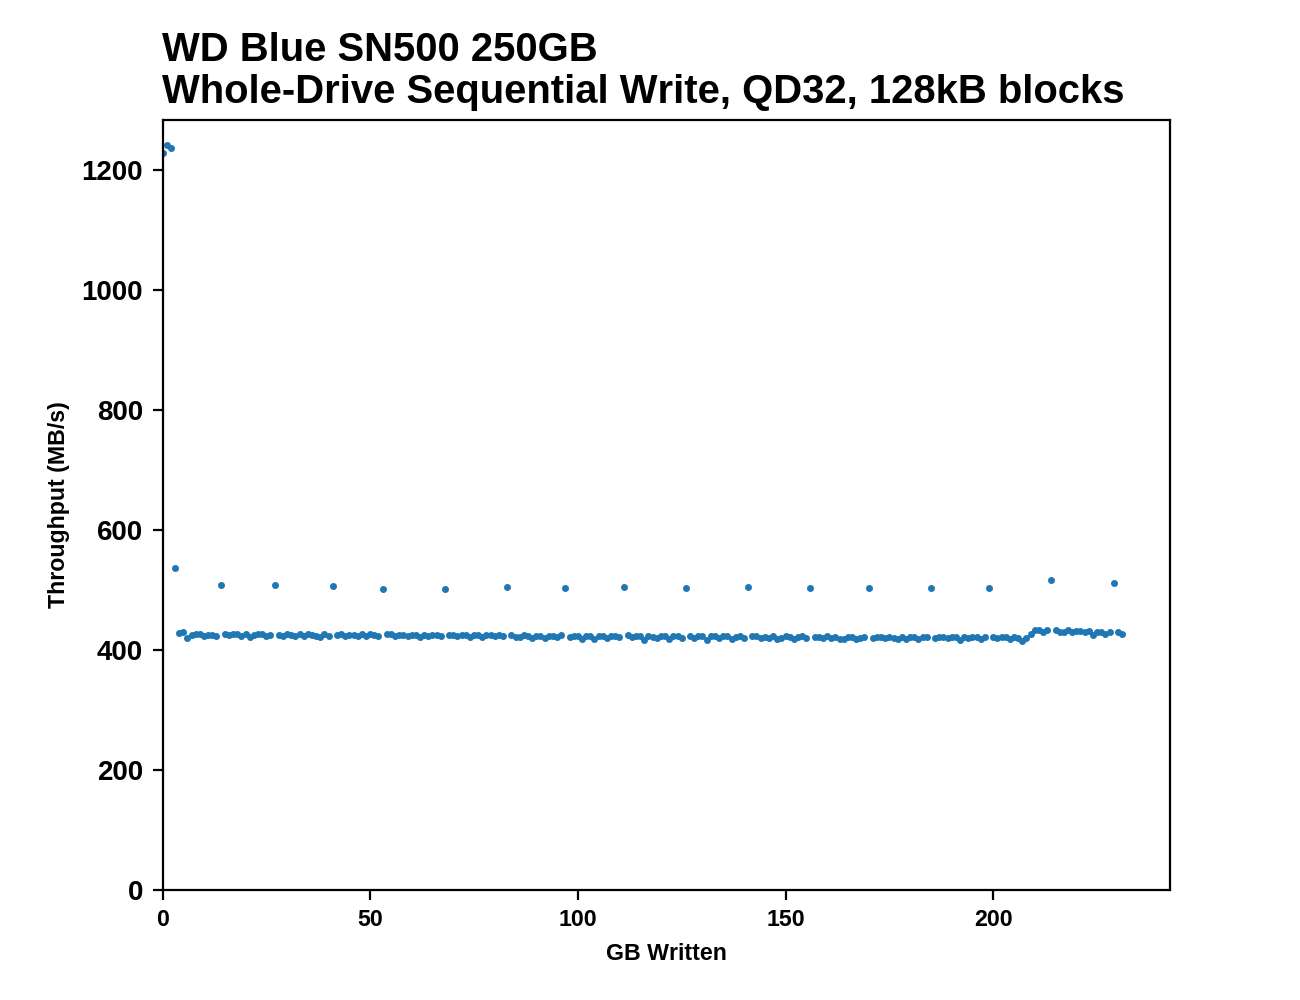
This test starts with a freshly-erased drive and fills it with 128kB sequential writes at queue depth 32, recording the write speed for each 1GB segment. This test is not representative of any ordinary client/consumer usage pattern, but it does allow us to observe transitions in the drive's behavior as it fills up. This can allow us to estimate the size of any SLC write cache, and get a sense for how much performance remains on the rare occasions where real-world usage keeps writing data after filling the cache.
 |
|||||||||
The 250GB WD Blue SN500's SLC write cache lasts for a mere 3GB before the write speed drops down to SATA speeds. After the cache is exhausted, the write speed is very consistent, with periodic short of higher performance that last for less than 1GB.
 |
|||||||||
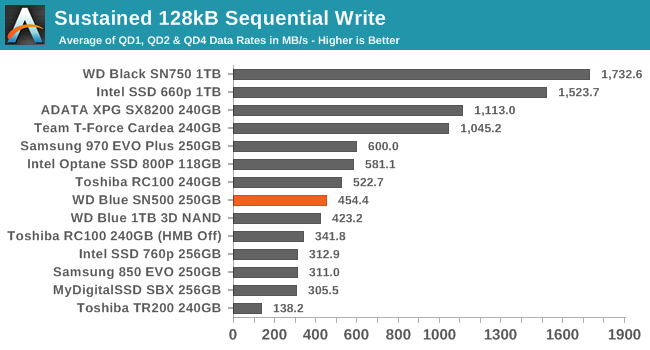
| Average Throughput for last 16 GB | Overall Average Throughput | ||||||||
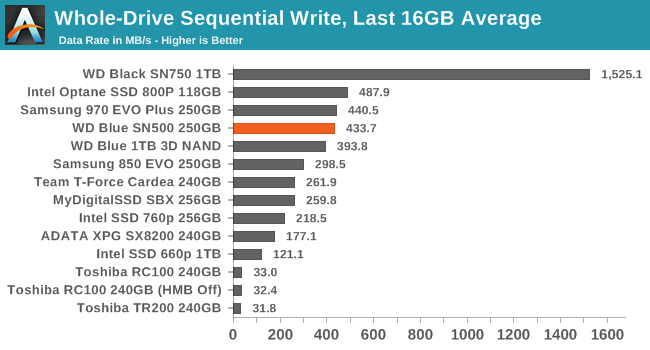
The SN500's sustained sequential write speed of about 432MB/s doesn't make much use of the speed offered by the PCIe host connection, but it's very good for a drive in this capacity class: the Samsung 970 EVO Plus is barely any faster, though its SLC cache is much larger. None of the other low-end NVMe drives we've tested come close to sustaining the long-term write performance that the SN500 provides.
Working Set Size
Most mainstream SSDs have enough DRAM to store the entire mapping table that translates logical block addresses into physical flash memory addresses. DRAMless drives only have small buffers to cache a portion of this mapping information. When accessing a logical block whose mapping is not cached, the drive needs to read the mapping from the full table stored on the flash memory before it can read the user data stored at that logical block. This adds extra latency to read operations and in the worst case may double random read latency.
We can estimate the size of any on-controller mapping buffer by performing random reads from different sized portions of the drive. When performing random reads from a small slice of the drive, we expect the mappings to all fit in the cache, and when performing random reads from the entire drive, we expect mostly cache misses.
When performing this test on mainstream drives with a full-sized DRAM cache, we expect performance to be generally constant regardless of the working set size, or for performance to drop only slightly as the working set size increases.
 |
|||||||||
The SN500 offers good random read IOPS for working set sizes up to about 4GB before performance begins to decline. Based on the usual ratio of requiring 1MB of mapping data cache per GB of storage, it looks like the SN500's controller devotes around 4MB of SRAM to this purpose. That's significantly smaller than the typical Host Memory Buffer sizes used by DRAMless NVMe SSDs that implement that feature. For example, the Toshiba RC100 uses an HMB of 38MB and maintains random read performance out to at least 24GB working set sizes.
While the SN500's cache of address mapping data may be rather small, it is clearly plenty fast: for small working set sizes, the SN500's random read performance is higher than the WD Black SN750.
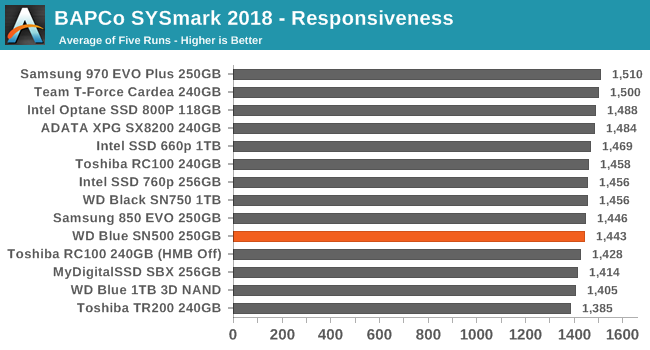
BAPCo SYSmark 2018
BAPCo's SYSmark 2018 is an application-based benchmark that uses real-world applications to replay usage patterns of business users, with subscores for productivity, creativity and responsiveness. Scores represnt overall system performance and are calibrated against a reference system that is defined to score 1000 in each of the scenarios. A score of, say, 2000, would imply that the system under test is twice as fast as the reference system.
SYSmark scores are based on total application response time as seen by the user, including not only storage latency but time spent by the processor. This means there's a limit to how much a storage improvement could possibly increase scores, because the SSD is only in use for a small fraction of the total test duration. This is a significant difference from our ATSB tests where only the storage portion of the workload is replicated and disk idle times are cut short to a maximum of 25ms.
| AnandTech SYSmark SSD Testbed | |
| CPU | Intel Core i5-7400 |
| Motherboard | ASUS PRIME Z270-A |
| Chipset | Intel Z270 |
| Memory | 2x 4GB DDR4-2666 CL15 |
| Case | In Win C583 |
| Power Supply | Cooler Master G550M |
| OS | Windows 10 64-bit, version 1803 |
Our SSD testing with SYSmark uses a different test system than the rest of our SSD tests. This machine is set up to measure total system power consumption rather than just the drive's power.
 |
|||||||||
| Creativity | Productivity | Responsiveness | Overall | ||||||
Only the Responsiveness subscore shows a meaningful difference between SSDs of similar capacities, and even then the difference between the top NVMe drives and the slowest DRAMless SATA drives is fairly small. The WD Blue SN500's Responsiveness score is a bit slower than average for this bunch of SSDs, but as more of an entry-level NVMe drive this isn't a disappointment for the SN500.
Energy Usage
The SYSmark energy usage scores measure total system power consumption, excluding the display. Our SYSmark test system idles at around 26 W and peaks at over 60 W measured at the wall during the benchmark run. SATA SSDs seldom exceed 5 W and idle at a fraction of a watt, and the SSDs spend most of the test idle. This means the energy usage scores will inevitably be very close. A typical notebook system will tend to be better optimized for power efficiency than this desktop system, so the SSD would account for a much larger portion of the total and the score difference between SSDs would be more noticeable.
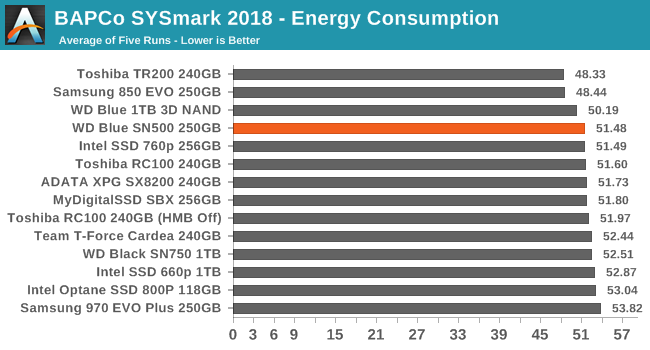
The WD Blue SN500 is one of the most efficient NVMe drives in its capacity class, but the SATA drives still take all the top scores for energy consumption over the course of a SYSmark run. There are several faster NVMe drives that have power requirements only slightly above the SN500 despite including the DRAM cache the SN500 lacks.
AnandTech Storage Bench - The Destroyer
The Destroyer is an extremely long test replicating the access patterns of very IO-intensive desktop usage. A detailed breakdown can be found in this article. Like real-world usage, the drives do get the occasional break that allows for some background garbage collection and flushing caches, but those idle times are limited to 25ms so that it doesn't take all week to run the test. These AnandTech Storage Bench (ATSB) tests do not involve running the actual applications that generated the workloads, so the scores are relatively insensitive to changes in CPU performance and RAM from our new testbed, but the jump to a newer version of Windows and the newer storage drivers can have an impact.
We quantify performance on this test by reporting the drive's average data throughput, the average latency of the I/O operations, and the total energy used by the drive over the course of the test.
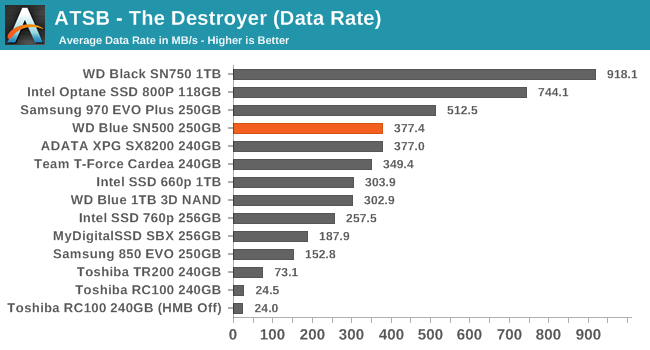
The average data rate of the WD Blue SN500 on The Destroyer puts it in a tie with the ADATA SX8200 and ahead of other entry-level NVMe drives. The 250GB SN500 outperforms even the 1TB SATA WD Blue SSD and the 1TB QLC-based Intel 660p. Samsung's 970 EVO Plus is significantly faster overall, but that's to be expected considering there is no more high-end option in this capacity class.
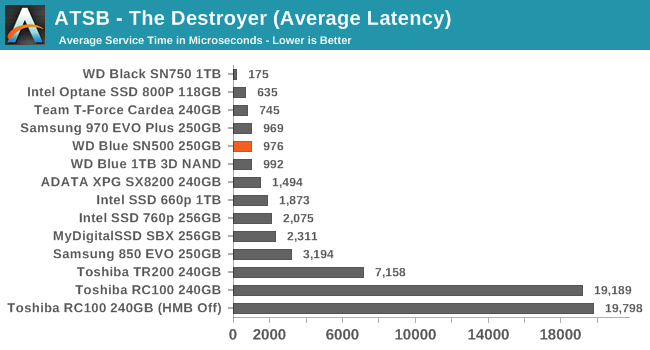
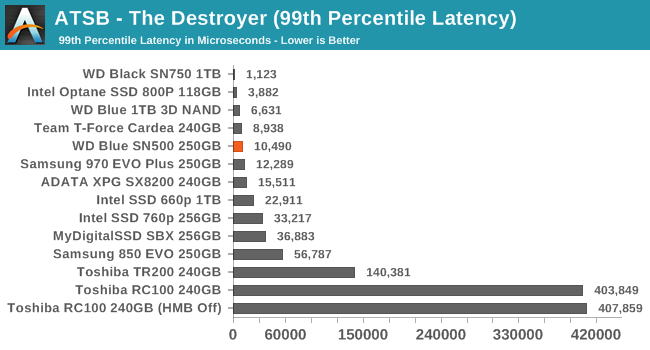
The great average and 99th percentile latency scores from the WD Blue SN500 on The Destroyer make it easy to forget that the SN500 is designed to be an entry-level NVMe drive, not a flagship high-end product (to the extent that such a thing is possible with TLC NAND in such small quantities).
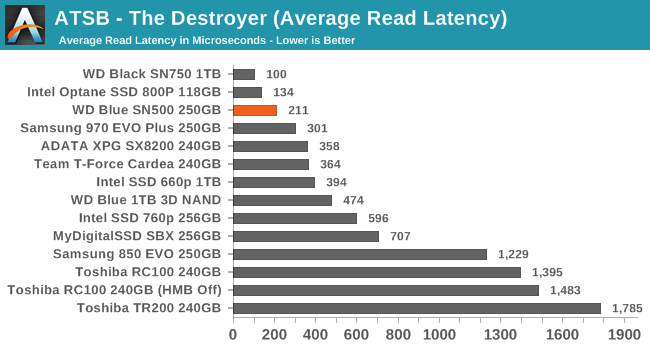
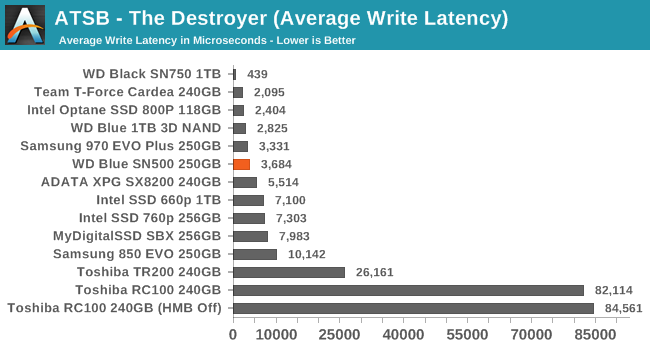
The average read latency of the WD Blue SN500 on The Destroyer is faster than any other drive in its capacity class, and only 60% slower than the Intel Optane 800p. The average write latency doesn't stand out much from the competition, but the SN500 is still behaving more like a high-end drive rather than showing any of the acute weaknesses often found in entry-level products.
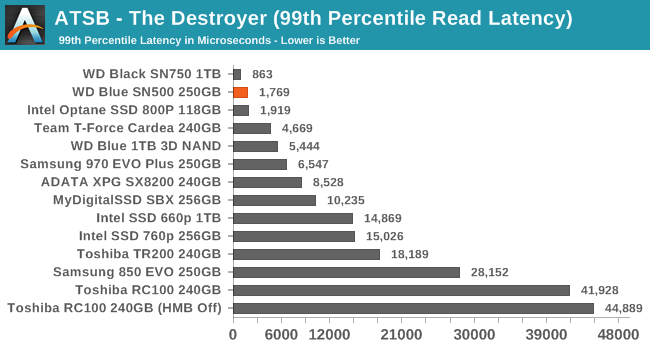
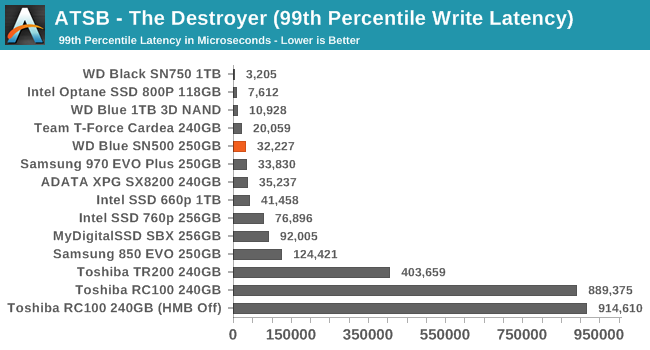
The 99th percentile read and write latency scores from the SN500 are similarly excellent, and better than can reasonably be expected from a DRAMless SSD that we know is doing a lot of background garbage collection during this test.
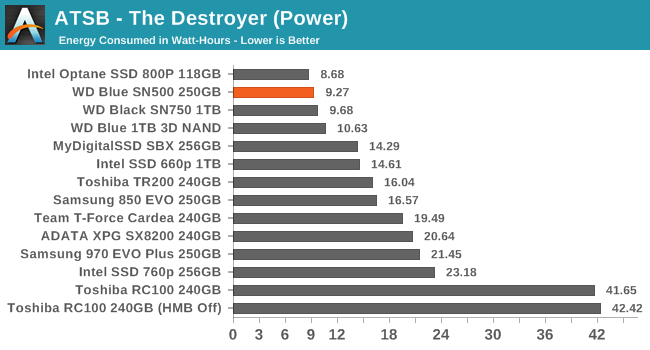
The WD Blue SN500 was quite power efficient during The Destroyer; despite being significantly slower overall than the WD Black SN750, the SN500 used a bit less energy in total. The other drives in its capacity class all used at least 50% more energy to complete this test, and the Toshiba RC100 despite seeming most similar at a high level (DRAMless, TLC, NVMe) took several times longer to run the test and used several times the energy.
AnandTech Storage Bench - Heavy
Our Heavy storage benchmark is proportionally more write-heavy than The Destroyer, but much shorter overall. The total writes in the Heavy test aren't enough to fill the drive, so performance never drops down to steady state. This test is far more representative of a power user's day to day usage, and is heavily influenced by the drive's peak performance. The Heavy workload test details can be found here. This test is run twice, once on a freshly erased drive and once after filling the drive with sequential writes.
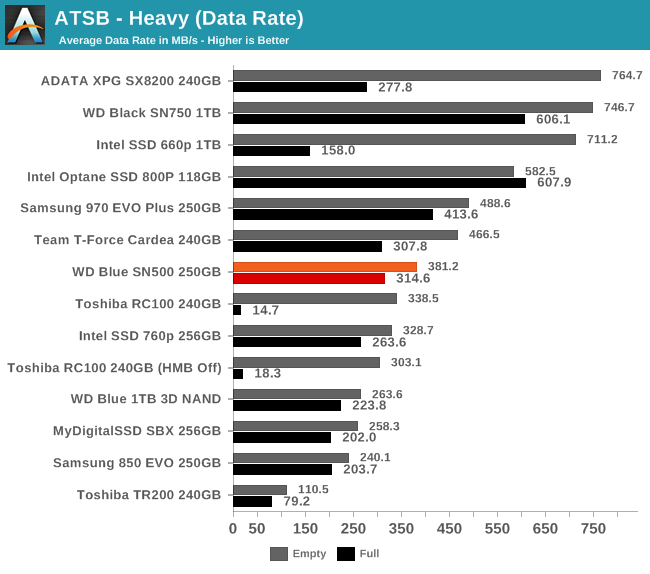
Since the Heavy test is shorter but in some ways more intense than The Destroyer, most of the drives with PCIe x4 interfaces are able to deliver better average data rates here than the WD Blue SN500. However, despite not being able to match the high-end drives for peak performance, the SN500 is more competitive when the test is run on a full drive.
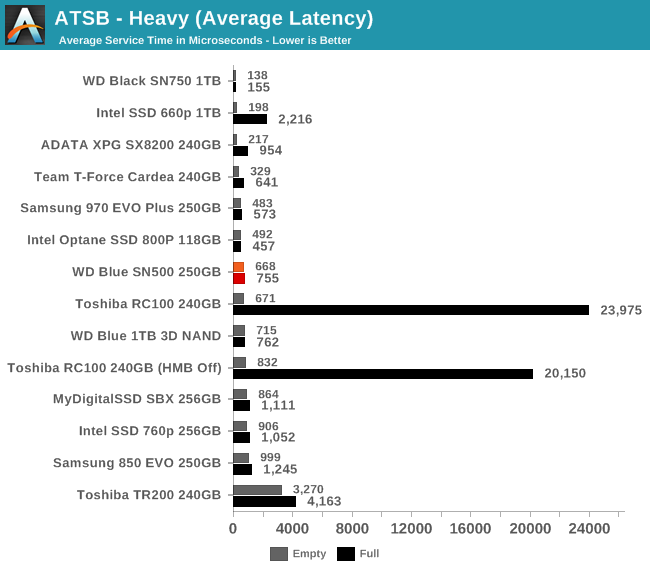

The average and 99th percentile latency scores for the WD Blue SN500 on the Heavy test are good but are still beat by the Samsung 970 EVO Plus and on the empty-drive test runs, by the ADATA SX8200. Without labels on these charts, it would be impossible to point out the SN500 as a DRAMless drive, but the Toshiba drives and the QLC drive are clear outliers.
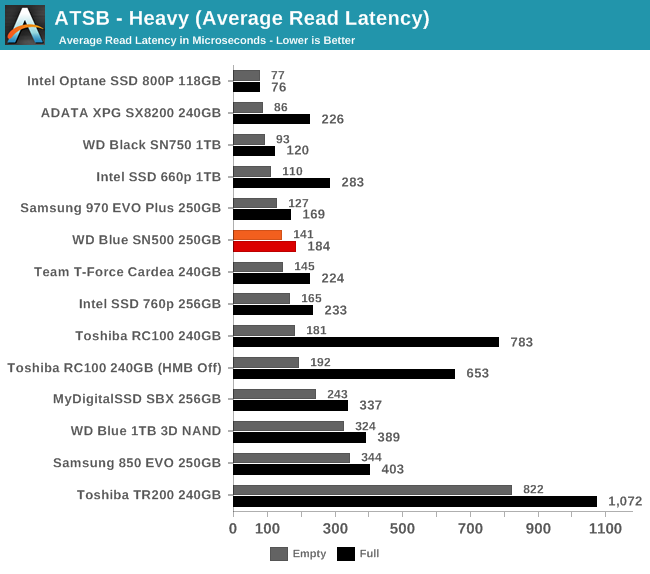
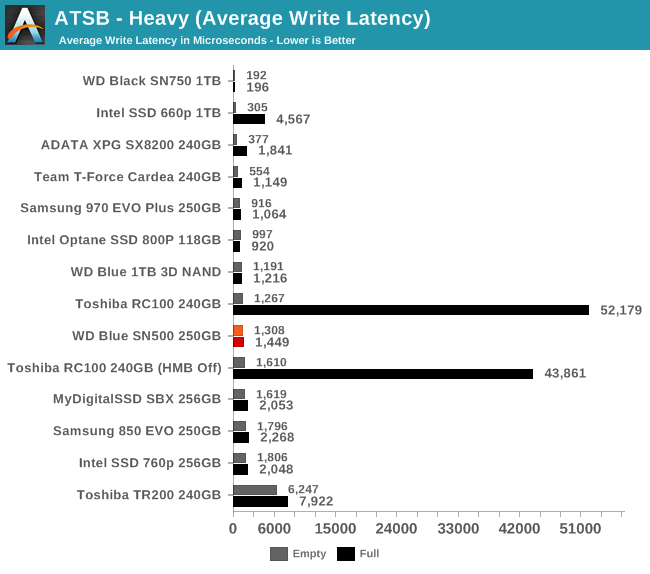
The average read and write latencies for the SN500 are competitive with other NVMe drives of similar capacity, and neither score is significantly degraded on the full-drive test runs.
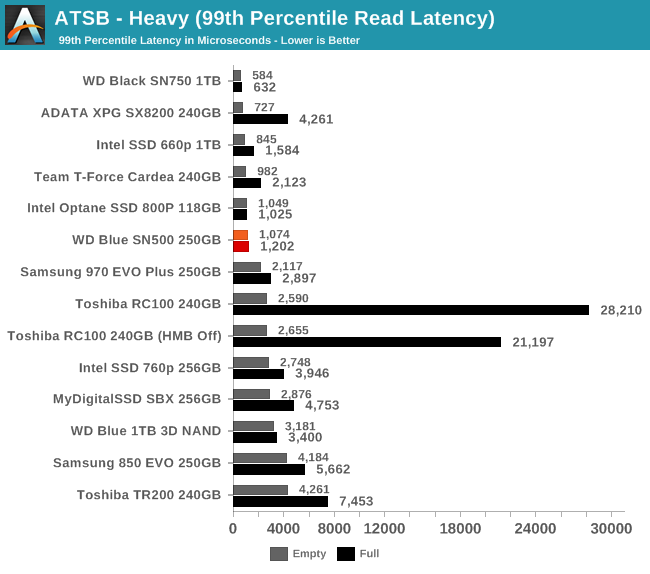
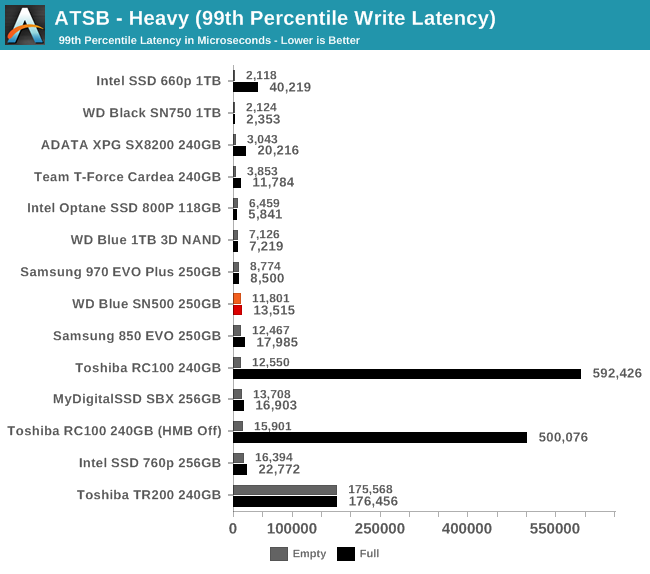
The 99th percentile read and write latencies are also quite good. For reads in particular, the WB Blue SN500 shows less impact from running the test on a full drive than all of its competitors.

The WD Blue SN500 is not the only NVMe drive that can complete the Heavy test while using no more power than a decent SATA drive. However, it is more affordable than the most efficient high-end drives and doesn't suffer from the horrible worst-case scenario that ruined the Toshiba RC100's full-drive scores.
AnandTech Storage Bench - Light
Our Light storage test has relatively more sequential accesses and lower queue depths than The Destroyer or the Heavy test, and it's by far the shortest test overall. It's based largely on applications that aren't highly dependent on storage performance, so this is a test more of application launch times and file load times. This test can be seen as the sum of all the little delays in daily usage, but with the idle times trimmed to 25ms it takes less than half an hour to run. Details of the Light test can be found here. As with the ATSB Heavy test, this test is run with the drive both freshly erased and empty, and after filling the drive with sequential writes.
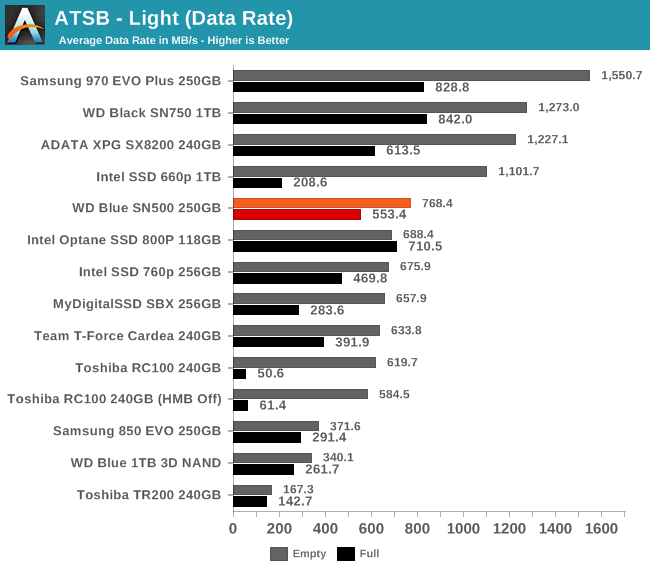
The best high-end NVMe drives offer average data rates on the Light test that are twice what the WD Blue SN500 can manage, though the perceived difference in performance for such light workloads is much smaller. When the test is run on a full drive, the fastest drives lose a much larger share of their performance and the SN500 ends up being only a bit slower than the high-end competition.
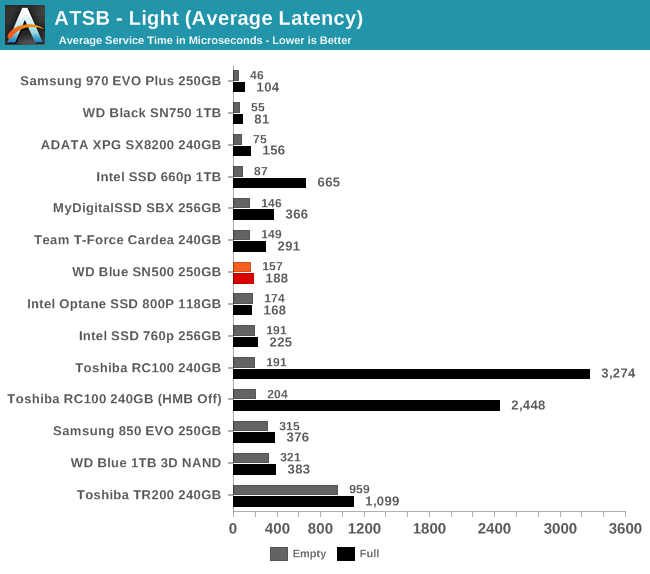
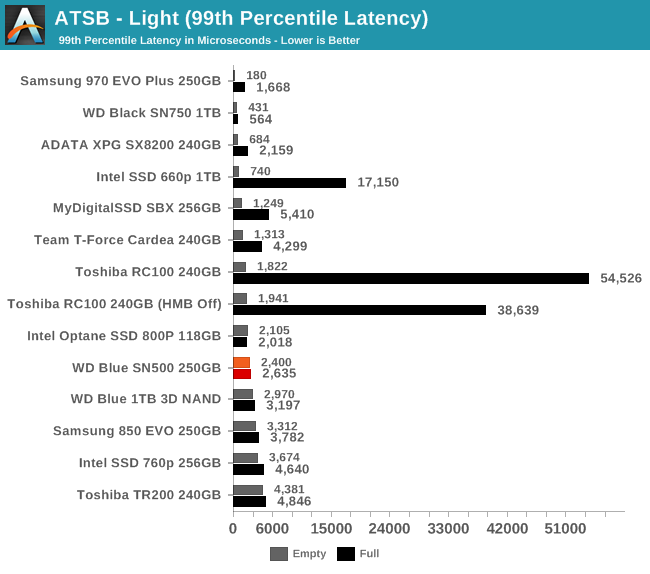
The average and 99th percentile latencies for the WD Blue SN500 on the Light test are clearly higher than for the top high-end drives, but the good full-drive behavior of the SN500 means it doesn't stick out like some entry-level NVMe drives.
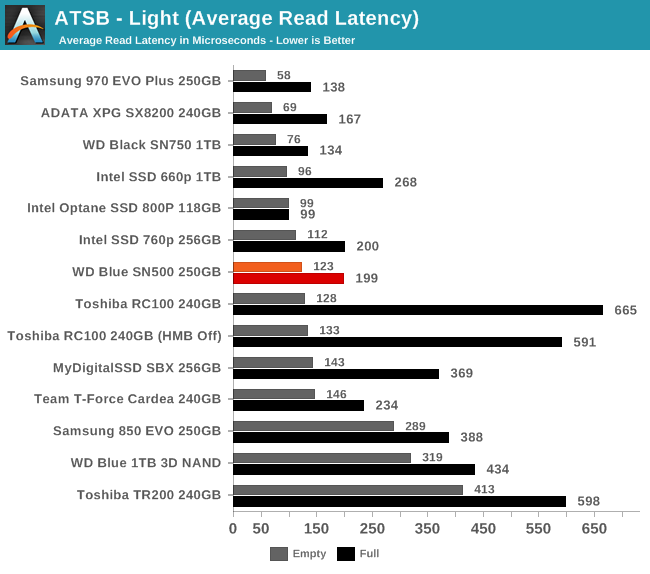
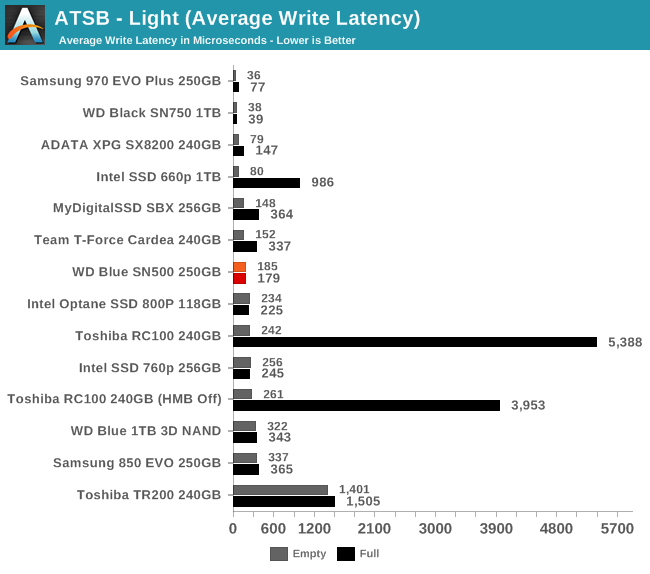
The WD Blue SN500's average write latency shows basically no impact from running the Light test on a full drive, and the impact on average read latency is much smaller than for most drives, especially entry-level NVMe.
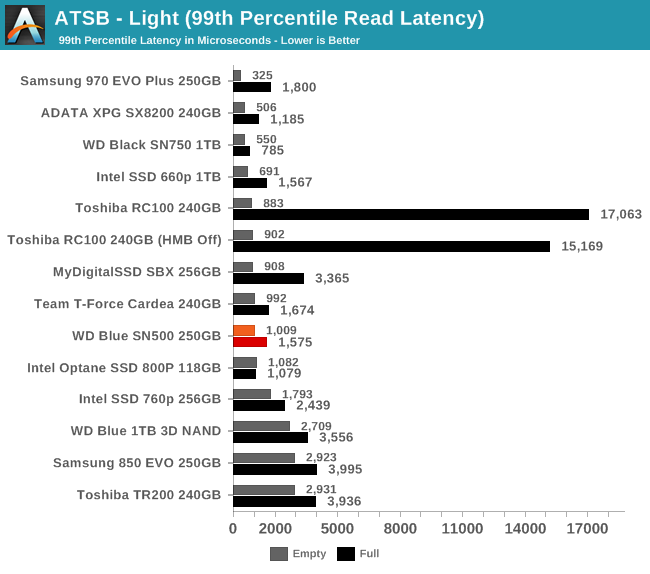
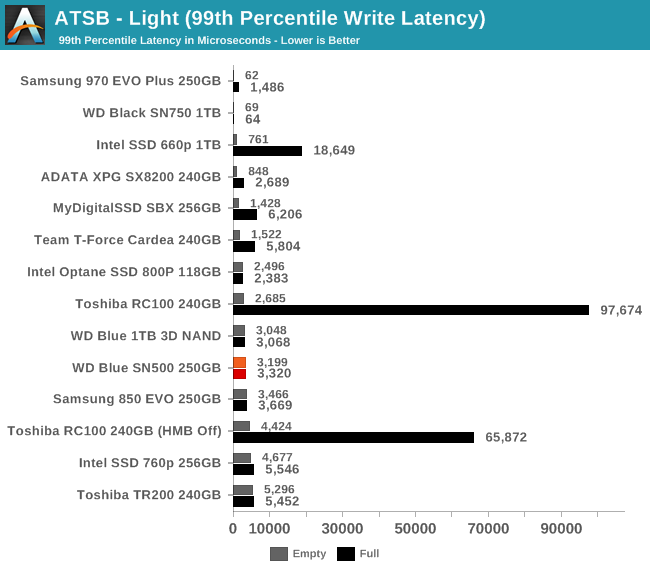
The WD Blue SN500 has excellent QoS for both reads and writes on the Light test, even when the test is run on a full drive. Some writes may take a few milliseconds to complete, but the SN500 won't present the user with any noticeable stalls during such a light workload.
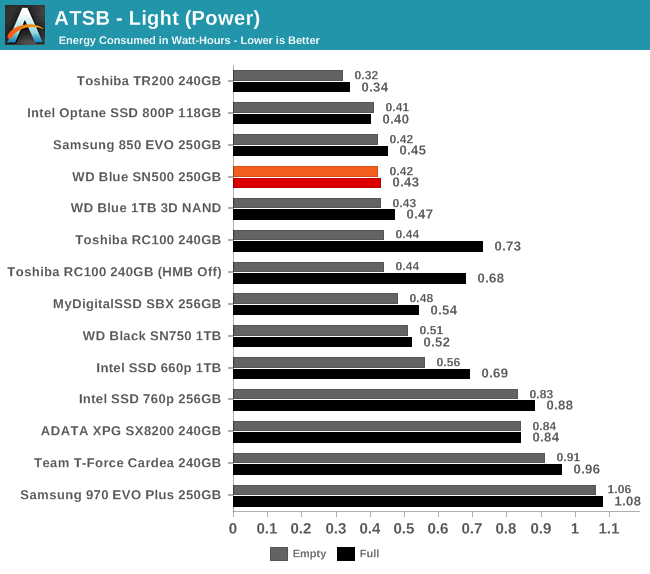
The energy usage by the SN500 during the Light test is comparable to that used by the SATA drives, and is lower than what most of the NVMe drives can manage. The fastest drives require about twice the energy to deliver performance boosts that don't really matter to a light workload like this test.
Random Read Performance
Our first test of random read performance uses very short bursts of operations issued one at a time with no queuing. The drives are given enough idle time between bursts to yield an overall duty cycle of 20%, so thermal throttling is impossible. Each burst consists of a total of 32MB of 4kB random reads, from a 16GB span of the disk. The total data read is 1GB.
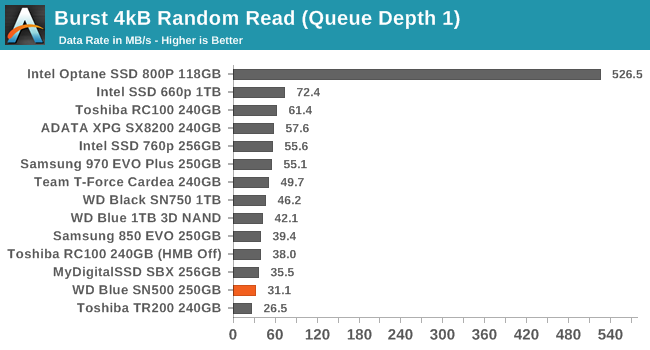
This test is confined to a 16GB portion of the drive, but the WD Blue SN500 requires more spatial locality than that to offer its best random read performance, due to its DRAMless design with only a small on-controller buffer and no HMB support. The SN500 ends up as the worst-performing NVMe drive in the bunch and only beats the Toshiba TR200 DRAMless SATA SSD.
Our sustained random read performance is similar to the random read test from our 2015 test suite: queue depths from 1 to 32 are tested, and the average performance and power efficiency across QD1, QD2 and QD4 are reported as the primary scores. Each queue depth is tested for one minute or 32GB of data transferred, whichever is shorter. After each queue depth is tested, the drive is given up to one minute to cool off so that the higher queue depths are unlikely to be affected by accumulated heat build-up. The individual read operations are again 4kB, and cover a 64GB span of the drive.
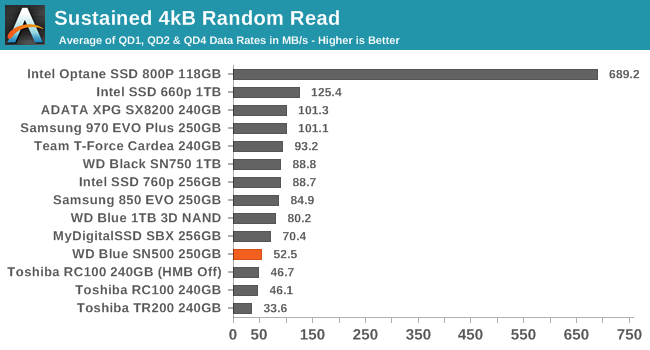
On the longer random read test, the SN500 still fares poorly, but now that the test span has widened to 64GB, the Toshiba RC100's host memory buffer is also not large enough, and the RC100 falls behind the SN500.
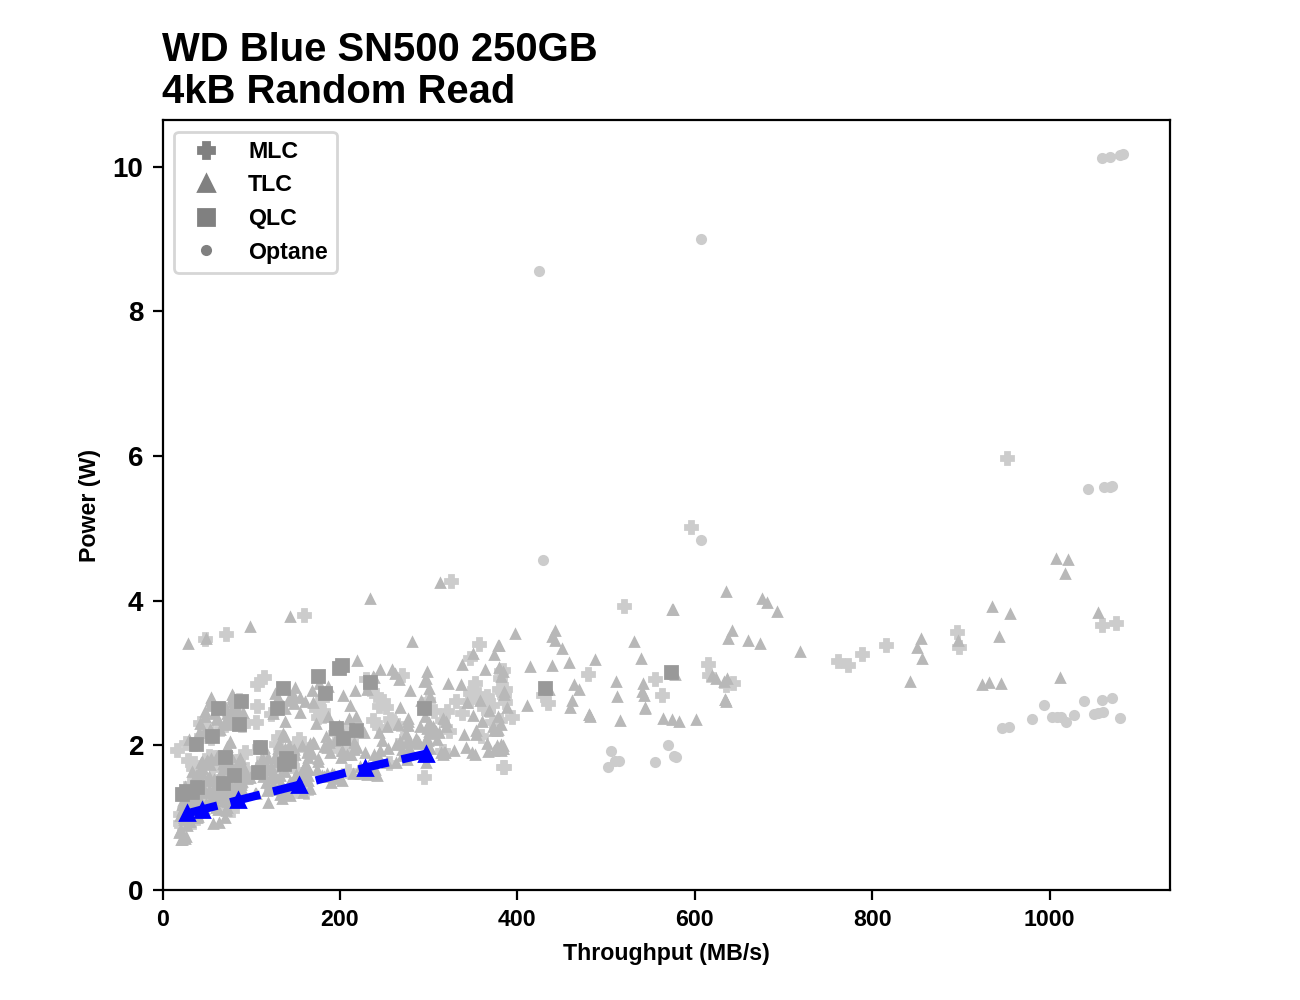
 |
|||||||||
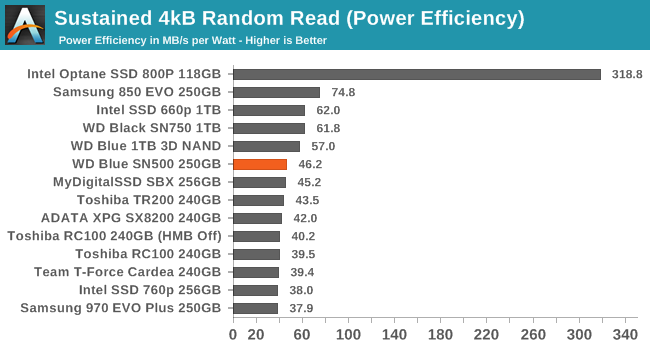
| Power Efficiency in MB/s/W | Average Power in W | ||||||||
The WD Blue SN500 and Toshiba RC100 draw significantly less power than any of the other NVMe drives during the random read test, with a low-QD average of a bit over 1W. This translates to a good but not great efficiency score for the SN500: the larger drives with much better performance have considerably better efficiency, as does the Samsung 850 EVO that provided 60% better performance without drawing any more power.
 |
|||||||||
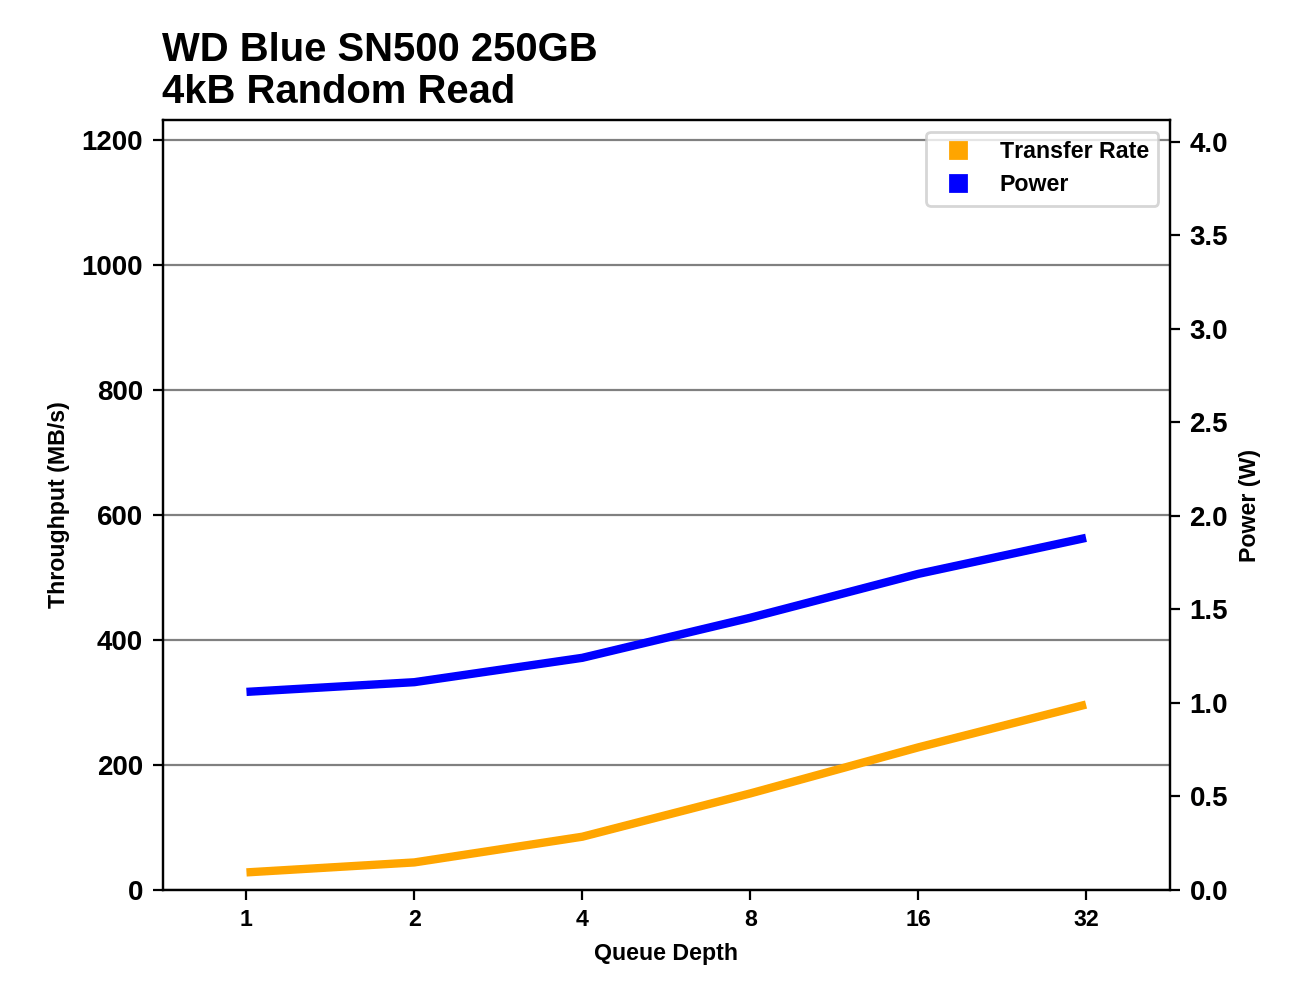
All of the 250GB-class SSDs have limited potential for performance increases at high queue depth compared to higher capacity drives, but the SN500's performance scaling is poor even within its capacity class. Power consumption starts around 1W at QD1 and stays below 2W even at QD32, while the high-end NVMe drives start out above 2W and climb from there.
The random read performance of the WD Blue SN500 never gets out of SATA SSD territory, but the power efficiency is pretty good for the performance it does provide, especially at the higher queue depths.
Random Write Performance
Our test of random write burst performance is structured similarly to the random read burst test, but each burst is only 4MB and the total test length is 128MB. The 4kB random write operations are distributed over a 16GB span of the drive, and the operations are issued one at a time with no queuing.
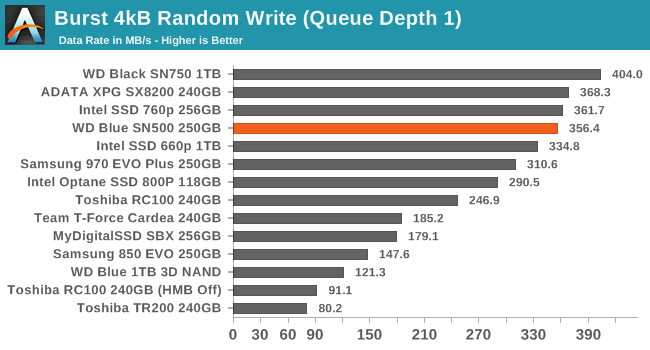
This burst random write test is short enough that it doesn't come close to filling even the WD Blue SN500's tiny SLC cache, so the great performance of that cache shows through with a score that's competitive against almost any other drive in this capacity class, and only 12% slower than the 1TB WD Black SN750.
As with the sustained random read test, our sustained 4kB random write test runs for up to one minute or 32GB per queue depth, covering a 64GB span of the drive and giving the drive up to 1 minute of idle time between queue depths to allow for write caches to be flushed and for the drive to cool down.
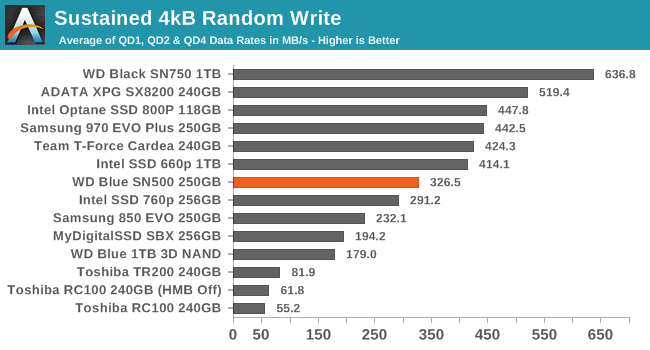
On the longer random write test, the SLC cache on the WD Blue SN500 runs out and its performance falls out of the top tier for 256GB-class drives, but it doesn't fall very far. The SN500 still clearly outperforms the other entry-level NVMe drives we have to compare against.
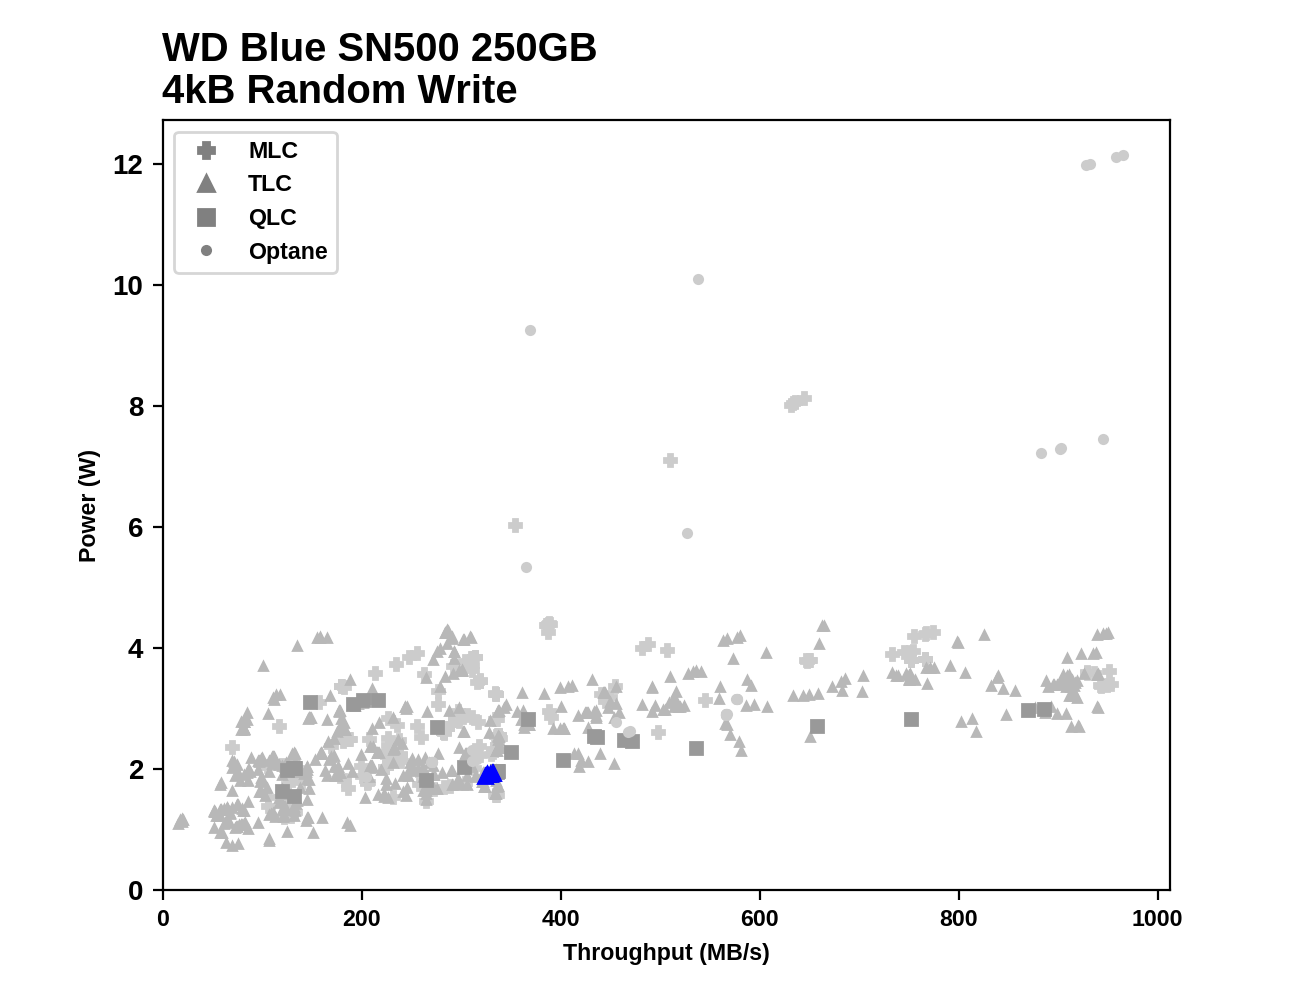
 |
|||||||||
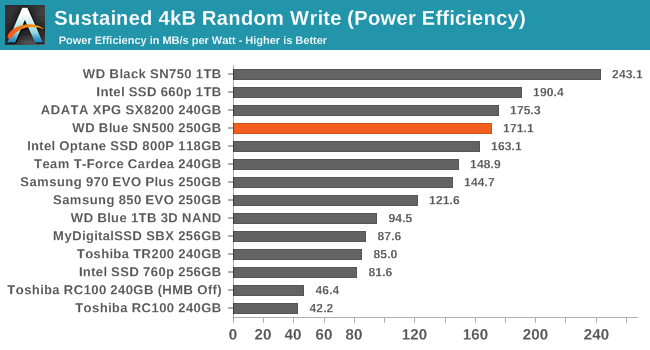
| Power Efficiency in MB/s/W | Average Power in W | ||||||||
The power efficiency score for the SN500 during the random write test is a close second place among its capacity class, and is much better than the SATA drives or other entry-level NVMe drives.
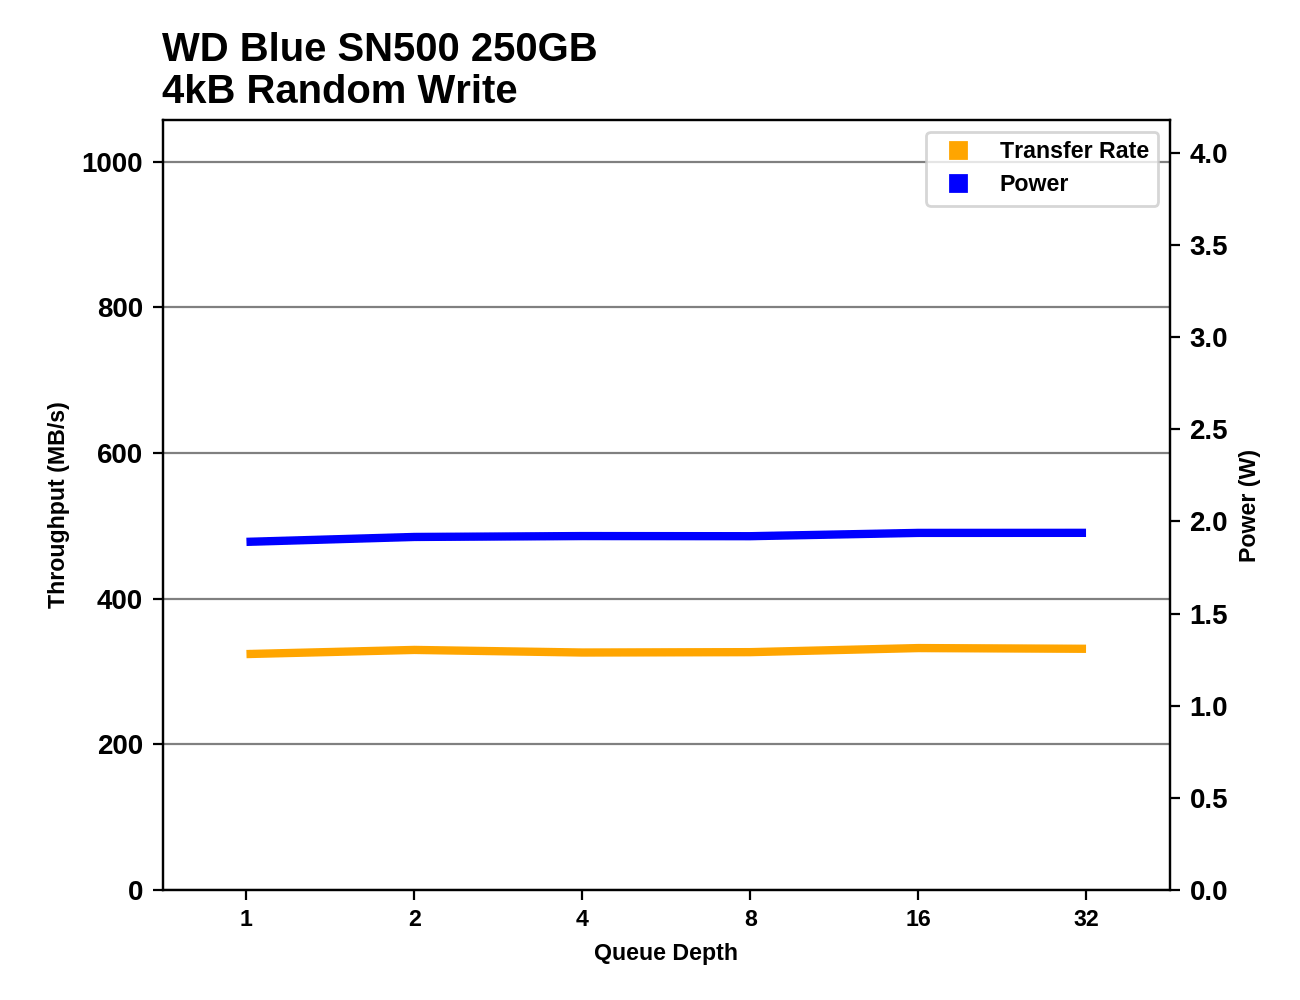 |
|||||||||
This random write test writes much more data than can fit in the SN500's SLC write cache, so there's no opportunity for performance to bounce around depending on how much cache space was free at the start of each phase of the test. Instead, the SN500's performance and power consumption are very consistent across the entire tested range of queue depths.
The WD Blue SN500's random write performance is pretty close to the limit of what SATA SSDs can achieve, and it gets there while drawing less power than most other drives, but it doesn't set any records.
Sequential Read Performance
Our first test of sequential read performance uses short bursts of 128MB, issued as 128kB operations with no queuing. The test averages performance across eight bursts for a total of 1GB of data transferred from a drive containing 16GB of data. Between each burst the drive is given enough idle time to keep the overall duty cycle at 20%.
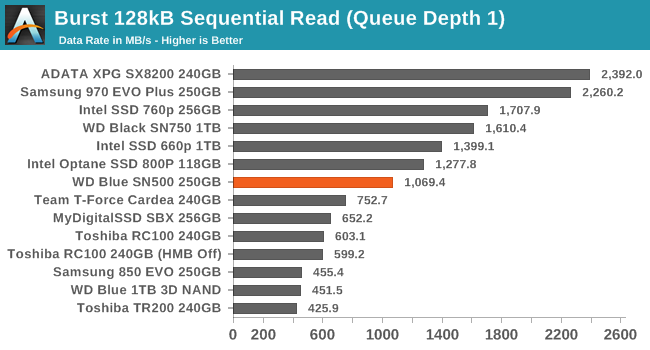
The burst sequential read performance from the WD Blue SN500 is a little over half the speed its PCIe 3 x2 interface can theoretically handle. That's significantly better than the other entry-level NVMe drives achieve, but nowhere close to what the top high-end drives with four PCIe lanes offer.
Our test of sustained sequential reads uses queue depths from 1 to 32, with the performance and power scores computed as the average of QD1, QD2 and QD4. Each queue depth is tested for up to one minute or 32GB transferred, from a drive containing 64GB of data. This test is run twice: once with the drive prepared by sequentially writing the test data, and again after the random write test has mixed things up, causing fragmentation inside the SSD that isn't visible to the OS. These two scores represent the two extremes of how the drive would perform under real-world usage, where wear leveling and modifications to some existing data will create some internal fragmentation that degrades performance, but usually not to the extent shown here.
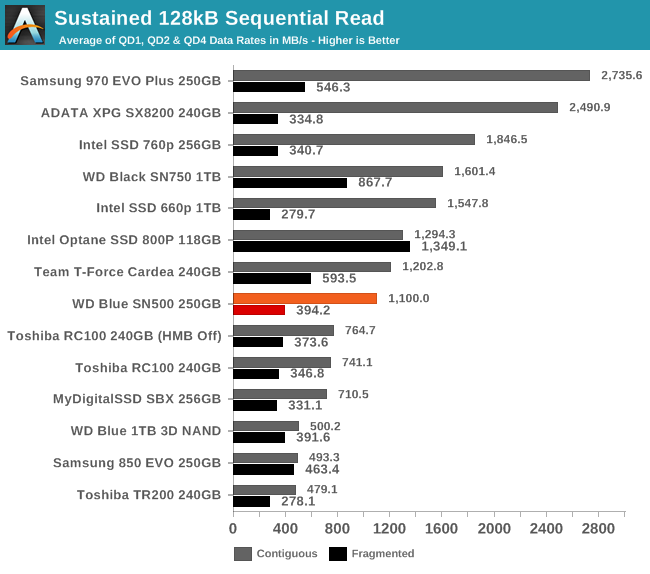
The WD Blue SN500's performance on the longer sequential read test is about the same as on the burst test, when reading back data that was written sequentially. The top high-end NVMe SSDs have widened their lead, but the other low-end SSDs have only gotten a bit closer to the SN500. When reading fragmented data that was written randomly, the playing field is a lot closer to level, and only a few drives are significantly faster than the SN500.
 |
|||||||||
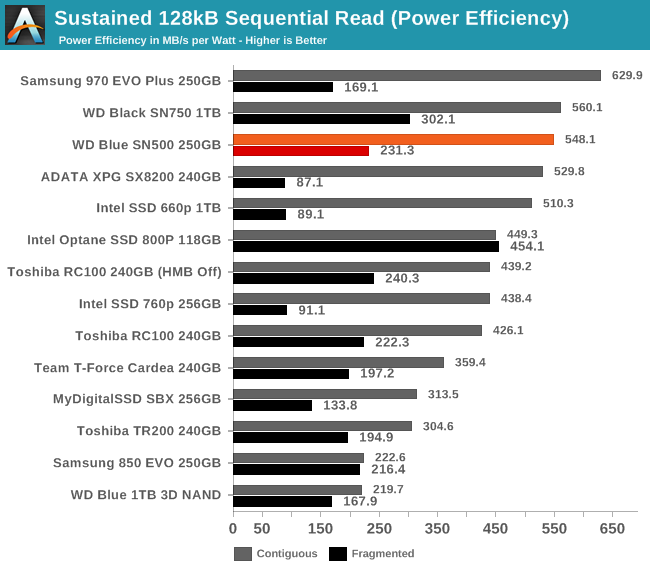
| Power Efficiency in MB/s/W | Average Power in W | ||||||||
The extremely fast Samsung 970 EVO Plus takes the top spot for power efficiency on the sequential read test, but the WD NVMe drives aren't far behind. The SN500 does manage to beat Samsung's power efficiency when reading fragmented data.
 |
|||||||||
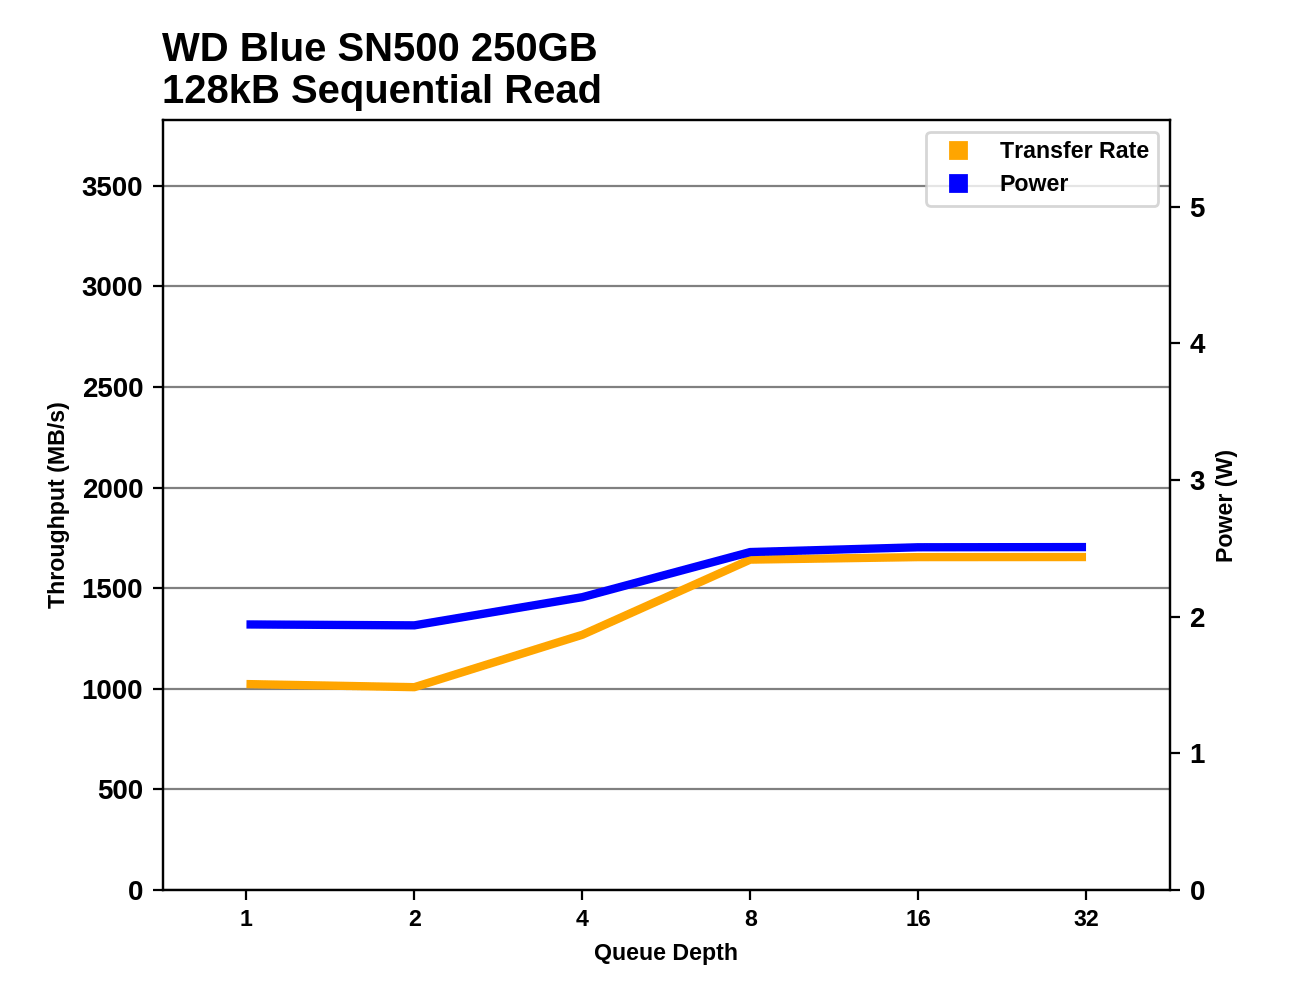
The WD Blue SN500 requires a queue depth of about 8 or higher to hit full speed for 128kB sequential reads. At high queue depths it remains the fastest of the PCIe x2 drives, but the slower Toshiba RC100 uses a bit less power.
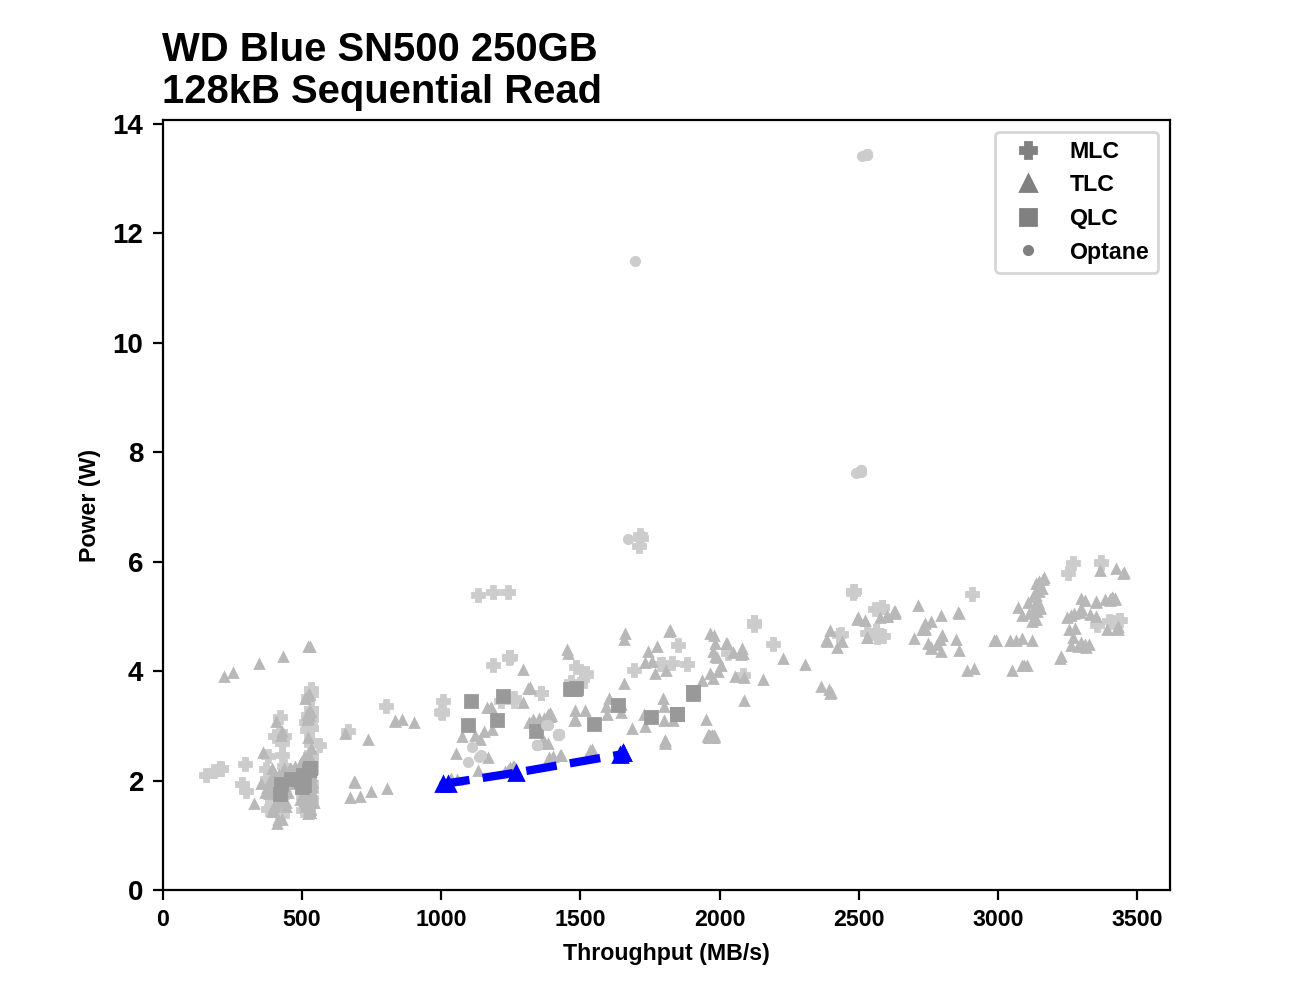
The sequential read performance of the WD Blue SN500 is well beyond what SATA drives can manage, but much higher speeds are possible from high-end NVMe drives. At the speeds it does attain, the SN500 is the lowest-power drive we've tested.
Sequential Write Performance
Our test of sequential write burst performance is structured identically to the sequential read burst performance test save for the direction of the data transfer. Each burst writes 128MB as 128kB operations issued at QD1, for a total of 1GB of data written to a drive containing 16GB of data.
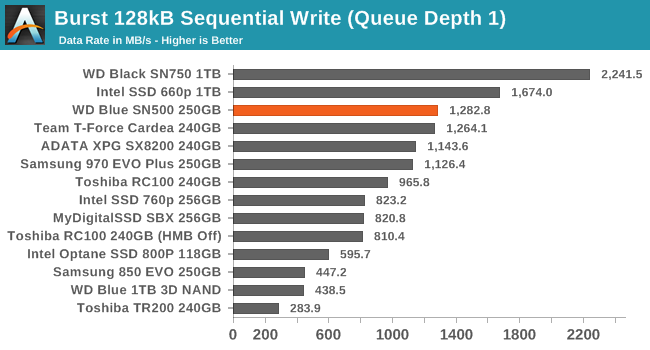
The burst sequential write test writes much more data than the burst random write test, but it's still much less than even the WD Blue SN500's small SLC cache. This allows the SN500 to deliver the best burst write performance score in its capacity class.
Our test of sustained sequential writes is structured identically to our sustained sequential read test, save for the direction of the data transfers. Queue depths range from 1 to 32 and each queue depth is tested for up to one minute or 32GB, followed by up to one minute of idle time for the drive to cool off and perform garbage collection. The test is confined to a 64GB span of the drive.
On the longer sequential write test, the WD Blue SN500 fills its SLC cache very quickly and then drops down to be only slightly faster than the 1TB WD Blue SATA SSD. Several of the slower NVMe SSDs end up underperforming that SATA SSD.
 |
|||||||||
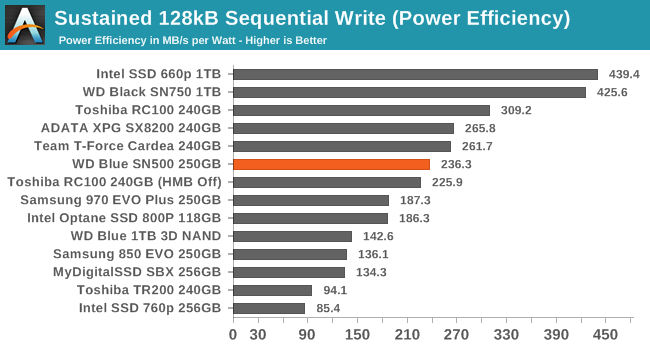
| Power Efficiency in MB/s/W | Average Power in W | ||||||||
The power efficiency of the SN500 during the sequential write test is decent, but the Toshiba RC100 is faster and uses less power, and some of the high-end drives have enough of a performance advantage to more than overcome their increased power consumption relative to the SN500.
 |
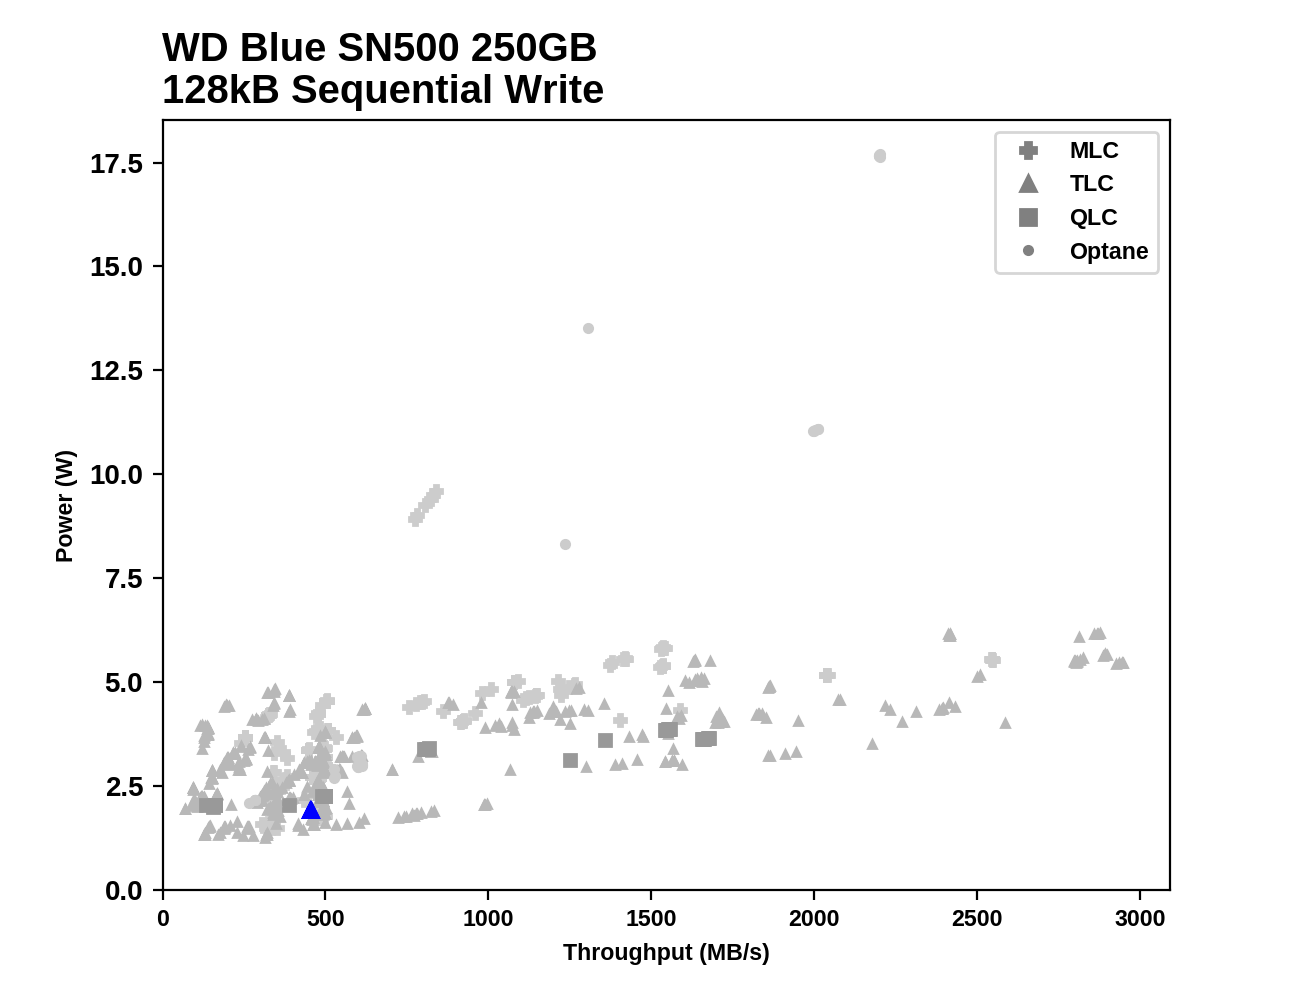
|||||||||
As with random writes, the small size of the SLC cache on the SN500 means its effects are largely invisible during the sustained sequential write test. The SN500's performance hovers a bit below 500MB/s and its power consumption is just below 2W.
The performance and power consumption of the WD Blue SN500 aren't quite as good as the best SATA drives, but it's decent. Compared to NVMe drives however, there are alternatives that can offer double the performance at about the same power level, or are fast enough to slightly exceed the SATA speed limit while drawing less power than the SN500 requires.
Mixed Random Performance
Our test of mixed random reads and writes covers mixes varying from pure reads to pure writes at 10% increments. Each mix is tested for up to 1 minute or 32GB of data transferred. The test is conducted with a queue depth of 4, and is limited to a 64GB span of the drive. In between each mix, the drive is given idle time of up to one minute so that the overall duty cycle is 50%.
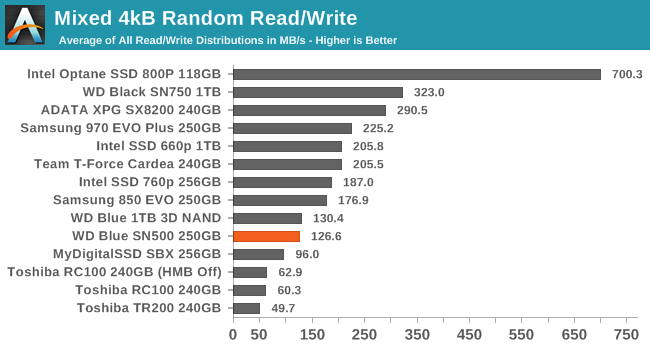
The WD Blue SN500 is very slightly slower on the mixed 4kB random IO test than the larger WD Blue SATA SSD, and is significantly slower than the various high-end NVMe models. The other two entry-level NVMe drives are even slower than the SN500.
 |
|||||||||
| Power Efficiency in MB/s/W | Average Power in W | ||||||||
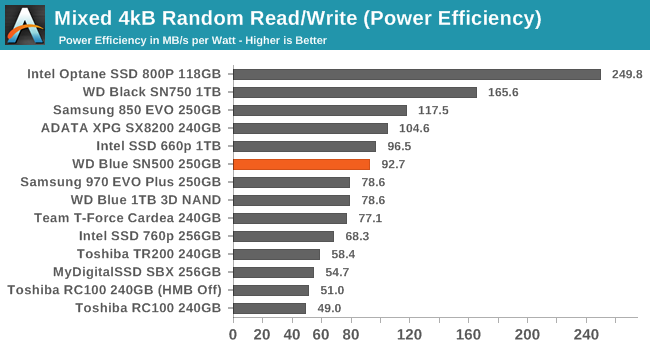
Despite relatively low performance, the WD Blue SN500's efficiency score on the mixed random IO test is a bit above average due to it drawing far less power than most of the high-end NVMe SSDs or even the SATA drives that outperformed it.
 |
|||||||||
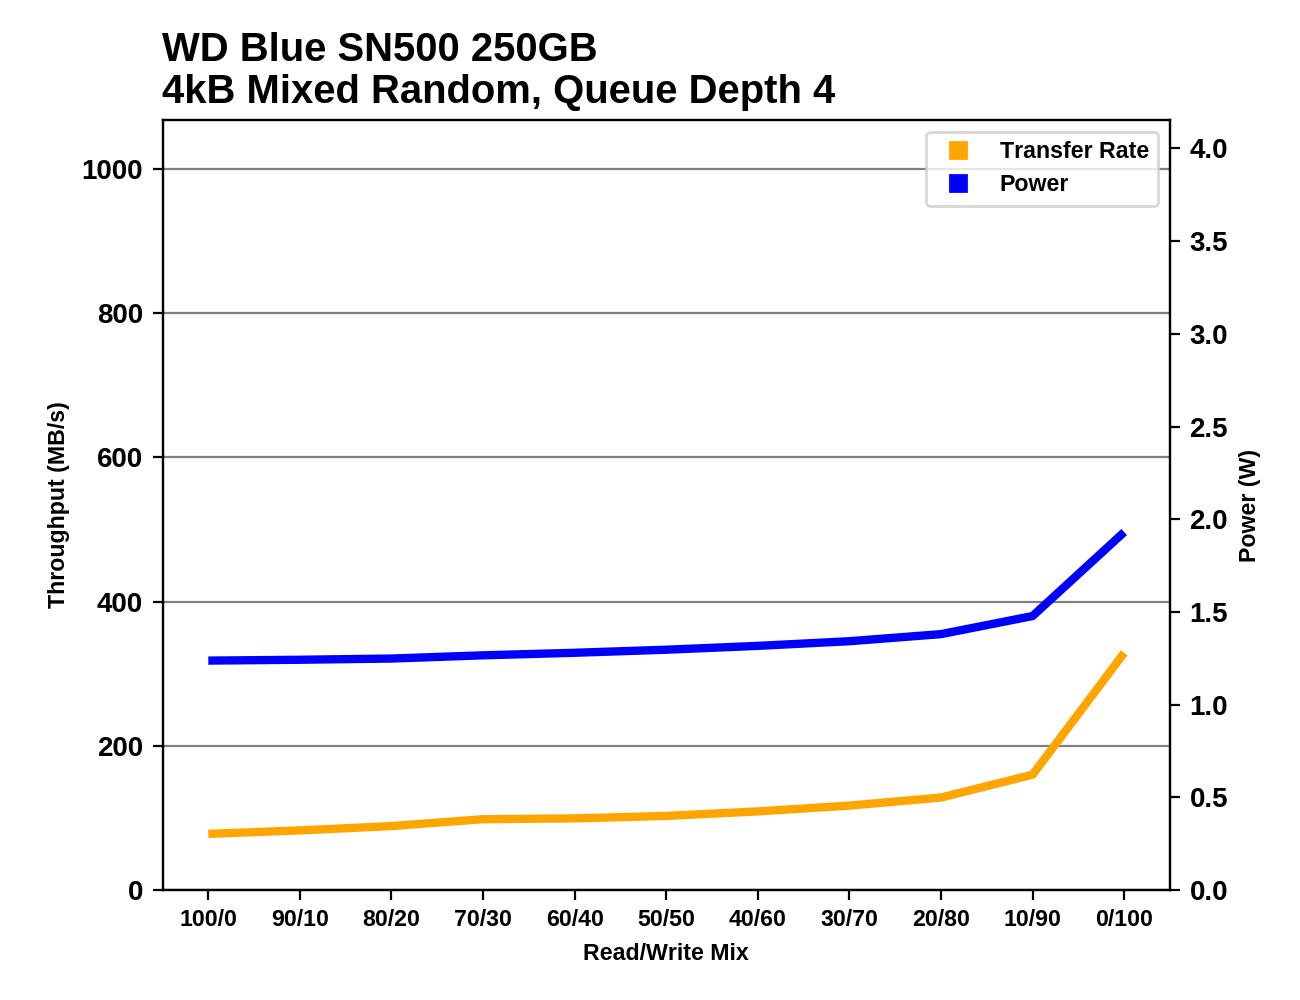
The WD Blue SN500's performance on the mixed random IO test shows a fairly normal slow growth in performance as the workload shifts to be more write-heavy. At the very end, the ability to combine writes without any read operations getting in the way leads to a jump in performance even though the SLC write cache is full during almost all of this test.
Mixed Sequential Performance
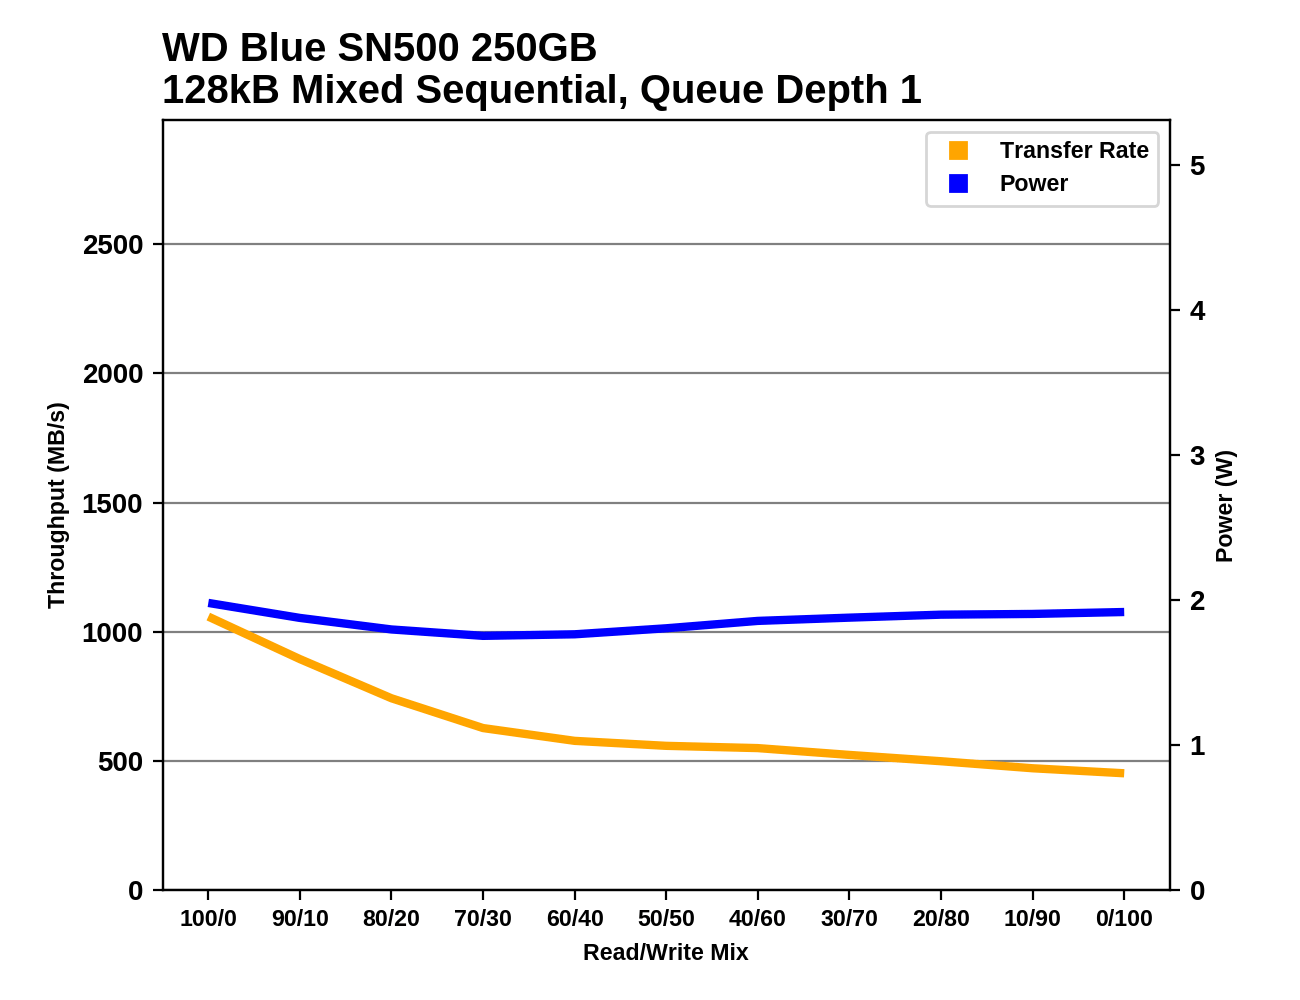
Our test of mixed sequential reads and writes differs from the mixed random I/O test by performing 128kB sequential accesses rather than 4kB accesses at random locations, and the sequential test is conducted at queue depth 1. The range of mixes tested is the same, and the timing and limits on data transfers are also the same as above.
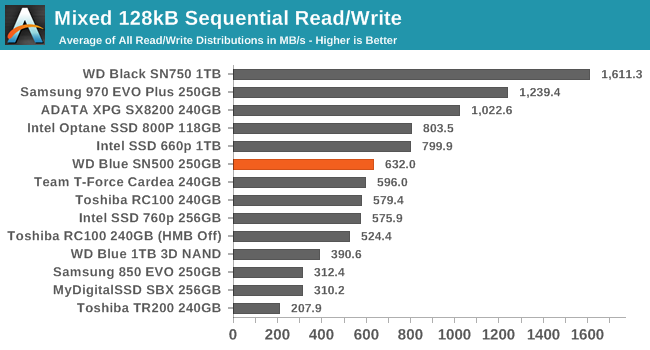
The WD Blue SN500 cannot compete with most of the high-end NVMe SSDs on the mixed sequential IO performance test, but it offers decent overall performance that is a bit higher than some of the other low-end NVMe drives and is a clear step up from any of the SATA drives.
 |
|||||||||
| Power Efficiency in MB/s/W | Average Power in W | ||||||||
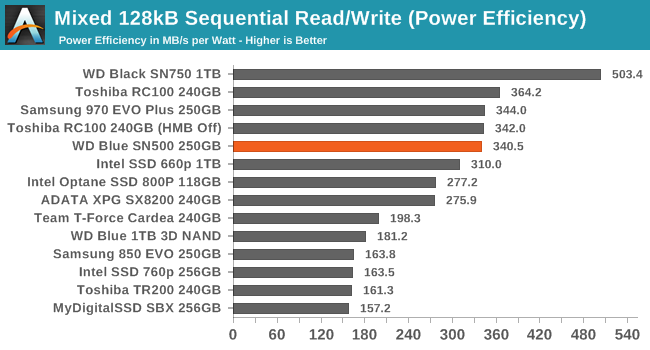
The power efficiency of the SN500 on this test is quite a bit lower than what the 1TB WD Black SN750 delivered, but among other 256GB-class drives the SN500's efficiency is top-tier.
 |
|||||||||
As writes are added to the workload, the WD Blue SN500's performance drops—quickly at first, but then almost leveling out as the drive approaches SATA speeds. By the end of the test when the workload is pure writes, the SN500 is performing below theoretical SATA limits, but beats any actual 256GB-class SATA drive we have on hand.
Power Management Features
Real-world client storage workloads leave SSDs idle most of the time, so the active power measurements presented earlier in this review only account for a small part of what determines a drive's suitability for battery-powered use. Especially under light use, the power efficiency of a SSD is determined mostly be how well it can save power when idle.
For many NVMe SSDs, the closely related matter of thermal management can also be important. M.2 SSDs can concentrate a lot of power in a very small space. They may also be used in locations with high ambient temperatures and poor cooling, such as tucked under a GPU on a desktop motherboard, or in a poorly-ventilated notebook.
| WD Blue SN500 NVMe Power and Thermal Management Features |
|||
| Controller | Western Digital in-house | ||
| Firmware | 201000WD | ||
| NVMe Version |
Feature | Status | |
| 1.0 | Number of operational (active) power states | 3 | |
| 1.1 | Number of non-operational (idle) power states | 2 | |
| Autonomous Power State Transition (APST) | Supported | ||
| 1.2 | Warning Temperature | 82°C | |
| Critical Temperature | 86°C | ||
| 1.3 | Host Controlled Thermal Management | Supported | |
| Non-Operational Power State Permissive Mode | Not Supported | ||
The WD Blue SN500 supports the usual set of NVMe power and thermal management features we expect to see on consumer NVMe drives. The warning and critical temperature thresholds are rather close together: the warning temperature of 82°C is higher than we usually see while the critical temperature is fairly normal. Between this and the generally low power consumption of the SN500, thermal throttling seems quite unlikely.
The SN500 defines three active power states, but declares the same 2.5W maximum for the first two states, making the second one redundant. The two idle states promise great power savings, though a 44ms wakeup from the deepest idle state is a bit slow.
| WD Blue SN500 NVMe Power States |
|||||
| Controller | Western Digital in-house | ||||
| Firmware | 201000WD | ||||
| Power State |
Maximum Power |
Active/Idle | Entry Latency |
Exit Latency |
|
| PS 0 | 2.5 W | Active | - | - | |
| PS 1 | 2.5 W | Active | - | - | |
| PS 2 | 1.7 W | Active | - | - | |
| PS 3 | 25 mW | Idle | 5 ms | 9 ms | |
| PS 4 | 2.5 mW | Idle | 5 ms | 44 ms | |
Note that the above tables reflect only the information provided by the drive to the OS. The power and latency numbers are often very conservative estimates, but they are what the OS uses to determine which idle states to use and how long to wait before dropping to a deeper idle state.
Idle Power Measurement
SATA SSDs are tested with SATA link power management disabled to measure their active idle power draw, and with it enabled for the deeper idle power consumption score and the idle wake-up latency test. Our testbed, like any ordinary desktop system, cannot trigger the deepest DevSleep idle state.
Idle power management for NVMe SSDs is far more complicated than for SATA SSDs. NVMe SSDs can support several different idle power states, and through the Autonomous Power State Transition (APST) feature the operating system can set a drive's policy for when to drop down to a lower power state. There is typically a tradeoff in that lower-power states take longer to enter and wake up from, so the choice about what power states to use may differ for desktop and notebooks.
We report two idle power measurements. Active idle is representative of a typical desktop, where none of the advanced PCIe link or NVMe power saving features are enabled and the drive is immediately ready to process new commands. The idle power consumption metric is measured with PCIe Active State Power Management L1.2 state enabled and NVMe APST enabled if supported.
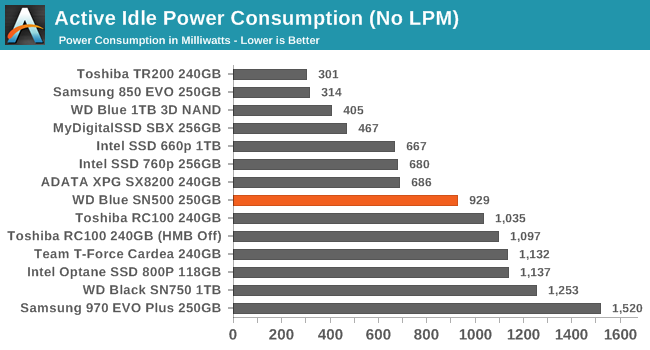
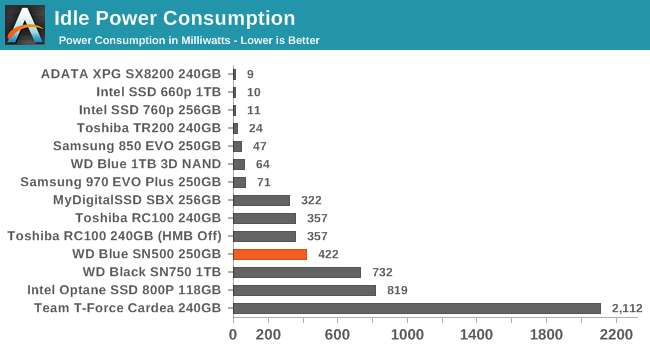
The active idle power consumption for the SN500 of a bit less than 1W is surprisingly high given that we've seen load power consumption starts at just over 1W—there's only about 130mW difference between the drive sitting ready to work, and it performing continuous random reads at QD1. Like the WD Black SN750, the WD Blue SN500 doesn't do a very good job of saving power when low-power idle states are enabled on our desktop platform. The original WD Black SSD that used a Marvell controller did a great job of handling systems with slightly broken PCIe power management, but Western Digital's own controllers seem to be quite picky about the conditions required to really go to sleep.
(Note: We have new equipment from Quarch on the way to facilitate better idle power measurements. We expect to soon start including typical laptop idle power measurements for M.2 PCIe SSDs in addition to the desktop measurements seen above.)
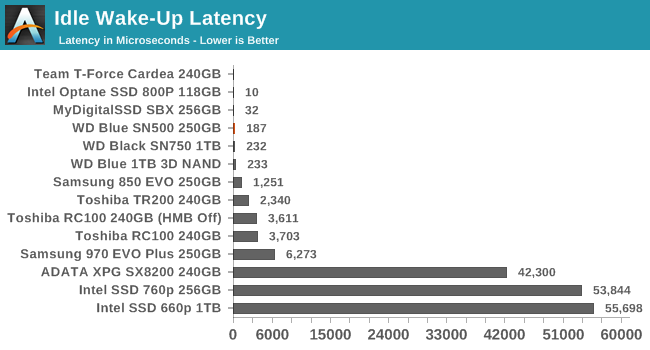
Since power management on the WD Blue SN500 doesn't work well on our desktop testbed, it is good to see that it only takes a fraction of a millisecond for the SN500 to get back to business.
Conclusion
The WD Blue SN500 defies expectations. Its basic specifications say it's an entry-level NVMe drive: only two PCIe lanes (so it can't possibly exceed 2GB/s), a DRAMless controller that isn't using the NVMe Host Memory Buffer feature either, and a tiny SLC write cache. And our review sample is a 250GB model, which is the smallest drive capacity that can come close to offering decent performance when using just a handful of modern high-capacity NAND flash dies.
What we are accustomed to seeing from low-end NVMe drives is peak performance that's impressively high compared to SATA, but with caveats in the form of severely reduced performance in suboptimal conditions. What makes or breaks a low-end DRAMless SSD (even on NVMe) is usually not the question of how abysmal its worst case performance is, but whether that worst-case performance can be avoided during real-world usage.
The WD Blue SN500 doesn't buckle under the pressure of our most intense tests, and it performs surprisingly well on The Destroyer even when compared against some high-end NVMe models of similar capacity. The SN500's SLC cache is tiny, but the performance after the cache is full is pretty good for a 250GB drive, and it's not noticeably interrupted or degraded by garbage collection cycles. Compared to the other small entry-level NVMe SSDs we've tested, the SN500 is a clear winner. It doesn't come out ahead in every single test, but the overall performance profile is much more consistent. The SN500 at its worst is still a decent SSD.
The WD Blue SN500 is not a high-end NVMe drive and it is not at all hard to find cases where the typical high-end NVMe drive with a PCIe x4 connection is much faster than the SN500. But on the tests with more realistic IO patterns, the gap between the SN500 and the top tier of drives isn't huge.
Western Digital was late to the game with in-house NVMe SSD controllers, but they clearly took the time to get it right. Both the high-end WD Black and mainstream WD Blue SSD product lines (and their OEM counterparts) are now using controllers based on their own controller architecture, and both instantiations of that architecture seem to be very successful for a first-generation release. The two products offer very different performance, but most of the time they have very similar power efficiency that puts them at or near the top of the charts. For the slower WD Blue SN500, that excellent efficiency usually means it's drawing less than 2W under load, though it can occasionally be pushed all the way up to 2.5W. The OEM drive that the SN500 is derived from was intended to fit into the thinnest and lightest notebooks and tablets, and it looks like Western Digital achieved that goal without making any horrible sacrifices (except to maximum drive capacity).
We didn't have a 250GB sample of the older SATA-based WD Blue SSD on hand to compare against, but the 250GB SN500 had no trouble matching or exceeding the performance of the 1TB WD Blue SATA SSD. Since performance generally scales with capacity, this is an illustration both of how good the SN500 is and how ready the mainstream SSD market segment is to break free of the limitations of a SATA interface.
At current pricing, the WD Blue SN500 isn't quite ready to push SATA SSDs out of the market, but it does make it very easy to step up to NVMe without regrets or worries. However, as usual there are some even faster drives for sale in basically the same price range, including the HP EX920 (Silicon Motion SM2262) and the Team MP34 (Phison E12 controller) that we will be reviewing soon. If Western Digital can push the price of their entry-level NVMe drive all the way down to SATA prices, they'll have a very successful product on their hands.


