Original Link: https://www.anandtech.com/show/14157/zotac-zbox-ci660-nano-fanless-minipc-review-a-promising-htpc-platform
The Zotac ZBOX CI660 nano Fanless mini-PC Review: A Promising HTPC Platform
by Ganesh T S on April 16, 2019 8:15 AM EST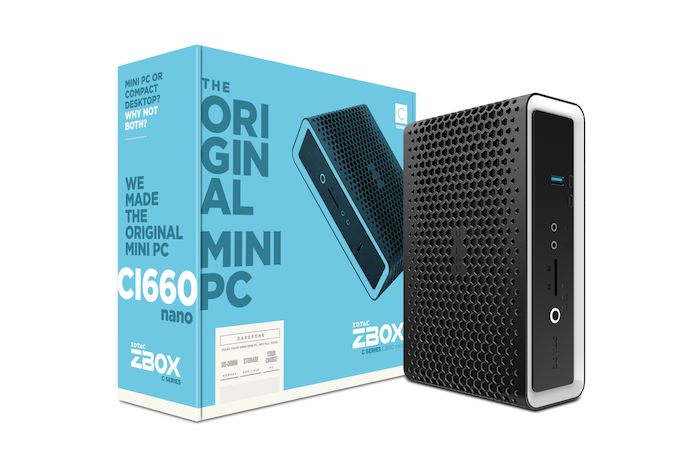
Zotac is a major player in the SFF PC space, and the emergence of the ultra-compact form-factor (UCFF) NUCs has broadened the available market for ther mini-PCs. The company markets their passively-cooled machines under the C-series moniker. Their C-series nano units adopt a form-factor very similar to Intel's NUCs, providing performance and thermal efficiency commensurate with their size.
The company's latest models, the CI6xx nano units, are based on the Kaby Lake-Refresh U-series processors, and they aim to improve on the older C-series units by adopting a larger form factor and adding more platform features. The larger form factor should, in theory, be able to accommodate a better-performing cooling system. The added platform features should be able to broaden the addressed markets. But how well does Zotac fare with respect to these goals? This review aims to provide some answers.
Introduction and Platform Analysis
The Zotac ZBOX CI660 nano belongs to the company's passively-cooled C-series family. It is based on the Kaby Lake-R U-series SiPs (KBL-R U). We had reviewed the Zotac CI523 nano back in 2016. At that time, we had appreciated what Zotac had done by introducing an affordable fanless high-performance computing system for the average consumer. The CI523 nano, which was based on a 15W TDP Core i3-6100U, was slightly larger than the CI540 nano (based on a 11.5W Haswell-Y SiP).
Zotac's new CI660 nano, by contrast, eschews the square-base form factor of the previous C-series PCs for a rectangular board. The larger board area also allows Zotac to integrate dual gigabit Ethernet ports (compared to the single port in the CI523 nano). The larger heat-sink allows for the integration of the Core i7-8550U, a processor with a 15W TDP that can also be configured for operation at 7.5W or 25W.
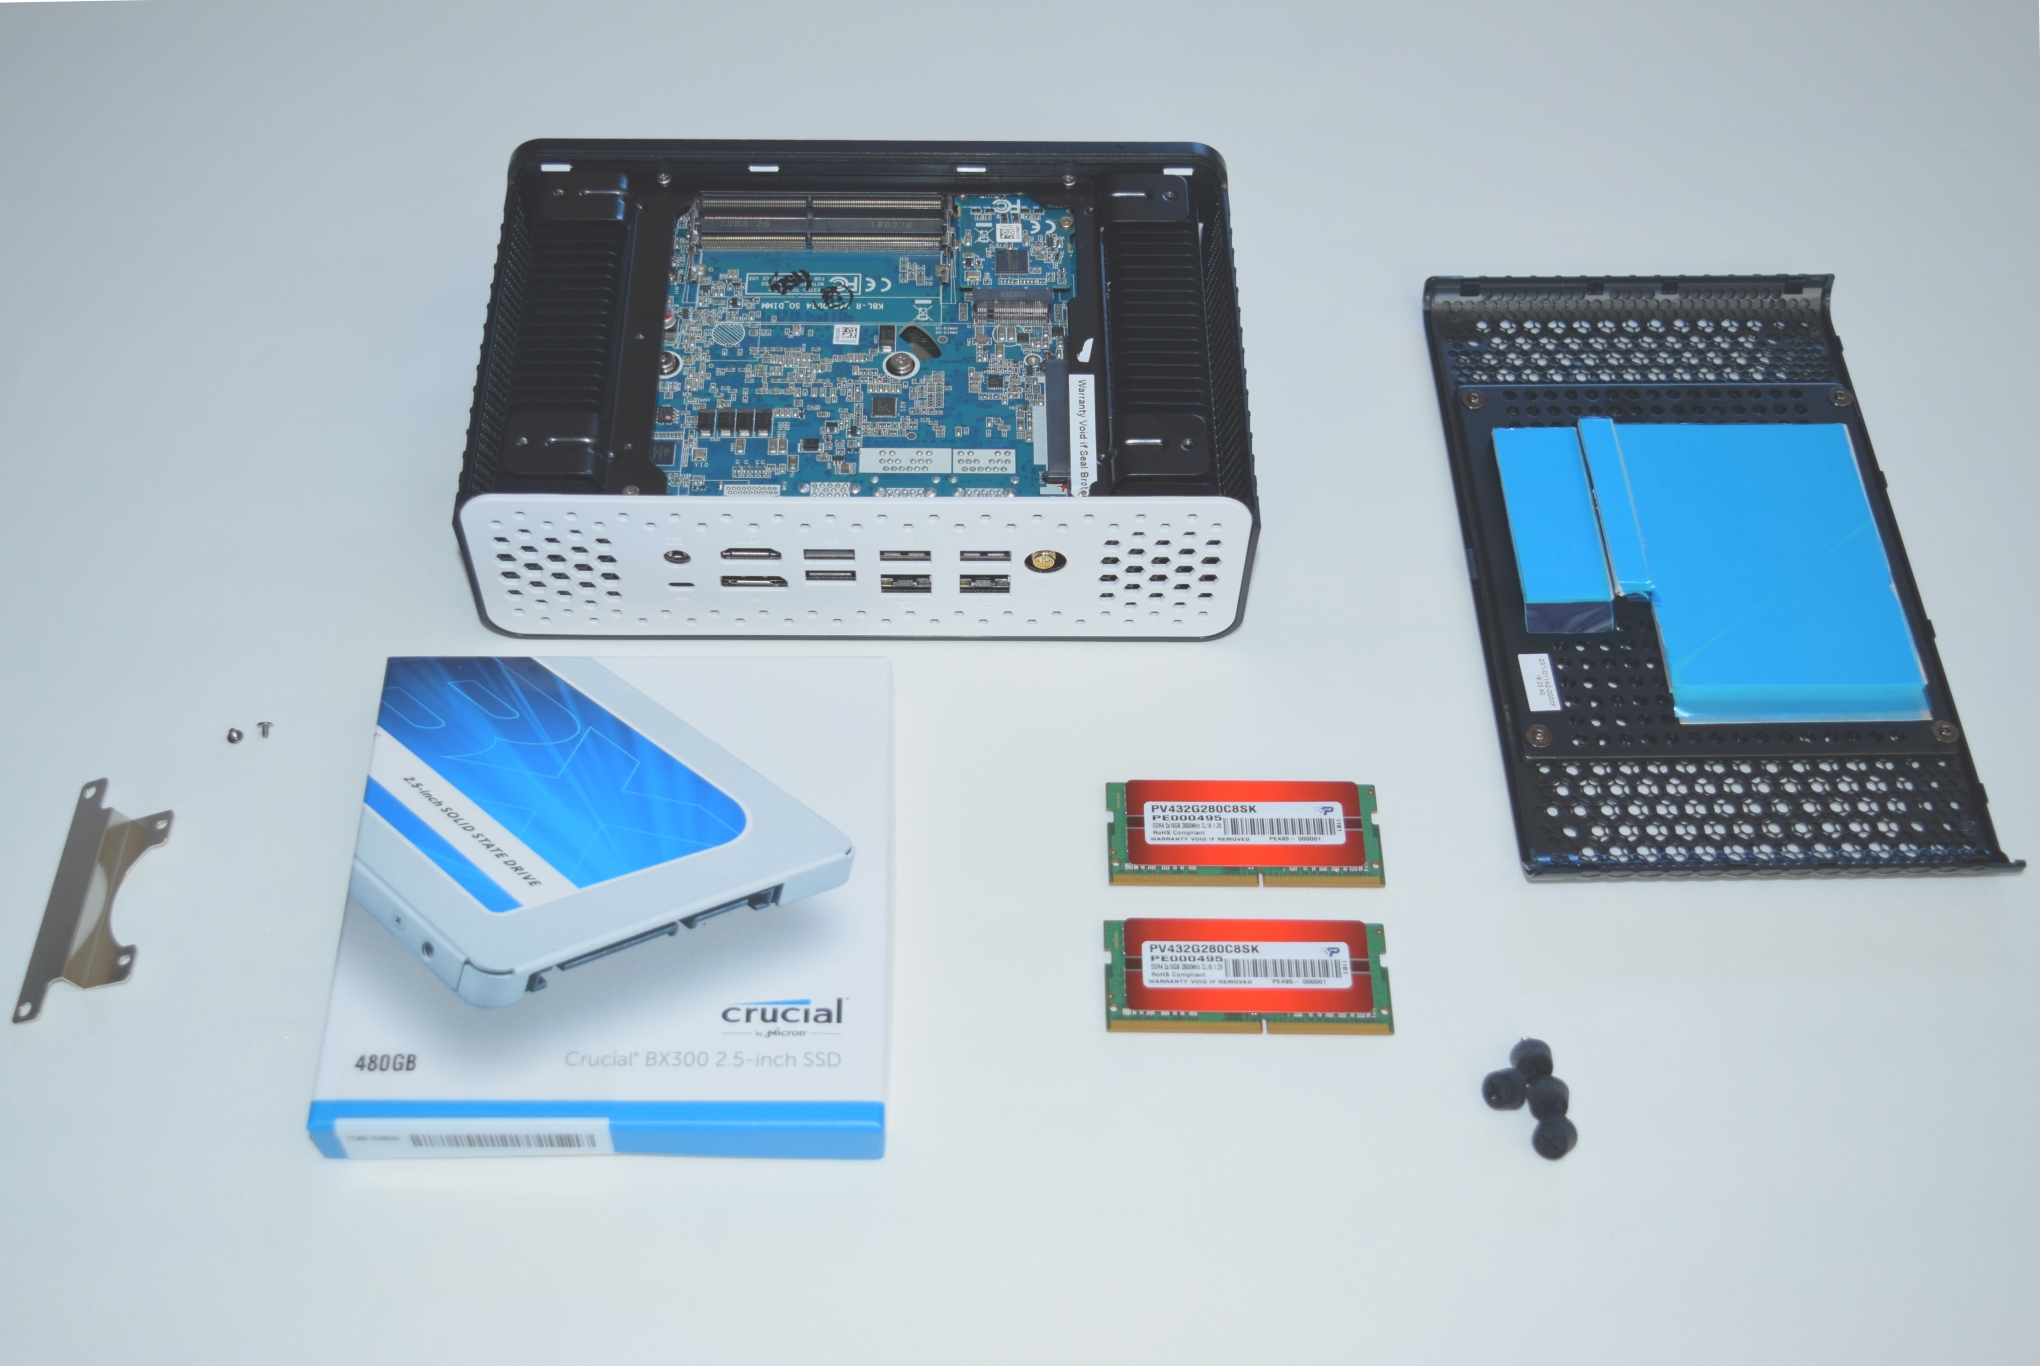
The CI660 nano is available barebones, or, in a PLUS model with RAM and SSD (no OS). The latter is priced at $700. Zotac supplied us with a barebones model for review, and we utilized a Crucial BX300 480GB 2.5" SATA SSD and two Patriot Memory DDR4-2800 SODIMMs to complete the build.
The specifications of our Zotac ZBOX CI660 nano review configuration are summarized in the table below.
| Zotac ZBOX CI660 nano Specifications | |
| Processor | Intel Core i7-8550U Kaby Lake Refresh-U, 4C/8T, 1.8 (4.0) GHz 8MB L2, 15 W TDP |
| Memory | Patriot Memory 2800 C18 Series PV432G280C8SK DDR4 SODIMM 18-18-18-43 @ 2800 MHz 2x16 GB |
| Graphics | Intel UHD Graphics 620 |
| Disk Drive(s) | Crucial BX300 (480 GB; 2.5" SATA III SSD; IMFT 32L 3D MLC) |
| Networking | Intel Dual Band Wireless-AC 3165 (1x1 802.11ac - 433 Mbps) 2x Realtek RTL8168 (MAC) / RTL8111 (PHY) Gigabit Ethernet controller |
| Audio | 3.5mm Headphone Jack Capable of 5.1/7.1 digital output with HD audio bitstreaming (HDMI) |
| Miscellaneous I/O Ports | 5x USB 3.0 Type-A 2x USB 3.1 Gen 2 Type-C 1x SDXC UHS-I |
| Operating System | Retail unit is barebones, but we installed Windows 10 Enterprise x64 |
| Pricing | $700 (PLUS model with a 4GB DDR4 SODIMM and a 120GB SSD) $865 (as configured, no OS) |
| Full Specifications | Zotac ZBOX CI660 nano Specifications |
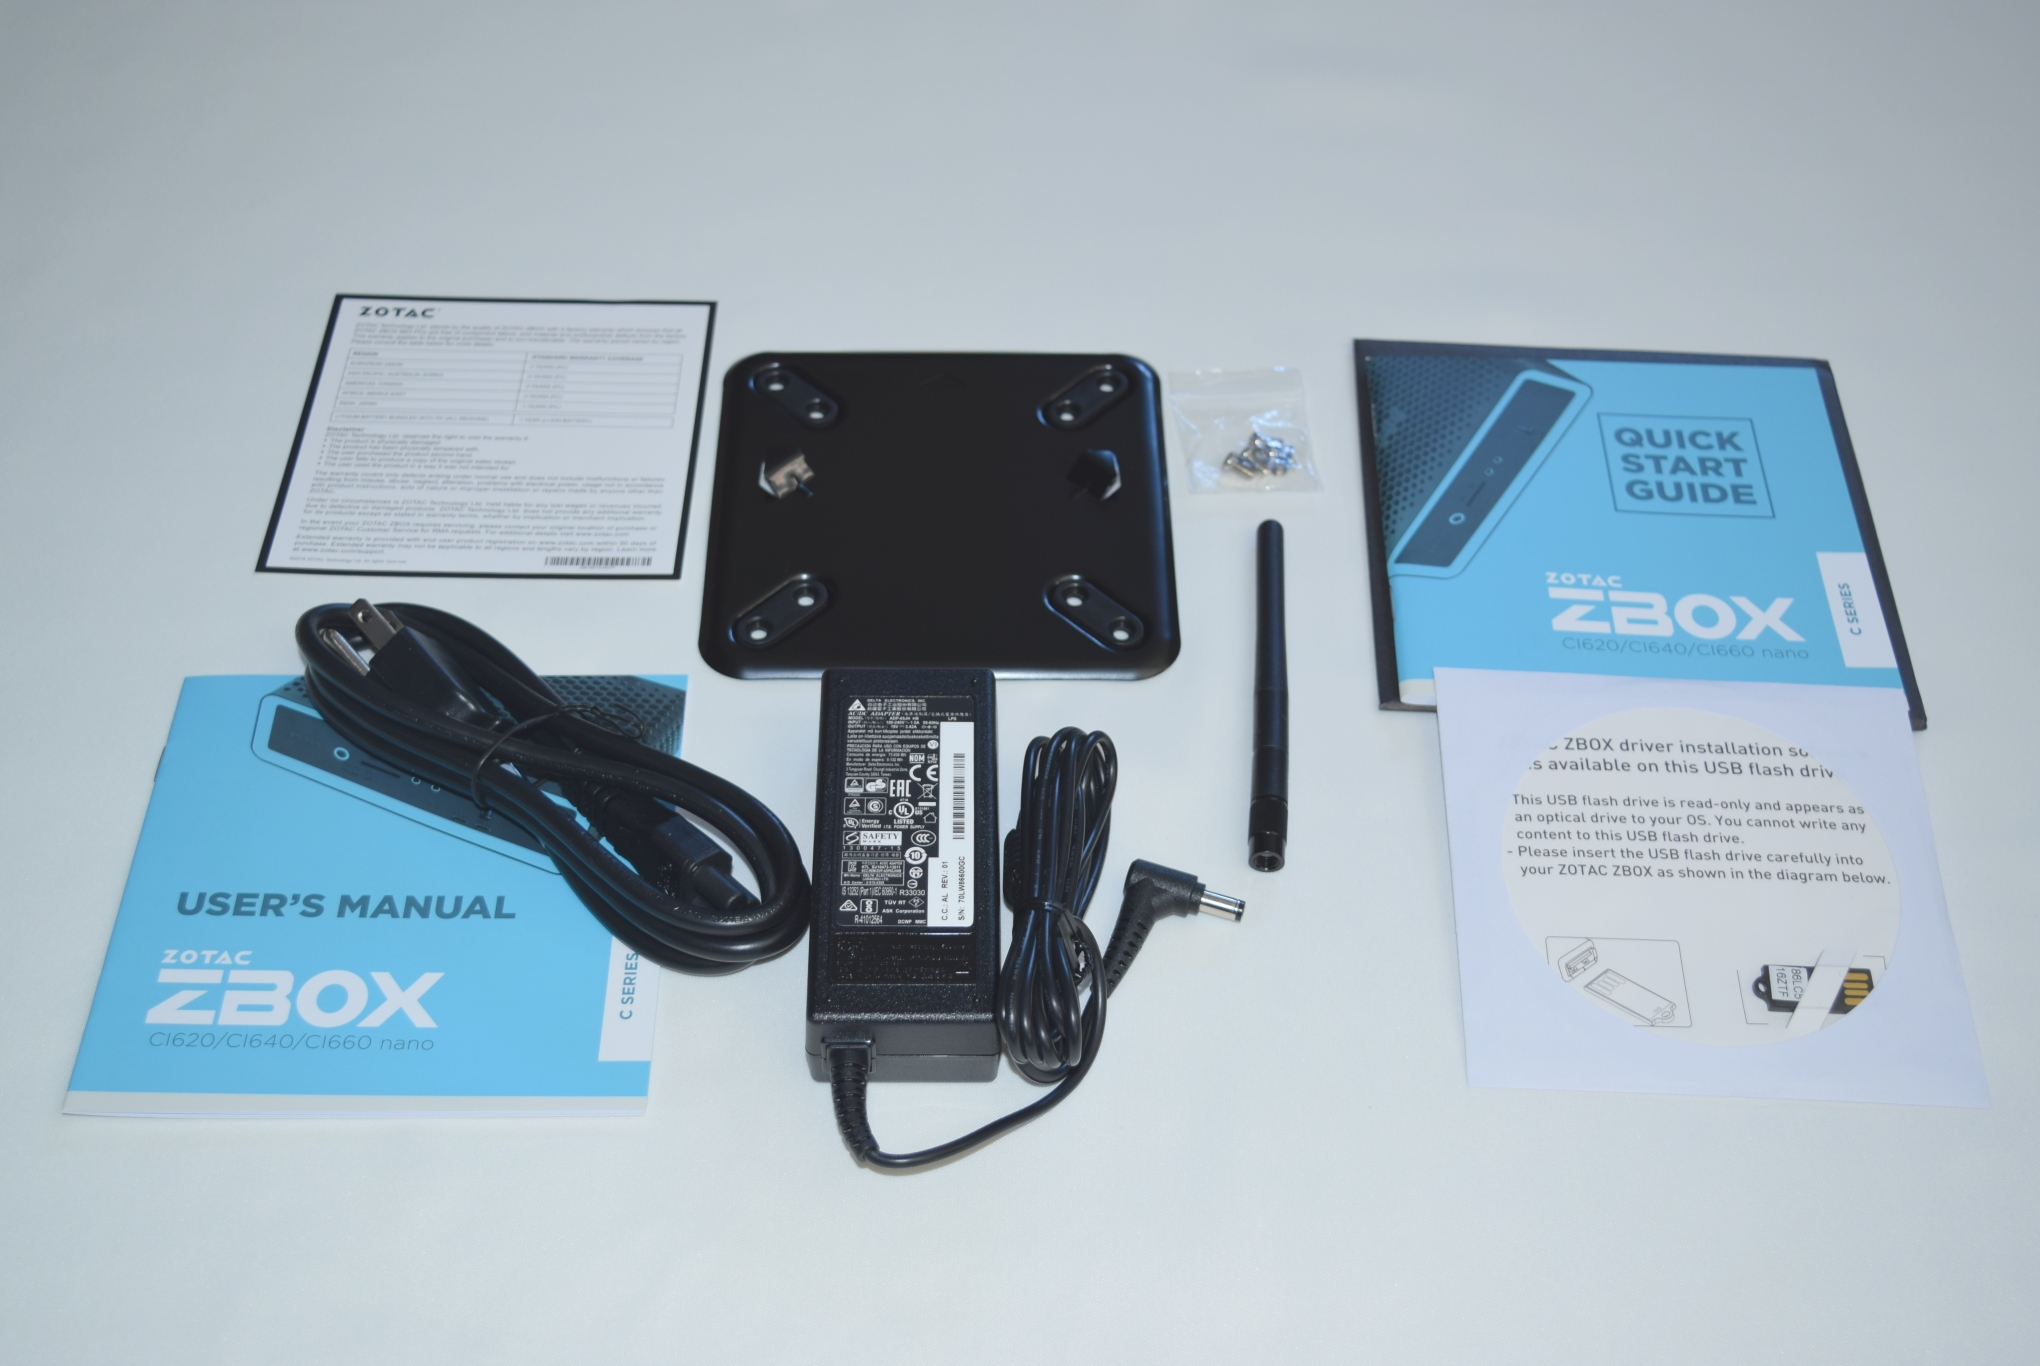
The Zotac ZBOX CI660 nano kit comes with a quick-start guide, user's manual, hardware for VESA mounting, bunch of screws for installing the storage drive, and a 65 W (19V @ 3.42A) adapter with a US power cord. A read-only USB drive with the requisite drivers is also bundled.
The gallery below takes us around the chassis design. Note that the unit is liberally perforated, allowing for easier convective heat dissipation.


Access to the SATA drive bay and the SODIMM slots is tool-less, as is typical of Zotac's mini-PCs. Unscrewing the base also reveals the ASMedia ASM2142 daughterboard that enables the two USB 3.1 Gen 2 Type-C ports. The base itself has thermal pads mounted for the RAM sticks as well as the SSD.
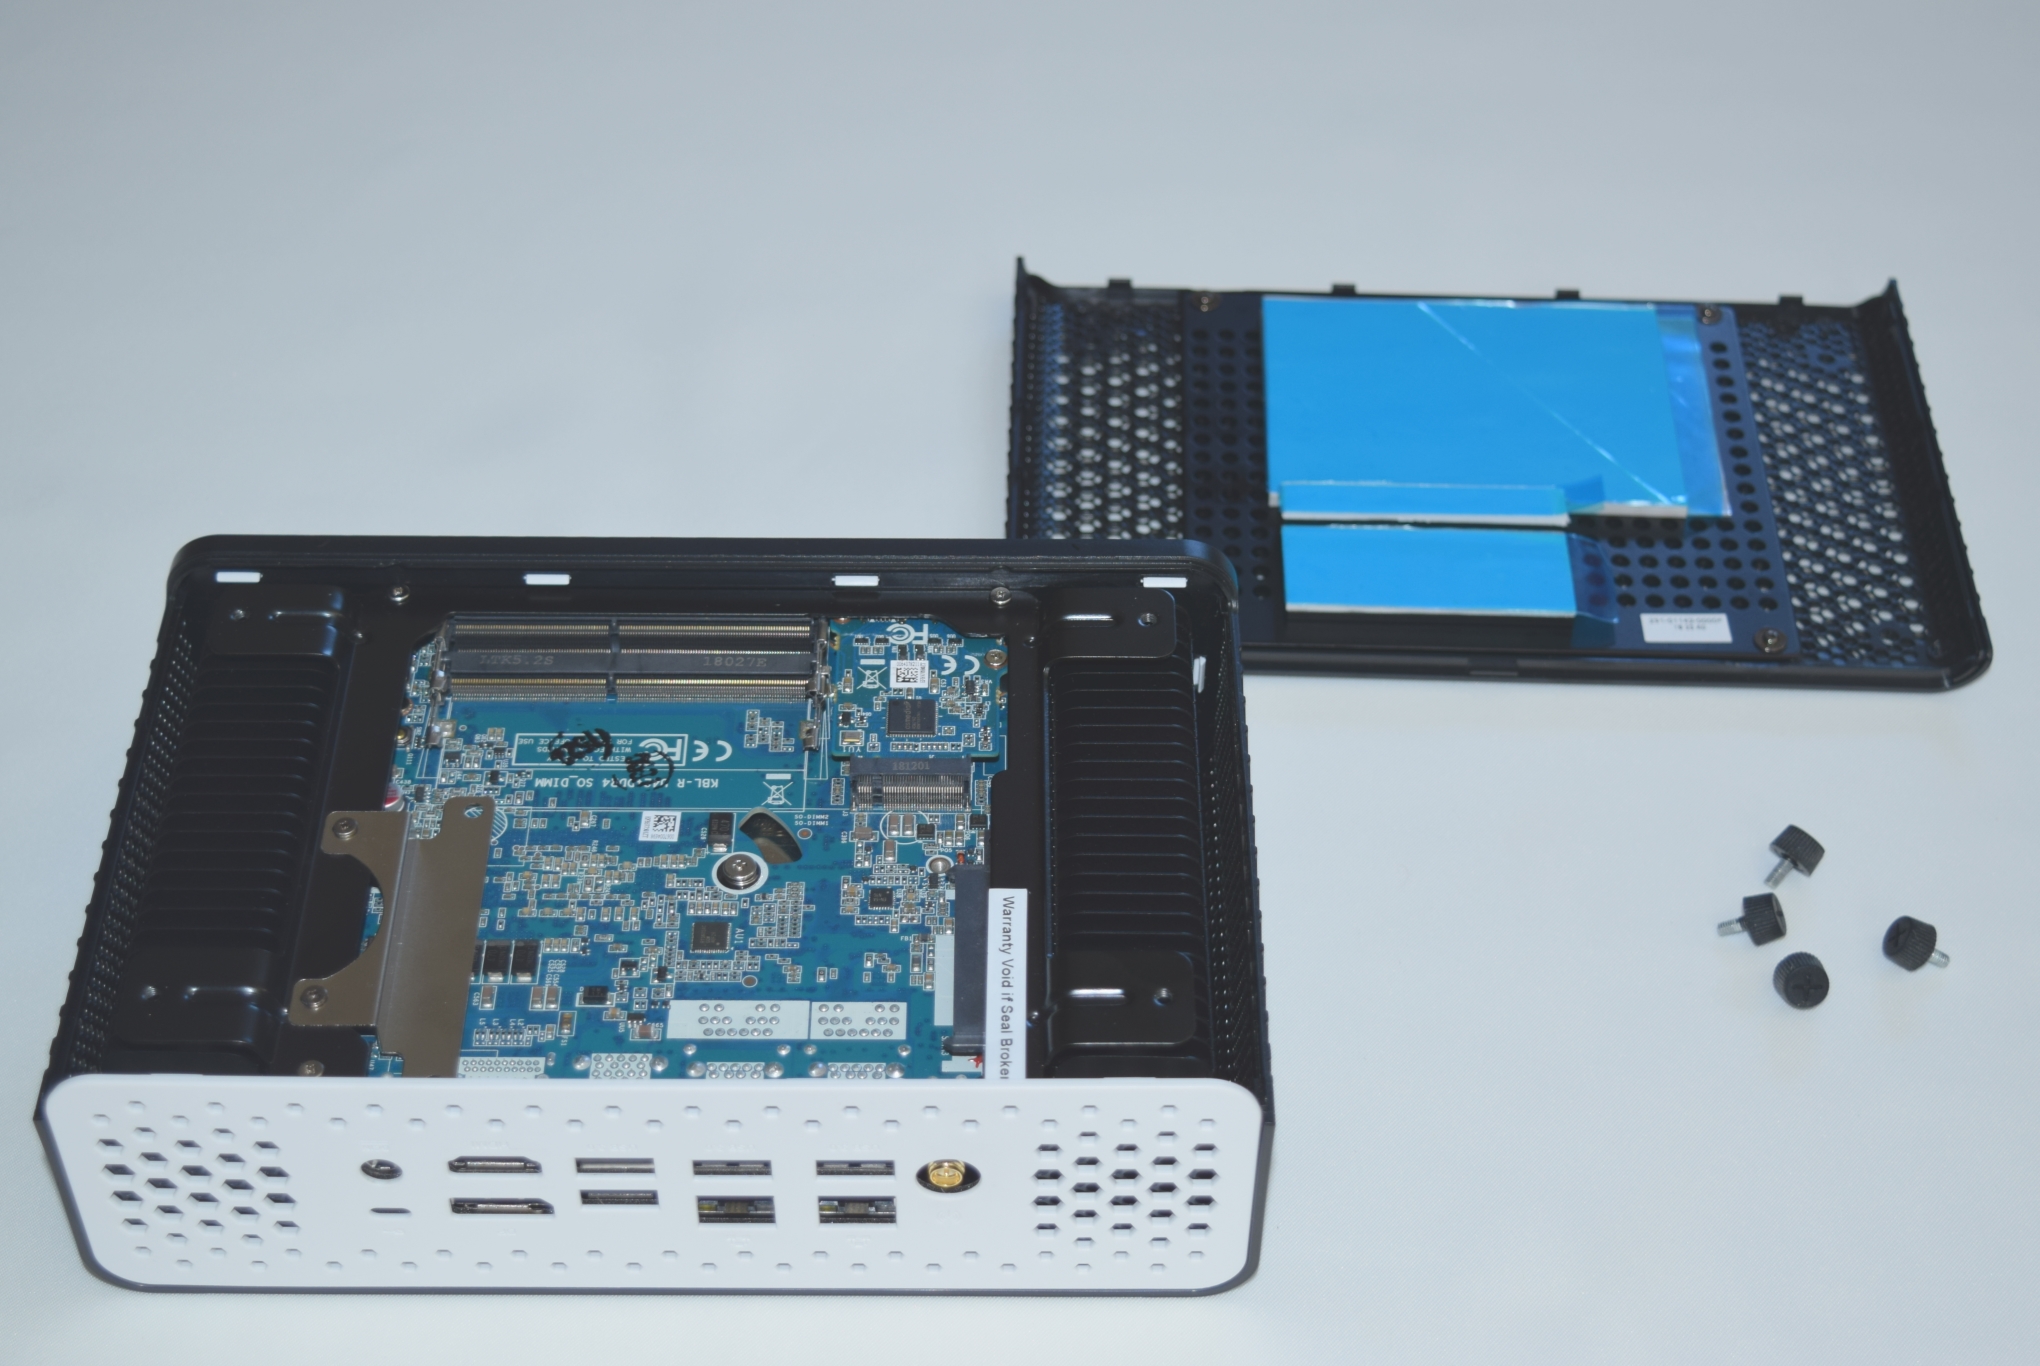
The heat sink fins revealed by the removal of the base fully envelopes the top segment of the board. The gallery below takes us around the unit as it is subject to additional teardown.


Platform Analysis
The Core i7-8550U package integrates an Intel Cannon Point-LP platform controller hub (PCH). While Zotac doesn't document the board layout in detail, the distribution of the PCIe lanes from the SiP is brought out in the system report summary generated by AIDA64:
- PCI-E 3.0 x1 port #3 In Use @ x1 (Realtek RTL8168/8111 PCI-E Gigabit Ethernet Adapter)
- PCI-E 3.0 x1 port #4 In Use @ x1 (Realtek RTL8168/8111 PCI-E Gigabit Ethernet Adapter)
- PCI-E 3.0 x1 port #5 In Use @ x1 (Intel Dual Band Wireless-AC 3165 AC HMC WiFi Adapter)
- PCI-E 3.0 x4 port #9 In Use @ x2 (ASMedia ASM2142 USB 3.1 xHCI Controller)
Unlike the Bean Canyon NUC's CNVi Wi-Fi built into the PCH, the CI660 nano has to use one of the PCIe lanes to support the Intel Wireless-AC 3165 WLAN adapter. The USB 3.1 Gen 2 ports also have to be enabled by a discrete ASMedia ASM2142 bridge. We have two gigabit Ethernet ports, and both are enabled by Realtek controllers.
The HDMI display output from the CI660 nano is not directly from the SiP's HDMI display output. Rather, Zotac uses a Parade Technologies PS175 LSPCon on board to convert the Display Port 1.2 output of the processor to a HDMI 2.0 port with HDCP 2.2. Theoretically, this also supports HDR. However, stereoscopic 3D is not supported.
In the table below, we have an overview of the various systems that we are comparing the Zotac ZBOX CI660 nano against. Note that they may not belong to the same market segment. The relevant configuration details of the machines are provided so that readers have an understanding of why some benchmark numbers are skewed for or against the CI660 nano when we come to those sections.
| Comparative PC Configurations | ||
| Aspect | Zotac ZBOX CI660 nano | |
| CPU | Intel Core i7-8550U | Intel Core i7-8550U |
| GPU | Intel UHD Graphics 620 | Intel UHD Graphics 620 |
| RAM | Patriot Memory Viper PV432G280C8SK DDR4 SODIMM 18-18-18-43 @ 2800 MHz 2x16 GB |
Patriot Memory Viper PV432G280C8SK DDR4 SODIMM 18-18-18-43 @ 2800 MHz 2x16 GB |
| Storage | Crucial BX300 (480 GB; 2.5" SATA III; Micron 32L 3D MLC) |
Crucial BX300 (480 GB; 2.5" SATA III; Micron 32L 3D MLC) |
| Wi-Fi | Intel Dual Band Wireless-AC 3165 (1x1 802.11ac - 433 Mbps) |
Intel Dual Band Wireless-AC 3165 (1x1 802.11ac - 433 Mbps) |
| Price (in USD, when built) | $625 (barebones) $865 (as configured, No OS) |
$625 (barebones) $865 (as configured, No OS) |
BAPCo SYSmark 2018
The Zotac ZBOX CI660 nano was evaluated using our Fall 2018 test suite for small-form factor PCs. In the first section, we will be looking at SYSmark 2018.
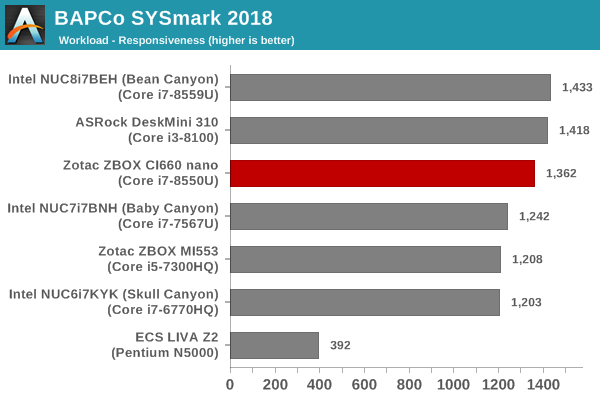
BAPCo's SYSmark 2018 is an application-based benchmark that uses real-world applications to replay usage patterns of business users in the areas of productivity, creativity, and responsiveness. The 'Productivity Scenario' covers office-centric activities including word processing, spreadsheet usage, financial analysis, software development, application installation, file compression, and e-mail management. The 'Creativity Scenario' represents media-centric activities such as digital photo processing, AI and ML for face recognition in photos and videos for the purpose of content creation, etc. The 'Responsiveness Scenario' evaluates the ability of the system to react in a quick manner to user inputs in areas such as application and file launches, web browsing, and multi-tasking.
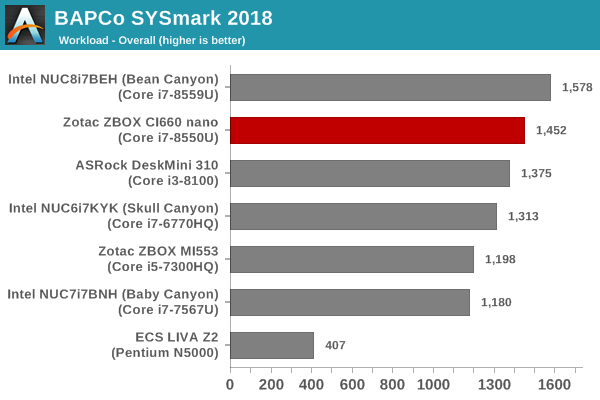
Scores are meant to be compared against a reference desktop (the SYSmark 2018 calibration system, a Dell Optiplex 5050 tower with a Core i3-7100 and 4GB of DDR4-2133 memory to go with a 128GB M.2 SATA III SSD). The calibration system scores 1000 in each of the scenarios. A score of, say, 2000, would imply that the system under test is twice as fast as the reference system.
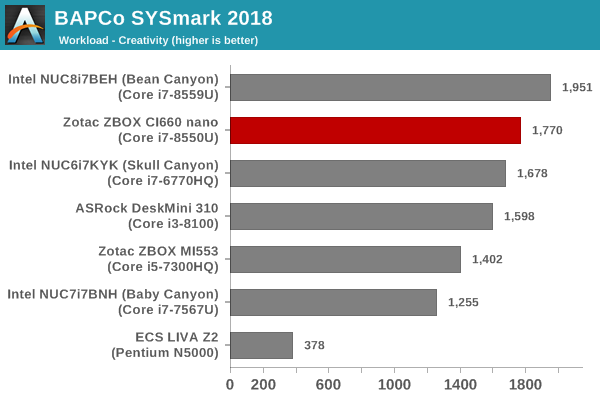
SYSmark 2018 also adds energy measurement to the mix. A high score in the SYSmark benchmarks might be nice to have, but, potential customers also need to determine the balance between power consumption and the efficiency of the system. For example, in the average office scenario, it might not be worth purchasing a noisy and power-hungry PC just because it ends up with a 2000 score in the SYSmark 2014 SE benchmarks. In order to provide a balanced perspective, SYSmark 2018 also allows vendors and decision makers to track the energy consumption during each workload. In the graphs below, we find the total energy consumed by the PC under test for a single iteration of each SYSmark 2018 workload. For reference, the calibration system consumes 5.36 Wh for productivity, 7.71 Wh for creativity, 5.61 Wh for responsiveness, and 18.68 Wh overall.
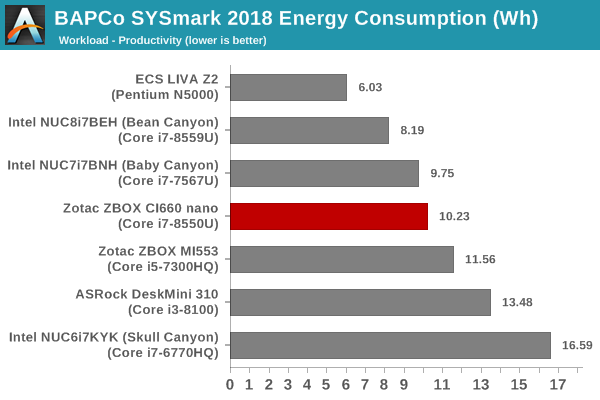
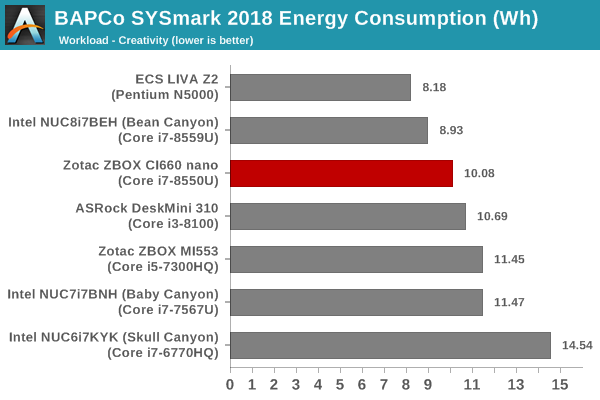
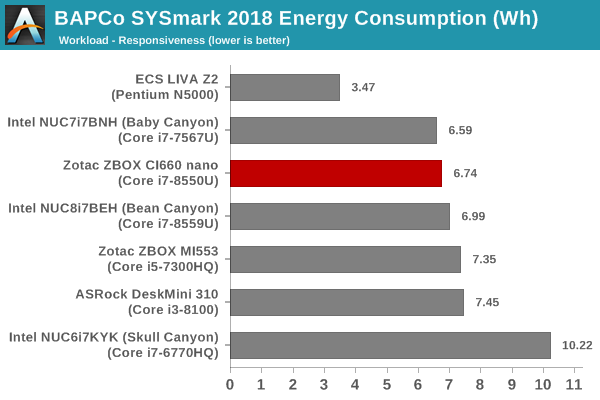
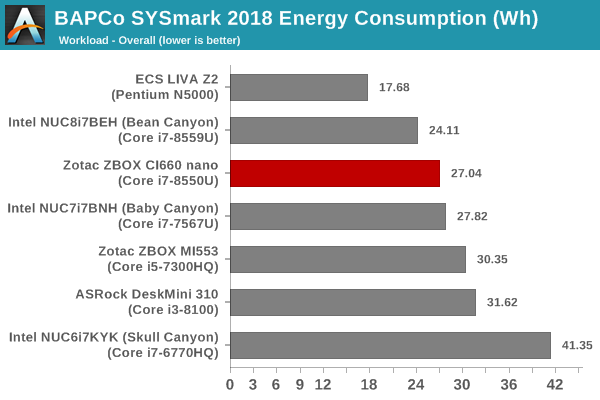
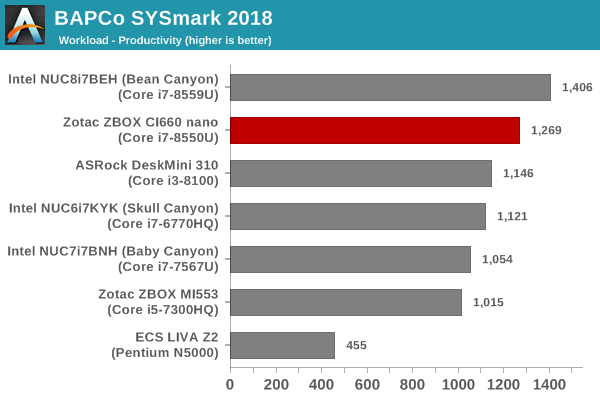
Despite being a dimunitive machine compared to the reference desktop, the ZBOX CI660 nano manages impressive scores across all the workloads due to its quad-core processor. In terms of raw performance and performance per watt, it is only surpassed by the Core i7-based Bean Canyon NUC (NUC8i7BEH). The energy consumption numbers are a bit high, considering that there is no active cooling. However, the performance numbers more than make up for it.
UL Benchmarks - PCMark and 3DMark
This section deals with a selection of the UL Futuremark benchmarks - PCMark 10, PCMark 8, and 3DMark. While the first two evaluate the system as a whole, 3DMark focuses on the graphics capabilities.
PCMark 10
UL's PCMark 10 evaluates computing systems for various usage scenarios (generic / essential tasks such as web browsing and starting up applications, productivity tasks such as editing spreadsheets and documents, gaming, and digital content creation). We benchmarked select PCs with the PCMark 10 Extended profile and recorded the scores for various scenarios. These scores are heavily influenced by the CPU and GPU in the system, though the RAM and storage device also play a part. The power plan was set to Balanced for all the PCs while processing the PCMark 10 benchmark.
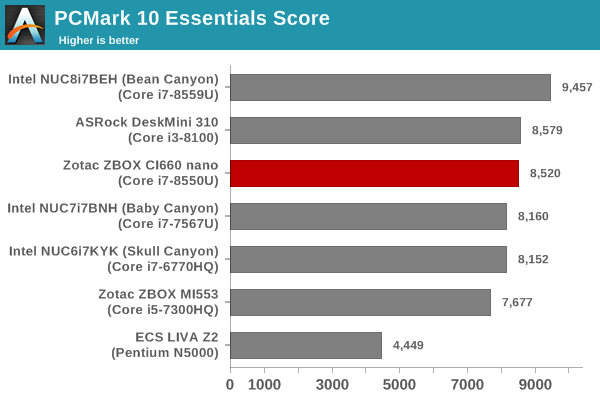
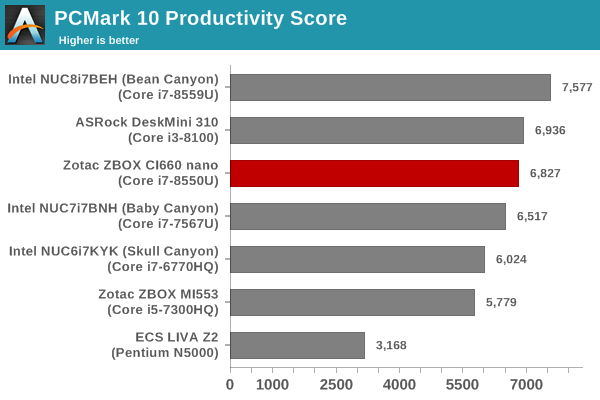
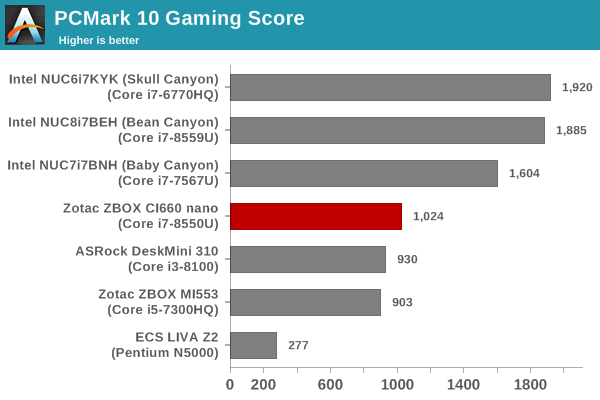

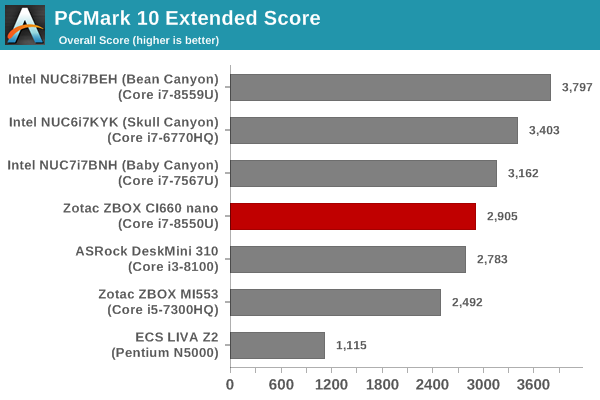
The relative numbers are very similar to the SYSmark 2018 results for those specific workloads. However, some expected weaknesses start showing up in the GPU-dependent workloads such as gaming and digital content creation.
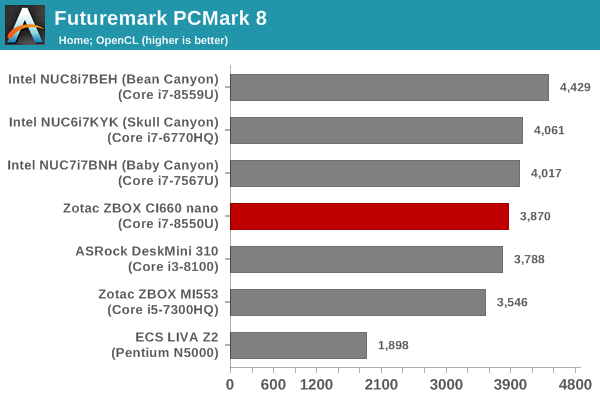
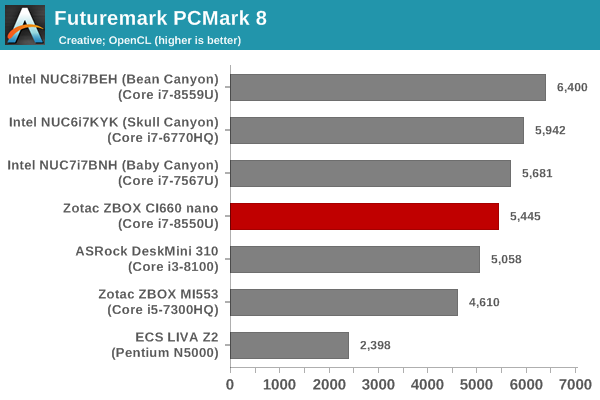
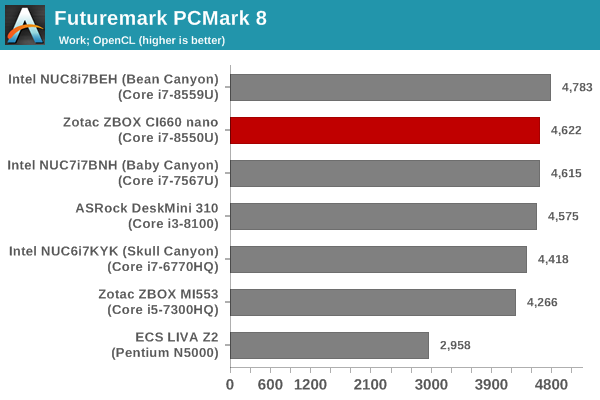
PCMark 8
We continue to present PCMark 8 benchmark results (as those have more comparison points) while our PCMark 10 scores database for systems grows in size. PCMark 8 provides various usage scenarios (home, creative and work) and offers ways to benchmark both baseline (CPU-only) as well as OpenCL accelerated (CPU + GPU) performance. We benchmarked select PCs for the OpenCL accelerated performance in all three usage scenarios. These scores are heavily influenced by the CPU in the system. The NUCs show consistently higher performance, except for the Work scenario, where only the Bean Canyon NUC configuration surpasses the CI660 nano.
3DMark
UL's 3DMark comes with a diverse set of graphics workloads that target different Direct3D feature levels. Correspondingly, the rendering resolutions are also different. We use 3DMark 2.4.4264 to get an idea of the graphics capabilities of the system. In this section, we take a look at the performance of the Zotac ZBOX CI660 nano across the different 3DMark workloads.
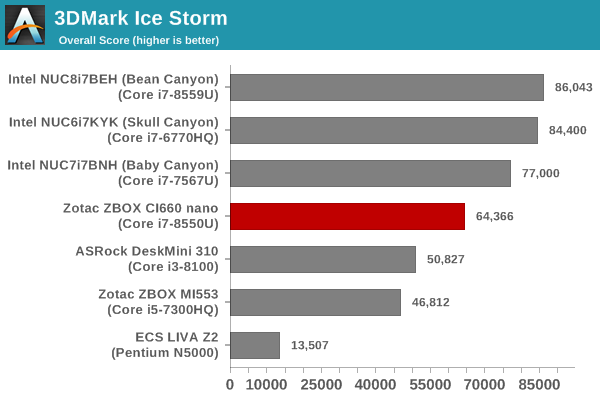
3DMark Ice Storm
This workload has three levels of varying complexity - the vanilla Ice Storm, Ice Storm Unlimited, and Ice Storm Extreme. It is a cross-platform benchmark (which means that the scores can be compared across different tablets and smartphones as well). All three use DirectX 11 (feature level 9) / OpenGL ES 2.0. While the Extreme renders at 1920 x 1080, the other two render at 1280 x 720. The graphs below present the various Ice Storm worloads' numbers for different systems that we have evaluated.
| UL 3DMark - Ice Storm Workloads | |||
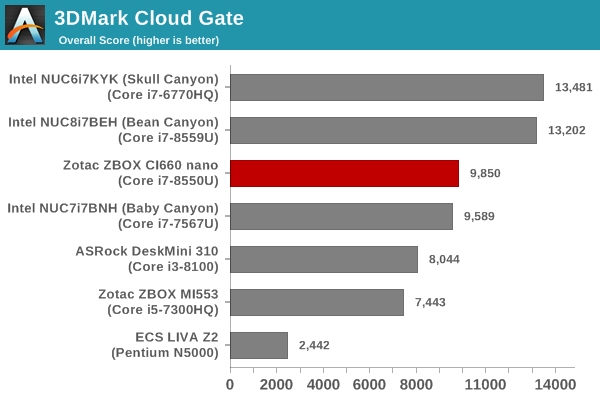
3DMark Cloud Gate
The Cloud Gate workload is meant for notebooks and typical home PCs, and uses DirectX 11 (feature level 10) to render frames at 1280 x 720. The graph below presents the overall score for the workload across all the systems that are being compared.
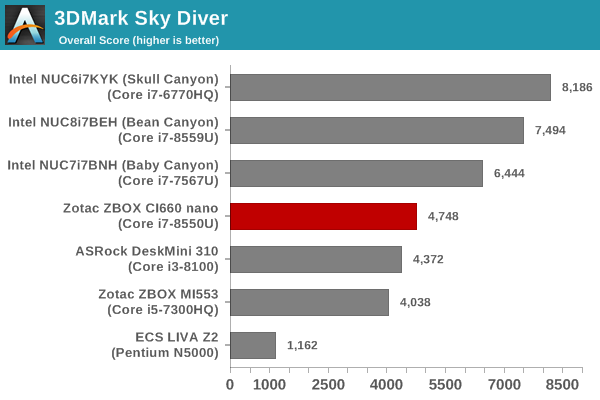
3DMark Sky Diver
The Sky Diver workload is meant for gaming notebooks and mid-range PCs, and uses DirectX 11 (feature level 11) to render frames at 1920 x 1080. The graph below presents the overall score for the workload across all the systems that are being compared.
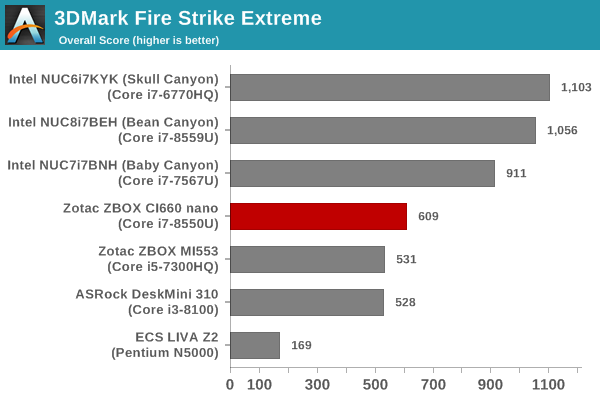
3DMark Fire Strike Extreme
The Fire Strike benchmark has three workloads. The base version is meant for high-performance gaming PCs. Similar to Sky Diver, it uses DirectX 11 (feature level 11) to render frames at 1920 x 1080. The Ultra version targets 4K gaming system, and renders at 3840 x 2160. However, we only deal with the Extreme version in our benchmarking - It renders at 2560 x 1440, and targets multi-GPU systems and overclocked PCs. The graph below presents the overall score for the Fire Strike Extreme benchmark across all the systems that are being compared.
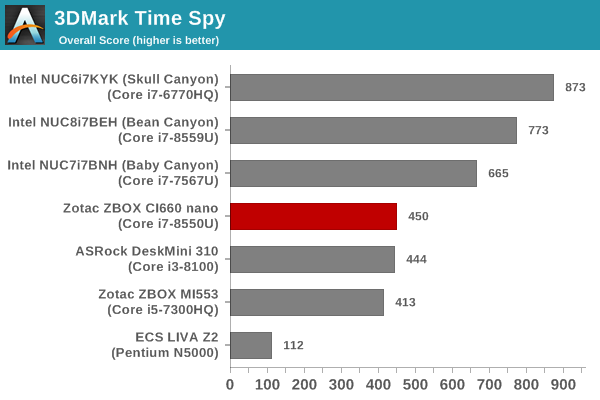
3DMark Time Spy
The Time Spy workload has two levels with different complexities. Both use DirectX 12 (feature level 11). However, the plain version targets high-performance gaming PCs with a 2560 x 1440 render resolution, while the Extreme version renders at 3840 x 2160 resolution. The graphs below present both numbers for all the systems that are being compared in this review.
| UL 3DMark - Time Spy Workloads | |||
3DMark Night Raid
The Night Raid workload is a DirectX 12 benchmark test. It is less demanding than Time Spy, and is optimized for integrated graphics. The graph below presents the overall score in this workload for different system configurations.
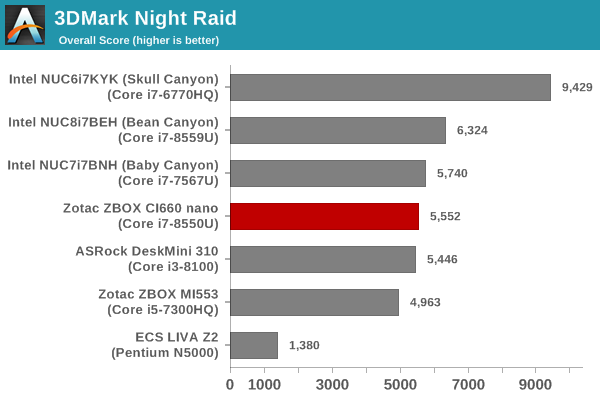
The 3DMark numbers show the CI660 nano coming consistently in the middle of the pack. The Iris Plus Graphics-enabled systems are obviously geared to show better numbers. Despite that, the CI660 nano manages to outperform other actively cooled PCs with similar or better GPU configurations (such as the Core i3-8100 / Intel UHD Graphics 630-based DeskMini 310).
Miscellaneous Performance Metrics
This section looks at some of the other commonly used benchmarks representative of the performance of specific real-world applications.
3D Rendering - CINEBENCH R15
We use CINEBENCH R15 for 3D rendering evaluation in our system reviews. The program provides three benchmark modes - OpenGL, single threaded and multi-threaded. Evaluation of different PC configurations in all three modes provided us the following results.
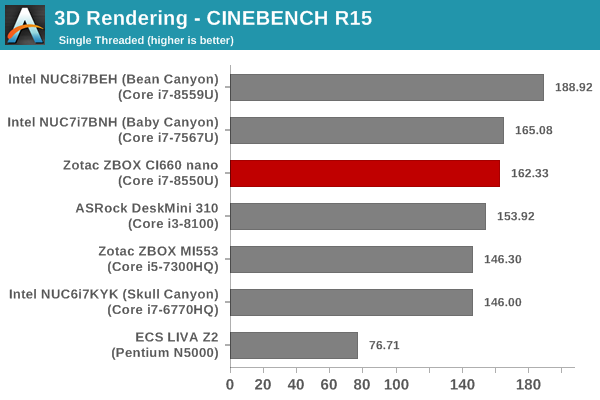
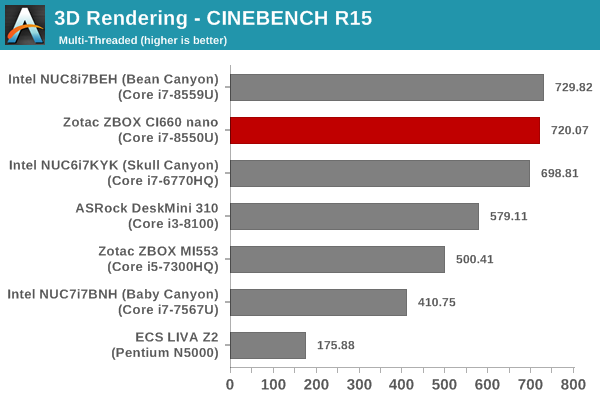
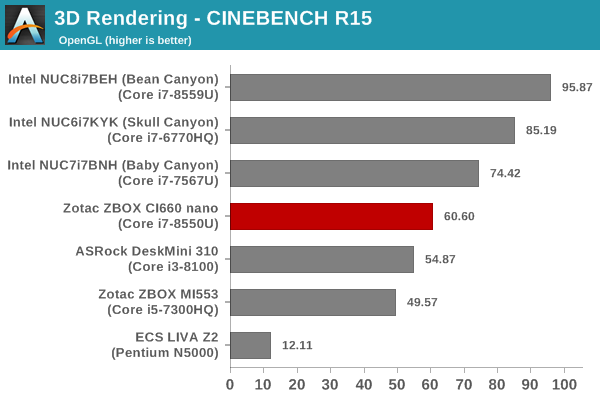
The Core i7-8550U's 4C/8T configuration helps the CI660 nano to perform better than even the Skull Canyon NUC in the multi-threaded workload. The single-threaded performance of the configuration is very similar to that of the actively-cooled Kaby Lake NUC (Baby Canyon). That said, the Coffee Lake NUC (Bean Canyon) with its 28W TDP processor easily comes out on top. In the OpenGL case, the systems with Iris Plus Graphics perform better than the CI660 nano. The key takeaway here is that the CI660 nano can easily compete with other actively cooled PCs in terms of performance.
x265 Benchmark
Next up, we have some video encoding benchmarks using x265 v2.8. The appropriate encoder executable is chosen based on the supported CPU features. In the first case, we encode 600 1080p YUV 4:2:0 frames into a 1080p30 HEVC Main-profile compatible video stream at 1 Mbps and record the average number of frames encoded per second.
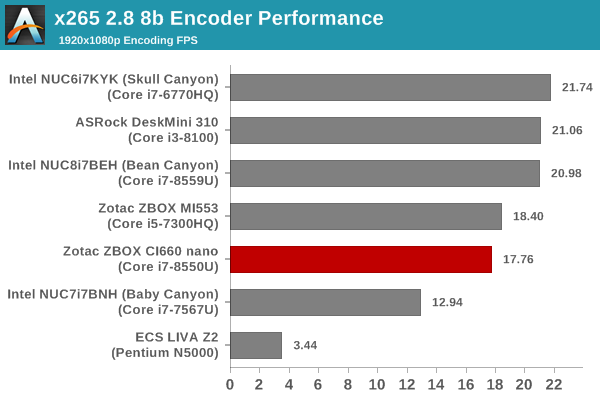
Our second test case is 1200 4K YUV 4:2:0 frames getting encoded into a 4Kp60 HEVC Main10-profile video stream at 35 Mbps. The encoding FPS is recorded.
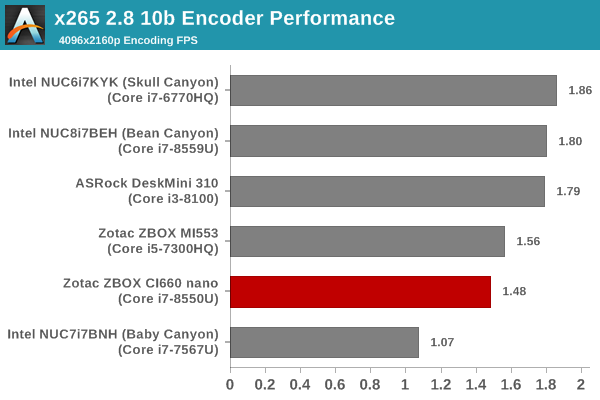
The performance in both tests depends on a combination of factors - the processor TDP, as well as the number of available threads. When this combination is taken into account, the 15W TDP Core i7-8550U loses out to almost all other tested combinations - the Skull Canyon NUC has a 45W TDP 4C/8T processor, the Bean Canyon has a 28W TDP 4C/8T processor, the DeskMini 310 has a 65W TDP 4C/4T processor, and the ZBOX MI553 has a 45W 4C/4T processor. The CI660 nano almost matches the performance of the ZBOX MI553 in these workloads.
7-Zip
7-Zip is a very effective and efficient compression program, often beating out OpenCL accelerated commercial programs in benchmarks even while using just the CPU power. 7-Zip has a benchmarking program that provides tons of details regarding the underlying CPU's efficiency. In this subsection, we are interested in the compression and decompression rates when utilizing all the available threads for the LZMA algorithm.
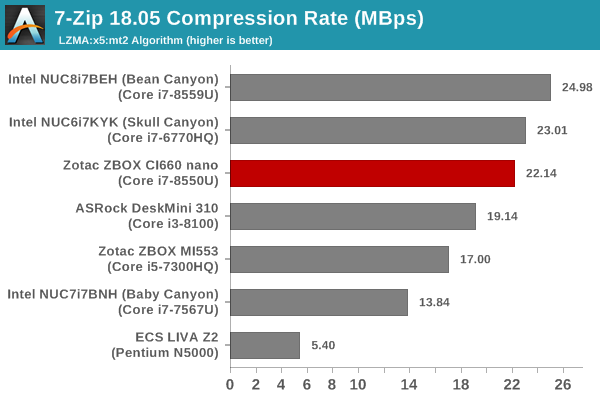
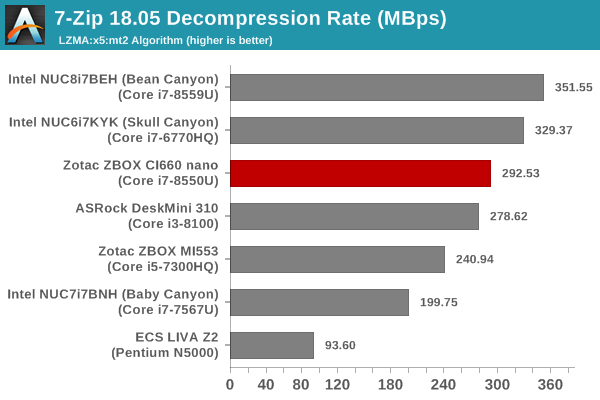
The performance in these workloads tracks what we observed in the SYSmark 2018 and PCMark 10 benchmarks.
Cryptography Benchmarks
Cryptography has become an indispensable part of our interaction with computing systems. Almost all modern systems have some sort of hardware-acceleration for making cryptographic operations faster and more power efficient. In this sub-section, we look at two different real-world applications that may make use of this acceleration.
BitLocker is a Windows features that encrypts entire disk volumes. While drives that offer encryption capabilities are dealt with using that feature, most legacy systems and external drives have to use the host system implementation. Windows has no direct benchmark for BitLocker. However, we cooked up a BitLocker operation sequence to determine the adeptness of the system at handling BitLocker operations. We start off with a 2.5GB RAM drive in which a 2GB VHD (virtual hard disk) is created. This VHD is then mounted, and BitLocker is enabled on the volume. Once the BitLocker encryption process gets done, BitLocker is disabled. This triggers a decryption process. The times taken to complete the encryption and decryption are recorded. This process is repeated 25 times, and the average of the last 20 iterations is graphed below.
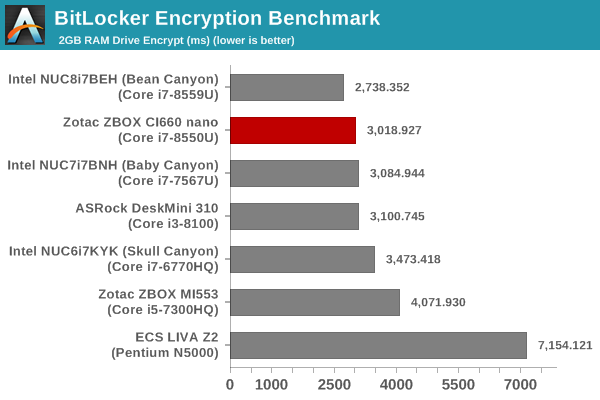
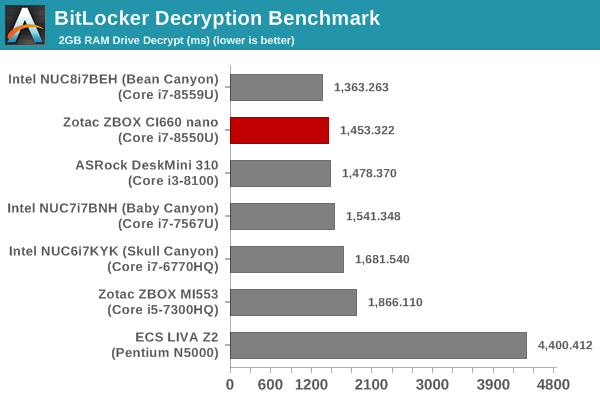
The numbers are closely stacked, with the CI660 nano surpassed only by the Bean Canyon NUC.
Creation of secure archives is best done through the use of AES-256 as the encryption method while password protecting ZIP files. We re-use the benchmark mode of 7-Zip to determine the AES256-CBC encryption and decryption rates using pure software as well as AES-NI. Note that the 7-Zip benchmark uses a 48KB buffer for this purpose.
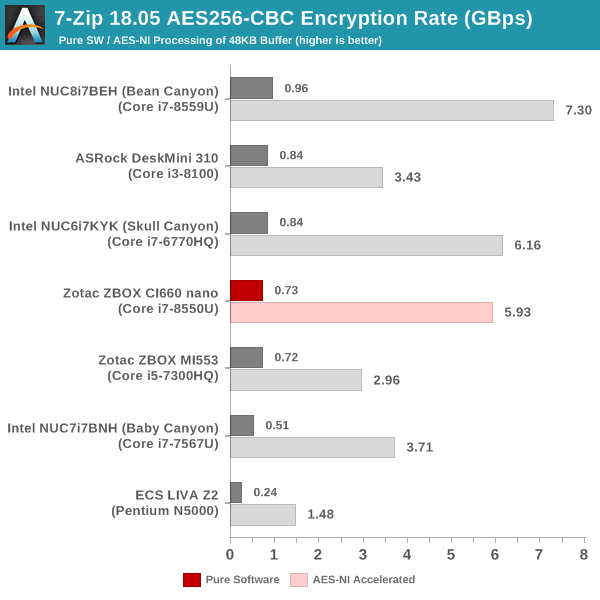
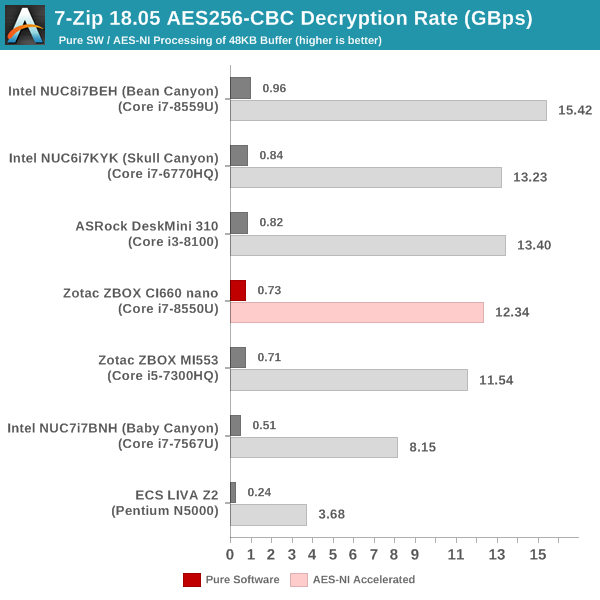
In this workload, the CI660 nano is in the middle of the pack, but the numbers are very close to each other for the systems with similar number of cores / threads.
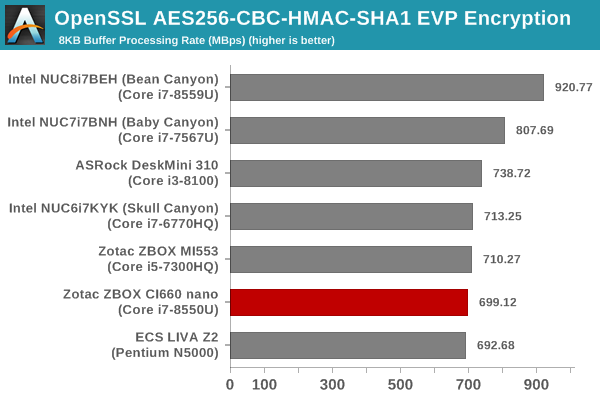
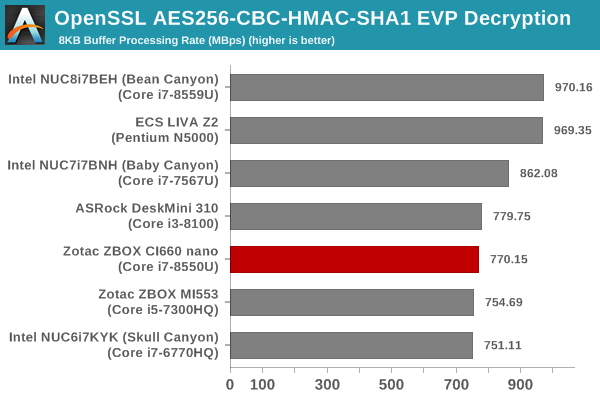
Yet another cryptography application is secure network communication. OpenSSL can take advantage of the acceleration provided by the host system to make operations faster. It also has a benchmark mode that can use varying buffer sizes. We recorded the processing rate for a 8KB buffer using the hardware-accelerated AES256-CBC-HAC-SHA1 feature.
Agisoft Photoscan
Agisoft PhotoScan is a commercial program that converts 2D images into 3D point maps, meshes and textures. The program designers sent us a command line version in order to evaluate the efficiency of various systems that go under our review scanner. The command line version has two benchmark modes, one using the CPU and the other using both the CPU and GPU (via OpenCL). We present the results from our evaluation using the CPU mode only. The benchmark (v1.3) takes 84 photographs and does four stages of computation:
- Stage 1: Align Photographs (capable of OpenCL acceleration)
- Stage 2: Build Point Cloud (capable of OpenCL acceleration)
- Stage 3: Build Mesh
- Stage 4: Build Textures
We record the time taken for each stage. Since various elements of the software are single threaded, and others multithreaded, it is interesting to record the effects of CPU generations, speeds, number of cores, and DRAM parameters using this software.
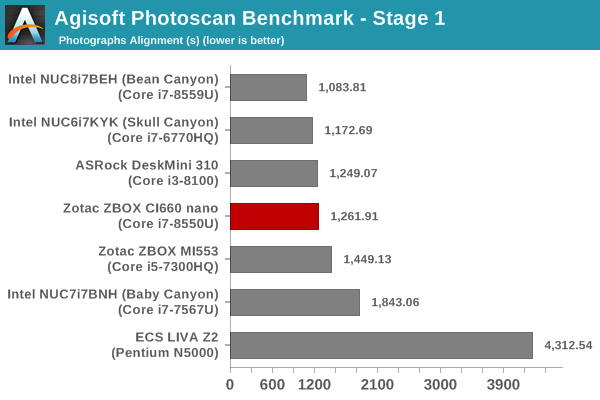
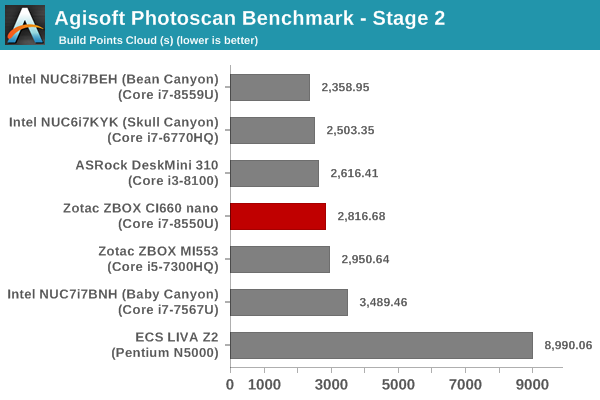
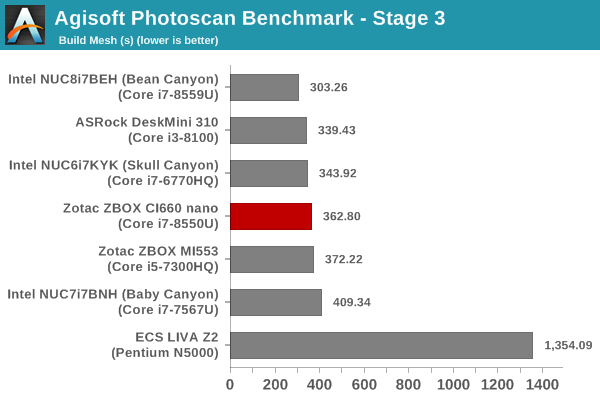
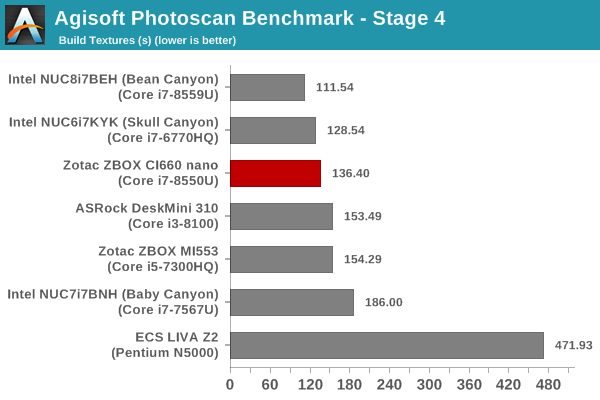
The Agisoft numbers are impressive, considering that the CI660 nano is passively cooled.
Dolphin Emulator
Wrapping up our application benchmark numbers is the new Dolphin Emulator (v5) benchmark mode results. This is again a test of the CPU capabilities.
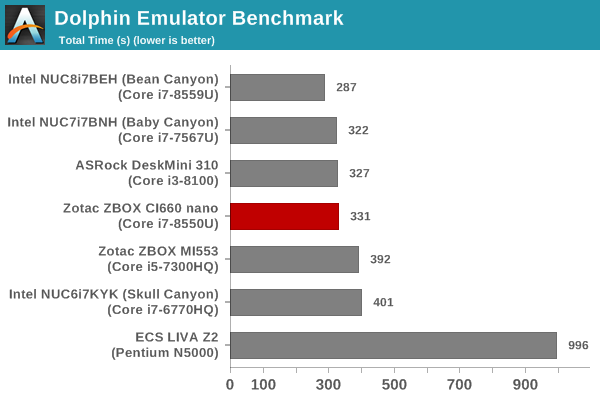
Only the Bean Canyon NUC performs significantly better than the CI660 nano.
Storage Performance
On the storage side, one option would be repetition of our strenuous SSD review tests on the drive(s) in the PC. Fortunately, to avoid that overkill, PCMark 8 has a storage bench where certain common workloads such as loading games and document processing are replayed on the target drive. Results are presented in two forms, one being a benchmark number and the other, a bandwidth figure. We ran the PCMark 8 storage bench on selected PCs and the results are presented below.
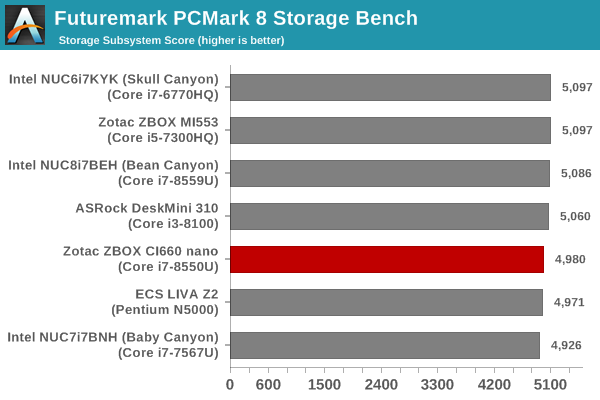
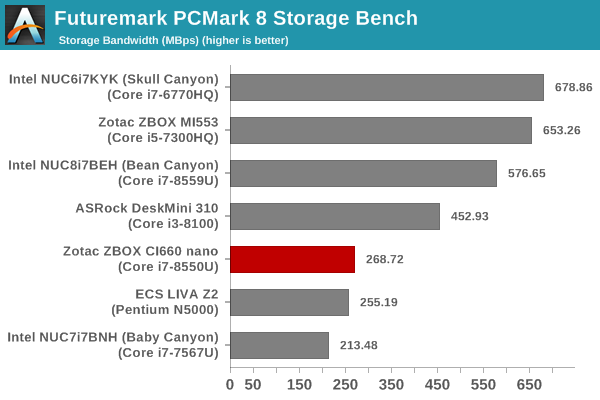
One of the drawbacks (if users might want to call it that) of the CI660 nano's platform is the absence of a NVMe SSD slot. Only a single SATA drive is supported, and this reults in an entry in the lower half of the graph for the CI660 nano and its Crucial BX300 SATA SSD. Make no mistake - the BX300 has very good performance for a SATA SSD with its MLC NAND, but, it does come up short against the NVMe SSDs installed in most of the other systems.
HTPC Credentials - Display Outputs Capabilities
The
| Zotac ZBOX CI660 nano Display Outputs | ||
| HDMI | DisplayPort | |
| Version | 2.0a | 1.2 |
| Max. Video Output | 3840x2160 @ 60Hz | 4096x2160 @ 60Hz |
| HDCP | Yes (2.2) | |
| HDR | Yes* | No |
| HD Audio Bitstreaming | Yes | |
Supporting the display of high-resolution protected video content is a requirement for even a casual HTPC user. In addition, HTPC enthusiasts also want their systems to support refresh rates that either match or be an integral multiple of the frame rate of the video being displayed. Most displays / AVRs are able to transmit the supported refresh rates to the PC using the EDID metadata. In some cases, the desired refresh rate might be missing in the list of supported modes.
Custom Resolutions
Our evaluation of the
We tested out various display refresh rates ranging from 23.976 Hz to 59.94 Hz. Of particular interest is the 23.976 Hz (23p) setting, which Intel used to have trouble with in the pre-Broadwell days.

The gallery below presents screenshots from the other refresh rates that were tested. The system has no trouble maintaining a fairly accurate refresh rate throughout the duration of the video playback.


High Dynamic Range (HDR) Support
Zotac claims that the HDMI output port supports HDR, but, we were unable to get HDR working with our two test displays - the TCL 55P607 via a Denon AVR-X3400H, and a LG 34BK95U. The OS did present the HDR toggle button in both cases. However, activating it resulted in a complete loss of activity on the HDMI link. In the interest of full disclosure, Zotac did indicate that they managed to get HDMI 2.0 4Kp60 output with HDCP 2.2 active and HDR enabled using the LG 27UK600 and the Dell UP2718Q monitors.
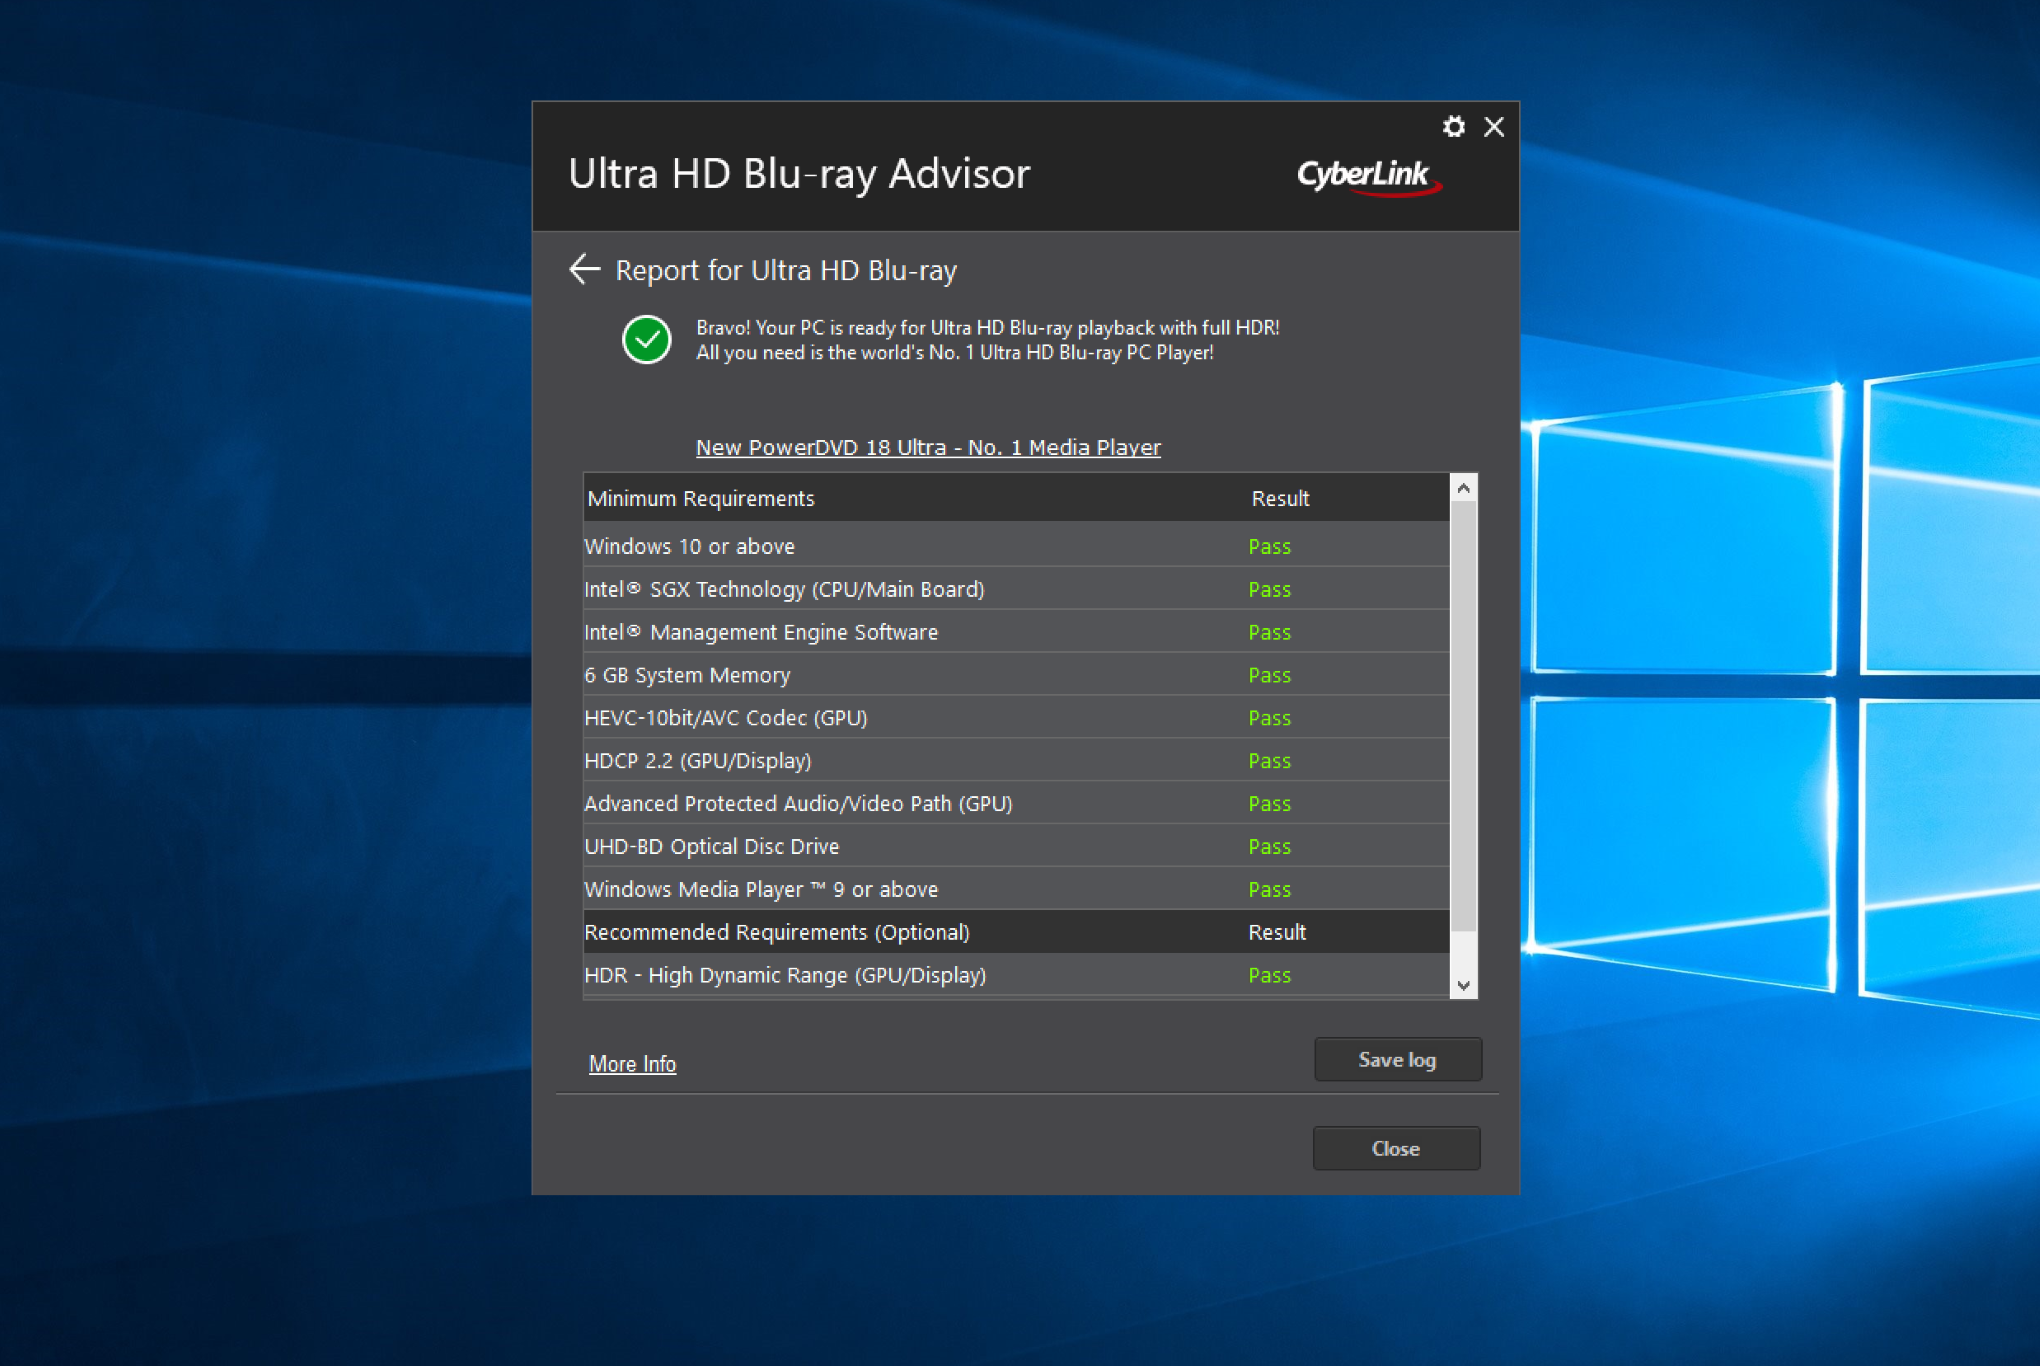
The CyberLink Ultra HD Blu-ray Advisor tool does indicate that our setup (Zotac ZBOX CI660 nano + Denon AVR-X3400H + TCL 55P607) supports HDCP 2.2 along with HDR. The PC also satisfies other requirements (such as SGX and appropriate Management Engine firmware) to enable playback of Ultra HD Blu-rays. It is just that HDR didn't work in practice in our particular setup.
HTPC Credentials - YouTube and Netflix Streaming
Our HTPC testing with respect to YouTube had been restricted to playback of a 1080p music video using the native HTML5 player in Firefox. The move to 4K, and the need to evaluate HDR support have made us choose Mystery Box's Peru 8K HDR 60FPS video as our test sample moving forward. On PCs running Windows, it is recommended that HDR streaming videos be viewed using the Microsoft Edge browser after putting the desktop in HDR mode. We evaluated the CI660 nano in SDR mode.
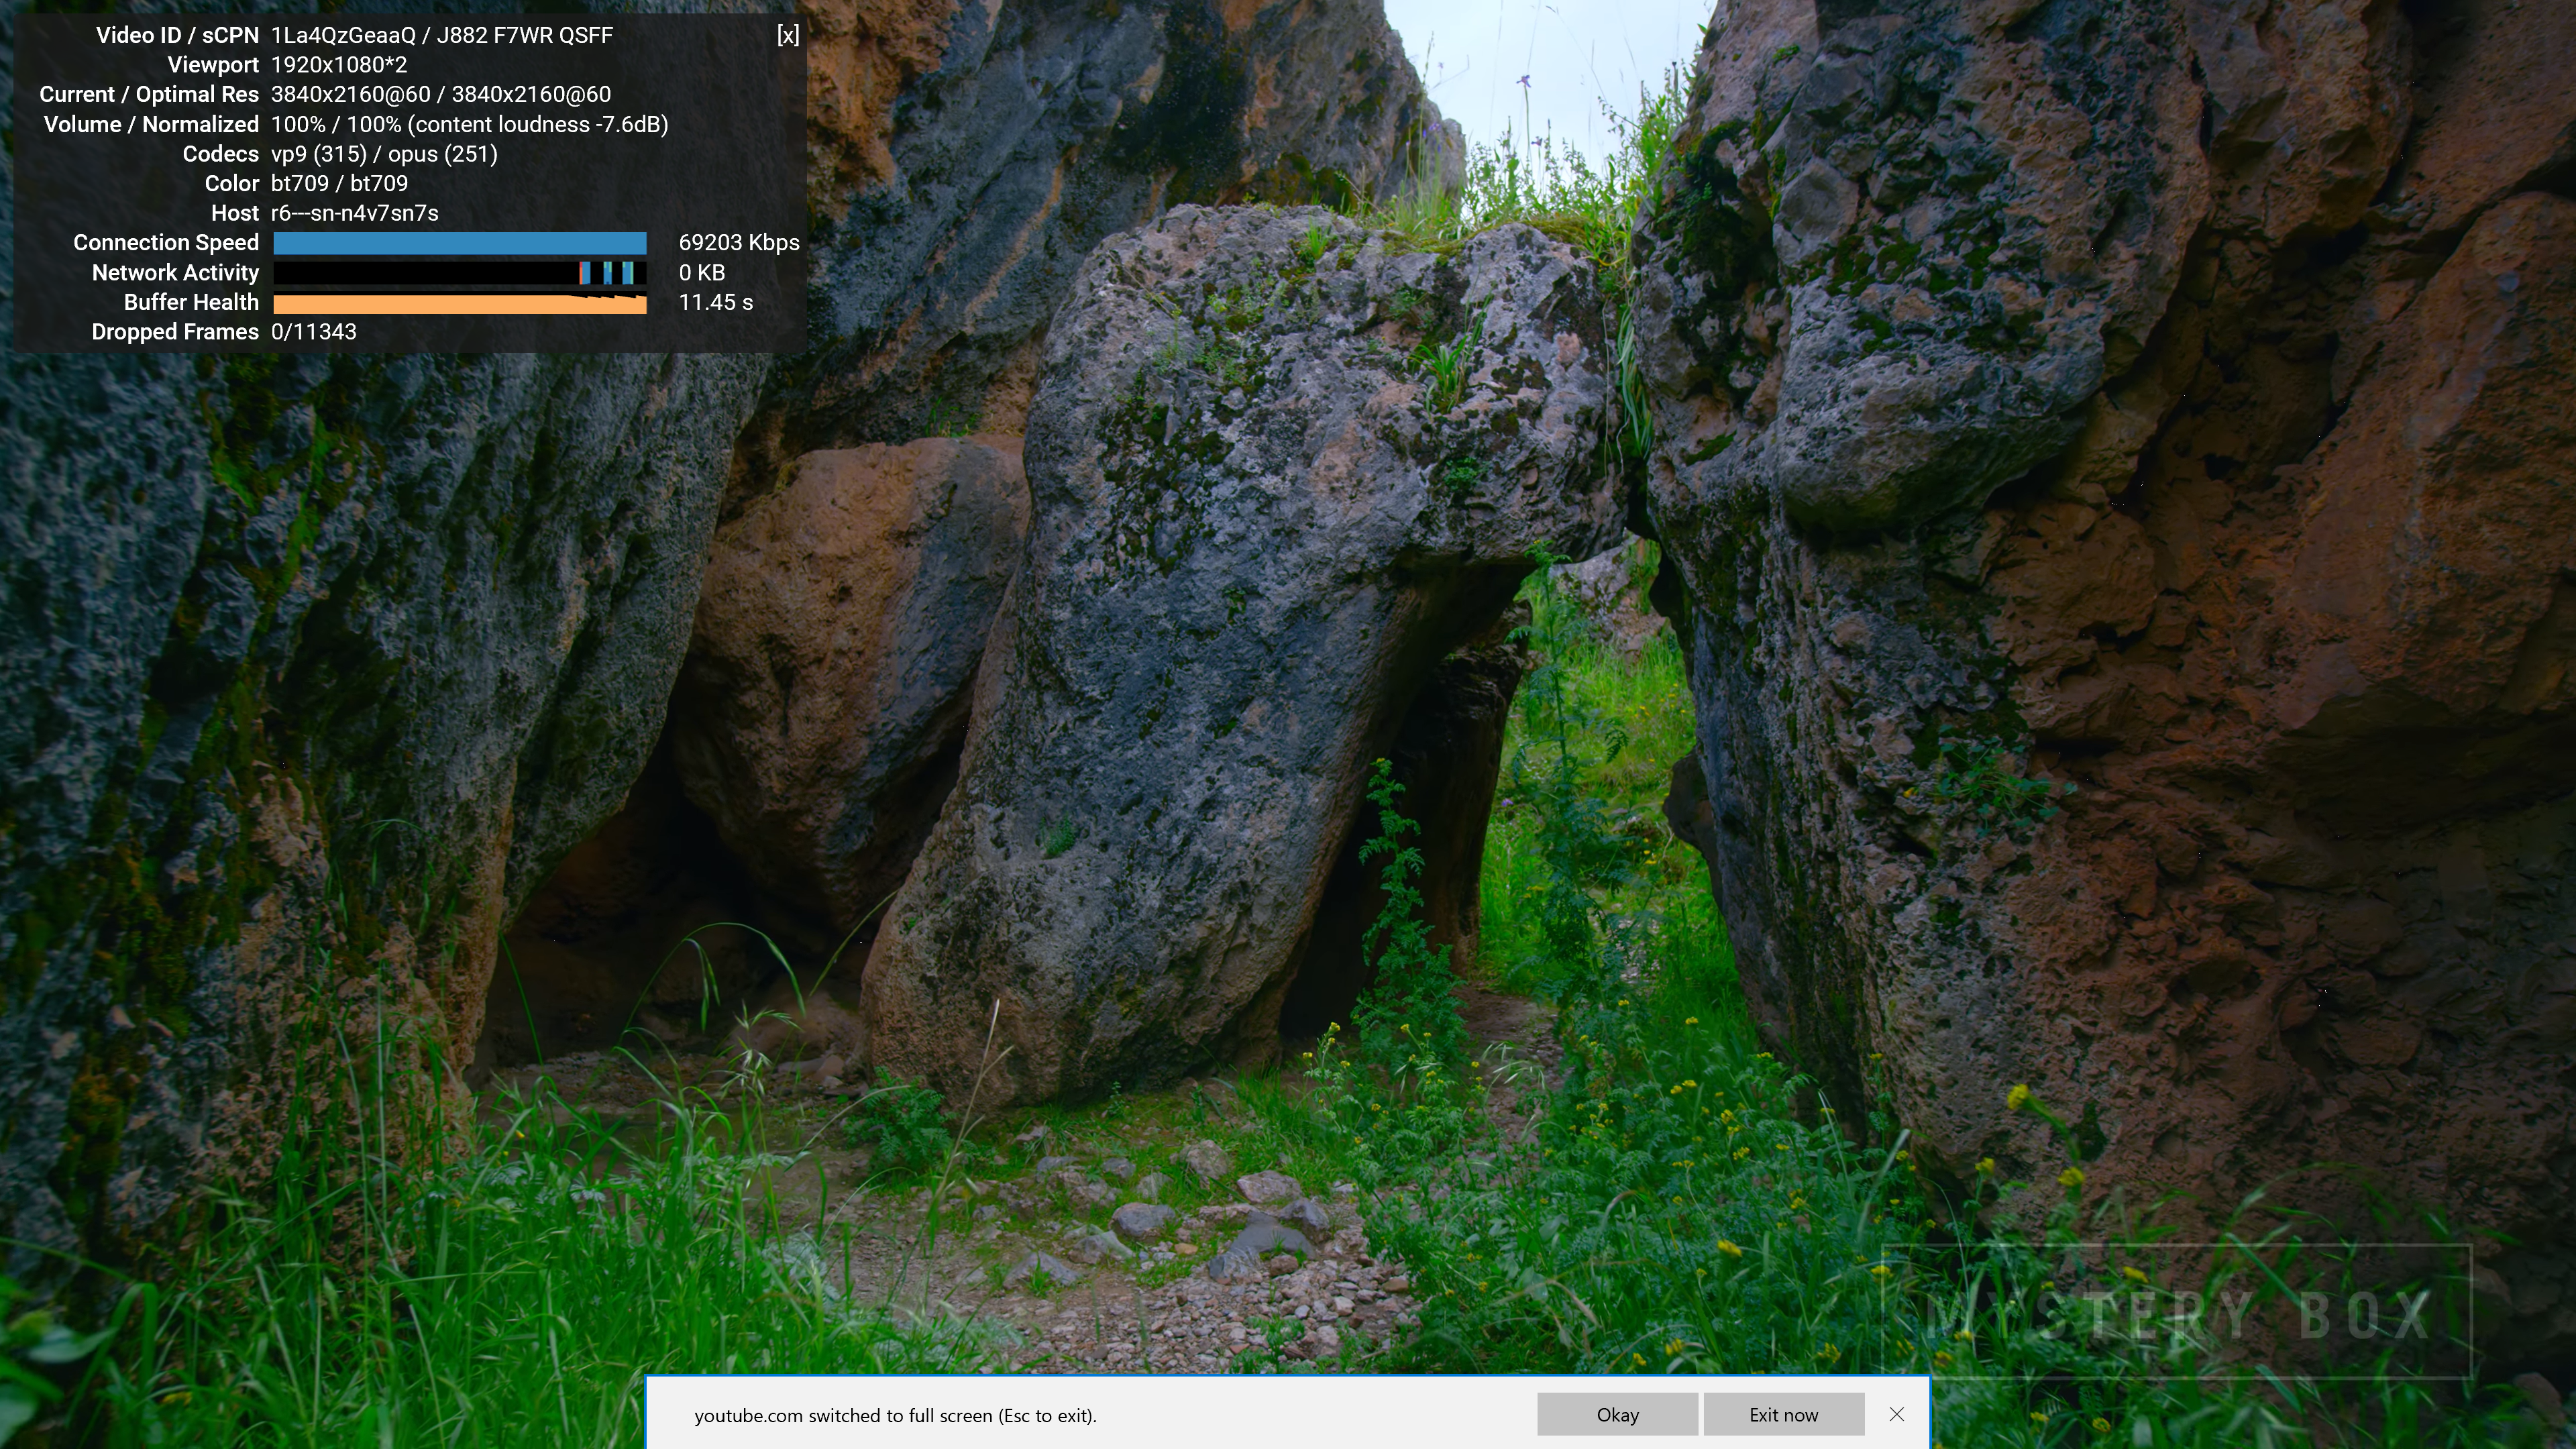
Since the streaming was done in SDR mode, the VP9 video stream with Opus audio was played back.
Various metrics of interest such as GPU usage and at-wall power consumption were recorded for the first four minutes of the playback of the above video. The numbers are graphed below.
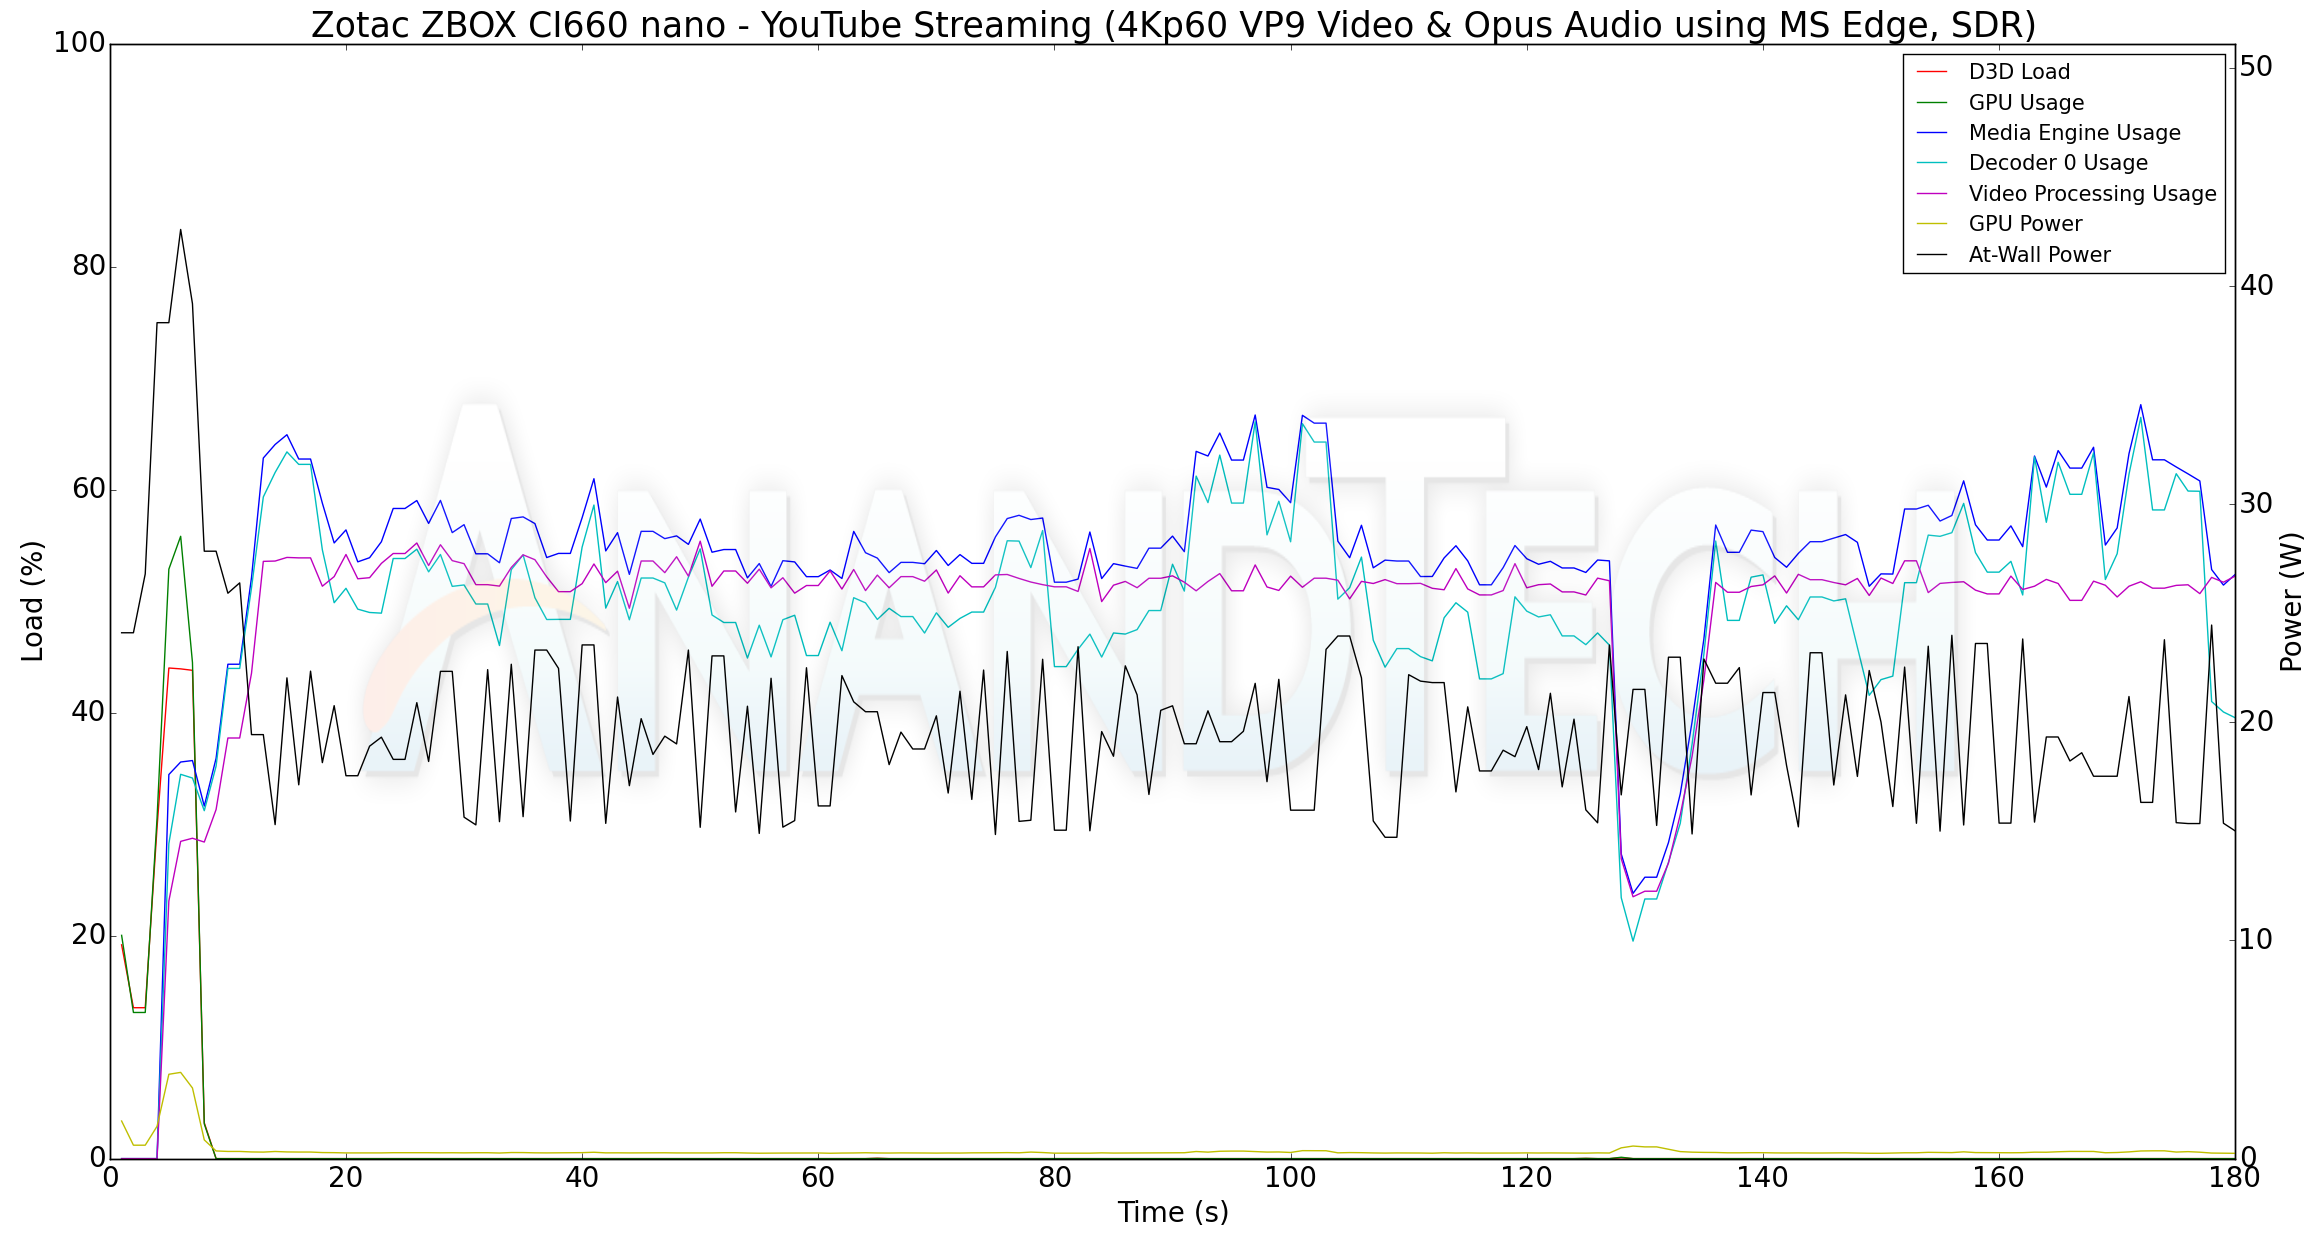
The average power consumption for YouTube playback is slightly south of 20W. We see the GPU / D3D Load around the 40% mark in the initial stages when the lower resolution stream is decoded and upscaled for display at 4K resolution. The at-wall power consumption is correspondingly higher around 35W. However, once the 4K resolution stream starts getting decided, the media engine / decoder usage settles down around 50% and the D3D loading is no longer a significant factor.
The Netflix 4K HDR capability works with native Windows Store app as well as the Microsoft Edge browser. We used the Windows Store app to evaluate the playback of Season 4 Episode 4 of the Netflix Test Patterns title. The OS screenshot facilities obviously can't capture the video being played back. However, the debug OSD (reachable by Ctrl-Alt-Shift-D) can be recorded.
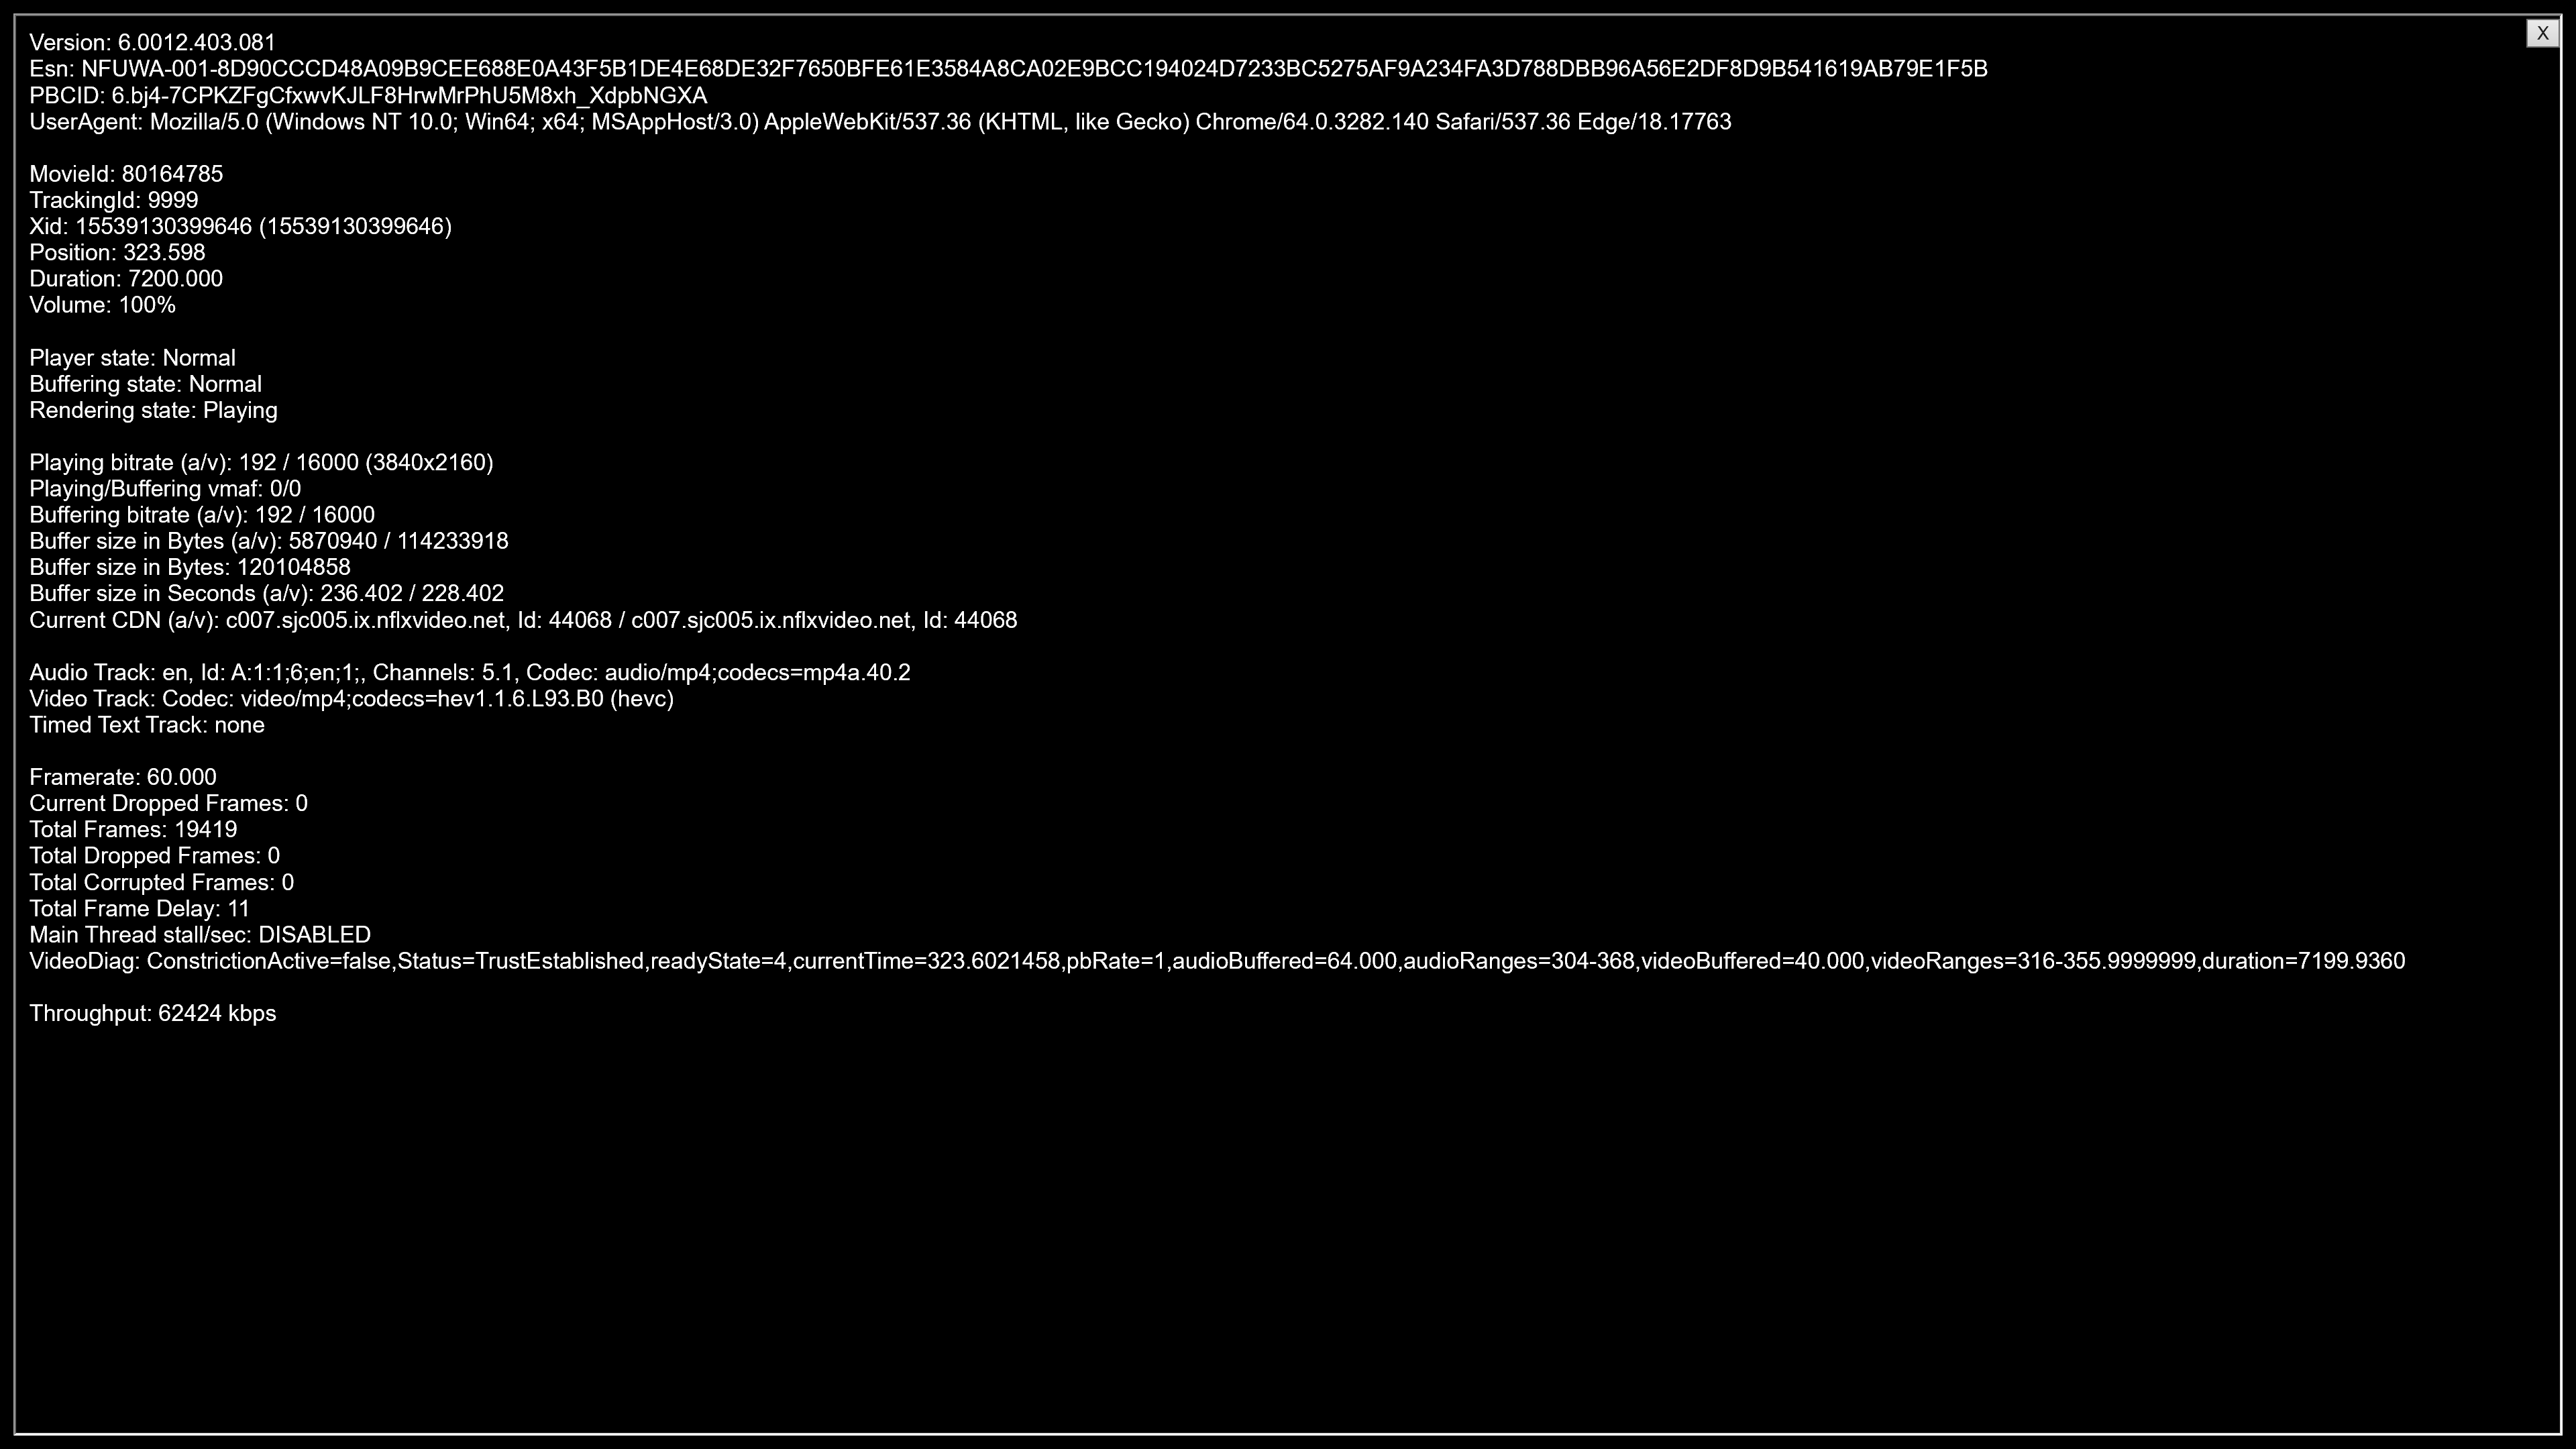
The (hevc) entry corresponding to the Video Track in the debug OSD, along with the A/V bitrate details (192 kbps / 16 Mbps) indicate that the 4K stream is indeed being played back. Similar to the YouTube streaming case, metrics such as GPU usage and at-wall power consumption were recorded for the first three minutes of the playback of the title. The numbers are graphed below.
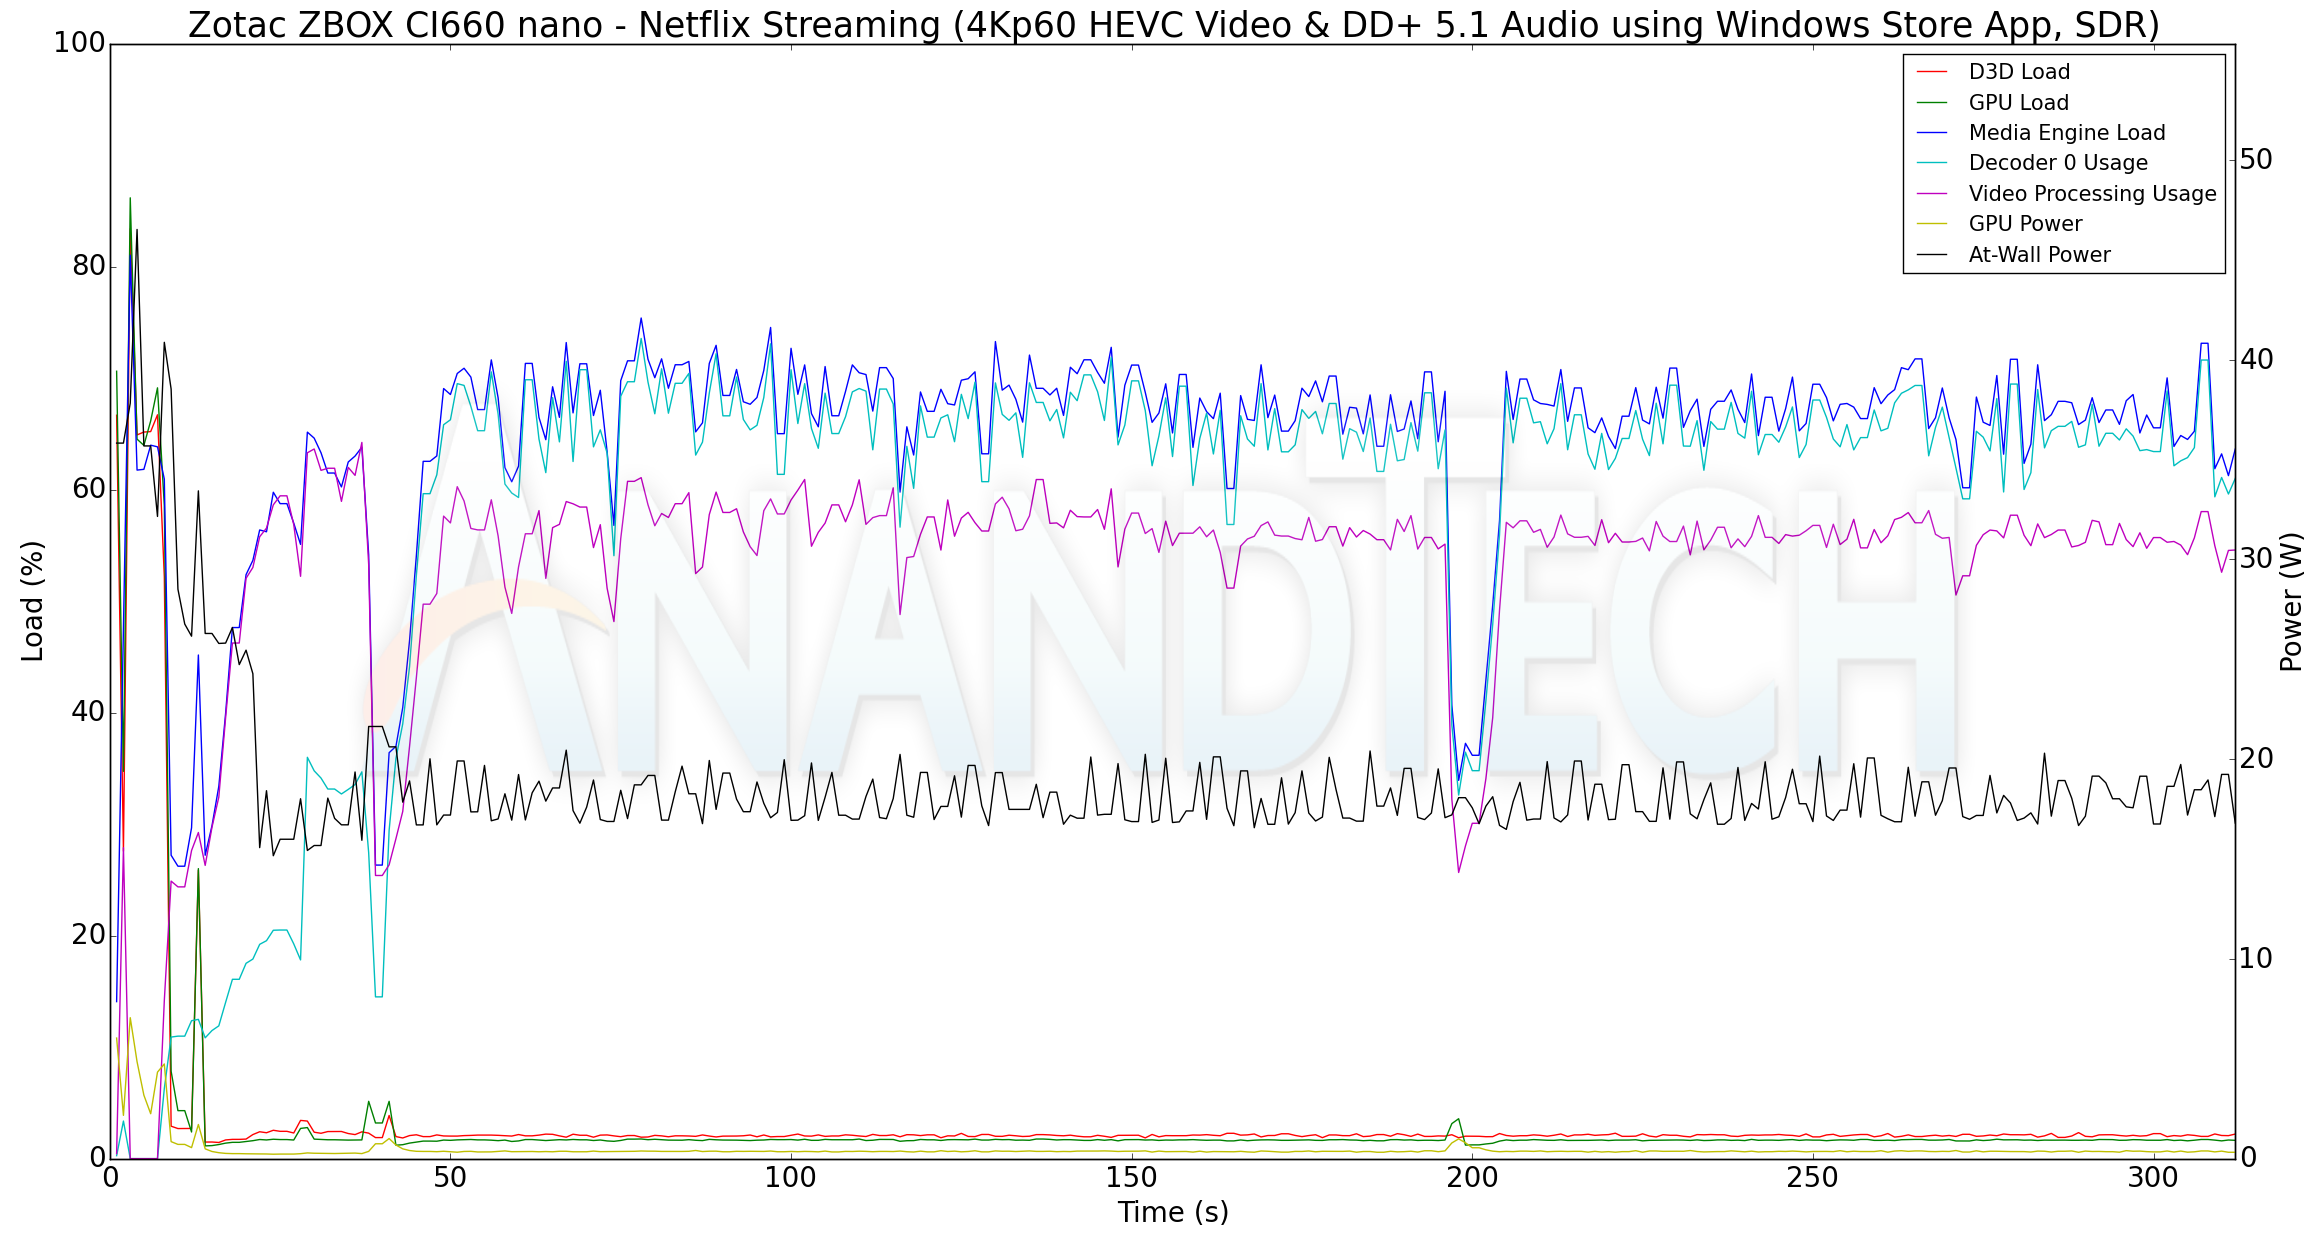
In the steady state (4K decode and playback), the power consumption is around 18W, and the media engine / decoder load is around 65%.
HTPC Credentials - Local Media Playback and Video Processing
Evaluation of local media playback and video processing is done by playing back files encompassing a range of relevant codecs, containers, resolutions, and frame rates. A note of the efficiency is also made by tracking GPU usage and power consumption of the system at the wall. Users have their own preference for the playback software / decoder / renderer, and our aim is to have numbers representative of commonly encountered scenarios. Towards this, we played back the test streams using the following combinations:
- MPC-HC x64 1.8.5 + LAV Video Decoder (DXVA2 Native) + Enhanced Video Renderer - Custom Presenter (EVR-CP)
- MPC-HC x64 1.8.5 + LAV Video Decoder (D3D11) + madVR 0.92.17 (DXVA-Focused)
- MPC-HC x64 1.8.5 + LAV Video Decoder (D3D11) + madVR 0.92.17 (Lanczos-Focused)
- VLC 3.0.6
- Kodi 18.1
The thirteen test streams (each of 90s duration) were played back from the local disk with an interval of 30 seconds in-between. Various metrics including GPU usage and at-wall power consumption were recorded during the course of this playback. Prior to looking at the metrics, a quick summary of the decoding capabilities of the Intel UHD Graphics 620 in the Core i7-8550U of the ZBOX CI660 nano is useful to have for context.
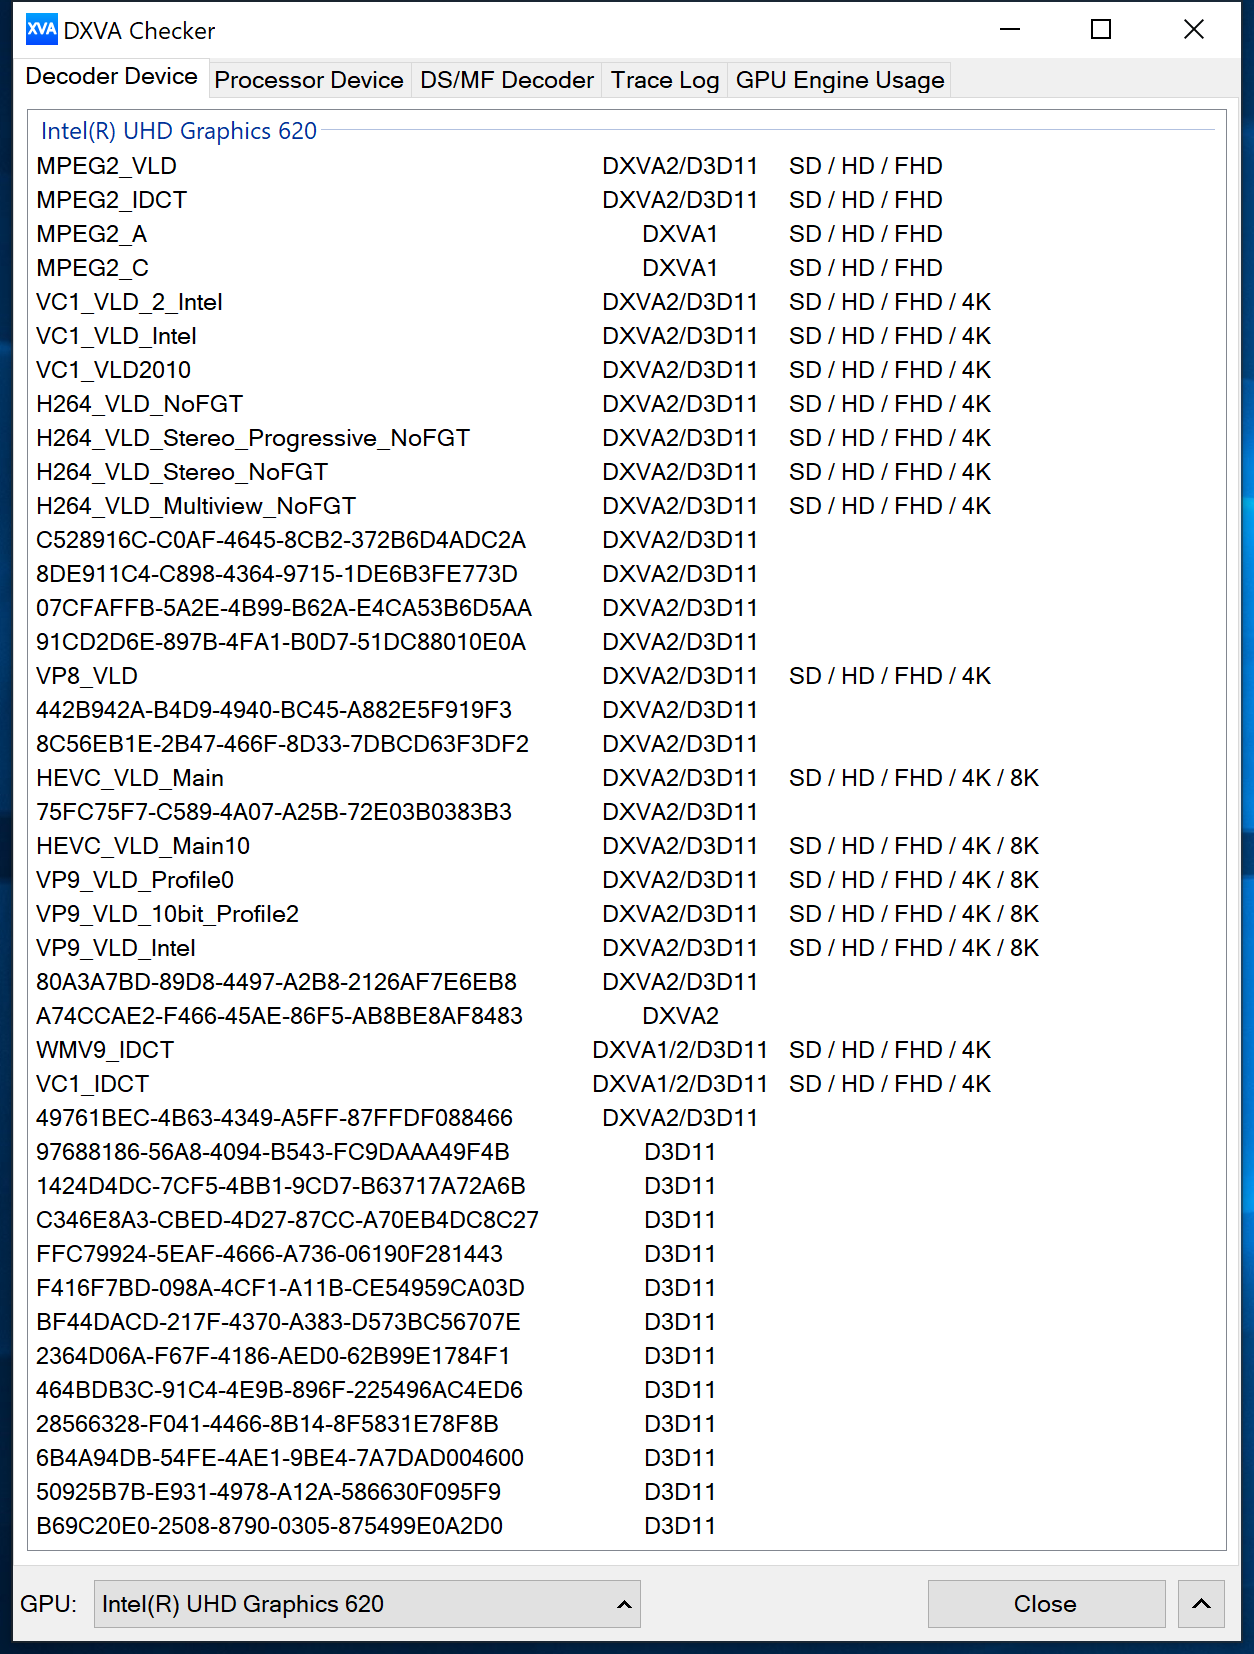
The GPU supports hardware-accelerated decoding for all popular codecs at up to 4K for AVC and older codecs, and up to 8K for the newer HEVC and VP9 variants.
All our playback tests were done with the desktop HDR setting turned off.
VLC and Kodi
VLC is the playback software of choice for the average PC user who doesn't need a ten-foot UI. Its install-and-play simplicity has made it extremely popular. Over the years, the software has gained the ability to take advantage of various hardware acceleration options. Kodi, on the other hand, has a ten-foot UI making it the perfect open-source software for dedicated HTPCs. Support for add-ons make it very extensible and capable of customization. We played back our test files using the default VLC and Kodi configurations, and recorded the following metrics.
| Video Playback Efficiency - VLC and Kodi | |||
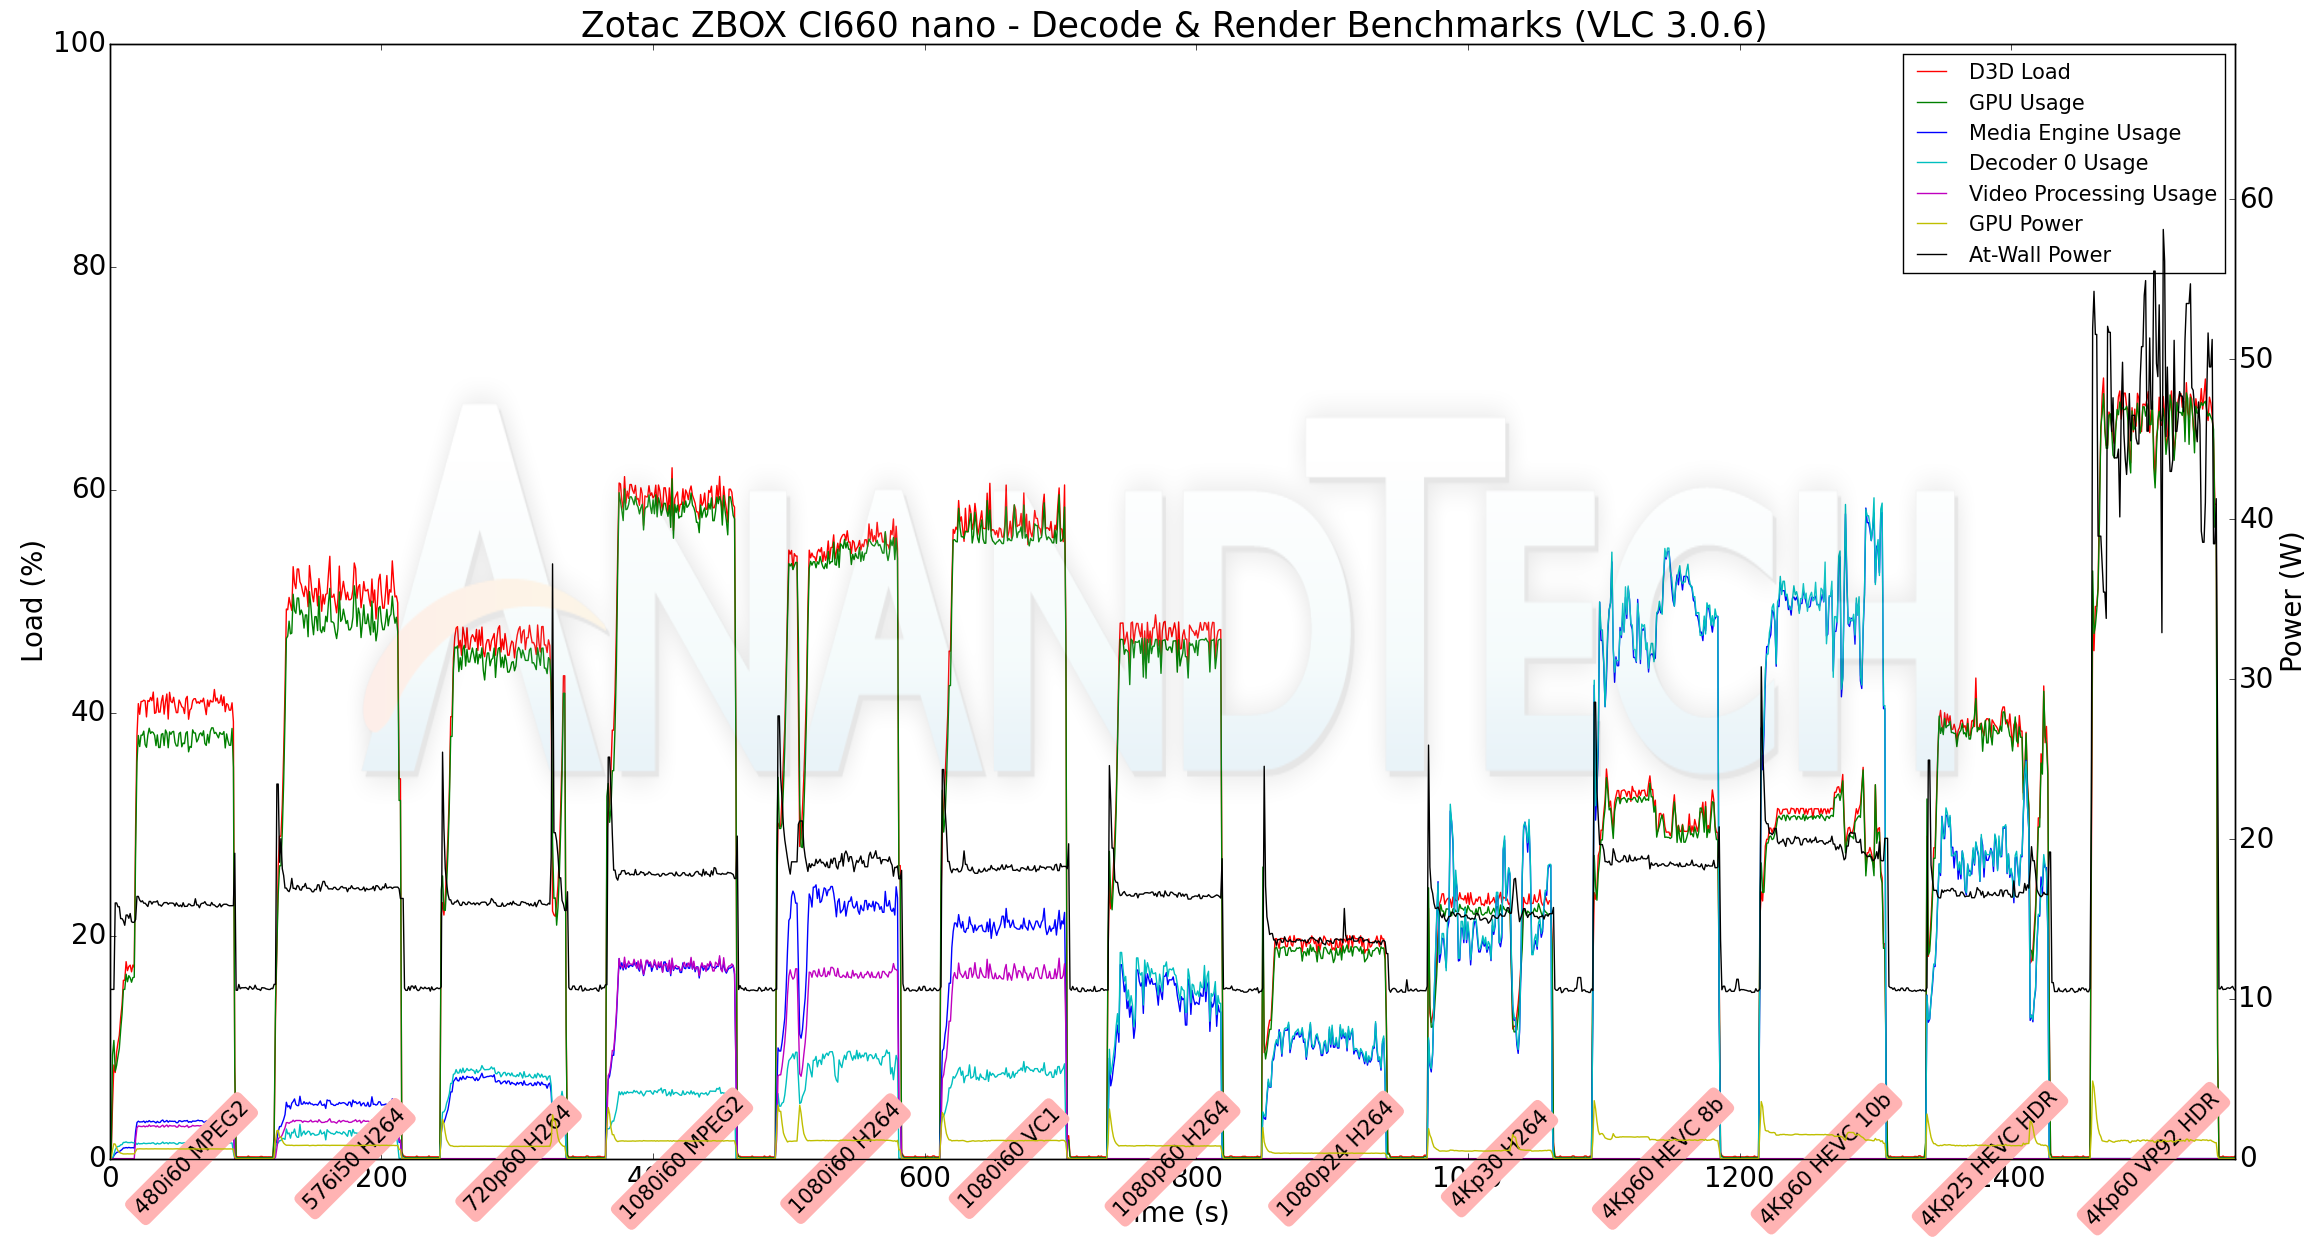
There is no hardware acceleration for playback of VP9 Profile 2 streams with VLC, but, Kodi has no issues. The average at-wall power consumption for hardware-accelerated playback is around 15-20W for VLC and 18-20W for Kodi. For software decoding of VP9 Profile 2 using VLC, the at-wall power consumption is around 45W. We do not see GPU D3D or media engine usage going above 80% for any of our test streams with either VLC or Kodi.
MPC-HC
MPC-HC offers an easy way to test out different combinations of decoders and renderers. The first configuration we evaluated is the default post-install scenario, with only the in-built LAV Video Decoder forced to DXVA2 Native mode. Two additional passes were done with different madVR configurations. In the first one (DXVA-focused), we configured madVR to make use of the DXVA-accelerated video processing capabilities as much as possible. In the second (Lanczos-focused), the image scaling algorithms were set to 'Lanczos 3-tap, with anti-ringing checked'. Chroma upscaling was configured to be 'BiCubic 75 with anti-ringing checked' in both cases. The metrics collected during the playback of the test files using the above three configurations are presented below.
| Video Playback Efficiency - MPC-HC with EVR-CP and madVR | |||
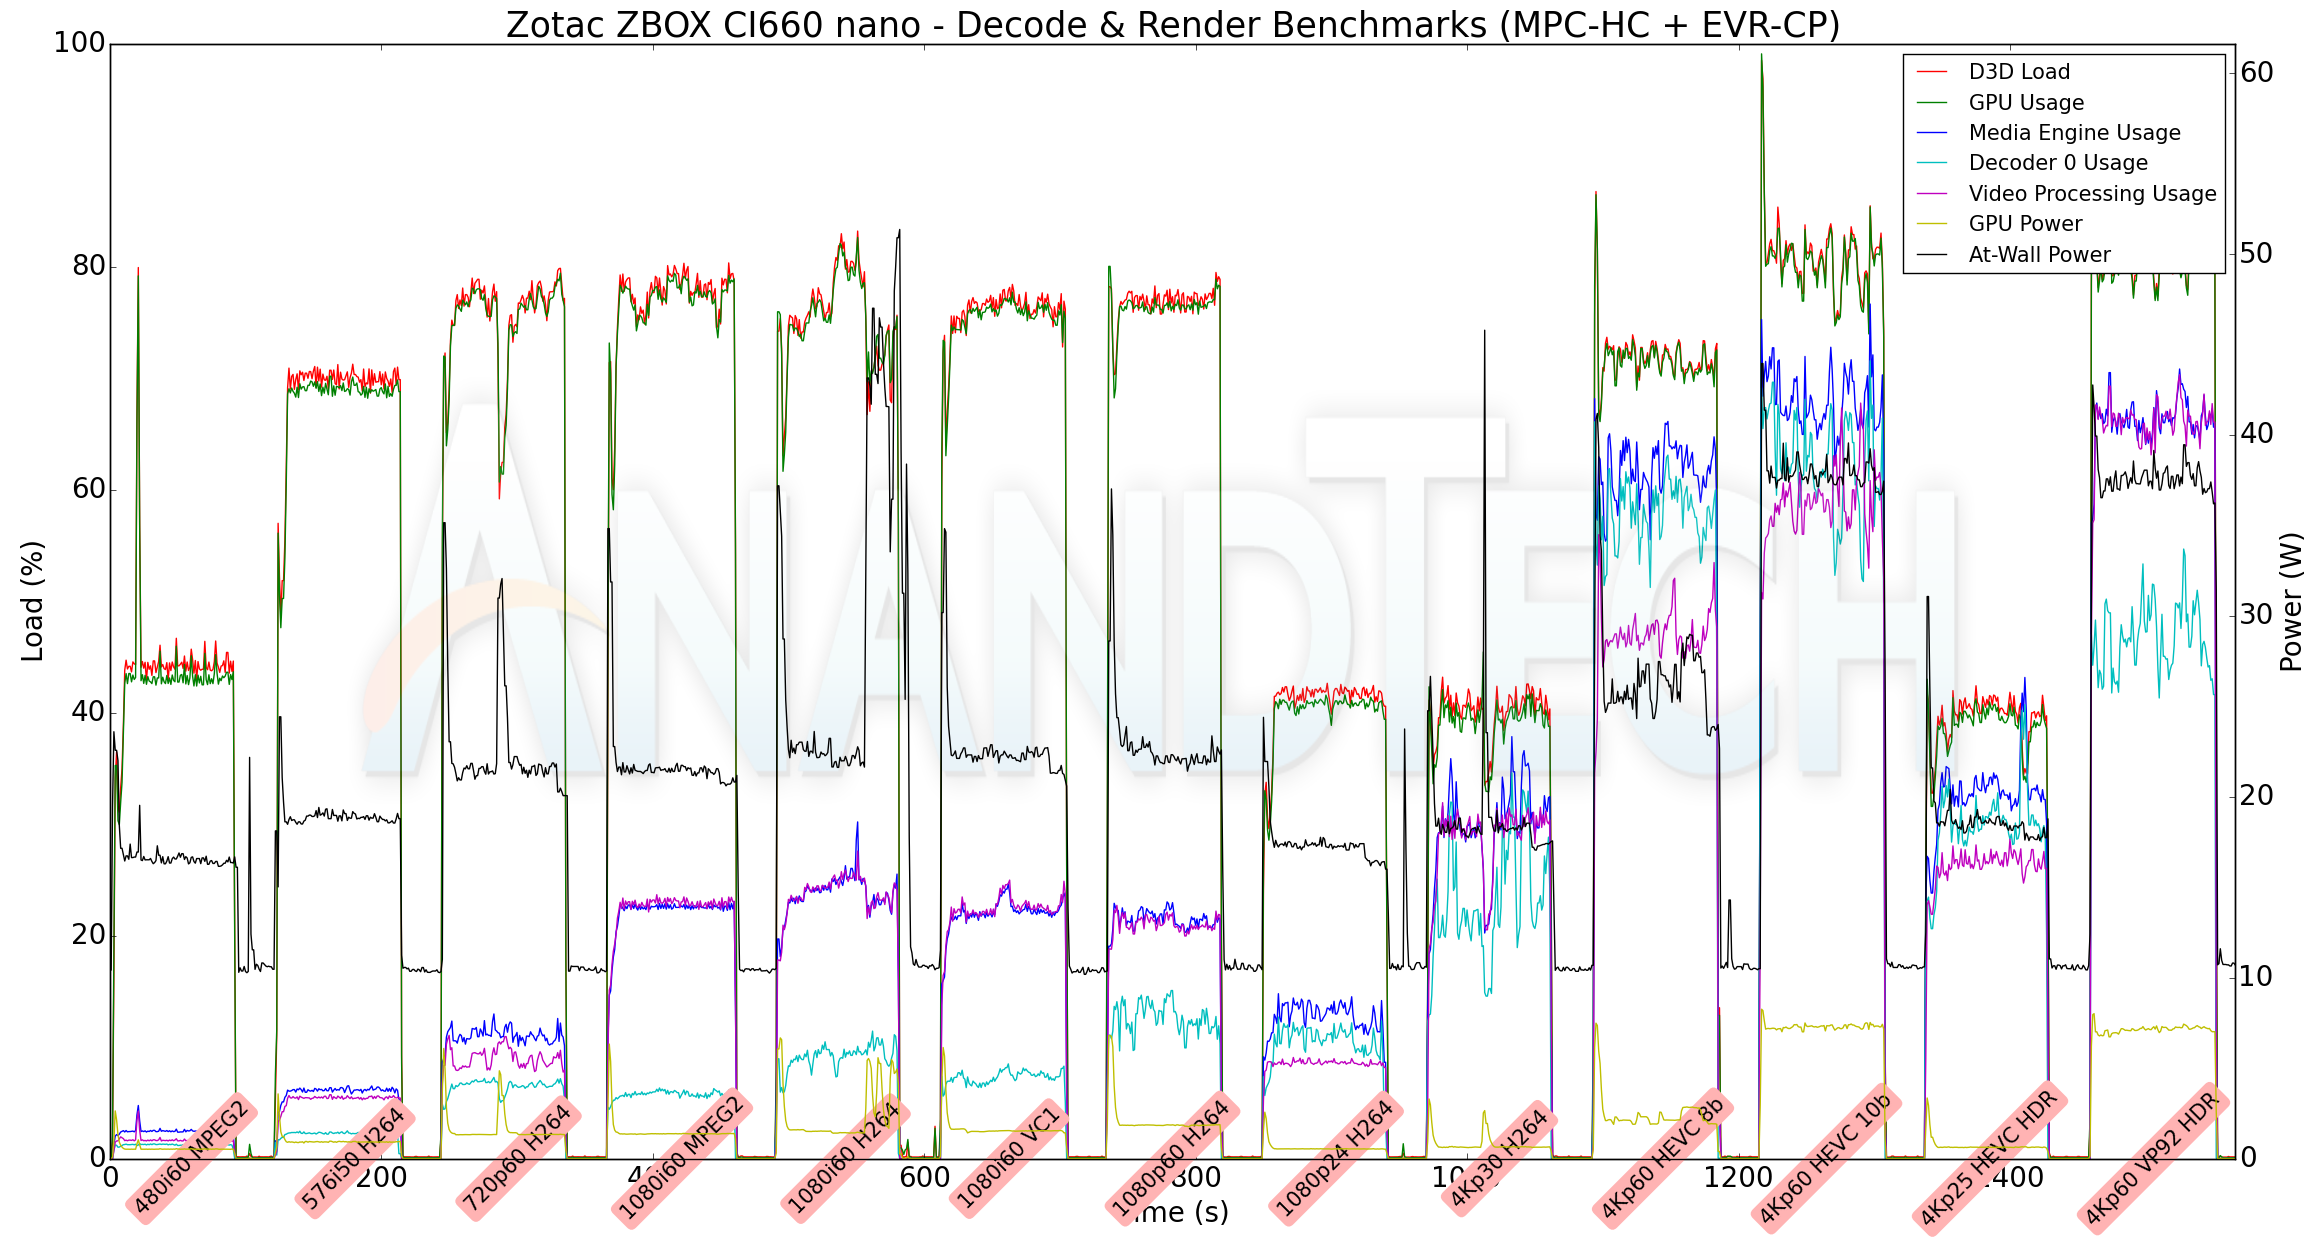
The default configuration (EVRCP + DXVA2 Native) appears to be the best bet for playback in the ZBOX CI660 nano. madVR configurations do not work for the playback of any 4K stream, as can be seen from the above graphs (the playback rate is less than half of the real-time requirement, even though the GPU load is not high). This is along expected lines, given the capabilities of the Intel UHD Graphics 620 GPU.
Miscellaneous Aspects
The power consumption at the wall was measured with a 4K display being driven through the HDMI port. In the graphs below, we compare the idle and load power of the Zotac ZBOX CI660 nano with other low power PCs evaluated before. For load power consumption, we ran the AIDA64 System Stability Test with various stress components, and noted the maximum sustained power consumption at the wall.
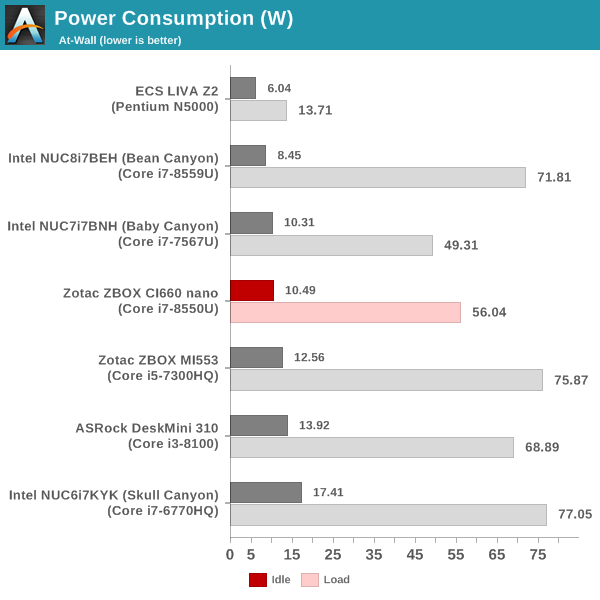
As we see further down, instantaneous peak power consumption at the wall can go as high as 80W. The above numbers (particularly, the idle power consumption) are a tad high, given the fanless nature of the system. Other than that observation, the numbers go hand-in-hand with the system's capabilities.
Our thermal stress routine starts with the system at idle, followed by four stages of different system loading profiles using the AIDA64 System Stability Test (each of 30 minutes duration). In the first stage, we stress the CPU, caches and RAM. In the second stage, we add the GPU to the above list. In the third stage, we stress the GPU standalone. In the final stage, we stress all the system components (including the disks). Beyond this, we leave the unit idle in order to determine how quickly the various temperatures in the system can come back to normal idling range. The various clocks, temperatures and power consumption numbers for the system during the above routine are presented in the graphs below.
| Zotac ZBOX CI660 nano System Loading with the AIDA64 System Stability Test | |||
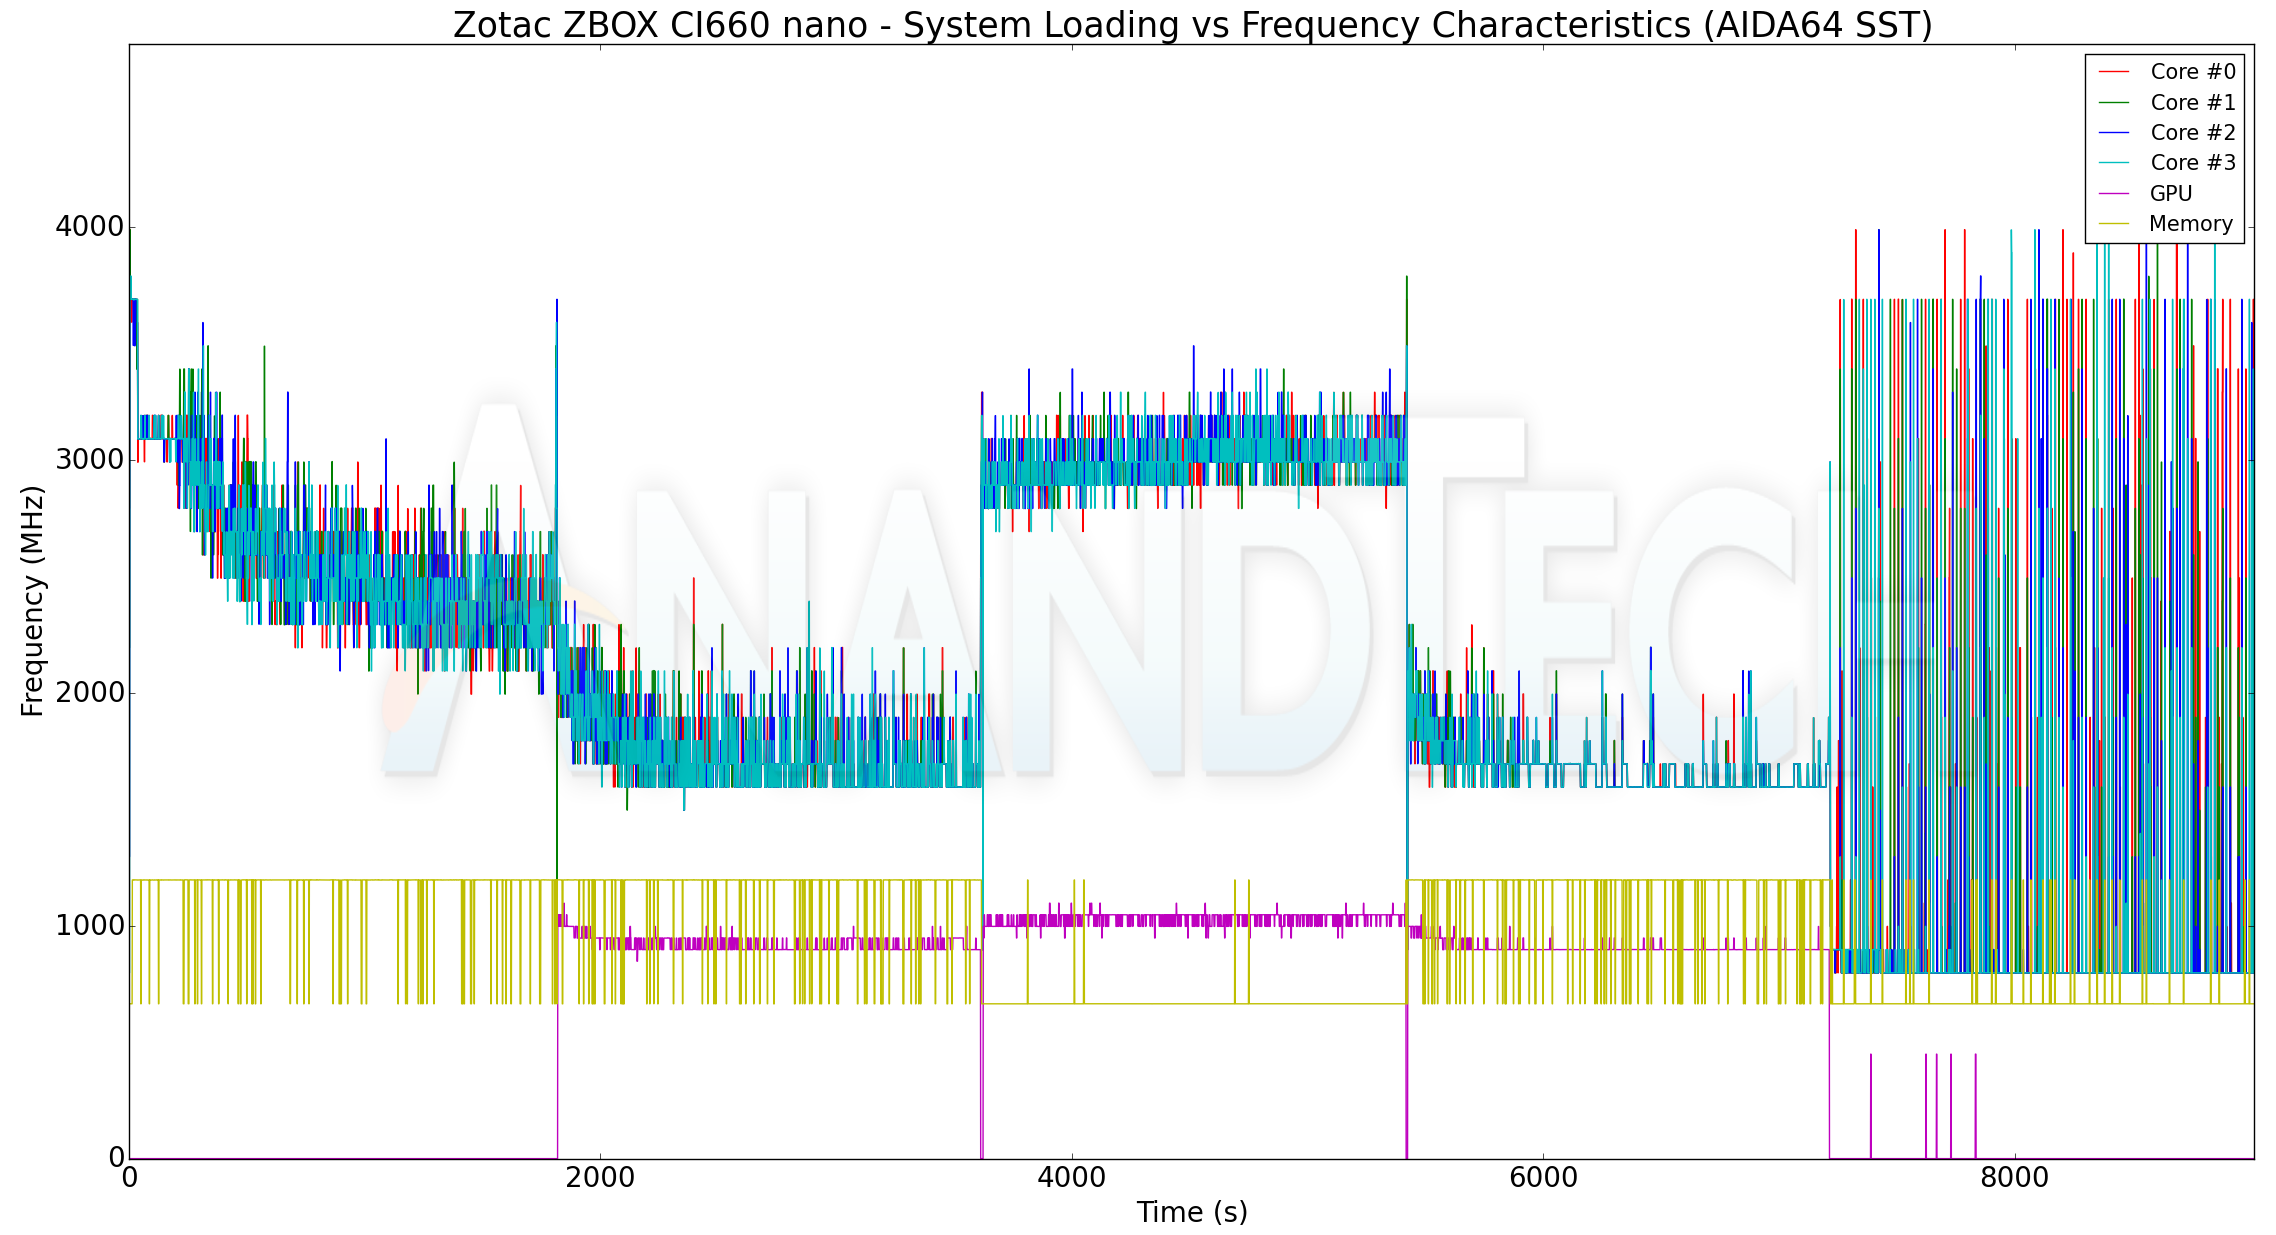
The Core i7-8550U has a base frequency of 1.8GHz, and can turbo up to 4 GHz. In the AIDA stress tests, we can see that processor maintains a minimum 1.8 GHz clock under all loading conditions. However, the same can't be said for our custom stress test which starts with Prime 95 for 30 minutes, followed by both Prime 95 and Furmark for 30 minutes, and ending with Furmark alone for another 30 minutes. Towards the middle of the second workload, we see the cores drop down to around 1.5 GHz in the graph below.
| Zotac ZBOX CI660 nano System Loading with Prime95 and Furmark | |||
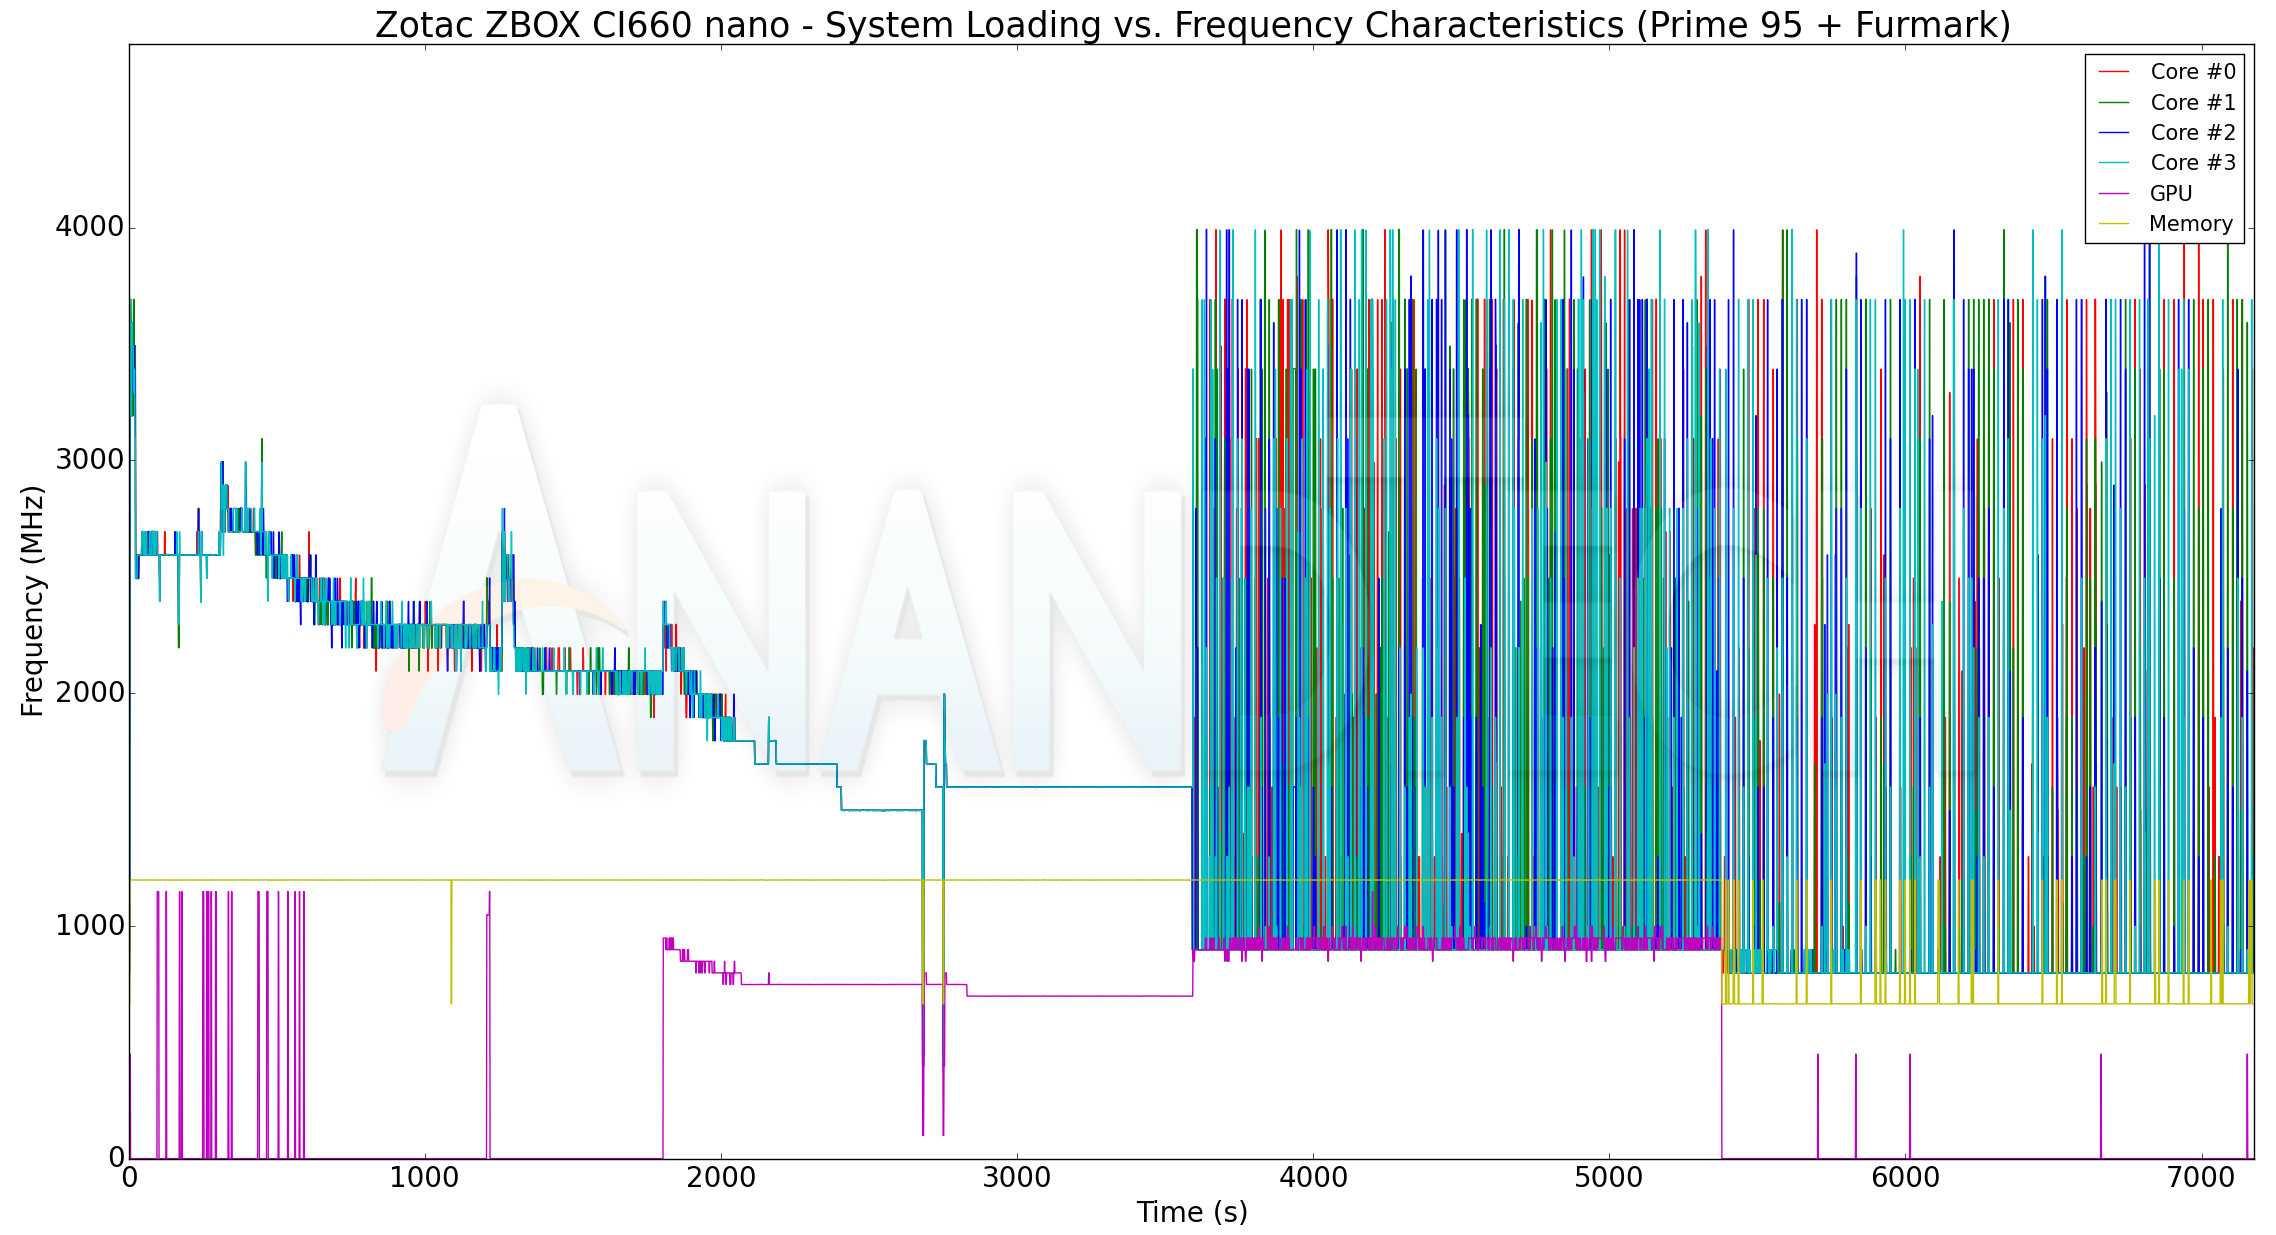
The temperatures are the second item of interest. According to official specifications, the junction temperature of the Core i7-8550U is 100C. However, Zotac seems to have taken the safer route of throttling the performance as soon as the cores hit 85C. What does this throttling entail? The power graphs for the two cases above provide the answer.
The ZBOX CI660 nano initially sets out with the CPU package power allowed to go up to 25W. As soon as the temperature limit (85C) is hit, the permitted package power starts to track down. We find that the thermal solution is good enough to allow the package to operate at 15W while maintaining the package temperature at 85C.
Closing Thoughts
The Zotac ZBOX CI660 nano proved to be an interesting system to review for a multitude of reasons. Zotac has traditionally presented affordable options to consumers in search of fanless PCs, and at roughly $700, the CI660 nano PLUS follows in those footsteps with a reasonable affordable price tag (in relative terms, obviously, when compared to other fanless PCs with similar performance potential).
However, it does have its share of issues: While the system contains no moving parts, a dull whine can be heard if you were to keep your ears close to the top of the system. In addition, occasional noises similar to the grating of fingernails over the fins of the heat sink could be heard. All said, though Zotac can claim that the system is fanless and passively-cooled, it is not an entirely noiseless system. The other issue is that of HDR support when using the HDMI display output port. Zotac claims that it works in their R&D labs, while we were unable to get it working properly with two different display sinks. Finally, the idle power consumption with the default BIOS configuration is a bit too high for our liking.
The three complaints aside, the ZBOX CI660 nano is actually an impressive system in terms of performance. The 4C/8T Core i7-8550U processor and 25W TDP configuration allow it to ace real-world benchmarks such as BAPCo's SYSmark 2018 and UL Futuremark's PCMark 10. The numbers are noteworthy, particularly when stacked against those obtained from actively-cooled systems with a similar form-factor.
Meanwhile high-speed I/O is also a high-point for the CI660, with Zotac giving the system a good amount of bandwidth to work with thanks to the availability of two USB 3.1 Gen 2 Type-C ports based on the new ASMedia ASM2142 bridge chip (we saw it deliver excellent performance in the Hades Canyon NUC). Dual gigabit Ethernet ports (based on Realtek controllers) open up some interesting applications, even though we believe Intel controllers would be more attractive in that particular segment. The new industrial design is also good, but, a little more metal in place of some of the plastic components wouldn't hurt.
As for buyers interested in taking the CI660 nano in to the tradiitonal SFF PC domain of the living room HTPC, the media playback credentials are more than good enough for the average HTPC user. The HDMI 2.0 / HDCP 2.2 port enables UHD Blu-ray playback after connecting a USB UHD Blu-ray drive to the system. Kodi and its add-ons have plenty of processing power at their disposal in the ZBOX CI660 nano.
At $700 for the PLUS configuration, the Zotac ZBOX CI660 nano is on the affordable side of the spectrum for fanless systems. The platform is promising, and the board area will allow Zotac to innovate further in the future. Thunderbolt 3 ports and a more powerful Wi-Fi solution for the flagship configuration are probably some of the low-hanging fruits in future iterations.


