Original Link: https://www.anandtech.com/show/13078/the-intel-ssd-660p-ssd-review-qlc-nand-arrives
The Intel SSD 660p SSD Review: QLC NAND Arrives For Consumer SSDs
by Billy Tallis on August 7, 2018 11:00 AM EST
When NAND flash memory was first used for general purpose storage in the earliest ancestors of modern SSDs, the memory cells were treated as simply binary, storing a single bit of data per cell by switching cells between one of two voltage states. Since then demand for higher capacity has pushed the industry to store more bits in each flash memory cell.
In the past year, the deployment of 64-layer 3D NAND flash has allowed almost all of the SSD industry to adopt three bit per cell TLC flash, which only a few short years ago was the cutting edge. Now, four bit per cell, also known as Quad-Level Cell (QLC) NAND flash, is the current frontier.
Each transition to storing more bits per memory cell comes with significant downsides that offset the appeal of higher storage density. The four bits per cell storage mode of QLC requires discriminating between 16 voltage levels in a flash memory cell. The process of reading and writing with adequate precision is unavoidably slower than accessing NAND flash that stores fewer bits per cell. The error rates are higher, so QLC-capable SSD controllers need very robust error correction capabilities. Data retention and write endurance are reduced.
But QLC NAND is entering a market where TLC NAND can provide more performance and endurance than most consumers really need. QLC NAND doesn't introduce any fundamentally new problems, it just is afflicted more severely with the challenges that have already been overcome by TLC NAND. The same strategies that are in widespread use to mitigate the downsides of TLC NAND are also usable for QLC NAND, but QLC will always be the cheaper lower-quality alternative to TLC NAND.
On the commercial product front, Micron introduced an enterprise SATA SSD with QLC NAND this spring, and everyone else is working on QLC NAND as well. But for consumers, where the pricing advantages of QLC are going to be the most noticed, it is Intel who the first to market with a consumer SSD that uses QLC NAND flash memory. Today the company is taking the wraps off of their new Intel SSD 660p, an entry-level M.2 NVMe SSD with up to 2TB of QLC NAND.
Intel has reportedly cut off further development of consumer SATA drives, so naturally their first consumer QLC SSD is a member of their 6-series, the lowest tier of NVMe SSDs. The 660p comes as a replacement for the Intel SSD 600p, Intel's first M.2 NVMe SSD and one of the first consumer NVMe drives that aimed to be cheaper and slower than the premium high-end NVMe SSDs, through the use of TLC NAND at a time when NVMe SSDs were still primarily using MLC NAND. The purpose of the Intel 660p is to push prices down even further while still providing better performance than SATA SSDs or the 600p.
| Intel SSD 660p Specifications | |||||
| Capacity | 512 GB | 1 TB | 2 TB | ||
| Controller | Silicon Motion SM2263 | ||||
| NAND Flash | Intel 64L 1024Gb 3D QLC | ||||
| Form-Factor, Interface | single-sided M.2-2280, PCIe 3.0 x4, NVMe 1.3 | ||||
| DRAM | 256 MB DDR3 | ||||
| Sequential Read | up to 1800 MB/s | ||||
| Sequential Write (SLC cache) | up to 1800 MB/s | ||||
| Random Read (4kB) | up to 220k IOPS | ||||
| Random Write (4kB, SLC cache) | up to 220k IOPS | ||||
| Warranty | 5 years | ||||
| Write Endurance | 100 TB 0.1 DWPD |
200 TB 0.1 DWPD |
400 TB 0.1 DWPD |
||
| SLC Write Cache | Minimum | 6 GB | 12 GB | 24 GB | |
| Maximum | 76 GB | 140 GB | 280 GB | ||
| MSRP | $99.99 (20¢/GB) | $199.99 (20¢/GB) | TBD | ||
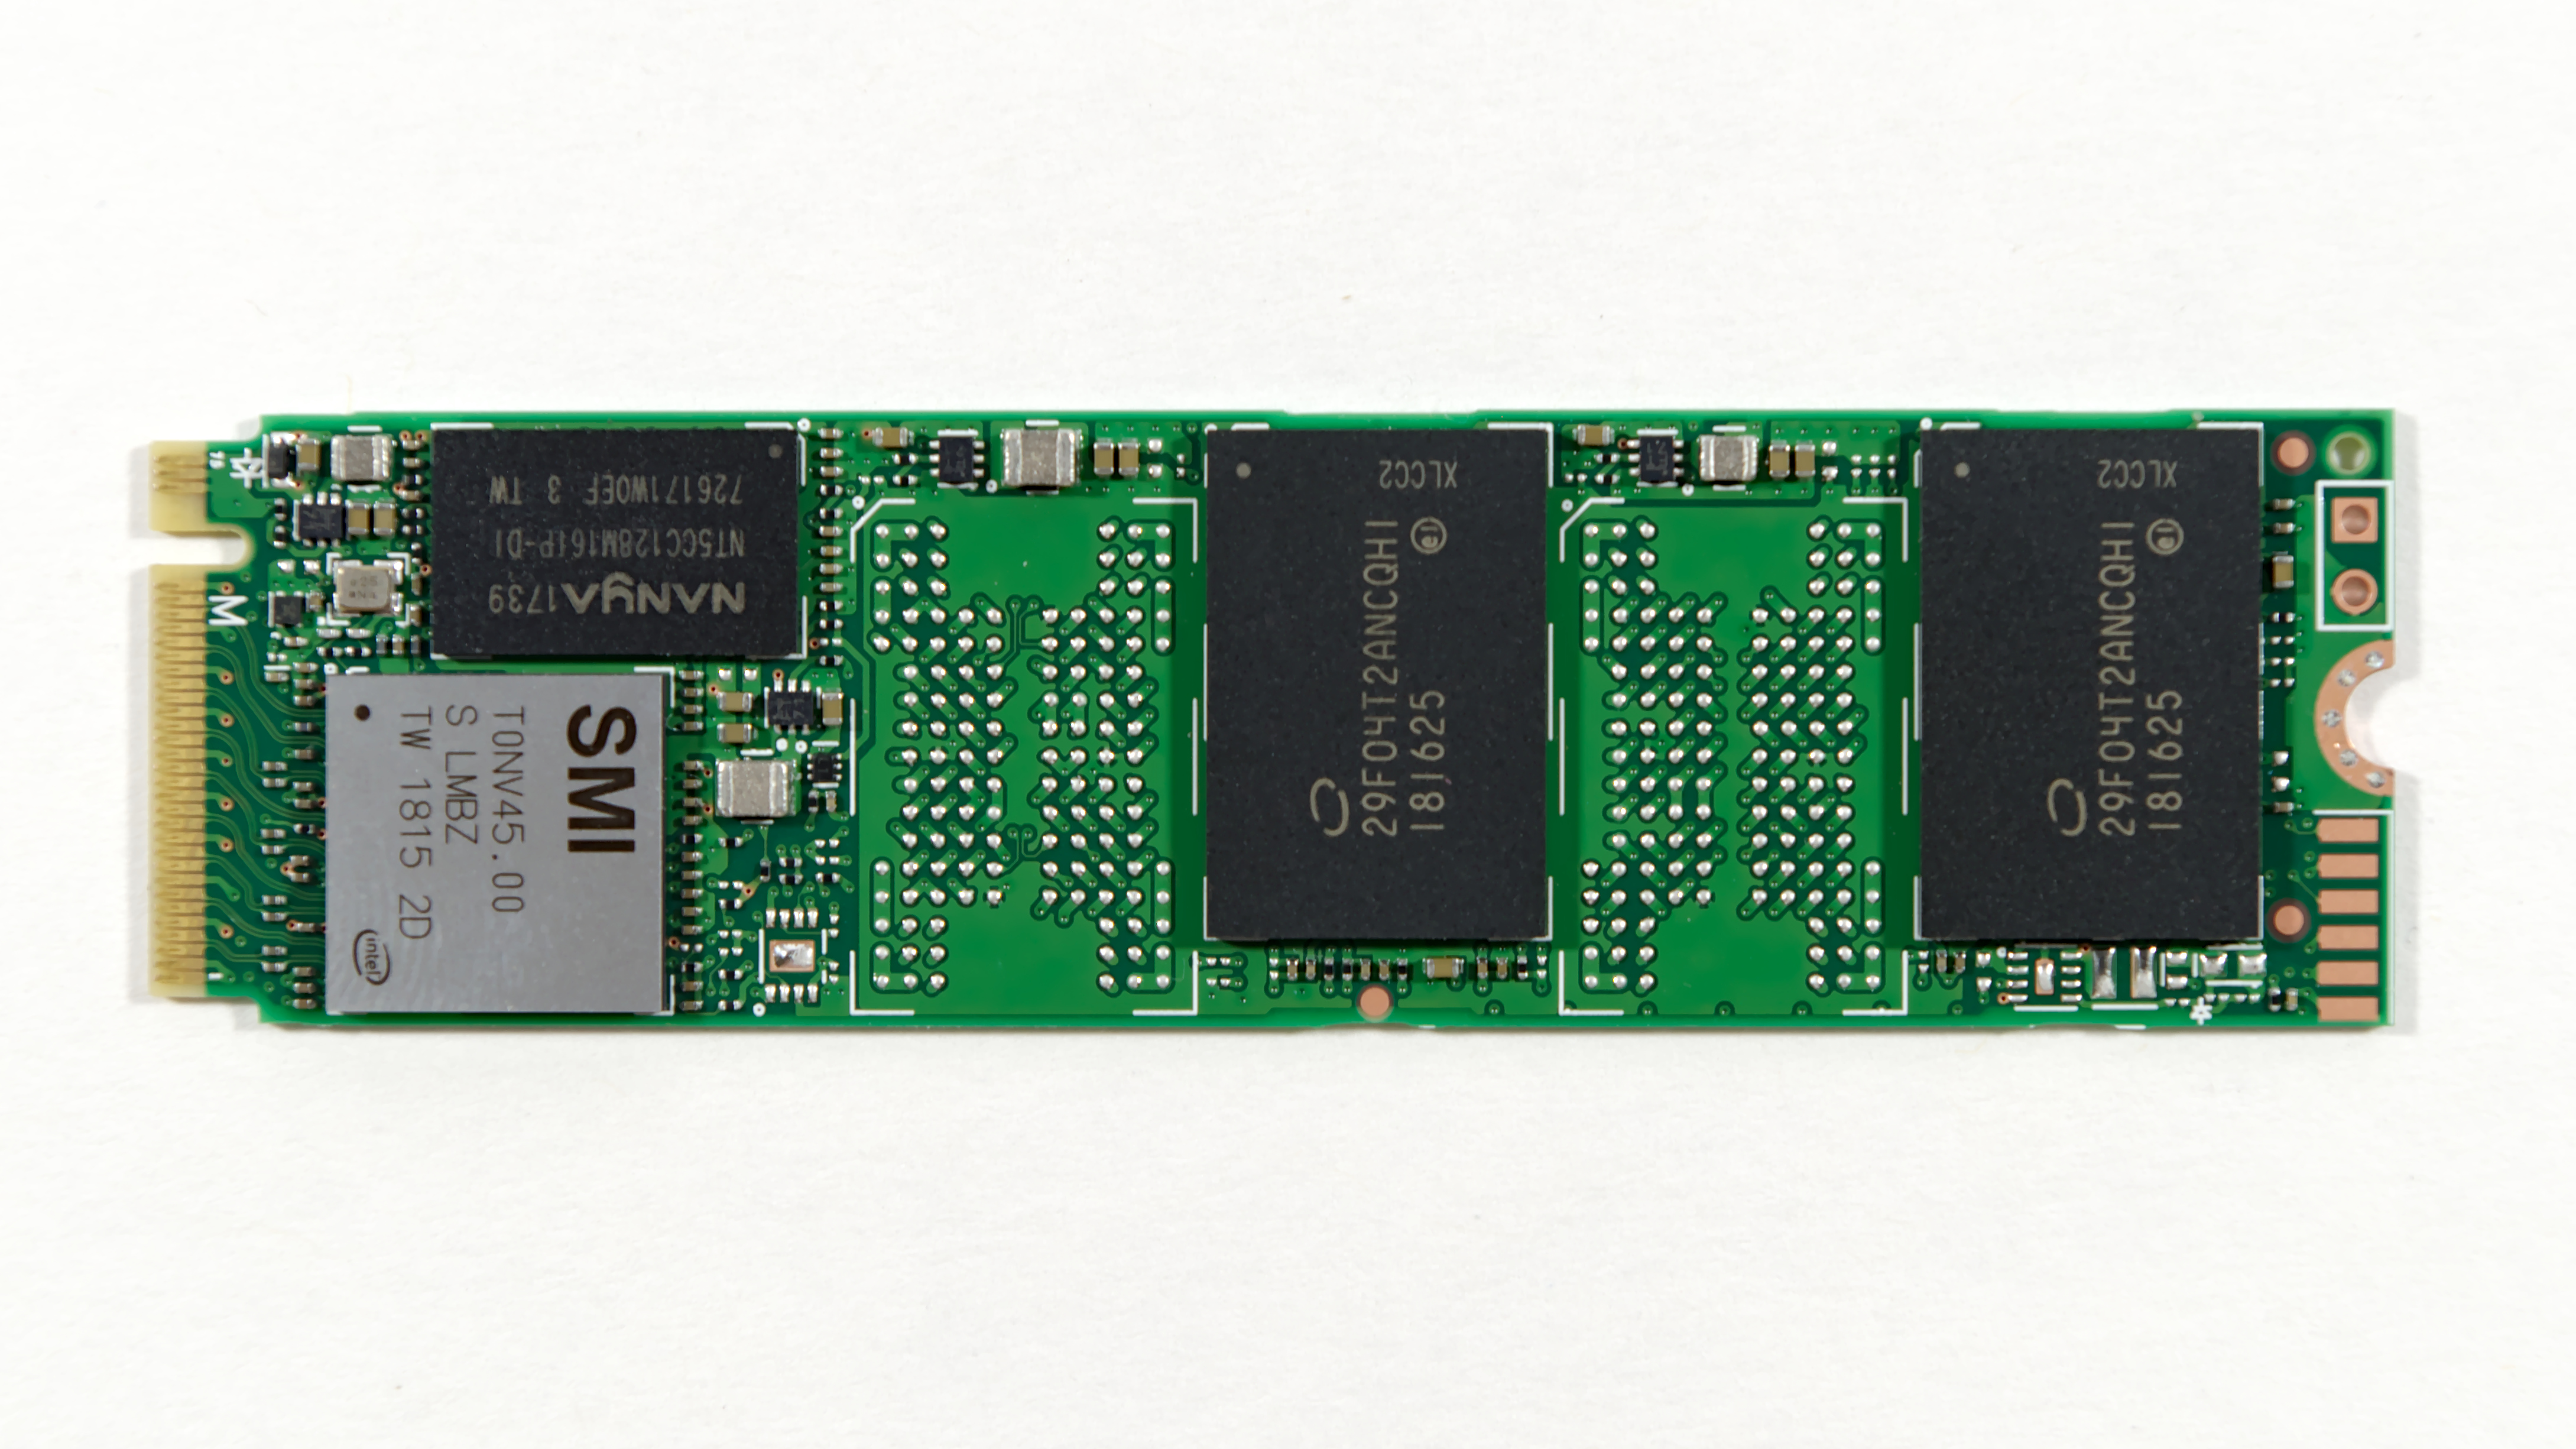
Looking under the hood, Intel's partnership with Silicon Motion for client and consumer SSDs continues with the use of the SM2263 NVMe SSD controller for the 660p. This is the smaller 4-channel sibling to the SM2262 and SM2262EN controllers that are doing very well in the more high-end parts of the SSD market. A 4-channel controller makes sense for a QLC drive, because the large 1Tb (128GB) per-die capacity of Intel's 64-layer 3D QLC NAND means it only takes a few chips to reach mainstream drive capacities.
The 660p lineup starts at 512GB (four QLC dies) and scales up to 2TB. All three capacities are single-sided M.2 2280 cards with a constant 256MB of DRAM. Mainstream SSDs typically use 1 GB of DRAM per 1TB of flash, so the 660p is rather short on DRAM even at the 512GB capacity. As a cost-oriented SSD it might make sense to use the DRAMless SM2263XT controller and the NVMe Host Memory Buffer feature, but that significantly complicates firmware development and error handling. The small size of the SM2263 controller allows Intel to fit all four NAND packages used by the 2TB model on one side of the PCB.
Intel doesn't break down performance specs for the 660p by drive capacity, and the read and write performance ratings are the same, thanks to the acceleration of SLC write caching. Intel doesn't provide any official spec for write performance after the SLC cache is filled, but we've measured about 100 MB/s on our 1TB sample. This steady-state sequential write speed will vary with drive capacity. Intel is offering a 5 year warranty on the drive and write endurance is about 0.1 drive writes per day, lower than the 0.3 DWPD typical of mainstream consumer SSDs, but something that should still adequate for most users.
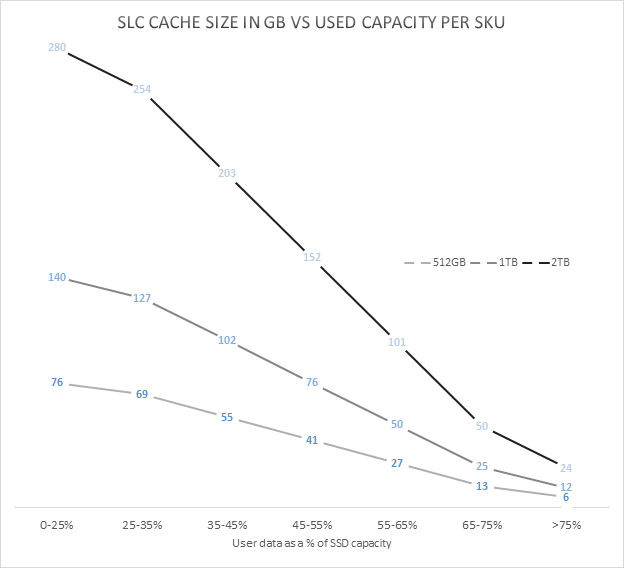
Probably the most important aspect of a consumer QLC drive design is the behavior of the SLC cache. Consumer TLC drives universally treat a portion of their NAND flash memory as pseudo-SLC, using that higher-performing memory segment as a write cache. QLC SSDs are even more reliant on SLC caching because the performance of raw QLC NAND is even lower than that of TLC.
No SLC caching strategy can perfectly accelerate every workload and use case, and there are significant tradeoffs between different strategies. The Intel SSD 660p employs a variable-size SLC cache, and all data written goes first to the SLC cache before being compacted and folded into QLC blocks. This means that the steady-state 100MB/s sequential write speed we've measured is significantly below what the drive could deliver if the writes went directly to the QLC without the extra SLC to QLC copying step getting in the way. When the drive is mostly empty, up to about half of the available flash memory cells will be treated as SLC NAND. As the drive fills up, blocks will be converted to QLC usage, shrinking the size of the cache and making it more likely that a real-world use case could write enough to fill that cache.
Our current test suite cannot fully capture the dynamics of a variable-size SLC cache, and we haven't had the 660p in hand long enough to thoroughly test it at various states of fill. When the Intel SSD 660p is mostly empty and the SLC cache size is huge, many of our standard benchmarks end up testing primarily the performance of the SLC cache — and for reads in addition to writes, because in these conditions the 660p isn't very aggressive about moving data from SLC blocks to QLC. As a result, our synthetic benchmark tests have been run both with our standard methodology, and with a completely full drive so that the tests measure performance of the QLC memory (with an SLC cache that is too small to entirely contain any of our tests). The two sets of scores thus represent the two extremes of performance that the Intel SSD 660p can deliver. The full-drive results in this review represent a worst-case scenario that will almost never be encountered by real-world usage, because our tests give the drive limited idle time to flush the SLC cache but in the real world consumer workloads almost always give SSDs far more idle time than they need.
Intel's initial pricing for the 660p works out to just under 20¢/GB, putting it very close to the street prices of the cheapest current-generation TLC-based SSDs. The Intel SSD 660p goes on sale today, and is being showcased by Intel at Flash Memory Summit this week. In traveling to FMS, I left behind a testbed full of drives running extra benchmarks for this review. When I can catch a break from all the news and activities at FMS, I will be adding to this review.


The Competition
The Intel SSD 660p is positioned as a very cheap entry-level NVMe SSD, so our primary focus is on comparing it against other low-end NVMe drives and against SATA drives. As usual, the Crucial MX500 serves as our representative of mainstream SATA SSDs thanks to its consistently good pricing and solid all-around performance. The other low-end NVMe SSDs in this review are the 660p's predecessor Intel SSD 600p, the Phison E8-based Kingston A1000 and and the Toshiba RC100 DRAMless NVMe SSD that uses the Host Memory Buffer feature.
| AnandTech 2018 Consumer SSD Testbed | |
| CPU | Intel Xeon E3 1240 v5 |
| Motherboard | ASRock Fatal1ty E3V5 Performance Gaming/OC |
| Chipset | Intel C232 |
| Memory | 4x 8GB G.SKILL Ripjaws DDR4-2400 CL15 |
| Graphics | AMD Radeon HD 5450, 1920x1200@60Hz |
| Software | Windows 10 x64, version 1709 |
| Linux kernel version 4.14, fio version 3.6 | |
| Spectre/Meltdown microcode and OS patches current as of May 2018 | |
- Thanks to Intel for the Xeon E3 1240 v5 CPU
- Thanks to ASRock for the E3V5 Performance Gaming/OC
- Thanks to G.SKILL for the Ripjaws DDR4-2400 RAM
- Thanks to Corsair for the RM750 power supply, Carbide 200R case, and Hydro H60 CPU cooler
- Thanks to Quarch for the XLC Programmable Power Module and accessories
- Thanks to StarTech for providing a RK2236BKF 22U rack cabinet.
AnandTech Storage Bench - The Destroyer
The Destroyer is an extremely long test replicating the access patterns of very IO-intensive desktop usage. A detailed breakdown can be found in this article. Like real-world usage, the drives do get the occasional break that allows for some background garbage collection and flushing caches, but those idle times are limited to 25ms so that it doesn't take all week to run the test. These AnandTech Storage Bench (ATSB) tests do not involve running the actual applications that generated the workloads, so the scores are relatively insensitive to changes in CPU performance and RAM from our new testbed, but the jump to a newer version of Windows and the newer storage drivers can have an impact.
We quantify performance on this test by reporting the drive's average data throughput, the average latency of the I/O operations, and the total energy used by the drive over the course of the test.
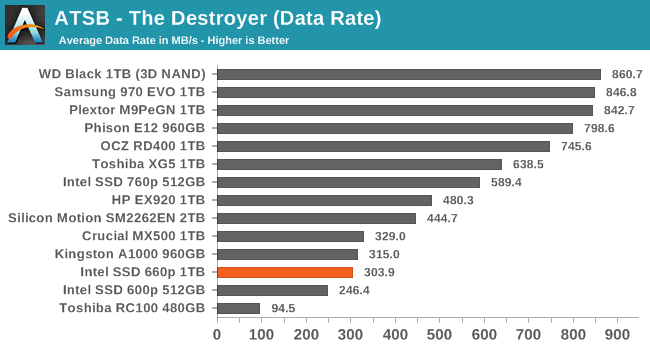
The Intel SSD 660p manages an average data rate on The Destroyer that is only slightly slower than the Crucial MX500 mainstream SATA SSD and the Kingston A1000 entry-level NVMe SSD. It's a step up from the performance of the 512GB Intel SSD 600p, and more than three times faster than the DRAMless Toshiba RC100.
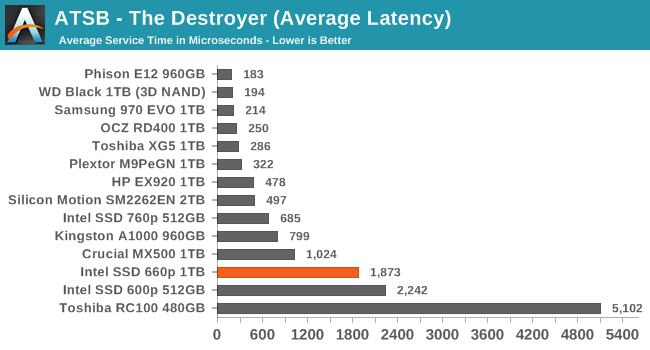
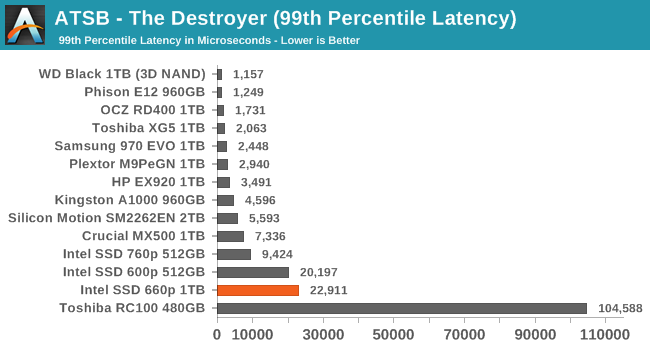
The average and 99th percentile latency scores for the Intel SSD 660p are quite poor by NVMe standards and significantly worse than the Crucial MX500, but the latency isn't completely out of control like it is for the Toshiba RC100.
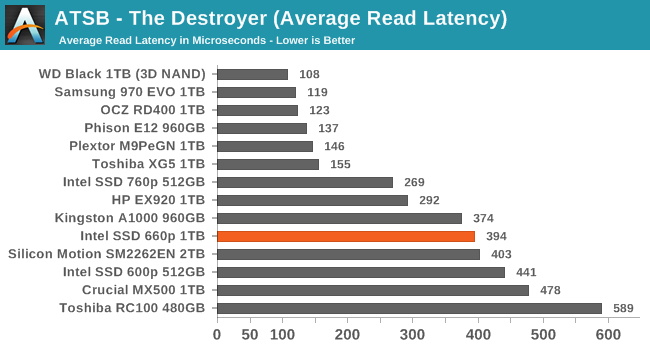
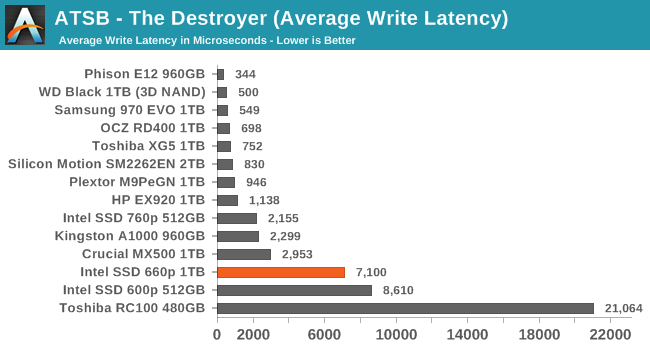
The average read latency from the 660p during The Destroyer is comparable to other low-end NVMe SSDs and better than the 600p or Crucial MX500. The average write latency is more than twice that of the MX500 but lower than the 600p and RC100.
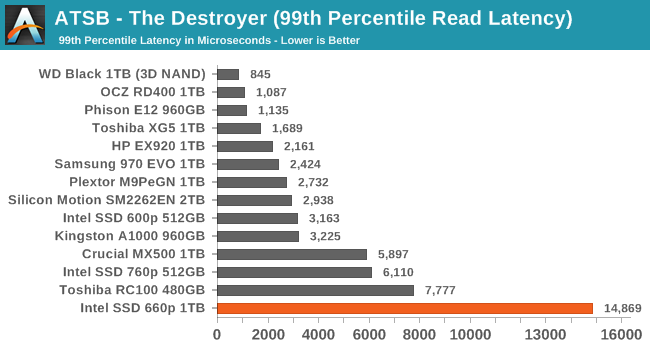
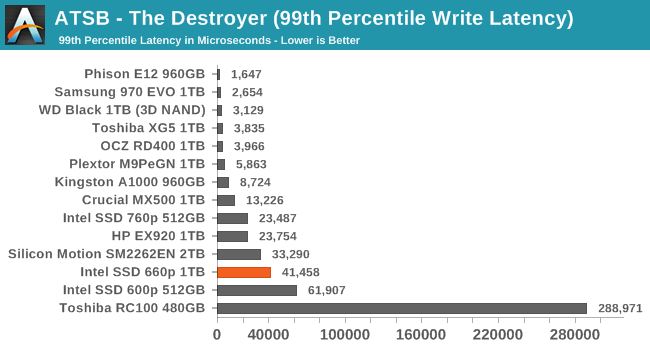
The 99th percentile read latency from the Intel SSD 660p on The Destroyer is significantly worse than any other NVMe SSD or the Crucial MX500 SATA SSD, but the 99th percentile write latency is an improvement over the 600p and does not show the extreme outliers that the Toshiba RC100 suffers from.
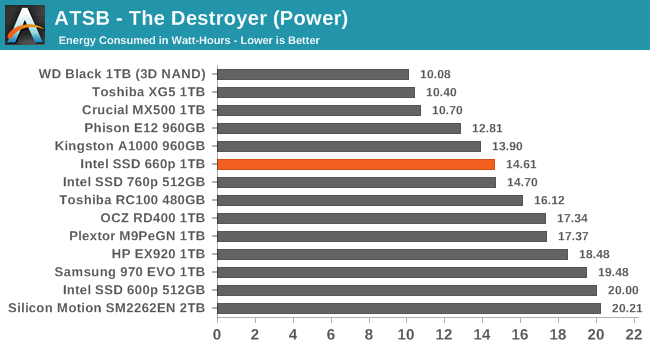
The energy usage of the 660p during The Destroyer is a bit better than average for NVMe SSDs, though still quite a bit higher than is typical for SATA SSDs. The 660p is less power hungry than most NVMe drives and slower, but not enough to drag out the test for so long that the power advantage disappears.
AnandTech Storage Bench - Heavy
Our Heavy storage benchmark is proportionally more write-heavy than The Destroyer, but much shorter overall. The total writes in the Heavy test aren't enough to fill the drive, so performance never drops down to steady state. This test is far more representative of a power user's day to day usage, and is heavily influenced by the drive's peak performance. The Heavy workload test details can be found here. This test is run twice, once on a freshly erased drive and once after filling the drive with sequential writes.
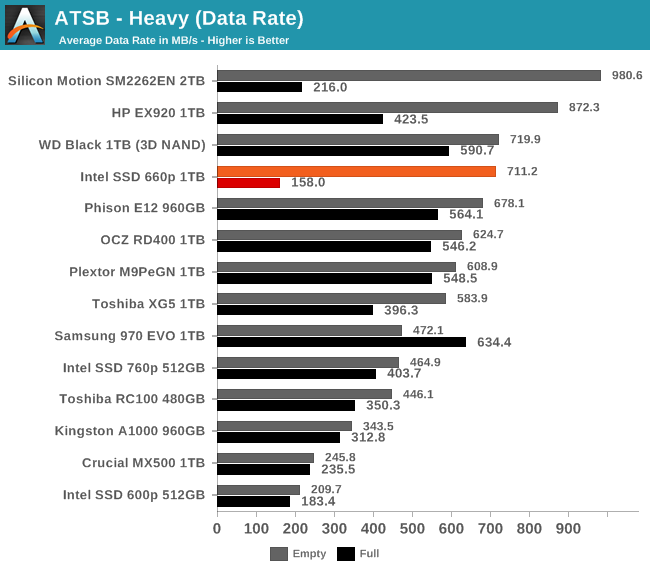
When the Heavy test is run on an empty Intel SSD 660p, the test is able to operate almost entirely within the large SLC cache and the average data rate is competitive with many high-end NVMe SSDs. When the drive is full and the SLC cache is small, the low performance of the QLC NAND shows through with an average data rate that is slower than the 600p or Crucial MX500, but still far faster than a mechanical hard drive.
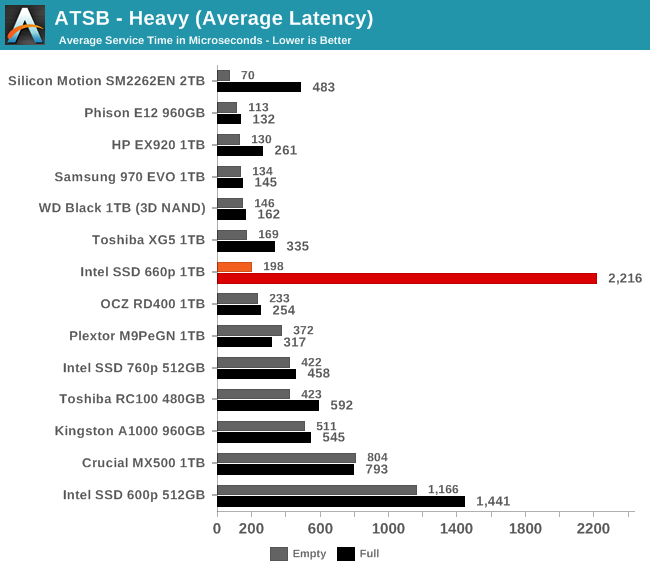
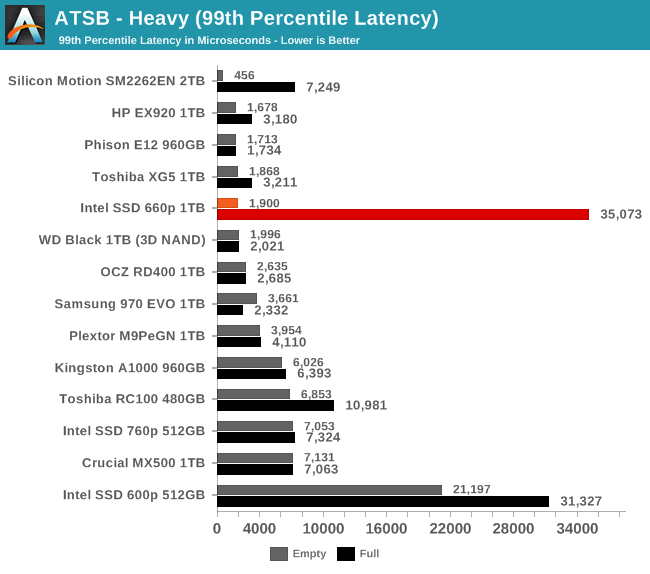
The average and 99th percentile latency scores of the 660p on the empty-drive test run are clearly high-end; the use of a four-channel controller doesn't seem to be holding back the performance of the SLC cache. The full-drive latency scores are an order of magnitude higher and worse than other SSDs of comparable capacity, but not worse than some of the slowest low-capacity TLC drives we've tested.
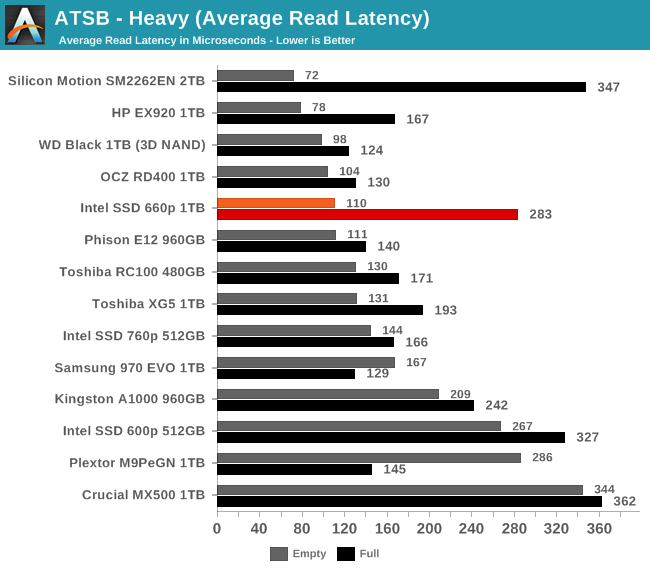
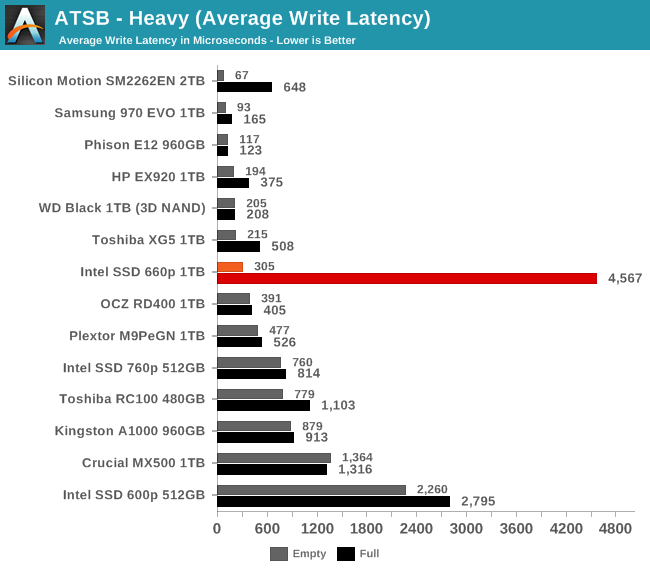
The average read latency of the Intel 660p on the Heavy test is about 2.5x higher for the full-drive test run than when the test is run on a freshly-erased drive. Neither score is unprecedented for a NVMe drive, and it's not quite the largest disparity we've seen between full and empty performance. The average write latency is where the 660p suffers most from being full, with latency that's about 60% higher than the already-slow 600p.
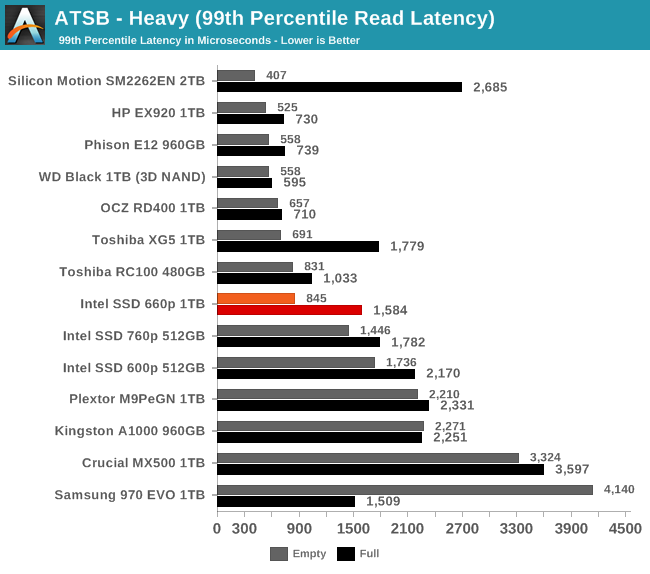
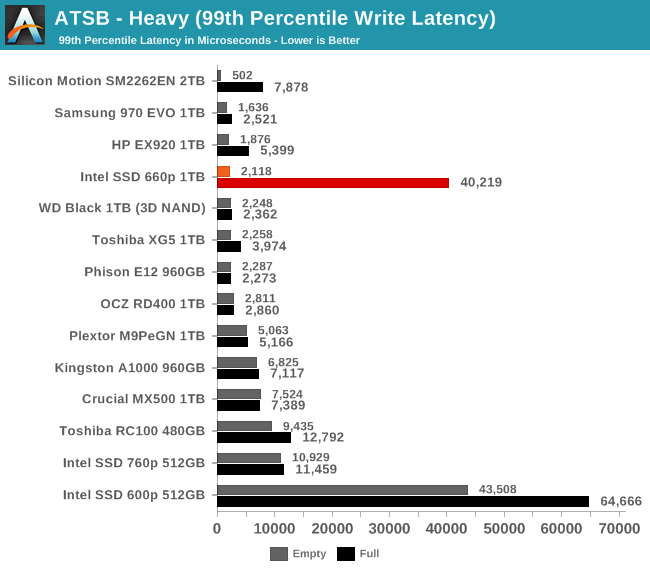
The 99th percentile read latency scores from the 660p are fine for a low-end NVMe drive, and close to high-end for the empty-drive test run that is mostly using the SLC cache. The 99th percentile write latency is similarly great when using the SLC cache, but almost 20 times worse when the drive is full. This is pretty bad in comparison to other current-generation NVMe drives or mainstream SATA drives, but is actually slightly better than the Intel 600p's best case for 99th percentile write latency.
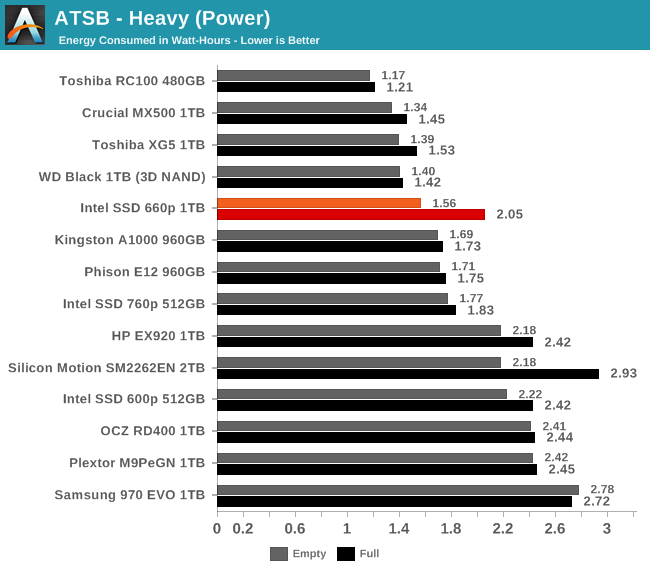
The Intel SSD 660p shows above average power efficiency on the Heavy test, by NVMe standards. Even the full-drive test run energy usage is lower than several high-end drives.
AnandTech Storage Bench - Light
Our Light storage test has relatively more sequential accesses and lower queue depths than The Destroyer or the Heavy test, and it's by far the shortest test overall. It's based largely on applications that aren't highly dependent on storage performance, so this is a test more of application launch times and file load times. This test can be seen as the sum of all the little delays in daily usage, but with the idle times trimmed to 25ms it takes less than half an hour to run. Details of the Light test can be found here. As with the ATSB Heavy test, this test is run with the drive both freshly erased and empty, and after filling the drive with sequential writes.
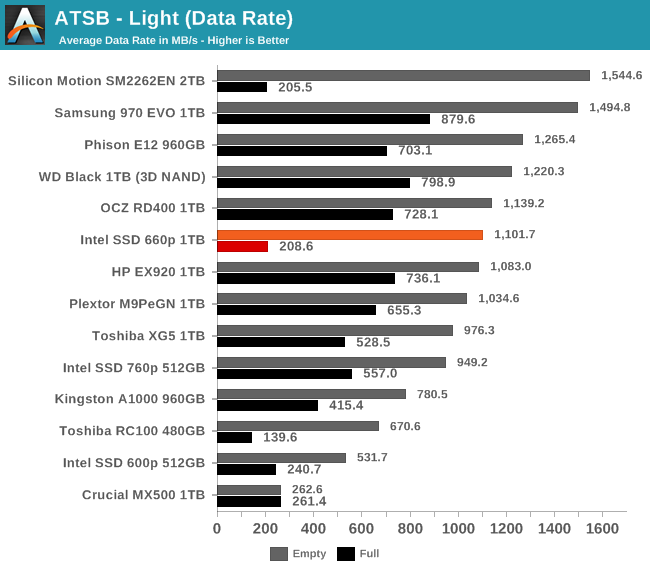
As with the Heavy test, the SLC cache of the Intel SSD 660p is extremely beneficial and brings the average data rate of the 660p up into high-end NVMe territory. When the drive is full and the SLC cache has been reduced to its minimum size, performance suffers and drops below the Crucial MX500 mainstream SATA drive but not all the way down to the level of the Toshiba RC100 DRAMless NVMe SSD.
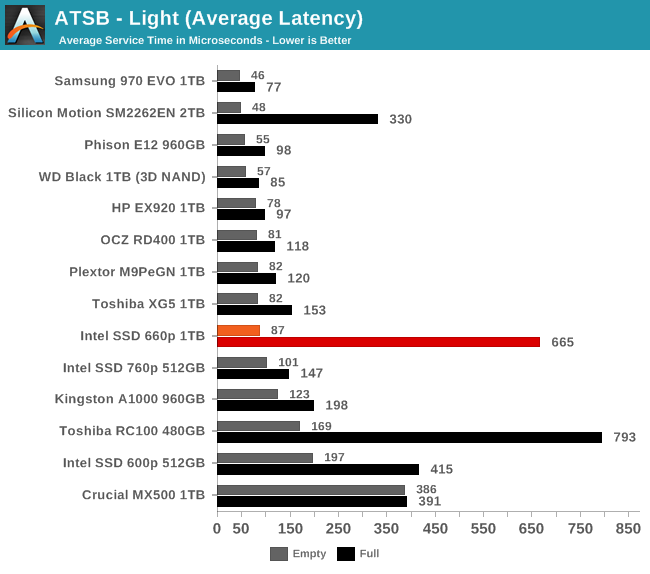
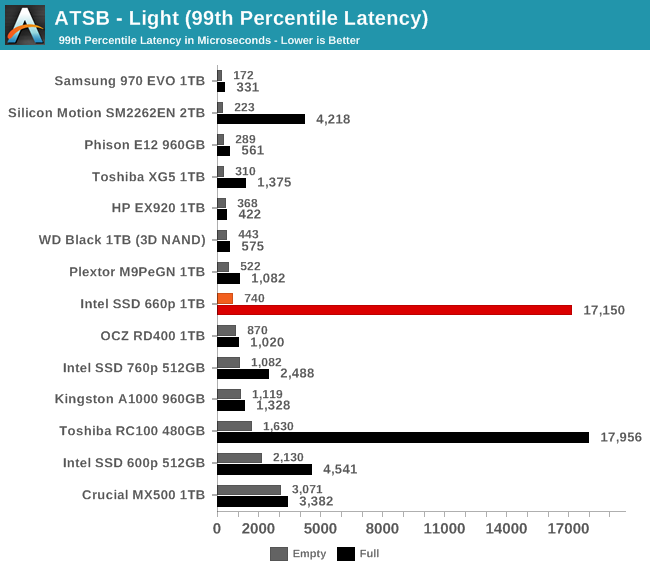
The best-case latency scores from a freshly-erased 660p are acceptable for a high-end NVMe SSD and excellent for an entry-level drive. In the worst case of a full drive, the average latency is far higher but still low enough that the drive won't actually feel much slower. The 99th percentile latency climbs very high by SSD standards, but is still barely up into the average latency range of hard drives.
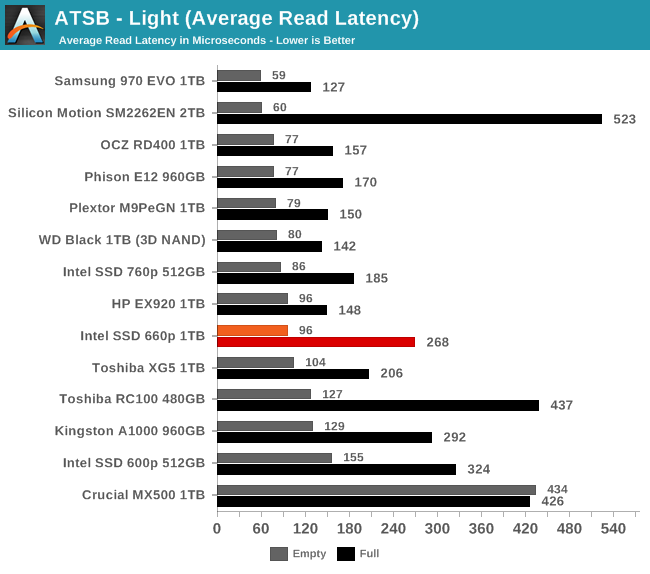
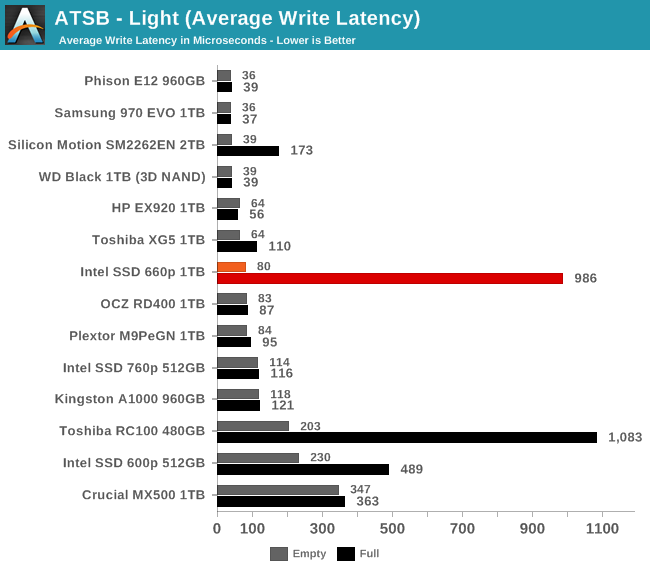
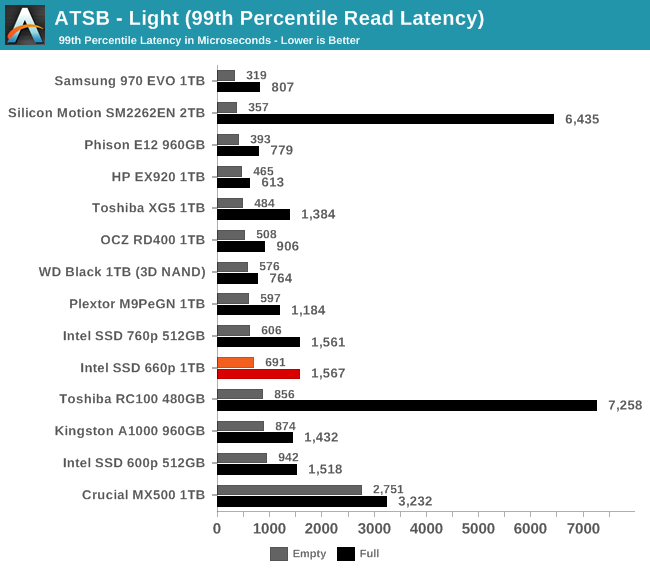
On the Light test, the average read latency of the 660p stays comfortably below that of SATA drives even for the worst-case full drive test run, and only the average write latency shows a serious problem from filling up the whole drive and not giving it enough time to empty the now-reduced SLC cache.
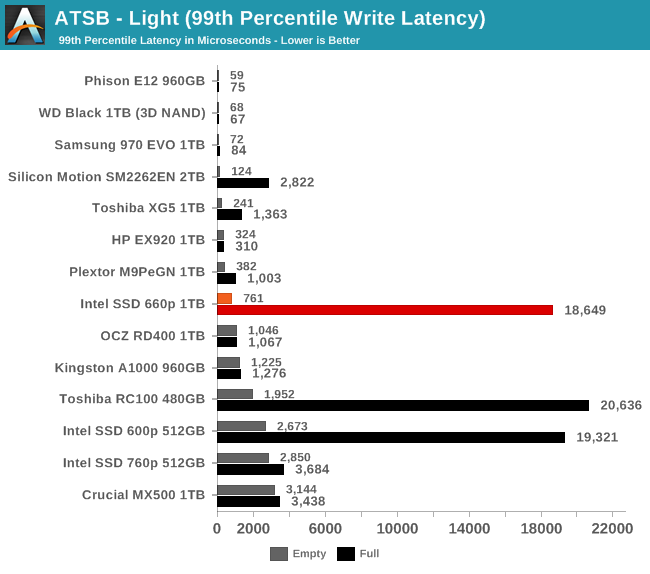
The full-drive 99th percentile write latency of the 660p on the Light test is almost as bad as the 600p or the Toshiba RC100. Otherwise, the 660p doesn't have any worrying QoS problems on this test and users won't notice serious pauses from the drive.
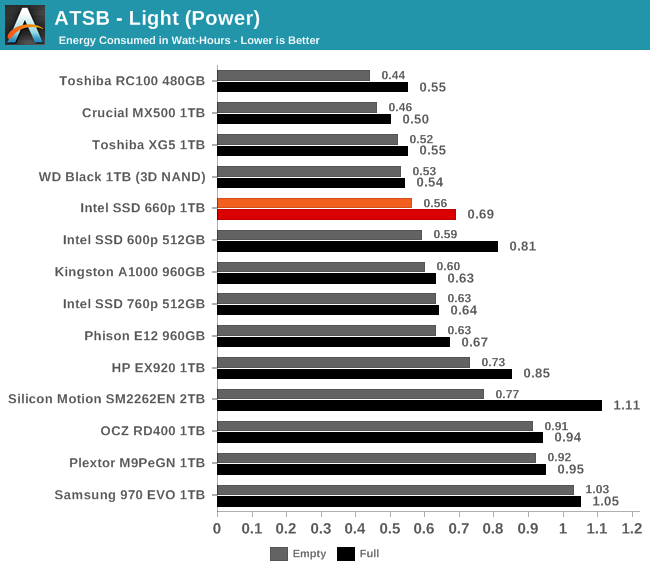
The energy usage of the 660p on the Light test is below most other NVMe drives when the test is run on an empty drive, and even with the extra background work and longer test duration of the full-drive test run the 660p is only a little less efficient than the average for this bunch of NVMe SSDs.
Random Read Performance
Our first test of random read performance uses very short bursts of operations issued one at a time with no queuing. The drives are given enough idle time between bursts to yield an overall duty cycle of 20%, so thermal throttling is impossible. Each burst consists of a total of 32MB of 4kB random reads, from a 16GB span of the disk. The total data read is 1GB.
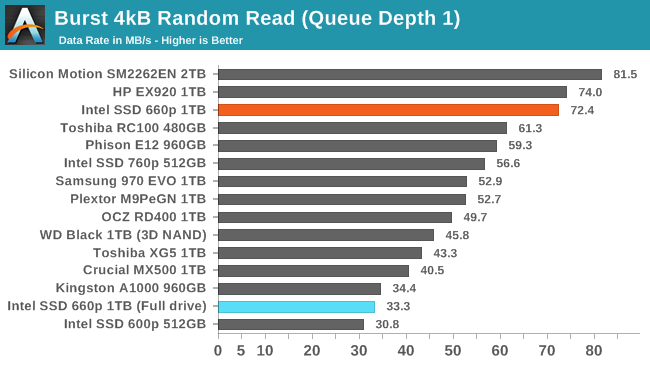
The Intel SSD 660p delivers excellent random read performance from its SLC cache, coming in behind only the drives using Silicon Motion's higher-end controllers with Intel/Micron TLC. When reading data from a full drive where background processing is probably still ocurring, the performance is halved but remains slightly ahead of the Intel 600p.
Our sustained random read performance is similar to the random read test from our 2015 test suite: queue depths from 1 to 32 are tested, and the average performance and power efficiency across QD1, QD2 and QD4 are reported as the primary scores. Each queue depth is tested for one minute or 32GB of data transferred, whichever is shorter. After each queue depth is tested, the drive is given up to one minute to cool off so that the higher queue depths are unlikely to be affected by accumulated heat build-up. The individual read operations are again 4kB, and cover a 64GB span of the drive.
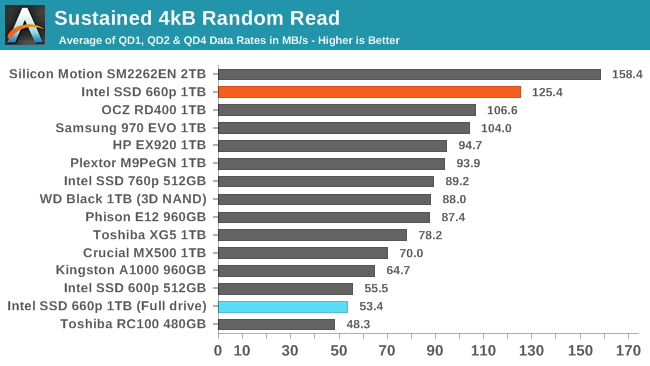
On the longer random read test, the 660p maintains its outstanding SLC cache performance that beats anything else currently on the market, but filling the drive it is slower than almost any other NVMe SSD - the exception being the Toshiba RC100 that doesn't use a large enough host memory buffer for the data range this test covers.
 |
|||||||||
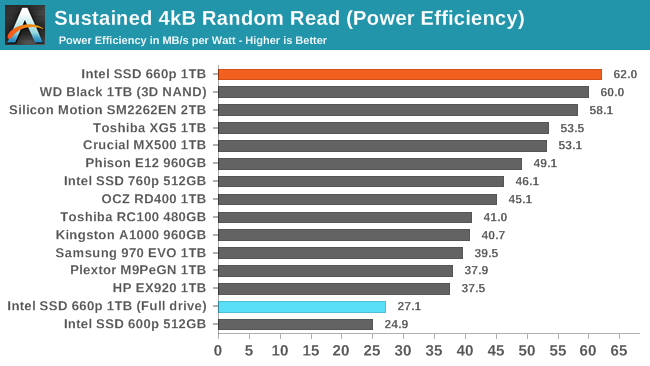
| Power Efficiency in MB/s/W | Average Power in W | ||||||||
With the combination of lower power consumption afforded by its small NVMe controller and excellent random read performance, the Intel 660p earns the top efficiency score for this test. When it's slowed down by being full and still grinding away at background cleanup, its efficiency is much worse but still an improvement over the 600p.
 |
|||||||||
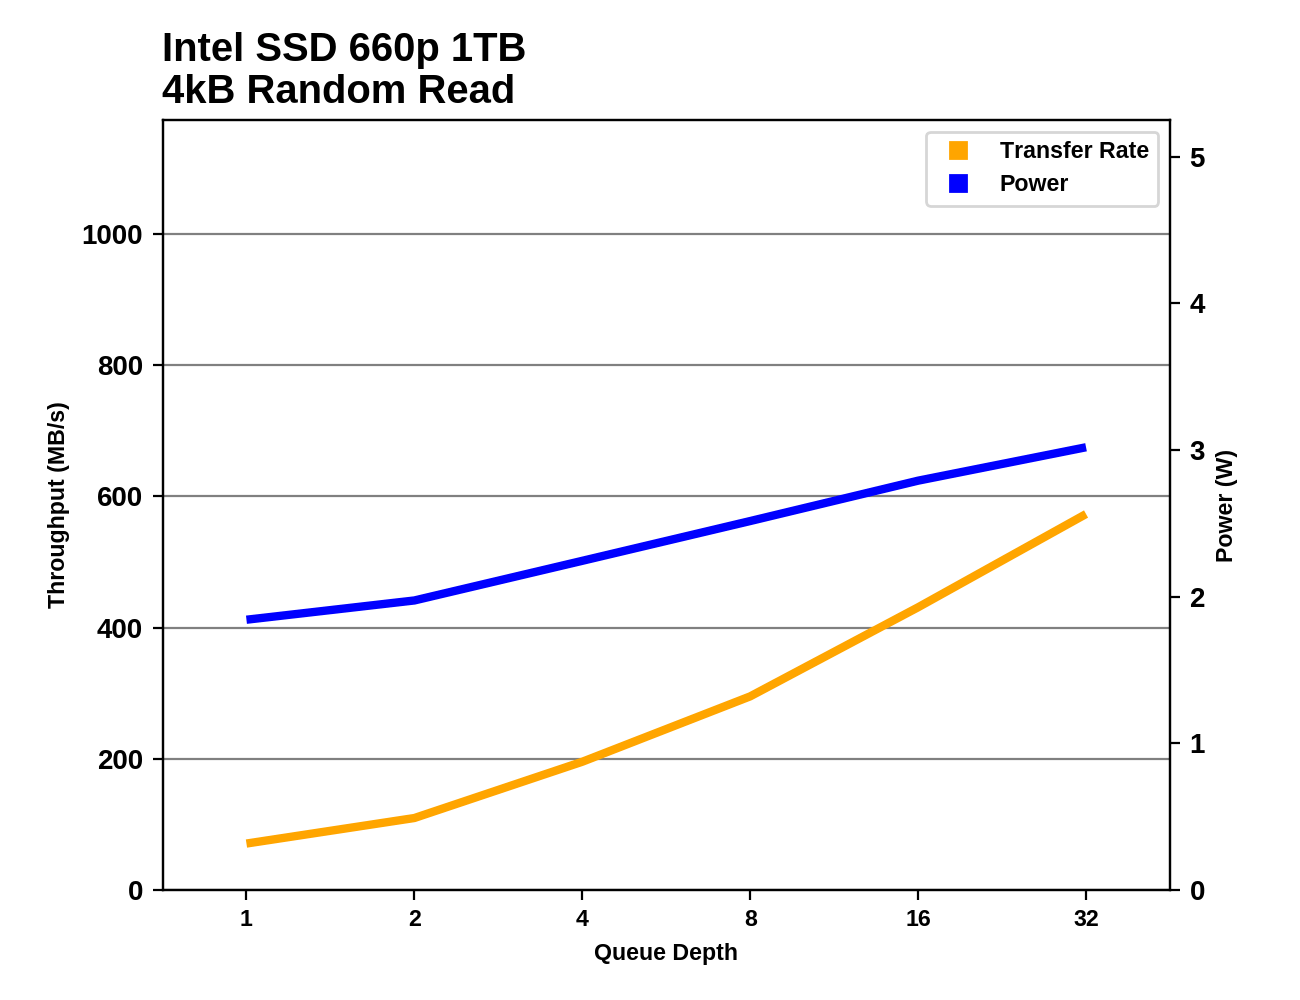
At high queue depths the 660p's random read speed begins to fall behind high-end NVMe SSDs, but it isn't significant until well beyond the queue depths that are relevant to real-world client/consumer usage patterns.
Random Write Performance
Our test of random write burst performance is structured similarly to the random read burst test, but each burst is only 4MB and the total test length is 128MB. The 4kB random write operations are distributed over a 16GB span of the drive, and the operations are issued one at a time with no queuing.
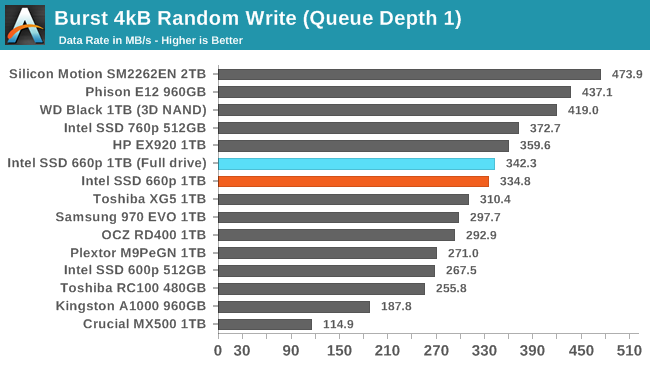
The burst random write speed of the Intel SSD 660p is not record-setting, but it is comparable to high-end NVMe SSDs.
As with the sustained random read test, our sustained 4kB random write test runs for up to one minute or 32GB per queue depth, covering a 64GB span of the drive and giving the drive up to 1 minute of idle time between queue depths to allow for write caches to be flushed and for the drive to cool down.
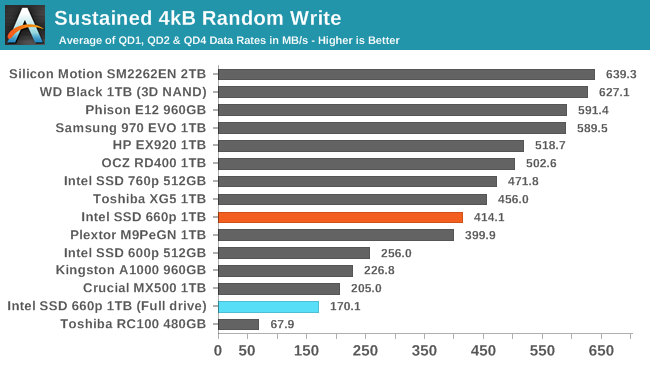
On the longer random write test, the 660p is slower than most high-end NVMe SSDs but still performs much better than the other entry-level NVMe drives or the SATA drive. After filling the drive (and consequently the SLC write cache), the performance drops below the SATA drive but is still more than twice as fast as the Toshiba RC100.
 |
|||||||||
| Power Efficiency in MB/s/W | Average Power in W | ||||||||
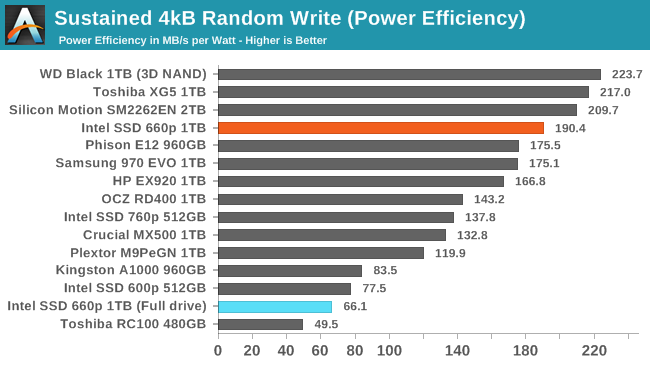
Power efficiency when performing random writes to a clean SLC cache is not quite the best we've measured, but it is far ahead of what the other low-end NVMe SSD drives or the Crucial MX500 SATA drive can manage
 |
|||||||||
After QD4 the 660p starts to show signs of filling the SLC write cache, which is a little bit sooner than expected given how large the SLC cache should be for the mostly-empty drive condition. The performance doesn't drop very far, showing that the idle time is enough for the drive to mostly keep up with flushing the SLC cache when the test is writing to the drive with a 50% duty cycle.
Sequential Read Performance
Our first test of sequential read performance uses short bursts of 128MB, issued as 128kB operations with no queuing. The test averages performance across eight bursts for a total of 1GB of data transferred from a drive containing 16GB of data. Between each burst the drive is given enough idle time to keep the overall duty cycle at 20%.
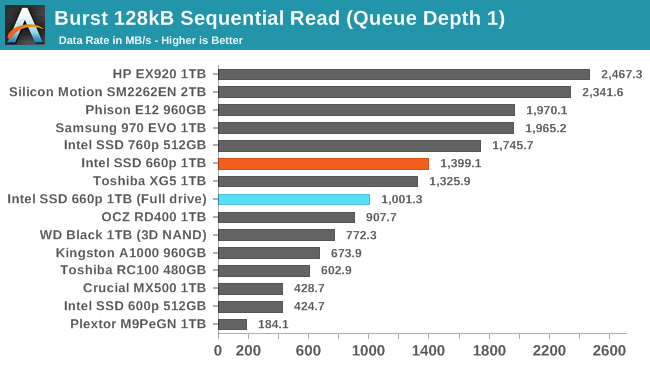
The burst sequential read performance of the Intel SSD 660p is lower than several of the fastest high-end drives, but is still pretty quick given the 4-channel controller used by the 660p. The read speed is only moderately impaired after filling the drive all the way.
Our test of sustained sequential reads uses queue depths from 1 to 32, with the performance and power scores computed as the average of QD1, QD2 and QD4. Each queue depth is tested for up to one minute or 32GB transferred, from a drive containing 64GB of data. This test is run twice: once with the drive prepared by sequentially writing the test data, and again after the random write test has mixed things up, causing fragmentation inside the SSD that isn't visible to the OS. These two scores represent the two extremes of how the drive would perform under real-world usage, where wear leveling and modifications to some existing data will create some internal fragmentation that degrades performance, but usually not to the extent shown here.
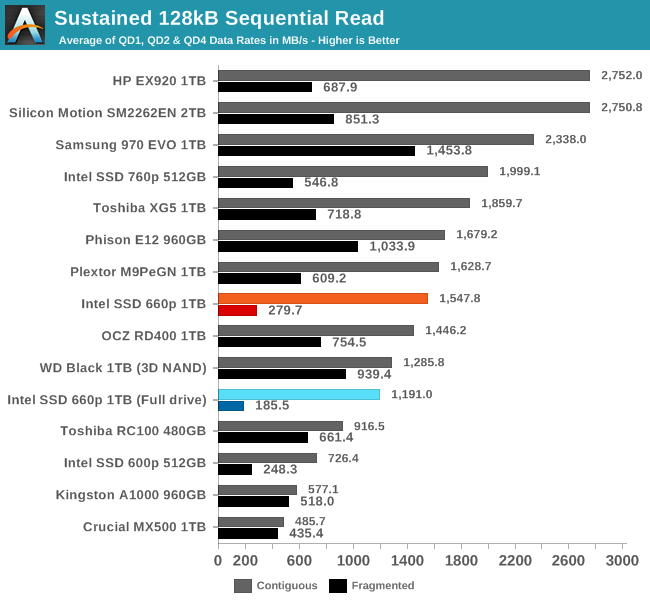
On the longer sequential read test that goes beyond QD1, the true high-end NVMe drives pull away from the 660p but it is still faster than most other low-end NVMe SSDs. Internal fragmentation is more of a problem for the 660p than the TLC drives, but this is not too surprising—the QLC NAND is likely using larger page and block sizes that add to the overhead of gathering data that has been dispersed by wear leveling during random writes.
 |
|||||||||
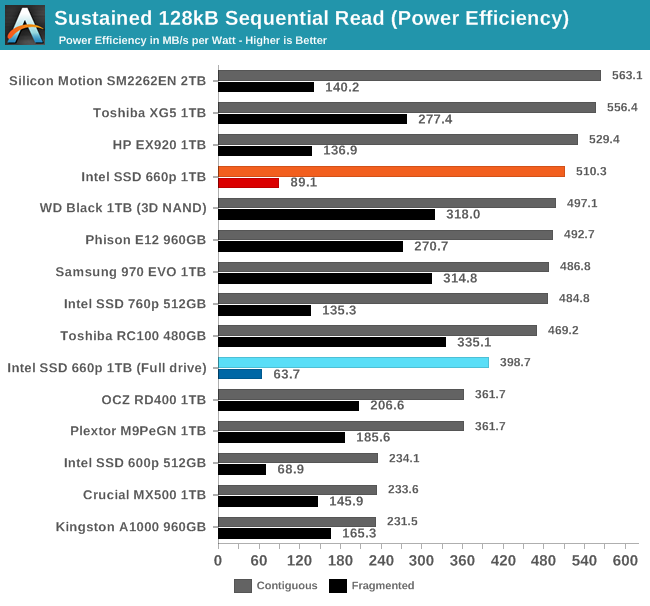
| Power Efficiency in MB/s/W | Average Power in W | ||||||||
The power efficiency of sequential reads from the 660p is competitive with many of the best TLC SSDs, and isn't too far behind even after filling the drive all the way.
 |
|||||||||
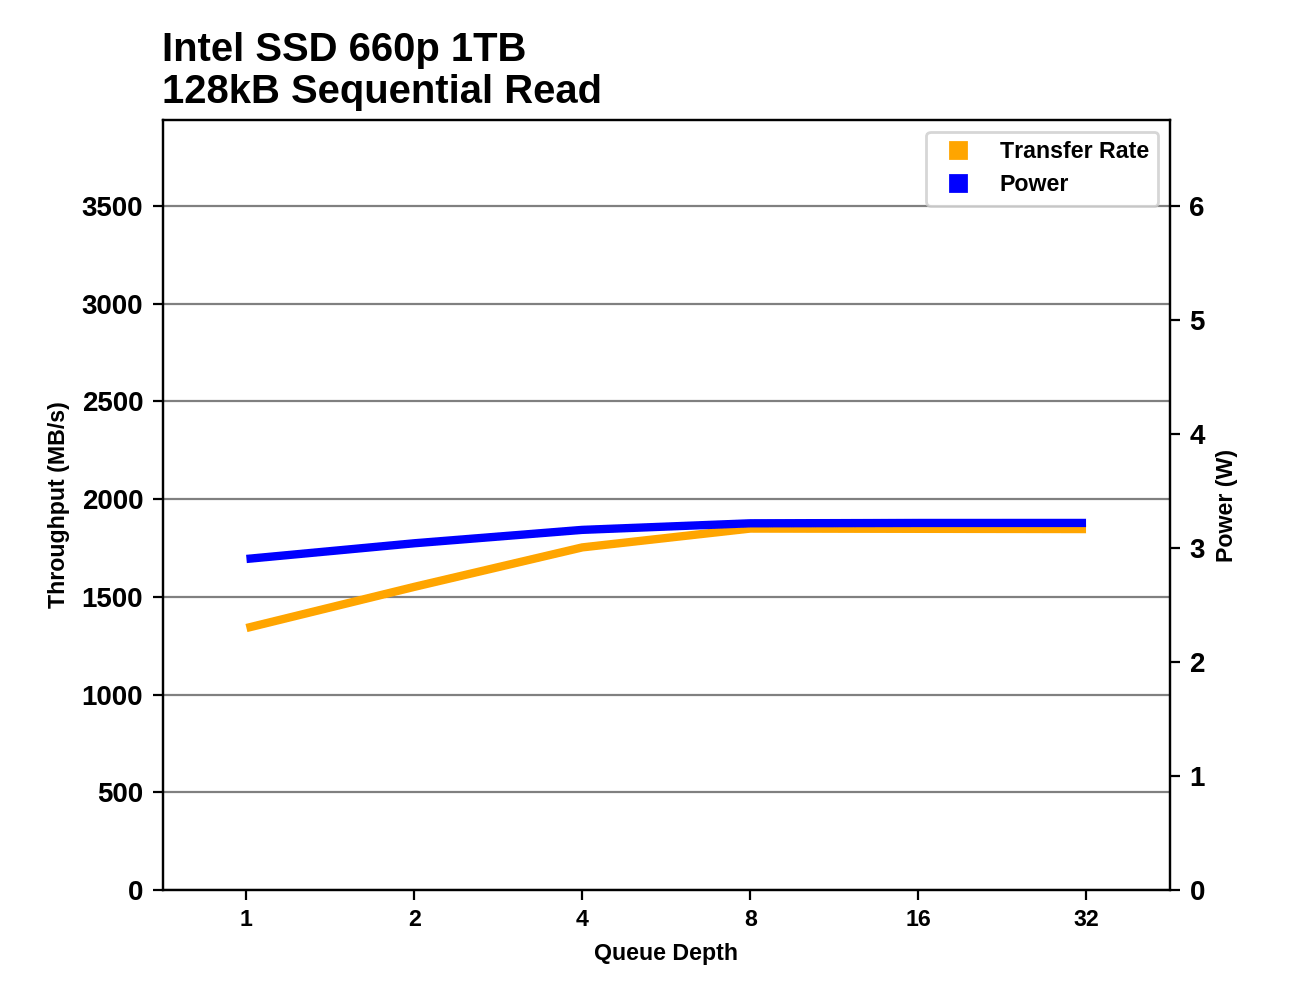
The 660p doesn't reach its maximum sequential read speed until around QD8, but it was already pretty quick at QD1 so the overall growth is relatively small.
Sequential Write Performance
Our test of sequential write burst performance is structured identically to the sequential read burst performance test save for the direction of the data transfer. Each burst writes 128MB as 128kB operations issued at QD1, for a total of 1GB of data written to a drive containing 16GB of data.
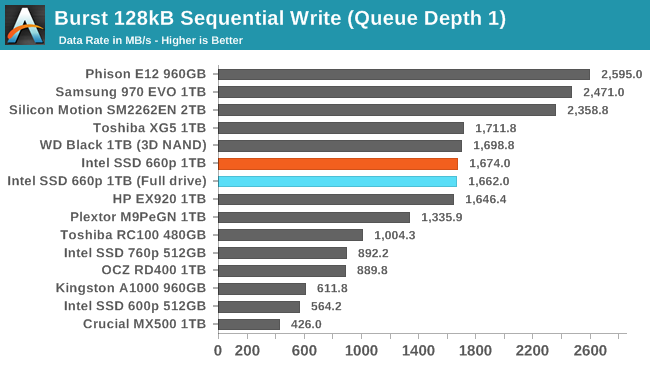
The burst sequential write test only hits the SLC write cache even when the Intel SSD 660p is completely full, so it performs comparably to many high-end NVMe drives.
Our test of sustained sequential writes is structured identically to our sustained sequential read test, save for the direction of the data transfers. Queue depths range from 1 to 32 and each queue depth is tested for up to one minute or 32GB, followed by up to one minute of idle time for the drive to cool off and perform garbage collection. The test is confined to a 64GB span of the drive.
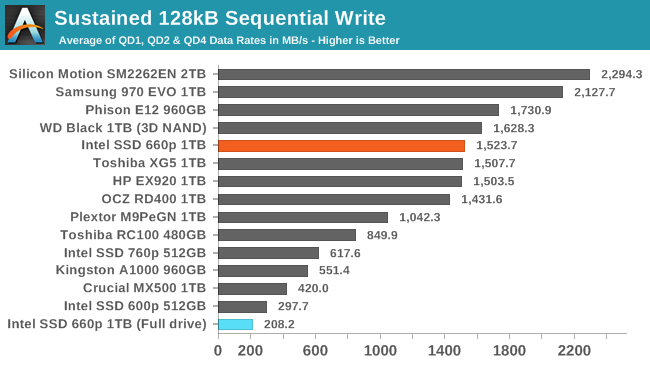
Our usual test conditions of a mostly-empty drive mean that the 660p's score on the sustained sequential write test reflects only writes to the SLC cache at its largest configuration. When the drive is full and the SLC cache has shrunk to just 12GB, the test quickly fills that cache and performance drops to last place.
 |
|||||||||
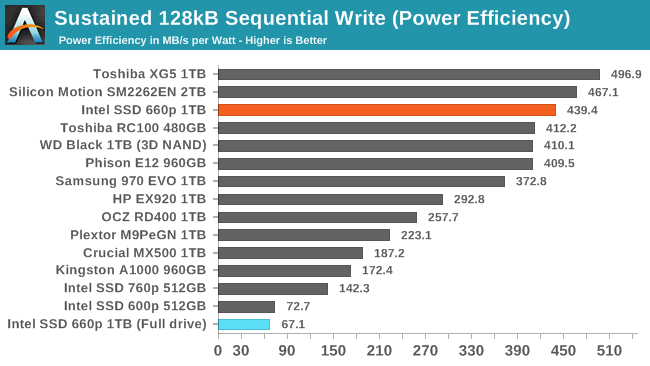
| Power Efficiency in MB/s/W | Average Power in W | ||||||||
The power efficiency of the 660p when writing sequentially to the SLC cache is excellent, but it ends up slightly worse off than the 600p when the drive is full and the SLC cache is too small.
 |
|||||||||
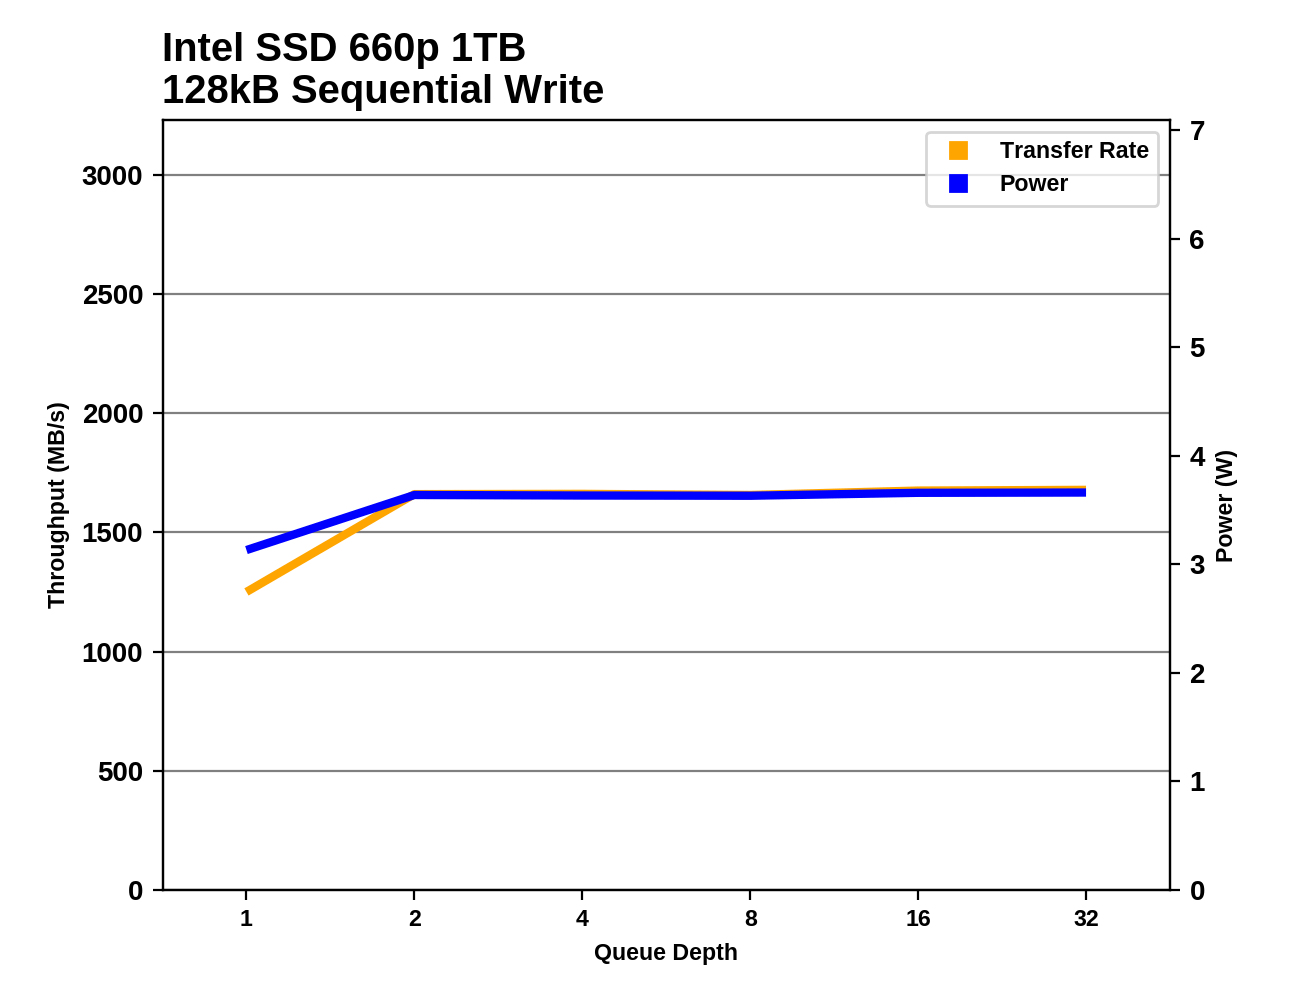
The 660p reaches its maximum sequential write speed at QD2 and maintains it for the rest of the test, showing that the drive is largely keeping up with flushing the SLC write cache during the idle phases of the test.
Mixed Random Performance
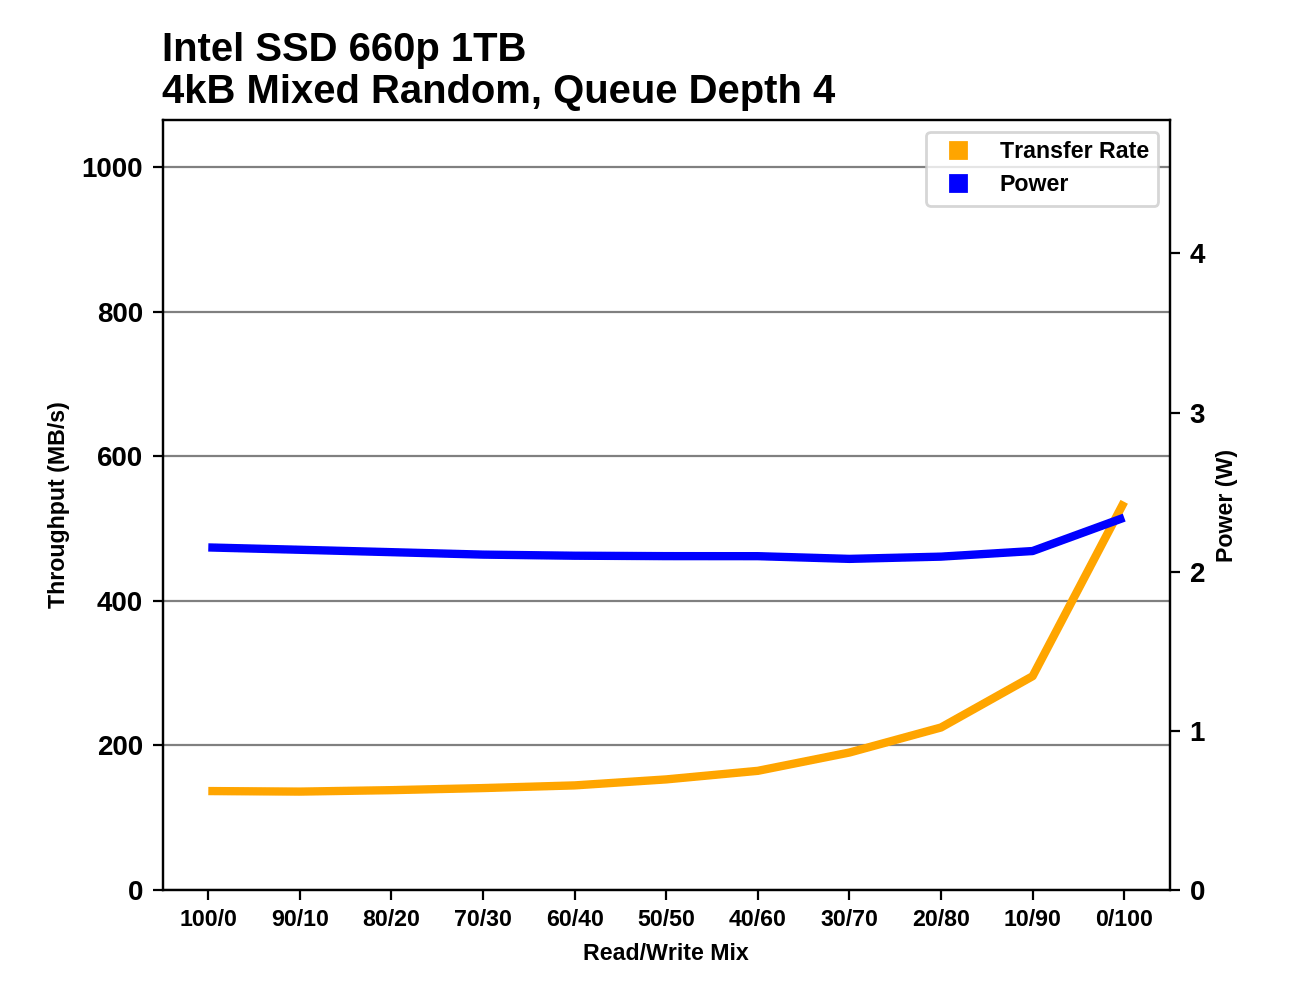
Our test of mixed random reads and writes covers mixes varying from pure reads to pure writes at 10% increments. Each mix is tested for up to 1 minute or 32GB of data transferred. The test is conducted with a queue depth of 4, and is limited to a 64GB span of the drive. In between each mix, the drive is given idle time of up to one minute so that the overall duty cycle is 50%.
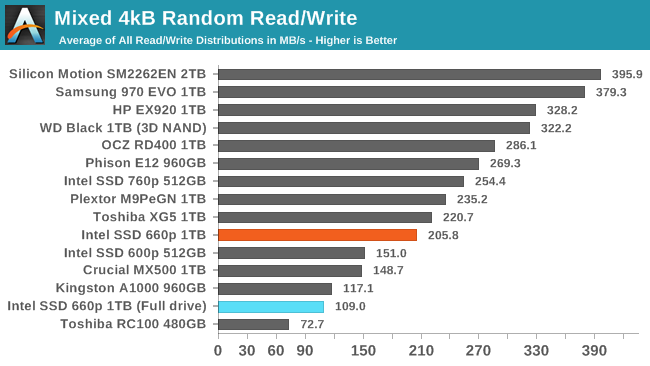
The mixed random I/O performance of the Intel SSD 660p is clearly above the other low-end NVMe drives we've tested, or the Crucial MX500 SATA drive. It scores closer to a mid-range NVMe SSD. After filling the drive, performance is cut in half, leaving it performing near low-end NVMe drives like the Phison E8-based Kingston A1000 and below the MX500.
 |
|||||||||
| Power Efficiency in MB/s/W | Average Power in W | ||||||||
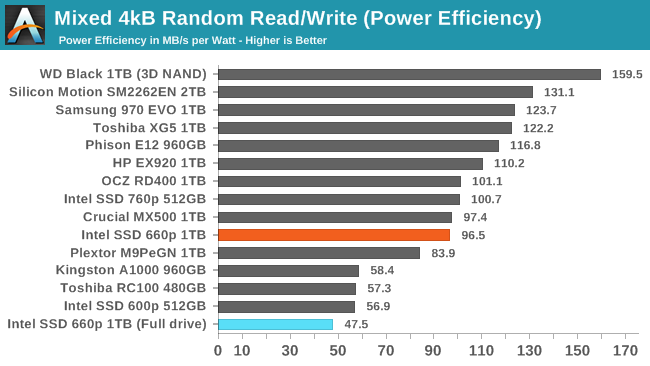
The power efficiency of the 660p during the mixed random I/O test is unimpressive but doesn't stand out as being significantly worse that other low-end NVMe drives even when the test is run on a full drive.
 |
|||||||||
The Intel SSD 660p shows very slow performance growth throughout most of the test, but it picks up speed reasonably well toward the end as the workload shifts toward pure writes, and the SLC cache handles things well. When the drive is full, the reduced capacity of the SLC cache prevents speed from increasing much.
Mixed Sequential Performance
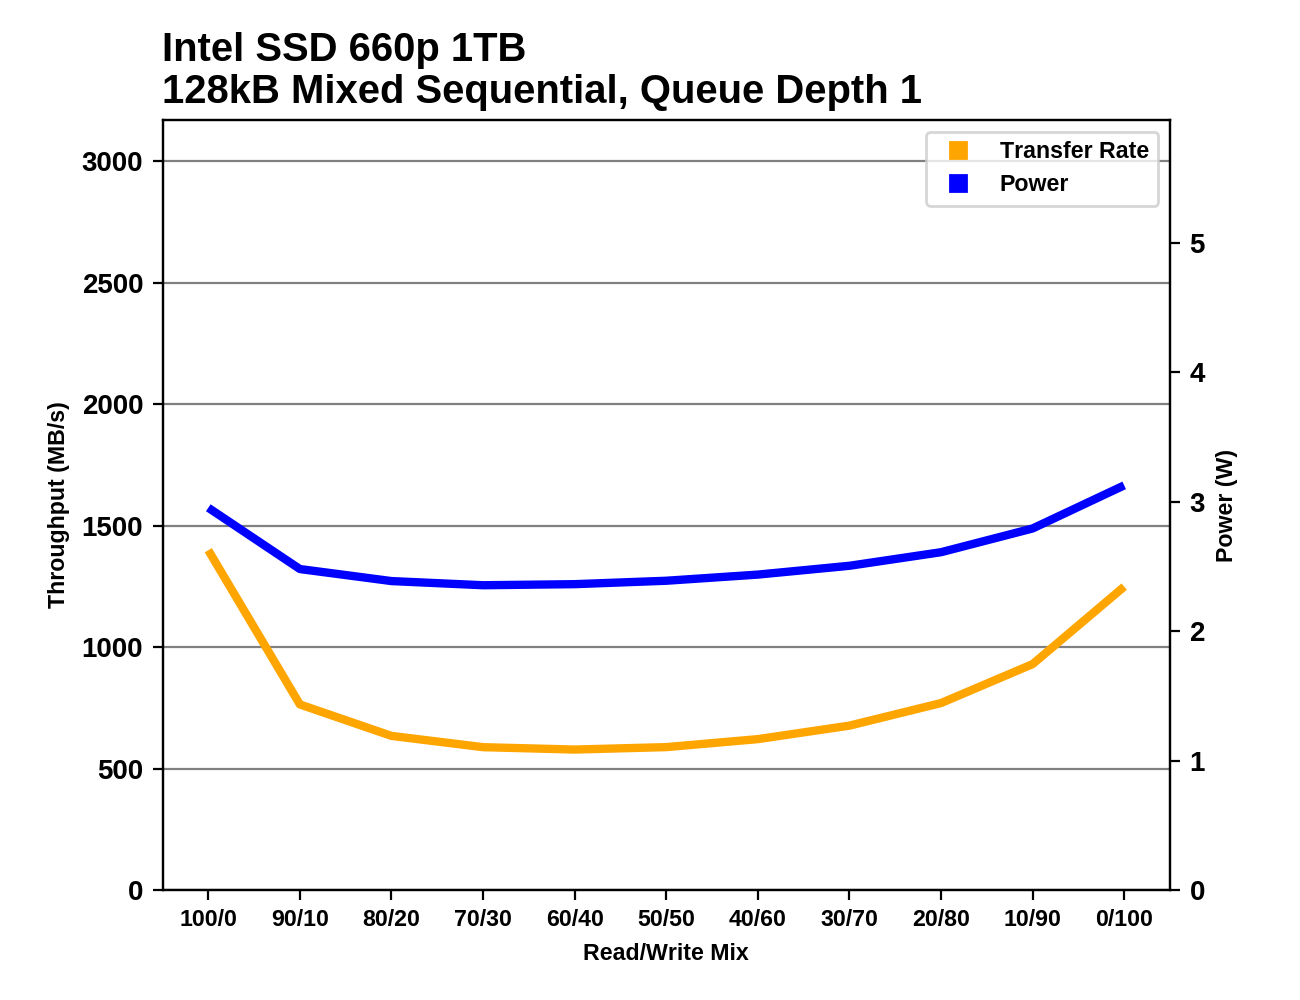
Our test of mixed sequential reads and writes differs from the mixed random I/O test by performing 128kB sequential accesses rather than 4kB accesses at random locations, and the sequential test is conducted at queue depth 1. The range of mixes tested is the same, and the timing and limits on data transfers are also the same as above.
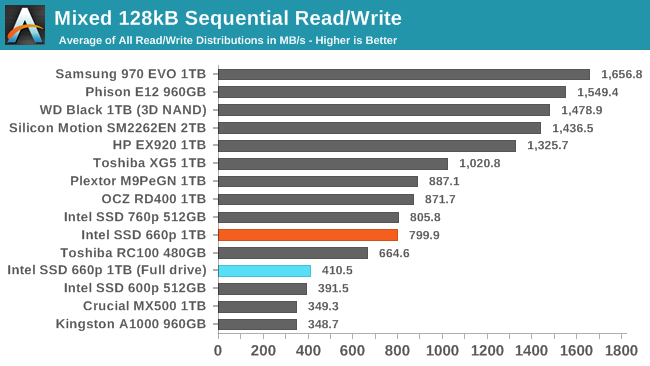
The Intel SSD 660p performs better than other entry-level NVMe SSDs or SATA drives when the mixed sequential I/O test is run on a mostly empty drive with a large SLC cache. After the drive is filled, performance drops down to slightly ahead of the 600p and Crucial MX500.
 |
|||||||||
| Power Efficiency in MB/s/W | Average Power in W | ||||||||
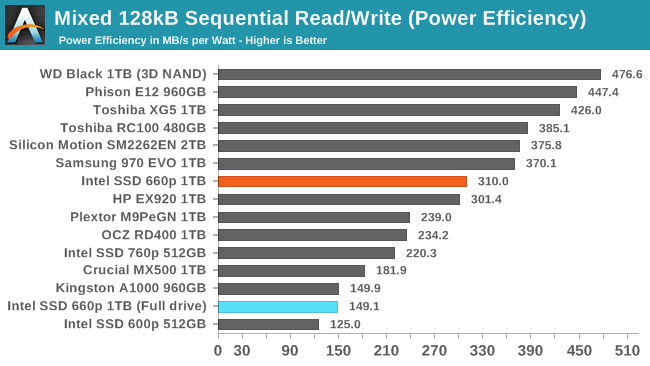
The power efficiency of the Intel SSD 660p during the mixed sequential I/O test is decent when operating entirely out of the SLC cache, and on par with most other low-end NVMe drives when the 660p is full.
 |
|||||||||
When the test is run on a mostly-empty 660p the performance shows a very typical bathtub curve and no sign of the SLC cache running out. When the drive is full, performance decreases steadily as the proportion of writes increases.
Power Management Features
Real-world client storage workloads leave SSDs idle most of the time, so the active power measurements presented earlier in this review only account for a small part of what determines a drive's suitability for battery-powered use. Especially under light use, the power efficiency of a SSD is determined mostly be how well it can save power when idle.
For many NVMe SSDs, the closely related matter of thermal management can also be important. M.2 SSDs can concentrate a lot of power in a very small space. They may also be used in locations with high ambient temperatures and poor cooling, such as tucked under a GPU on a desktop motherboard, or in a poorly-ventilated notebook.
| Intel SSD 660p 1TB NVMe Power and Thermal Management Features |
|||
| Controller | Silicon Motion SM2263 | ||
| Firmware | NHF034C | ||
| NVMe Version |
Feature | Status | |
| 1.0 | Number of operational (active) power states | 3 | |
| 1.1 | Number of non-operational (idle) power states | 2 | |
| Autonomous Power State Transition (APST) | Supported | ||
| 1.2 | Warning Temperature | 77°C | |
| Critical Temperature | 80°C | ||
| 1.3 | Host Controlled Thermal Management | Supported | |
| Non-Operational Power State Permissive Mode | Not Supported | ||
The Intel SSD 660p's power and thermal management feature set is typical for current-generation NVMe SSDs. The rated exit latency from the deepest idle power state is quite a bit faster than what we have measured in practice from this generation of Silicon Motion controllers, but otherwise the drive's claims about its idle states seem realistic.
| Intel SSD 660p 1TB NVMe Power States |
|||||
| Controller | Silicon Motion SM2263 | ||||
| Firmware | NHF034C | ||||
| Power State |
Maximum Power |
Active/Idle | Entry Latency |
Exit Latency |
|
| PS 0 | 4.0 W | Active | - | - | |
| PS 1 | 3.0 W | Active | - | - | |
| PS 2 | 2.2 W | Active | - | - | |
| PS 3 | 30 mW | Idle | 5 ms | 5 ms | |
| PS 4 | 4 mW | Idle | 5 ms | 9 ms | |
Note that the above tables reflect only the information provided by the drive to the OS. The power and latency numbers are often very conservative estimates, but they are what the OS uses to determine which idle states to use and how long to wait before dropping to a deeper idle state.
Idle Power Measurement
SATA SSDs are tested with SATA link power management disabled to measure their active idle power draw, and with it enabled for the deeper idle power consumption score and the idle wake-up latency test. Our testbed, like any ordinary desktop system, cannot trigger the deepest DevSleep idle state.
Idle power management for NVMe SSDs is far more complicated than for SATA SSDs. NVMe SSDs can support several different idle power states, and through the Autonomous Power State Transition (APST) feature the operating system can set a drive's policy for when to drop down to a lower power state. There is typically a tradeoff in that lower-power states take longer to enter and wake up from, so the choice about what power states to use may differ for desktop and notebooks.
We report two idle power measurements. Active idle is representative of a typical desktop, where none of the advanced PCIe link or NVMe power saving features are enabled and the drive is immediately ready to process new commands. The idle power consumption metric is measured with PCIe Active State Power Management L1.2 state enabled and NVMe APST enabled if supported.
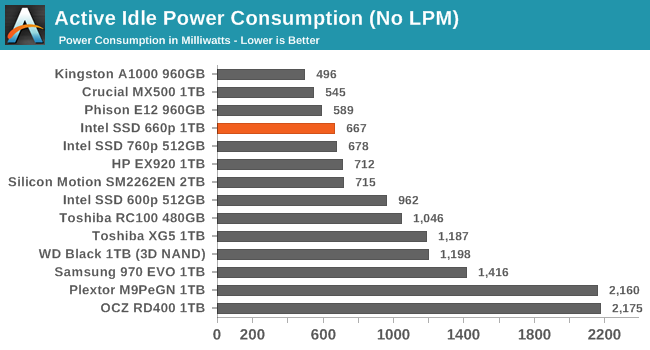
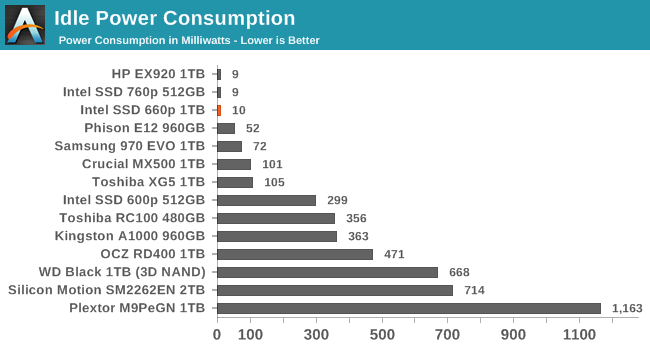
The Intel 660p has a slightly lower active idle power draw than the SM2262-based drives we've tested, thanks to the smaller controller and reduced DRAM capacity. It isn't the lowest active idle power we've measured from a NVMe SSD, but it is definitely better than most high-end NVMe drives. In the deepest idle state our desktop testbed can use, we measure an excellent 10mW draw.
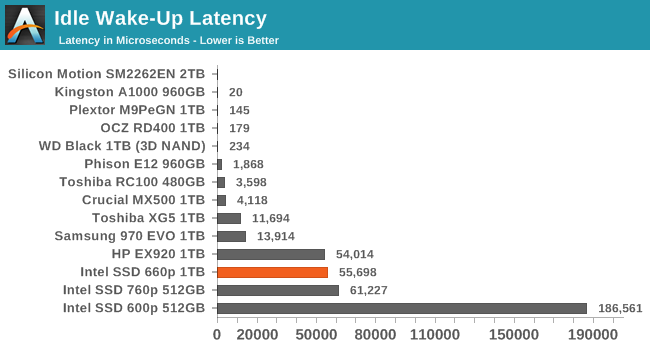
The Intel 660p's idle wake-up time of about 55ms is typical for Silicon Motion's current generation of controllers and much better than their first-generation NVMe controller as used in the Intel SSD 600p. The Phison E12 can wake up in under 2ms from a sleep state of about 52mW, but otherwise the NVMe SSDs that wake up quickly were saving far less power than the 660p's deep idle.
Conclusion
As the first SSD with QLC NAND to hit our testbed, the Intel SSD 660p provides much-awaited hard facts to settle the rumors and worries surrounding QLC NAND. With only a short time to review the drive we haven't had time to do much about measuring the write endurance, but our 1TB sample has been subjected to 8TB of writes and counting (out of a rated 200TB endurance) without reporting any errors and the SMART status indicates about 1% of the endurance has been used, so things are looking fine thus far.
On the performance side of things, we have confirmed that QLC NAND is slower than TLC, but the difference is not as drastic as many early predictions about QLC NAND suggested. If we didn't already know what NAND the 660p uses under the hood, Intel could pass it off as being an unusually slow TLC SSD. Even the worst-case performance isn't any worse than what we've seen with some older, smaller TLC SSDs with NAND that is much slower than the current 64-layer stuff.
The performance of the SLC cache on the Intel SSD 660p is excellent, rivaling the high-end 8-channel controllers from Silicon Motion. When the 660p isn't very full and the SLC cache is still quite large, it provides significant boosts to write performance. Read performance is usually very competitive with other low-end NVMe SSDs and well out of reach of SATA SSDs. The only exception seems to be that the 660p is not very good at suspending write operations in favor of completing a quicker read operation, so during mixed workloads or when the drive is still working on background processing to flush the SLC cache the read latency can be significantly elevated.
Even though our synthetic tests are designed to give drives a reasonable amount of idle time to flush their SLC write caches, the 660p keeps most of the data as SLC until the capacity of QLC becomes necessary. This means that when the SLC cache does eventually fill up, there's a large backlog of work to be done migrating data in to QLC blocks. We haven't yet quantified how quickly the 660p can fold the data from the SLC cache into QLC during idle times, but it clearly isn't enough to keep pace with our current test configurations. It also appears that most or all of the tests that were run after filling the drive up to 100% did not give the 660p enough idle time after the fill operation to complete its background cleanup work, so even some of the read performance measurements for the full-drive test runs suffer the consequences of filling up the SLC write cache.
In the real world, it is very rare for a consumer drive to need to accept tens or hundreds of GB of writes without interruption. Even the installation of a very large video game can mostly fit within the SLC cache of the 1TB 660p when the drive is not too full, and the steady-state write performance is pretty close to the highest rate data can be streamed into a computer over gigabit Ethernet. When copying huge amounts of data off of another SSD or sufficiently fast hard drive(s) it is possible to approach the worst-case performance our benchmarks have revealed, but those kind of jobs already last long enough that the user will take a coffee break while waiting.

Given the above caveats and the rarity with which they matter, the 660p's performance seems great for the majority of consumers who have light storage workloads. The 660p usually offers substantially better performance than SATA drives for very little extra cost and with only a small sacrifice in power efficiency. The 660p proves that QLC NAND is a viable option for general-purpose storage, and most users don't need to know or care that the drive is using QLC NAND instead of TLC NAND. The 660p still carries a bit of a price premium over what we would expect a SATA QLC SSD to cost, so it isn't the cheapest consumer SSD on the market, but it has effectively closed the price gap between mainstream SATA and entry-level NVMe drives.
Power users may not be satisfied with the limitations of the Intel SSD 660p, but for more typical users it offers a nice step up from the performance of SATA SSDs with a minimal price premium, making it an easy recommendation.


