Original Link: https://www.anandtech.com/show/11083/the-intel-core-i3-7350k-60w-review
The Intel Core i3-7350K (60W) Review: Almost a Core i7-2600K
by Ian Cutress on February 3, 2017 8:00 AM EST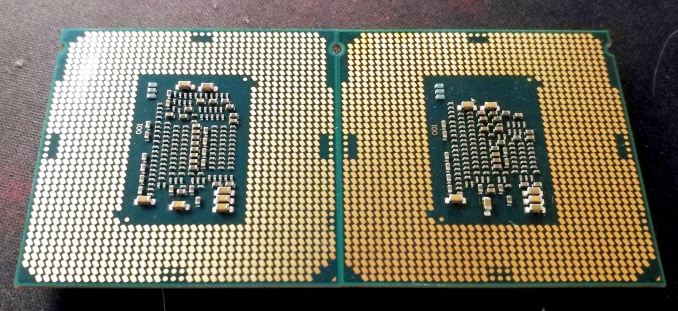
For some intrepid enthusiasts, this is the chip from Intel we’ve been waiting for. I foolishly predicted that Intel would never create an overclockable Core i3, because it had the potential to drive sales away from high-margin products. But here we are, Core i3-7350K in hand, and the ability to drive almost 5.0 GHz without too much trouble. This raises a couple of questions: just how close is it to the cheapest Core i5-7400 out of the box, which is only a few dollars more, and how close is it to the Core i7-2600K, a favorite chip among enthusiasts who have not yet upgraded.
Slap Me On The Wrist
For the previous generation of Intel products, we reviewed the Core i3-6100TE. This was a low-powered Core i3, but it was paired with the SuperMicro C7H170-M, a motherboard that enabled adjustment of the base frequency from 100 MHz to 130 MHz and up. This was the first chance in a number of generations to test what would essentially be an overclockable Core i3 product. There were many teething issues, as overclocking via the base frequency is less stable than by the multiplier, plus the motherboard options were not the easiest to work with.
![]()
However the final conclusion was that the Core i3 parts, while having two cores and hyperthreading, have difficulty keeping up with the Core i5 in tasks where having actual cores matter. For gaming, especially 1080p or Full-HD gaming, there was a small difference in favor of the Core i5, and the indication that with DX12 enabling multi-core gaming in a nicer way before, a gap would likely emerge over time (but mainly for high-end games for now). As a result, we postulated that Intel would never release a Core i3-K product: doing so would potentially drive sales away from the i5-K, as here is a part that could perform just as well for $60-$70 less, which users would have in pocket to upgrade a graphics card instead.
Can Die Size Account for the Difference?
Intel, from the outside, seems very margin driven: keeping those numbers above 60-65% in every department seems to be key to progress. As a result certain projects come and go, and others with potential have a small grace period but the bottom line is performance and strategy. One could argue that potentially offering an easy route for users to migrate down from a Core i5-K to a Core i3-K could affect that bottom line: users are paying $60 less per unit, and that’s a $60 loss per sale. This is one way of looking at it – another is considering that the Core i3-K parts are dual-core by design, and cheaper to make.
Disclaimer: The data for 2+2/4+2 Kaby Lake and Skylake for the following analysis were derived from high quality images of each die, and thus subject to error.
| CPU Die Size Comparison Numbers in table are to nearest degree of known accuracy Data from Intel or Trusted Sources (Chipworks/PCWatch) |
||||||
| CPU | Year | Process Node |
Die Size 2C or 2+2 |
Die Size 4C or 4+2 |
Die Size 4+3/e (no eDRAM) |
Die Size (other) |
| Intel Kaby Lake | 2017 | 14+nm | 98.68 | 126.15 | - | |
| Intel Skylake | 2015 | 14nm | 98.57 | 122.40 | 234 | - |
| Intel Broadwell | 2014 | 14nm | 82 | *** | 241.50 | 133 (2+3) 246.24 (10C) 306.18 (15C) 456.12 (24C) |
| Intel Haswell | 2013 | 22nm | 130 | 177 | 264 | 181 (2+3) 355.52 (8C) 492 (12C) 662 (18C) |
| Intel Ivy Bridge | 2012 | 22nm | 118.09 | 159.82 | - | 256.5 (6C) 341 (10C) 541 (15C) |
| Intel Sandy Bridge | 2011 | 32nm | 149 | 216 | - | 435 (8C) |
| Intel Westmere (GPU on 45nm) |
2009 | 32nm | 81 (Core) 195* (+GPU) |
276** | - | 248 (6C) 513 (10C) |
| Intel Nehalem | 2008 | 45nm | - | 263 | - | 296 (HEDT) 684 (8C) |
| Intel Yorkfield | 2007 | 45nm | 107 | 220 | - | - |
| Intel Kentsfield | 2007 | 65nm | - | 280 | - | - |
| Intel Conroe | 2006 | 65nm | 145 | - | - | - |
Italicised numbers are calculated from images and represent more of a 'peak' die size. Data taken from delidded images varied wildly, from 105mm2 to 130mm2 for the 4+2, so should be taken under caution.
* Dual Core Westmere CPUs had a IGP built on 45nm
** Quad Core Westmere designs with IGP didn't exist, so this is an estimate of what it would have been
*** Broadwell 4+2 designs don't seem to exist. The two mobile parts (we don't have access to) that fit this description are likely to be cut down 4+3e parts.
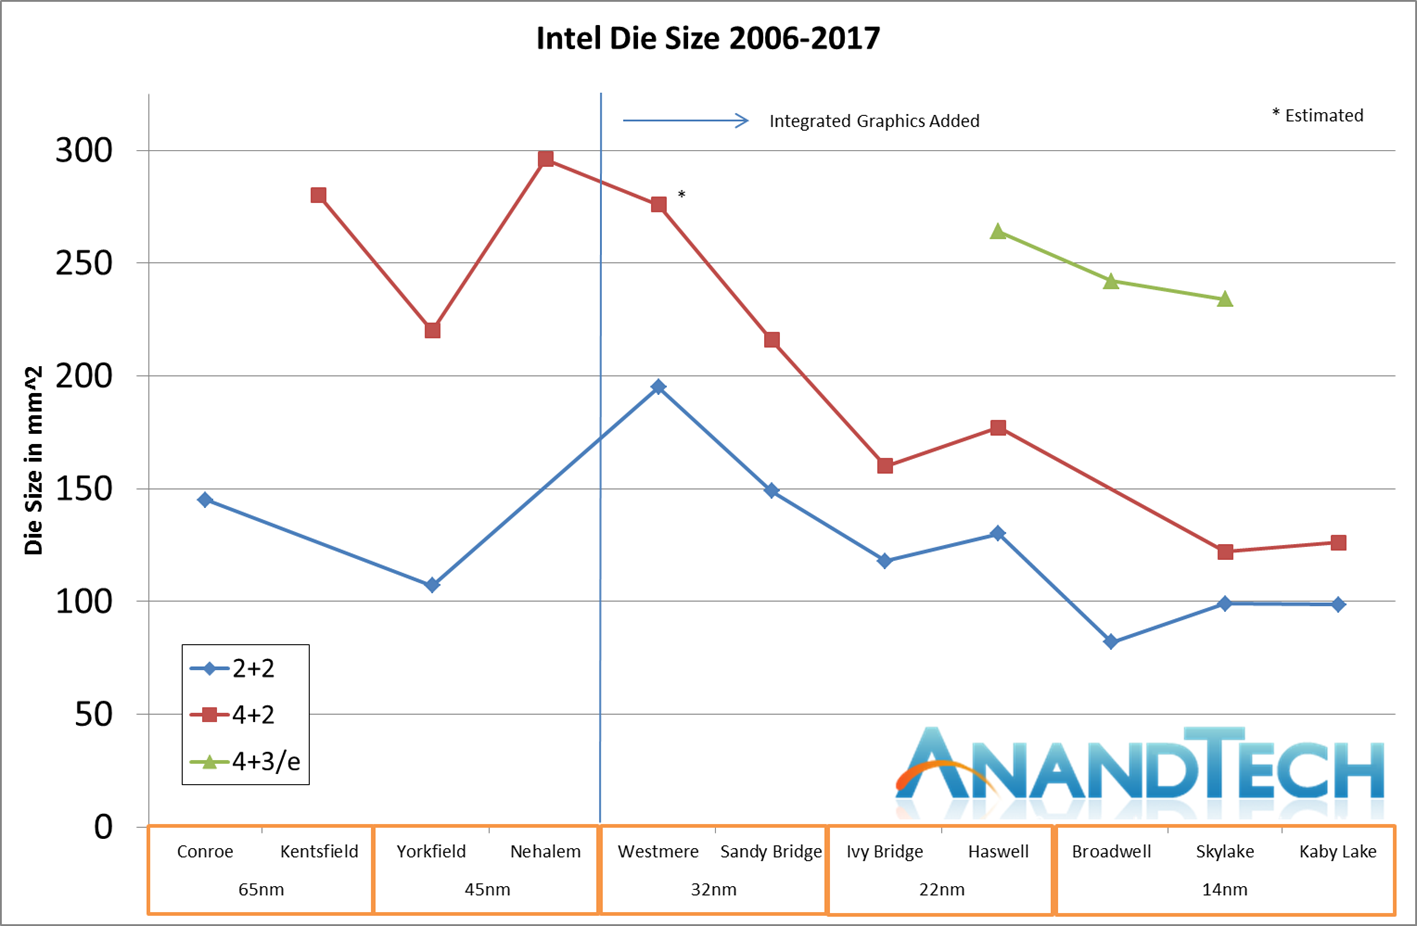
Taking data from available images on delidding the dual core parts and quad core parts, it’s clear that the new generation of Kaby Lake processors are physically smaller than Skylake. But the difference between the Core i5/i7 core design (known as 4+2) and the Core i3 design (known as 2+2) isn’t that much. With a die size of 126.15 mm2 for the quad core and 98.68 mm2 for the dual core, the die sizes of the two chips are relatively close, with a difference of just 27.47 mm2. This makes the dual core design 78% of the quad core size. If costs scaled linearly with die size, then die size difference between the two (22%) equates to $52.75 of the cost of the i5-7600K list price. This is similar to the list price difference between the two chips as a whole.
As we have this data for the first time, it is interesting to see that Intel’s new method of ‘Process-Architecture-Optimization’ rather than Tick-Tock, is yielding results. The Skylake 4+2 die size is similar from 122 mm2 to 126 mm2, and goes in line with the fact that Intel has officially stated that one of the key features of the new 14+ process is that the transistors are more ‘relaxed’ and there’s no decrease in density. Exactly what that means is likely under wraps for all but Intel (or Chipworks). But the difference between Kaby Lake 4+2 and 2+2 also means that we can get a rough number for the die area required for two cores.
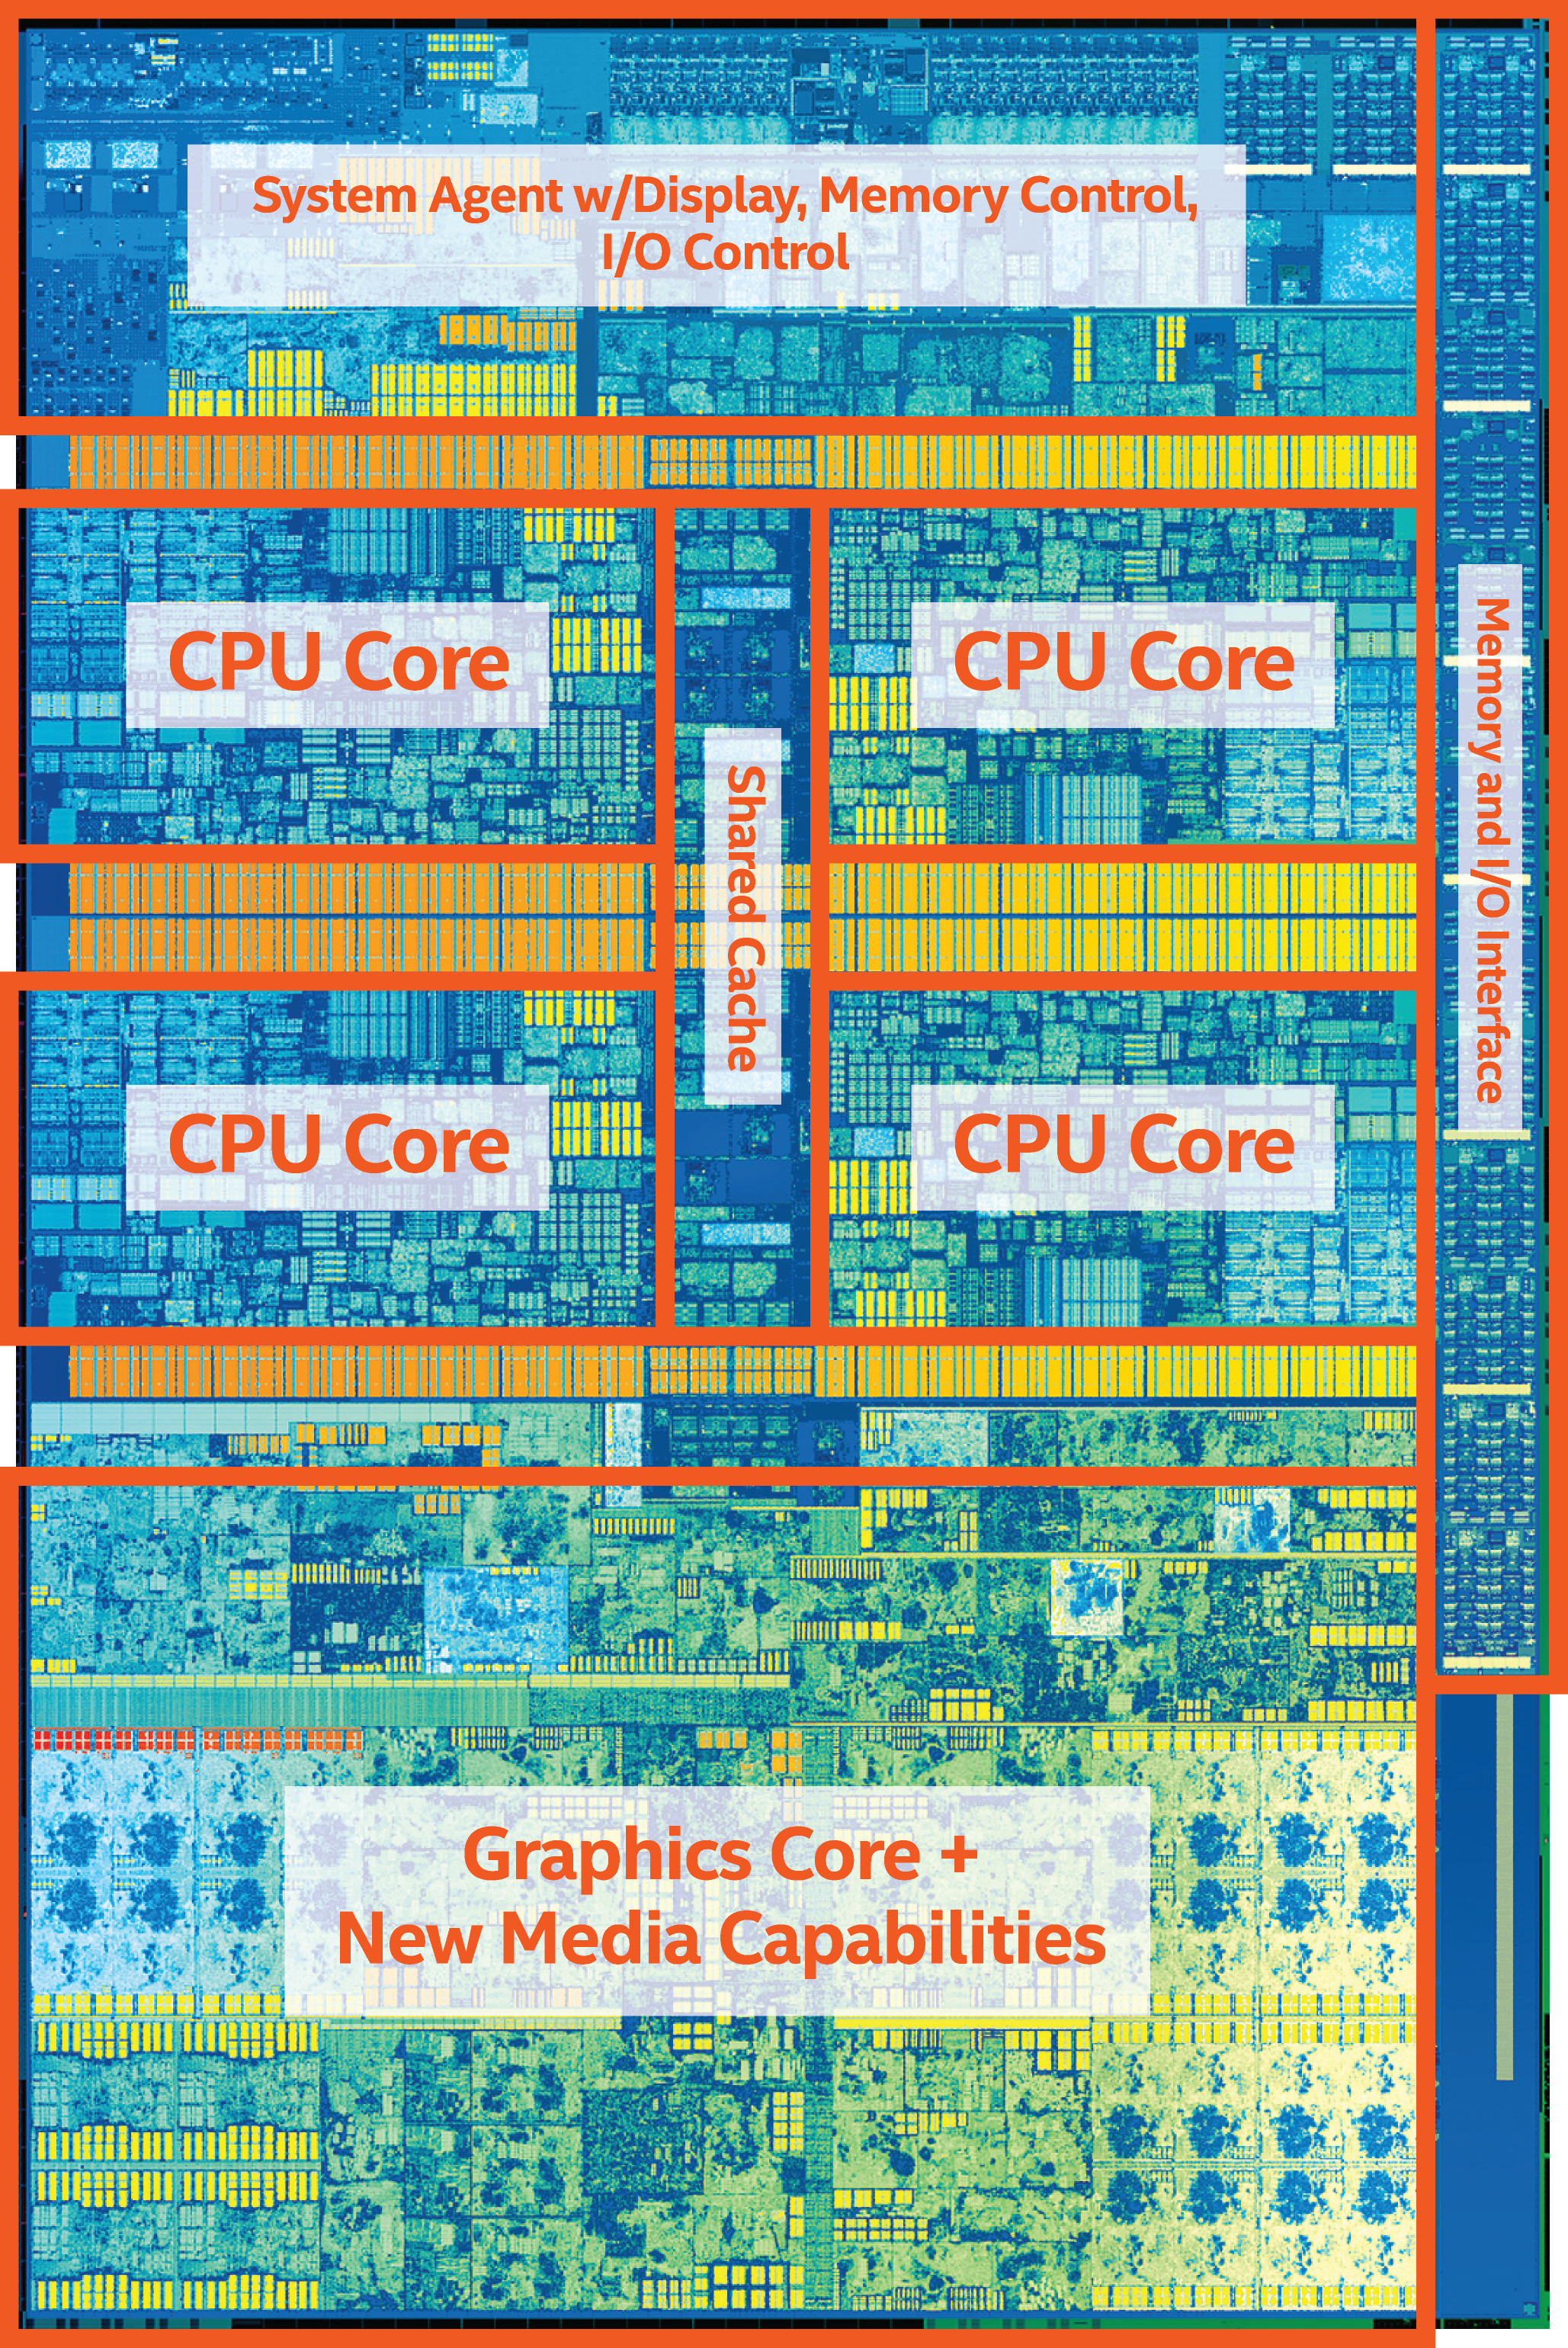
In this case, two Kaby Lake cores plus L3 cache (plus periphery required for another two cores) are approximately 27.47 mm2. This makes the two cores in the dual core design approximately (given sufficient error margin) 27.8 % of the die. Doubling the die size for the four core version means that the CPU cores take up ~43% of the design. It's worth noting that using Intel's official die shot of the quad-core above puts the core area at around the 33-37% mark, depending on how you count the interconnect. The GPU area is almost identical (within 1%) of the core area as well. Our numbers here are calculated from delidded CPUs rather than official numbers, as Intel sporadically gives out such numbers these days (it depends which department is making the announcement, oddly) which makes our results more of an upper limit which is important to consider.
Because of the image above, we could arguably call the GT2 graphics inside the quad core design equal in size to the CPU cores (which seems plausable) at 54.94 mm2, then using the full dize size measurement above, it leaves 16.27 mm2 for the memory controller, system agent, and other requirements. If we do the math back into the dual core design with the same graphics core, we get 16.27 mm2 for the memory controller and other requirements as well.
| Kaby Lake Comparison | |||||
| CPU | Die Size | Cores | Core Area | GT2 Area | IMC + other |
| Intel Kaby Lake-S 4+2 | 126.15 | 4 | 54.94 | 54.94 | 16.27 |
| Intel Kaby Lake-S 2+2 | 98.68 | 2 | 27.47 | 54.94 | 16.27 |
For clarity, numbers in bold are measured; italics are estimates, and others are calculated.
So if the difference in die size can account for the price difference and won’t affect margins, what’s the bottom line here? Ultimately $60-70 per sale lost is a drop in revenue. However, it also depends on yields, and how the different CPUs are being binned. That information we won’t ever have. What we do know is that the Core i3-7350K is coming onto shelves at the end of January/beginning of February, rather than with the rest of the Kaby Lake CPUs in early January. So perhaps, ultimately, the effect of offering a Core i3-K in this case is minimal to Intel’s bottom line.
But Where Does the Core i3-7350K Fit In?
Intel's 7th Generation of Core CPUs, which often goes by its internal code name 'Kaby Lake', stretches from 91W on the mainstream desktop down to 4.5W for notebook processors, all using the same underlying technology in different core and integrated graphics configurations. The i7-7700K is the top part of this processor family, featuring four cores with hyperthreading, and we move down through the Core i5 and Core i3 parts. This time there are three overclocking processors, with the new one being the Core i3-7350K.
| Intel Kaby Lake S SKUs | |||||||
| Cores/ Threads |
Base/ Turbo |
IGP | L3 | eDRAM | TDP | Cost OEM |
|
| i7-7700K | 4/8 | 4.2/4.5 | HD 630 | 8 MB | - | 91 W | $339 |
| i7-7700 | 4/8 | 3.6/4.2 | HD 630 | 8 MB | - | 65 W | $303 |
| i7-7700T | 4/8 | 2.9/3.8 | HD 630 | 8 MB | - | 35 W | $303 |
| i5-7600K | 4/4 | 3.8/4.2 | HD 630 | 6 MB | - | 91 W | $242 |
| i5-7600 | 4/4 | 3.5/4.1 | HD 630 | 6 MB | - | 65 W | $213 |
| i5-7600T | 4/4 | 2.8/3.7 | HD 630 | 6 MB | - | 35 W | $213 |
| i5-7500 | 4/4 | 3.4/3.8 | HD 630 | 6 MB | - | 65 W | $192 |
| i5-7500T | 4/4 | 2.7/3.3 | HD 630 | 6 MB | - | 35 W | $192 |
| i5-7400 | 4/4 | 3.0/3.5 | HD 630 | 6 MB | - | 65 W | $182 |
| i5-7400T | 4/4 | 2.4/3.0 | HD 630 | 6 MB | - | 35 W | $182 |
| i3-7350K | 2/4 | 4.2 | HD 630 | 4 MB | - | 60 W | $168 |
| i3-7320 | 2/4 | 4.1 | HD 630 | 4 MB | - | 51 W | $149 |
| i3-7300 | 2/4 | 4.0 | HD 630 | 4 MB | - | 51 W | $138 |
| i3-7300T | 2/4 | 3.5 | HD 630 | 4 MB | - | 35 W | $138 |
| i3-7100 | 2/4 | 3.9 | HD 630 | 3 MB | - | 51 W | $117 |
| i3-7100T | 2/4 | 3.4 | HD 630 | 3 MB | - | 35 W | $117 |
| G4620 | 2/4 | 3.7 | HD 630 | 3 MB | - | 51 W | $86 |
| G4600 | 2/4 | 3.6 | HD 630 | 3 MB | - | 51 W | $75 |
| G4600T | 2/4 | 3.0 | HD 630 | 3 MB | - | 35 W | $75 |
| G4560 | 2/4 | 3.5 | HD 610 | 3 MB | - | 54 W | $64 |
| G4560T | 2/4 | 2.9 | HD 610 | 3 MB | - | 35 W | $64 |
| G3950 | 2/2 | 3.0 | HD 610 | 2 MB | - | 51 W | $52 |
| G3930 | 2/2 | 2.9 | HD 610 | 2 MB | - | 51 W | $42 |
| G3930T | 2/2 | 2.7 | HD 610 | 2 MB | - | 35 W | $42 |
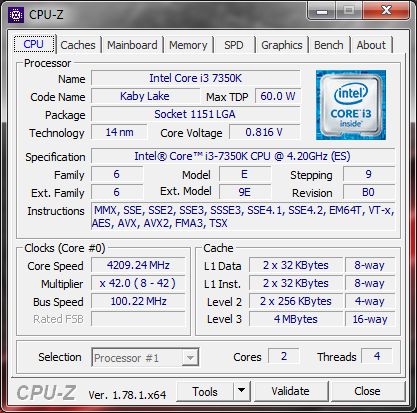
The Core i3-7350K is the odd member of the stack. It sits as the only processor with a TDP of 60W, and is priced very close to the Core i5-7400/7400T. The comparison between this two (we were able to run limited tests on the i5-7400) will be a key aspect to this review given the pricing – will an extra $14 for two more cores offset the fact that the Core i3-7350K has a super high base frequency? Having 4.20 GHz as the frequency of the Core i3-7350K is interesting: as a Core i3, it has no turbo mode per-se, and it operates either in a low power mode (800 MHz or so) when idle or at full throttle when needed. This has some advantages over a turbo mode by having peak power being the only consideration, especially when combined with Windows 10 and using Intel’s Speed Shift technology to ramp up to the top speed quickly.
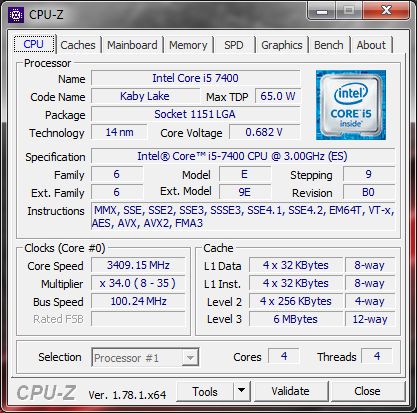
Intel Core i3-7350K vs Core i5-7400
Aside from the physical cores, the Core i3-7350K has less cache than the Core i5-7400, which is something to note.
One other pertinent comparison I want to make in this review is with the perennial favorite of DIY system builders for the last seven years or so: the Core i7-2600K. This is the high-end processor from the Sandy Bridge family that is known for being a good overclocker and a part which a lot of users are still on due to the lack of distinct performance improvements over the recent Intel microarchitectures. For most users still on these parts, the upgrade to a newer platform does not offer a substantial enough performance uptick to validate the outlay. However, at one point, there is going to be a Core i3 performance CPU that matches the Core i7-2600K. I want to find out if that time is now, or how far it might be away.
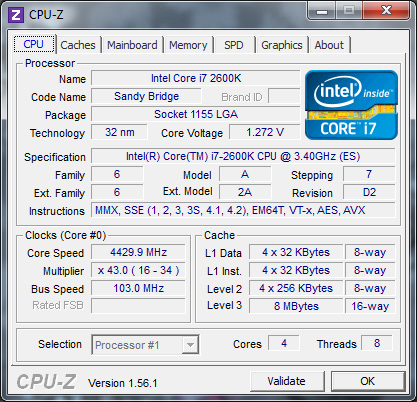
Intel Core i3-7350K vs Core i7-2600K (overclocked)
| Kaby Lake i3 vs Sandy Bridge i7 Comparison Launch Pricing |
|||||||||
| CPU | Year | Cores Threads |
Freq | Turbo | L3 | IGP | DRAM | TDP | Price |
| Core i3-7350K | 2017 | 2/4 | 4.2 | - | 4MB | HD 630 | DDR4-2400 | 60W | $168 |
| Core i7-2600K | 2011 | 4/8 | 3.4 | 3.8 | 8MB | HD 3000 | DDR3-1333 | 95W | $317 |
In simple numbers, the Core i7-2600K has a base frequency of 3.40 GHz and has a turbo up to 3.8 GHz. The Core i3-7350K is at 4.2 GHz, giving it both a frequency advantage and 35%+ advantage in instructions per clock (IPC) by virtue of being so many generations ahead. Aside from the L3 cache difference, and the move from DDR3 to DDR4, is there a sufficient frequency and IPC increase for the Core i3 to match the golden processor of yesteryear? This review will solve that question.
More about Kaby Lake
For readers that want a more in-depth take on Kaby Lake as a platform, we have a dedicated article full of information for you. We also have other articles in our Kaby Lake bonanza.
Other articles include:
Intel Launches 7th Generation Kaby Lake (Overview and Core Improvements)
The Intel Core i7-7700K Review: The New Out-of-the-box Performance Champion
The Intel Core i5-7600K Review: The More Amenable Mainstream Performer
The Intel Core i3-7350K Review: When a Core i3 Nearly Matches the Core i7-2600K (This Review)
Still to come
Calculating Generational IPC Changes from Sandy Bridge to Kaby Lake
Intel Core i7-7700K, i5-7600K and i3-7350K Overclocking: Hitting 5.0 GHz on AIR
Intel Launches 200-Series Chipset Breakdown: Z270, H270, B250, Q250, C232
Intel Z270 Motherboard Preview: A Quick Look at 80+ Motherboards
7th Generation New Features
One of the big questions regarding the launch of Intel’s 7th Generation of CPUs was around what extra features the new platform brings, especially if there isn’t any clock-for-clock performance improvement. As with our other Kaby Lake reviews, here we explain the main two: Speed Shift v2 and Optane Memory support.
Speed Shift v2
For the Intel’s 6th Generation of processors, Skylake, they introduced Speed Shift (v1). This was a feature that, at a high level, gave control of the voltage/frequency curve from the operating system to the processor. Using a series of internal metrics, such as instruction analysis and frequency, the CPU would automatically adjust the voltage and frequency of the processor as required. This afforded two major benefits: one, with the CPU in control it has access to many more points on the curve compared to the OS which is limited to specific P-states on the processor.
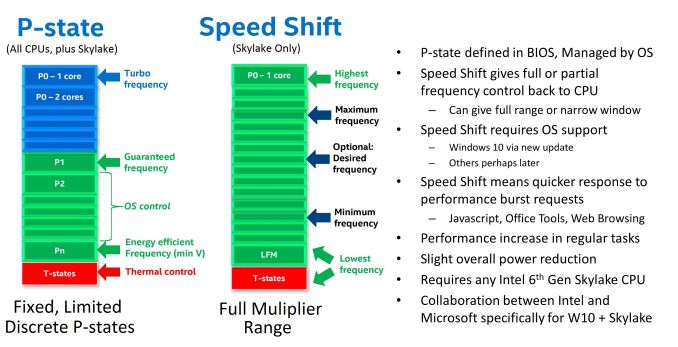
The second benefit is the speed of transition. A processor that can ramp up to a high frequency quickly and then drop down as needed can get through instructions quicker but also save power. Imagine driving a car, and having to wait 60 seconds to change a gear – it’s that sort of analogy.
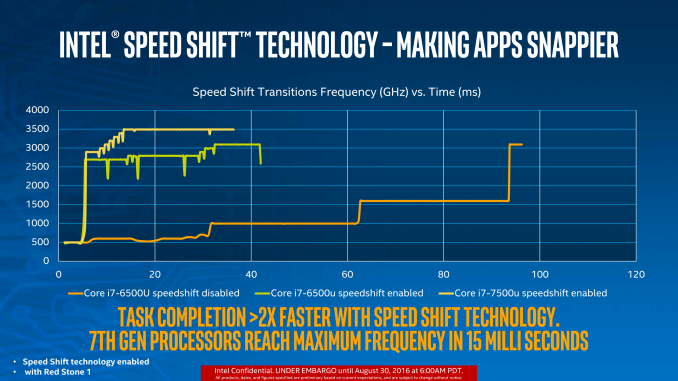
What Speed Shift v2 does in the Kaby Lake family, compared to v1 in Skylake, is manage those transitions to higher frequency faster. Before Speed Shift, transitions from idle to peak turbo were on the order of 100 milliseconds, and Speed Shift v1 took that to 30 milliseconds (with a good base established within 15). Speed Shift v2 means that peak performance from idle now happens in 10-15 milliseconds total. This means that interactions with the OS, such as touch, or actions that rely on low latency, can occur within a couple of frames on a 60 Hz display.
The benefit of Speed Shift lies a lot in touch devices, which perhaps doesn’t affect the desktop Kaby Lake processors in this review, but also in web interactions. A lot of web work is stop and start, such as scrolling or javascript functions.
There is one caveat however – Speed Shift currently only works in Windows 10. It requires a driver which is automatically in the OS (v2 doesn’t need a new driver, it’s more a hardware update), but this limitation does mean that Linux and macOS do not benefit from it. I would be hard pressed to not imagine that Apple and Intel were not working on a macOS driver, but as yet we have not had confirmation that one exists.
Optane Memory Support
The latest memory technology to hit prime time is Intel and Micron’s 3D XPoint. This is a non-volatile form of data storage that is bit addressable and can be used as DRAM or storage. Despite being at least a decade in the making, and being formally announced in 2014, it is still yet to show up commercially as it is still being developed. Intel plans to create 3D XPoint DRAM that is slightly slower than normal DRAM but both denser (more of it) and non-volatile (keeps the data after power loss, saves power altogether), as well as 3D XPoint Storage that is faster than standard NAND flash, and more configurable. It the scheme of things, we expect the storage based products to hit the market first.
Intel, as far as we can tell, is set to release two main classes of product: Optane DRAM to be pin-compatible with DDR4 and require Optane DRAM enabled processors, and Optane SSDs which should work with any PCIe storage interface. ‘Optane Memory’ however, is something a little different. Based on pre-briefings, Optane Memory is certainly not Optane SSD we were told, but rather a storage cache for mechanical hard-drives. We’ve had this before with NAND flash drives, using Intel’s Rapid Storage Technology, and it seems that Kaby Lake and 200-series chipsets will support a new version of RST for PCIe based storage. But because this is caching drive, such as the 16GB Optane Memory drives in Lenovo’s upcoming notebooks, and not Optane SSD, might lead us to believe that ‘Optane Memory’ drives are not designed to be directly user addressable.
All that being said, Intel has stated that Optane Memory standalone drives should hit the market nearer Q3 for general consumer use, which is more in-line with what we might expect to see with Optane SSDs in the enterprise space.
Test Bed and Setup
As with every CPU launch, there are a number of different directions to take the review. We have dedicated articles comparing the IPC of the new Kaby Lake line of CPUs, as well as a look into overclocking performance as a whole. We have had almost every desktop-class CPU family since Sandy Bridge tested in our benchmark suite, although only the latest have been retested. Due to timing, we were able to test all three of the new Kaby Lake-K processors, and retest the several Skylake processors, however we do have some CPU data for comparison for Haswell, Ivy Bridge, and Sandy Bridge. It will interesting to see how the CPU performance out-of-the-box has adjusted over the last five generations.
As per our testing policy, we take each CPU and place it in a suitable high-end motherboard and equip the system with a suitable amount of memory running at the processor maximum supported frequency. This is also typically run at JEDEC sub-timings where possible. It is noted that some users are not keen on this policy, stating that sometimes the maximum supported frequency is quite low, or faster memory is available at a similar price, or that the JEDEC speeds can be prohibitive for performance. While these comments make sense, ultimately very few users apply memory profiles (either XMP or other) as they require interaction with the BIOS, and most users will fall back on JEDEC supported speeds - this includes home users as well as industry who might want to shave off a cent or two from the cost or stay within the margins set by the manufacturer. Where possible, we will extend out testing to include faster memory modules either at the same time as the review or a later date.
| Test Setup | |
| Processor | Intel Core i3-7350K (ES, Retail Stepping), 60W, $157 2 Cores, 4 Threads, 4.2 GHz |
| Motherboards | MSI Z270 Gaming M7 |
| Cooling | Cooler Master Nepton 140XL |
| Power Supply | OCZ 1250W Gold ZX Series Corsair AX1200i Platinum PSU |
| Memory | G.Skill Ripjaws 4 DDR4-2400 C15 2x16 GB 1.2V |
| Memory Settings | DDR4-2400 C15 |
| Video Cards | ASUS GTX 980 Strix 4GB MSI R9 290X Gaming 8GB ASUS R7 240 2GB |
| Hard Drive | Crucial MX200 1TB |
| Optical Drive | LG GH22NS50 |
| Case | Open Test Bed |
| Operating System | Windows 7 64-bit SP1 |
Readers of our reviews will have noted the trend in modern motherboards to implement a form of MultiCore Enhancement / Acceleration / Turbo (read our report here) on their motherboards. This does several things, including better benchmark results at stock settings (not entirely needed if overclocking is an end-user goal) at the expense of heat and temperature. It also gives an automatic overclock which may be against what the user wants. Our testing methodology is ‘out-of-the-box’, with the latest public BIOS installed and XMP enabled, and thus subject to the whims of this feature. It is ultimately up to the motherboard manufacturer to take this risk – and manufacturers taking risks in the setup is something they do on every product (think C-state settings, USB priority, DPC Latency / monitoring priority, overriding memory sub-timings at JEDEC). Processor speed change is part of that risk, and ultimately if no overclocking is planned, some motherboards will affect how fast that shiny new processor goes and can be an important factor in the system build.
Many thanks to...
We must thank the following companies for kindly providing hardware for our multiple test beds. Some of this hardware is not in this test bed specifically, but is used in other testing.
Thank you to AMD for providing us with the R9 290X 4GB GPUs. These are MSI branded 'Gaming' models, featuring MSI's Twin Frozr IV dual-fan cooler design and military class components. Bundled with the cards is MSI Afterburner for additional overclocking, as well as MSI's Gaming App for easy frequency tuning.
The R9 290X is a second generation GCN card from AMD, under the Hawaii XT codename, and uses their largest Sea Islands GPU die at 6.2 billion transistors at 438mm2 built at TSMC using a 28nm process. For the R9 290X, that means 2816 streaming processors with 64 ROPs using a 512-bit memory bus to GDDR5 (4GB in this case). The official power rating for the R9 290X is 250W.
The MSI R9 290X Gaming 4G runs the core at 1000 MHz to 1040 MHz depending on what mode it is in (Silent, Gaming or OC), and the memory at 5 GHz. Displays supported include one DisplayPort, one HDMI 1.4a, and two dual-link DVI-D connectors.
Further Reading: AnandTech's AMD R9 290X Review
Thank you to ASUS for providing us with GTX 980 Strix GPUs. At the time of release, the STRIX brand from ASUS was aimed at silent running, or to use the marketing term: '0dB Silent Gaming'. This enables the card to disable the fans when the GPU is dealing with low loads well within temperature specifications. These cards equip the GTX 980 silicon with ASUS' Direct CU II cooler and 10-phase digital VRMs, aimed at high-efficiency conversion. Along with the card, ASUS bundles GPU Tweak software for overclocking and streaming assistance.
The GTX 980 uses NVIDIA's GM204 silicon die, built upon their Maxwell architecture. This die is 5.2 billion transistors for a die size of 298 mm2, built on TMSC's 28nm process. A GTX 980 uses the full GM204 core, with 2048 CUDA Cores and 64 ROPs with a 256-bit memory bus to GDDR5. The official power rating for the GTX 980 is 165W.
The ASUS GTX 980 Strix 4GB (or the full name of STRIX-GTX980-DC2OC-4GD5) runs a reasonable overclock over a reference GTX 980 card, with frequencies in the range of 1178-1279 MHz. The memory runs at stock, in this case 7010 MHz. Video outputs include three DisplayPort connectors, one HDMI 2.0 connector and a DVI-I.
Further Reading: AnandTech's NVIDIA GTX 980 Review
Thank you to Cooler Master for providing us with Nepton 140XL CLCs. The Nepton 140XL is Cooler Master's largest 'single' space radiator liquid cooler, and combines with dual 140mm 'JetFlo' fans designed for high performance, from 0.7-3.5mm H2O static pressure. The pump is also designed to be faster, more efficient, and uses thicker pipes to assist cooling with a rated pump noise below 25 dBA. The Nepton 140XL comes with mounting support for all major sockets, as far back as FM1, AM2 and 775.
Further Reading: AnandTech's Cooler Master Nepton 140XL Review
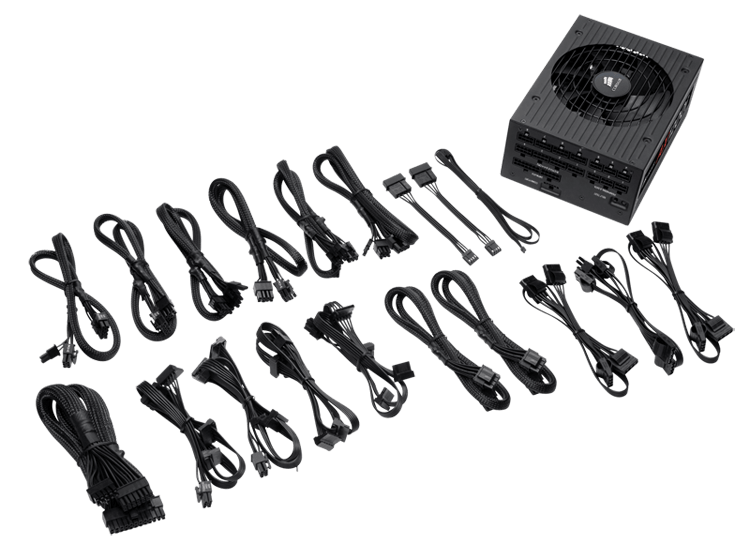
Thank you to Corsair for providing us with an AX1200i PSU. The AX1200i was the first power supply to offer digital control and management via Corsair's Link system, but under the hood it commands a 1200W rating at 50C with 80 PLUS Platinum certification. This allows for a minimum 89-92% efficiency at 115V and 90-94% at 230V. The AX1200i is completely modular, running the larger 200mm design, with a dual ball bearing 140mm fan to assist high-performance use. The AX1200i is designed to be a workhorse, with up to 8 PCIe connectors for suitable four-way GPU setups. The AX1200i also comes with a Zero RPM mode for the fan, which due to the design allows the fan to be switched off when the power supply is under 30% load.
Further Reading: AnandTech's Corsair AX1500i Power Supply Review
Thank you to Crucial for providing us with MX200 SSDs. Crucial stepped up to the plate as our benchmark list grows larger with newer benchmarks and titles, and the 1TB MX200 units are strong performers. Based on Marvell's 88SS9189 controller and using Micron's 16nm 128Gbit MLC flash, these are 7mm high, 2.5-inch drives rated for 100K random read IOPs and 555/500 MB/s sequential read and write speeds. The 1TB models we are using here support TCG Opal 2.0 and IEEE-1667 (eDrive) encryption and have a 320TB rated endurance with a three-year warranty.
Further Reading: AnandTech's Crucial MX200 (250 GB, 500 GB & 1TB) Review

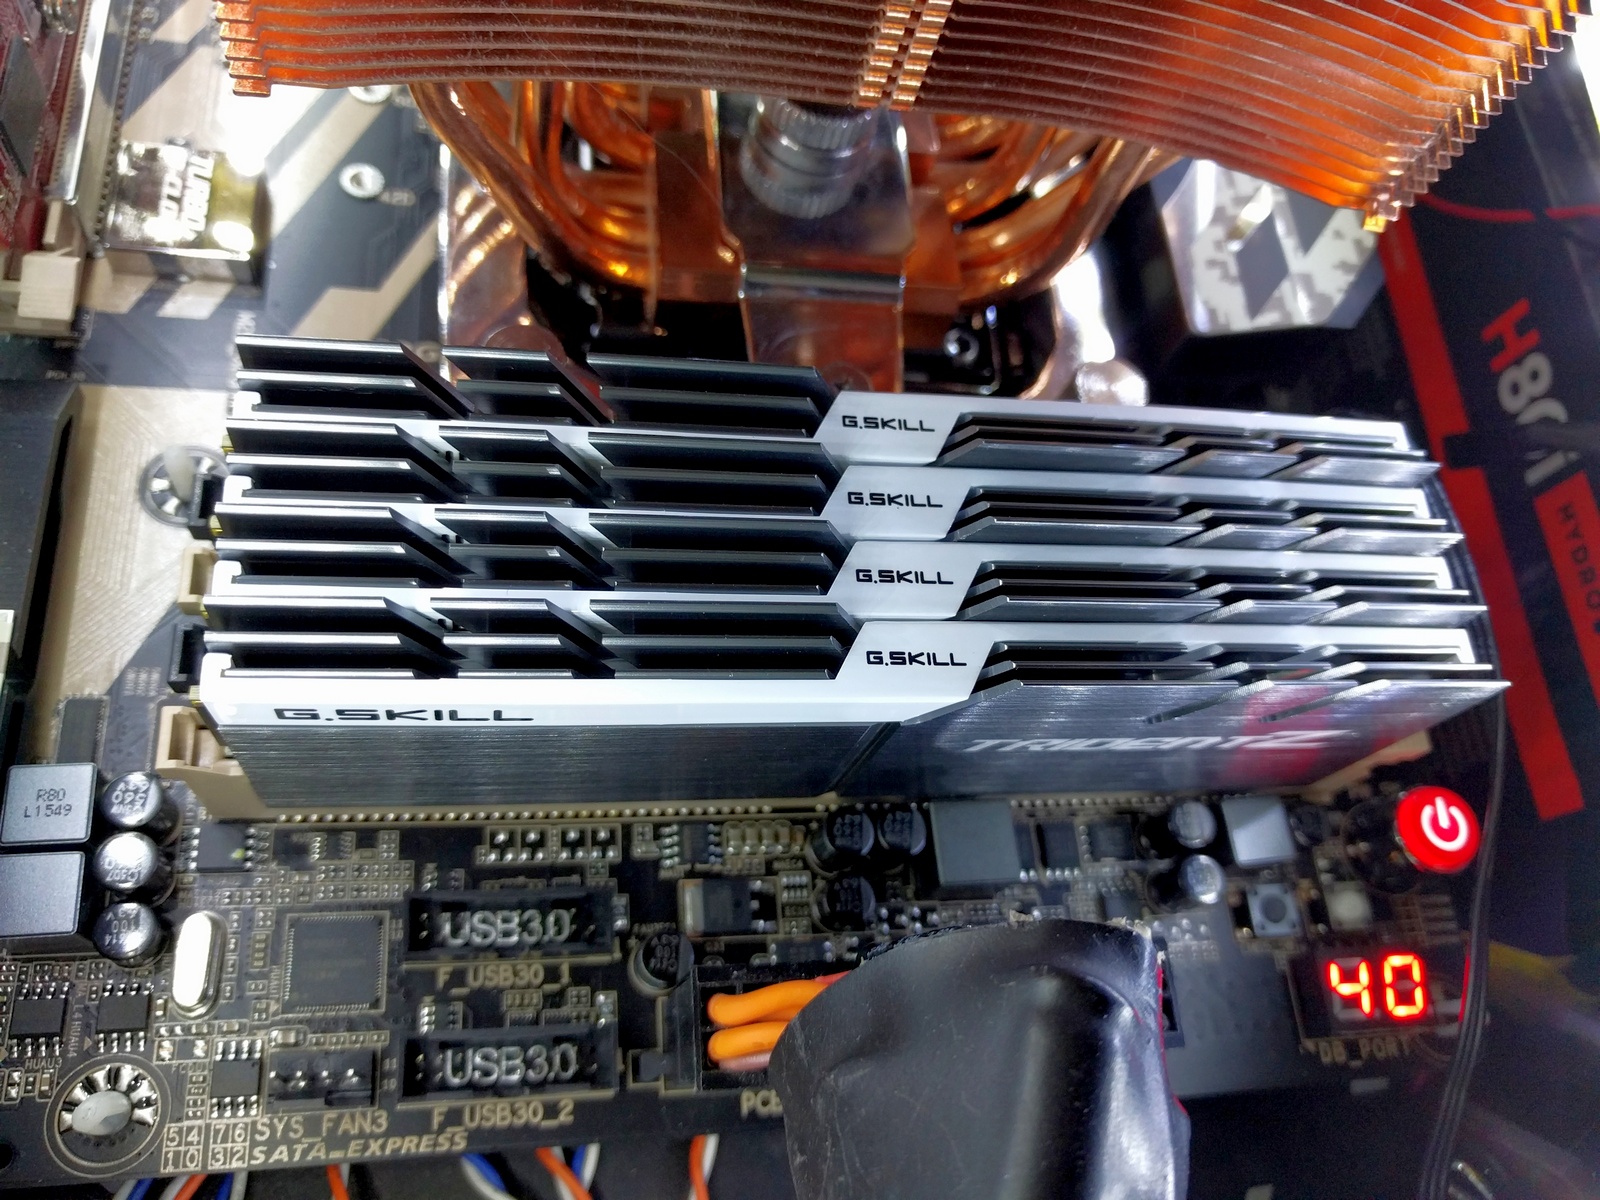
Thank you to G.Skill for providing us with memory. G.Skill has been a long-time supporter of AnandTech over the years, for testing beyond our CPU and motherboard memory reviews. We've reported on their high capacity and high-frequency kits, and every year at Computex G.Skill holds a world overclocking tournament with liquid nitrogen right on the show floor. One of the most recent deliveries from G.Skill was their 4x16 GB DDR4-3200 C14 Kit, which we are planning for an upcoming review.
Further Reading: AnandTech's Memory Scaling on Haswell Review, with G.Skill DDR3-3000
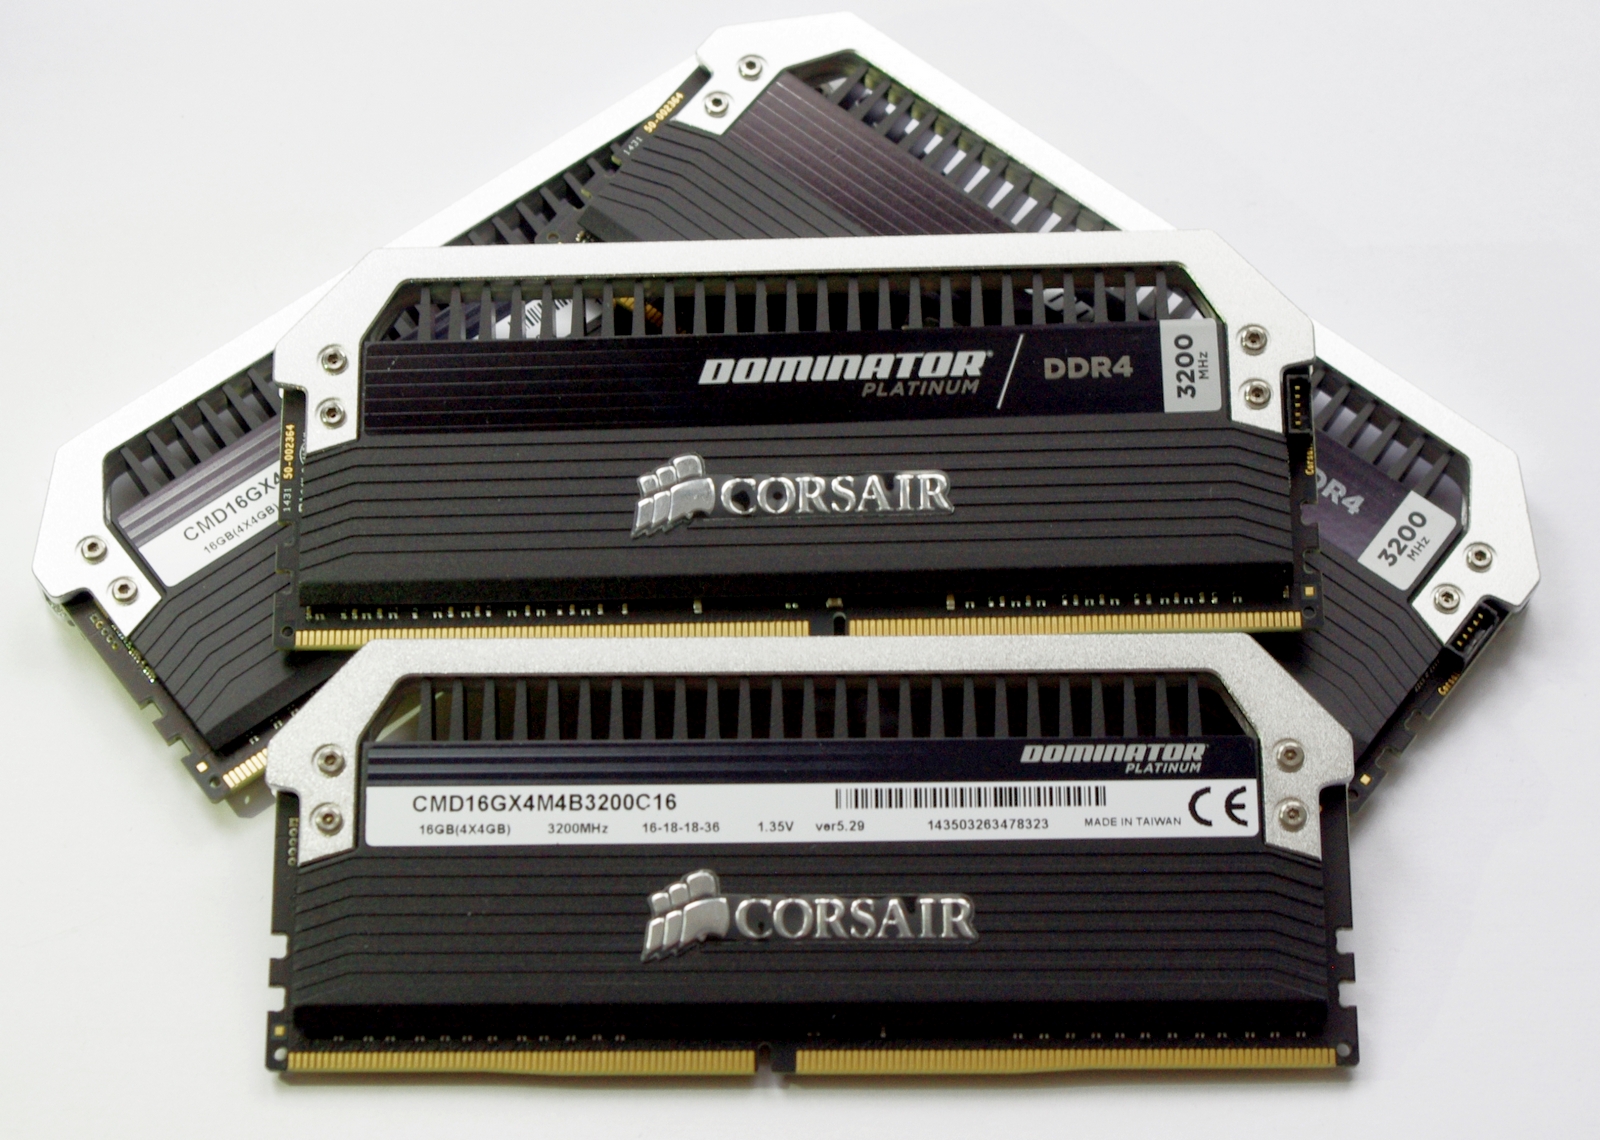
Thank you to Corsair for providing us with memory. Similarly, Corsair (along with PSUs) is also a long-time supporter of AnandTech. Being one of the first vendors with 16GB modules for DDR4 was a big deal, and now Corsair is re-implementing LEDs back on its memory after a long hiatus along with supporting specific projects such as ASUS ROG versions of the Dominator Platinum range. We're currently looking at our review pipeline to see when our next DRAM round-up will be, and Corsair is poised to participate.
Further Reading: AnandTech's Memory Scaling on Haswell-E Review
Office Performance
The dynamics of CPU Turbo modes, both Intel and AMD, can cause concern during environments with a variable threaded workload. There is also an added issue of the motherboard remaining consistent, depending on how the motherboard manufacturer wants to add in their own boosting technologies over the ones that Intel would prefer they used. In order to remain consistent, we implement an OS-level unique high-performance mode on all the CPUs we test which should override any motherboard manufacturer performance mode.
All of our benchmark results can also be found in our benchmark engine, Bench.
Dolphin Benchmark: link
Many emulators are often bound by single thread CPU performance, and general reports tended to suggest that Haswell provided a significant boost to emulator performance. This benchmark runs a Wii program that ray traces a complex 3D scene inside the Dolphin Wii emulator. Performance on this benchmark is a good proxy of the speed of Dolphin CPU emulation, which is an intensive single core task using most aspects of a CPU. Results are given in minutes, where the Wii itself scores 17.53 minutes.
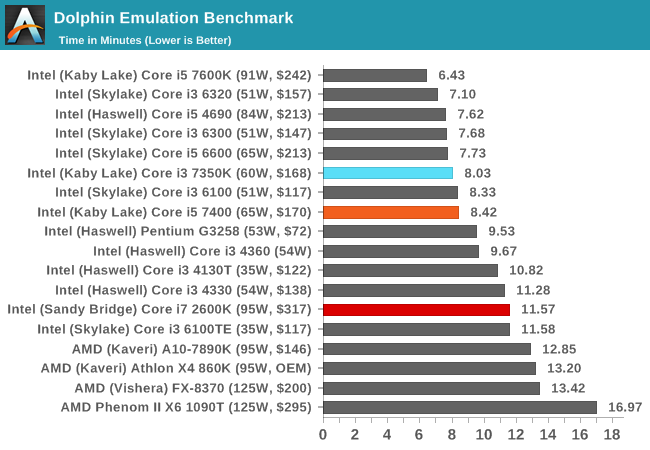
The 7350K, with a high single thread frequency, easily surpasses the i5 and i7-2600K here. That being said, there's a slight difference to the Skylake i3, perhaps down to various generation specific code differences.
WinRAR 5.0.1: link
Our WinRAR test from 2013 is updated to the latest version of WinRAR at the start of 2014. We compress a set of 2867 files across 320 folders totaling 1.52 GB in size – 95% of these files are small typical website files, and the rest (90% of the size) are small 30 second 720p videos.
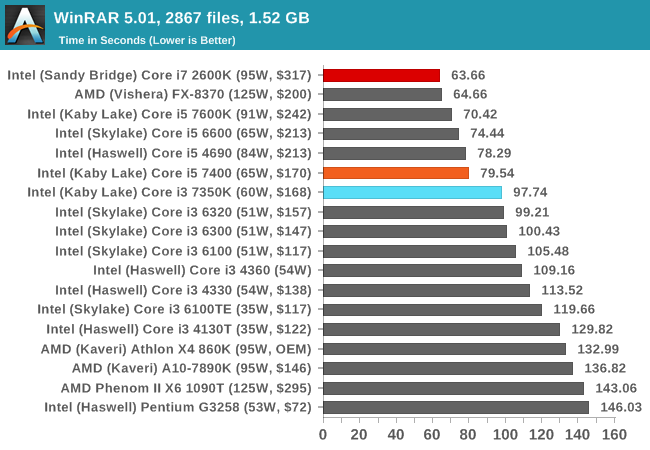
WinRAR is more geared towards a variable threaded environment but also memory speed. The fact that the Core i5 is above the Core i3 shows that having actual cores helps, regardless of frequency - the additional hyperthreads for the Core i7-2600K also gives it the win, despite the memory frequency difference.
3D Particle Movement v2
3DPM is a self-penned benchmark, taking basic 3D movement algorithms used in Brownian Motion simulations and testing them for speed. High floating point performance, MHz and IPC wins the day. This is the second variant of this benchmark, fixing for false sharing in the first version, and lending itself to better multithreaded performance.
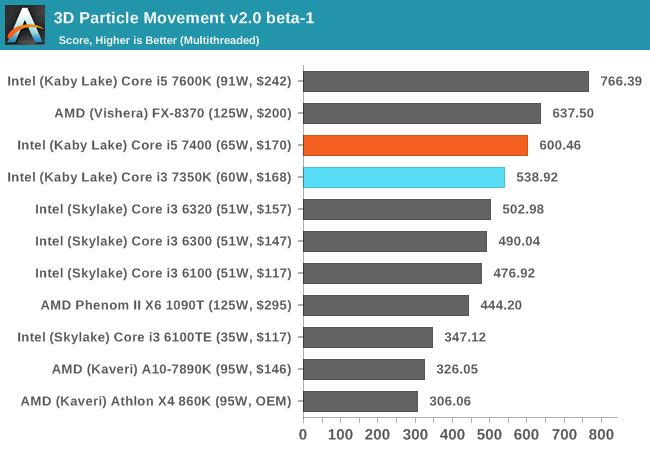
3DPMv2 is still new, so we don’t have too many results for it so far - but again this is another situation where having actual cores helps. This is typically when the threads are 'heavy', i.e. spill out into various caches and require more than 1/2 the cache shared within a core each. In the case of the Kaby Lake, this means that each core has 32KB of L1 - or 32KB per thread for the i5 but only 16KB per thread in the i3.
SYSMark 2014
Engineered by BAPco (to which Intel is a consortium member), this set of tests are designed to be an office/data/media/financial range of tests using common well-known CAD, image editing, web browsing and other tools to put out a score, where a score of 1000 is attributed to an old Core i3 using a mechanical harddrive. Here we report the overall score, however the test breakdowns can be found in Bench.
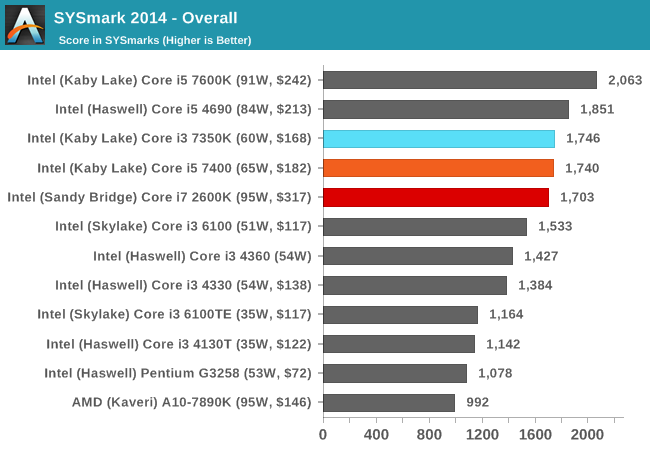
Because SYSMark is a variety of tests that rely on response and throughput, here is where the Core i3 comes into play over the i5 and i7-2600K. With the i5 it's about equal, but the years of IPC increases put the i7-2600K now behind the Kaby i3.
Web Benchmarks
On the lower end processors, general usability is a big factor of experience, especially as we move into the HTML5 era of web browsing. For our web benchmarks, we take well-known tests with Chrome as installed by SYSMark as a consistent browser.
Mozilla Kraken 1.1
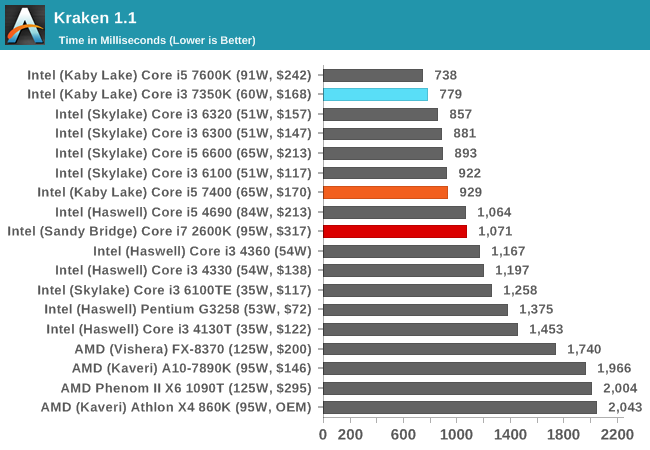
Kraken favors high frequency and IPC, so the i3 takes a large lead over the i7-2600K for this sort of workload.
Professional Performance: Windows
Agisoft Photoscan – 2D to 3D Image Manipulation: link
Agisoft Photoscan creates 3D models from 2D images, a process which is very computationally expensive. The algorithm is split into four distinct phases, and different phases of the model reconstruction require either fast memory, fast IPC, more cores, or even OpenCL compute devices to hand. Agisoft supplied us with a special version of the software to script the process, where we take 50 images of a stately home and convert it into a medium quality model. This benchmark typically takes around 15-20 minutes on a high-end PC on the CPU alone, with GPUs reducing the time.
Here we report the overall time to complete the test – sub-test results can be found in Bench.
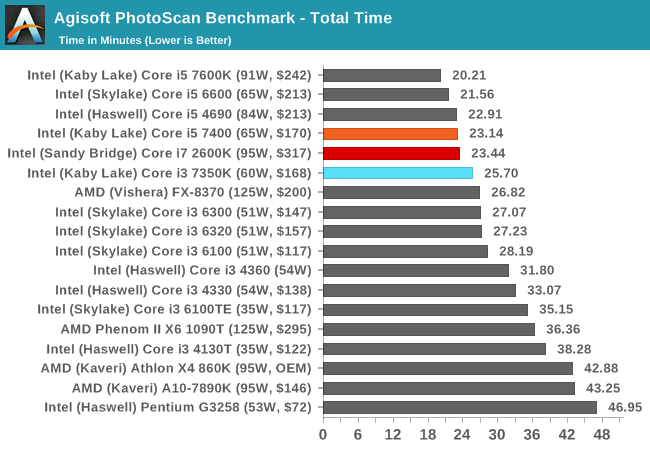
Photoscan is a mix of single and multi-threaded segments, but overall the extra cores in the i5/i7 beat the Core i3, but not by much.
Cinebench R15
Cinebench is a benchmark based around Cinema 4D, and is fairly well known among enthusiasts for stressing the CPU for a provided workload. Results are given as a score, where higher is better.
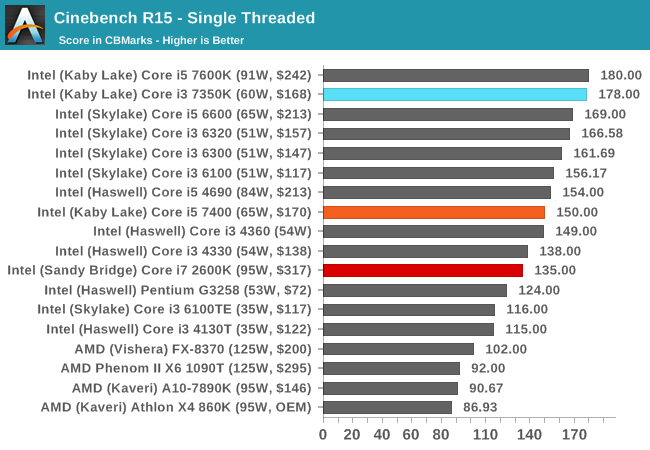
All the Kaby Lake processors seem to do well in CB15 single threaded performance, given that all the K-processors can reach 4.2 GHz or higher one way or another. Nonetheless, the age of the Core i7-2600K is showing here.
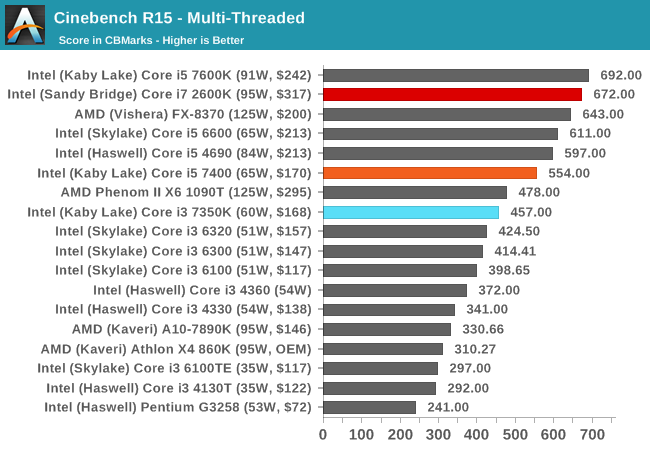
Turning the tables with actual cores, and the Core i7-2600K gets a significant leg up here. The Core i5 also sits above the Core i3.
HandBrake v0.9.9: link
For HandBrake, we take two videos (a 2h20 640x266 DVD rip and a 10min double UHD 3840x4320 animation short) and convert them to x264 format in an MP4 container. Results are given in terms of the frames per second processed, and HandBrake uses as many threads as possible.
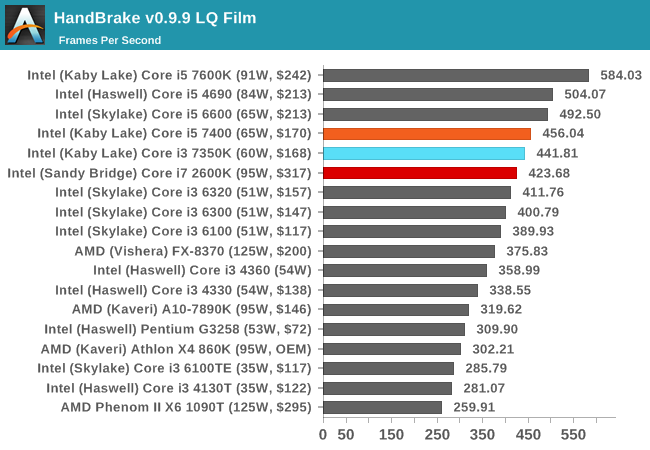
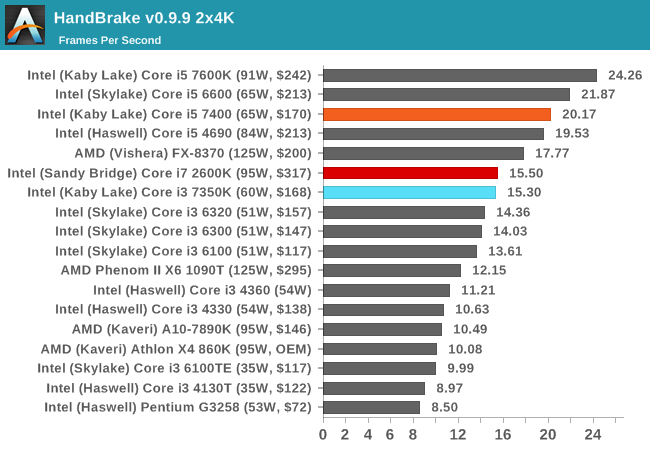
For video conversion, having small frames puts all three CPUs in a similar spot. But ramp up the frame size and we see the Kaby Lake i5 pull ahead due to IPC and instructions. The Core i3 has enough oomph to match the extra threads on the Core i7-2600K though.
Hybrid x265
Hybrid is a new benchmark, where we take a 4K 1500 frame video and convert it into an x265 format without audio. Results are given in frames per second.
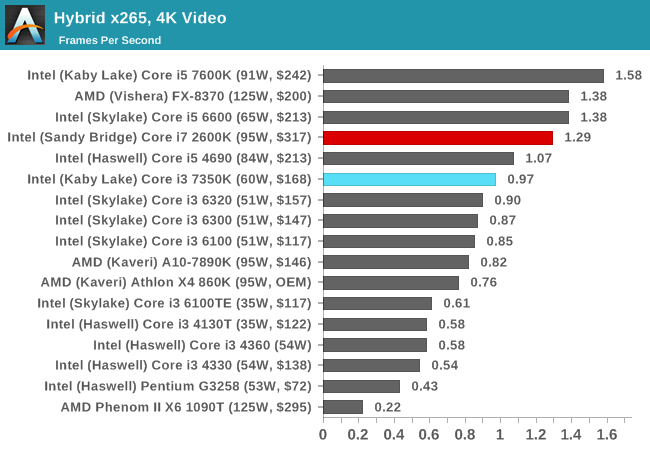
With a different video conversion tool and render, the extra cores and threads of the Core i7 is more than enough to give it a 30% advantage over the Core i3-7350K. It makes me wonder if another +30% frequency would help the Core i3.
Legacy and Synthetic Tests
At AnandTech, I’ve taken somewhat of a dim view to pure synthetic tests, as they fail to be relatable. Nonetheless, our benchmark database spans to a time when that is all we had! We take a few of these tests for a pin with the latest hardware.
Cinebench R10
The R10 version of Cinebench is one of our oldest benchmarks, with data going back more than a few generations. The benchmark is similar to that of the newest R15 version, albeit with a simpler render target and a different strategy for multithreading.
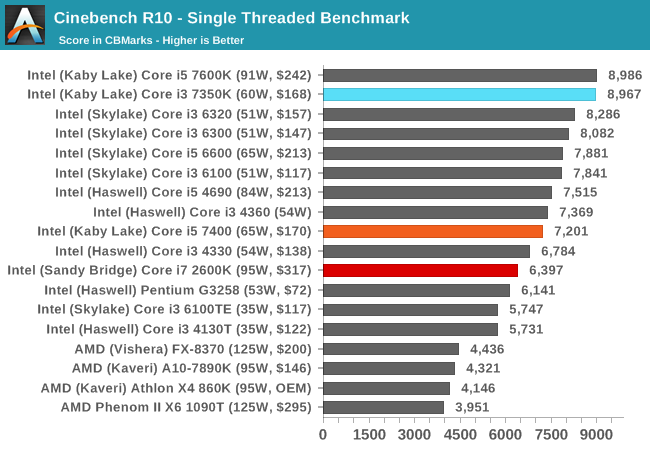
With high frequency in tow, the Core i3-7350K makes its mark.
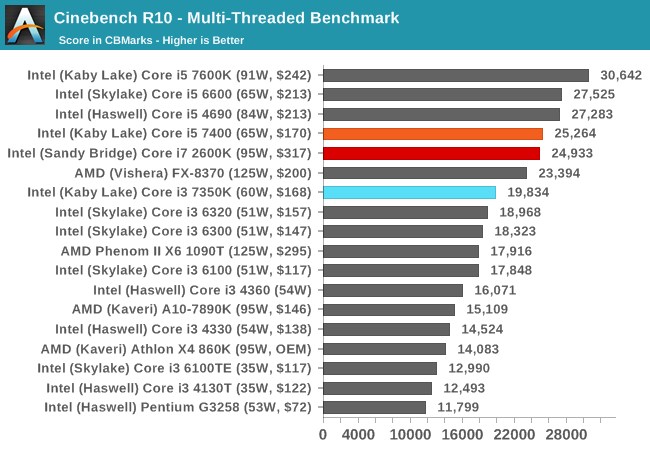
When more threads come to play, the Core i5-7400 and Core i7-2600K battle it out in terms of four cores and IPC vs hyperthreading. The Core i3-7350K sits around ~25% behind.
Cinebench R11.5
CB11.5 has been popular for many years as a performance test, using easy to read and compare numbers that aren’t in the 1000s. We run the benchmark in an automated fashion three times in single-thread and multi-thread mode and take the average of the results.
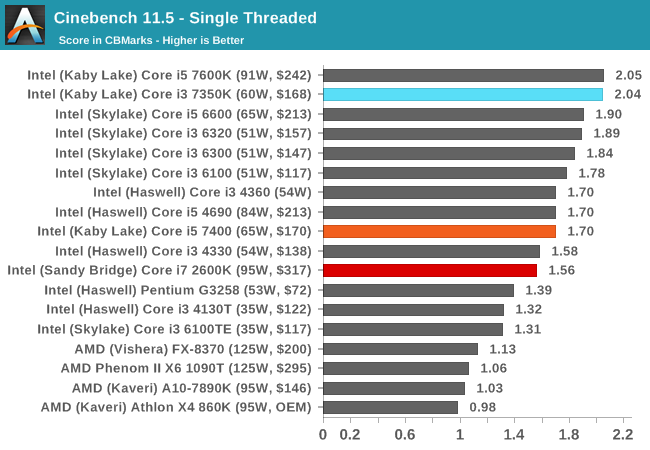

Similar to CB10, the single thread results show that a 4.2 GHz Kaby Lake is nothing to be sniffed at. In the multithreaded test, CB11.5 is more able to leverage the hyperthreads, showing that a Core i7-2600K will run rings around the low end Kaby i5, but is bested by the higher frequency Kaby i5-K. The Core i3 still has that dual core deficit.
7-zip
As an open source compression/decompression tool, 7-zip is easy to test and features a built-in benchmark to measure performance. As a utility, similar to WinRAR, high thread counts, frequency and UPC typically win the day here.
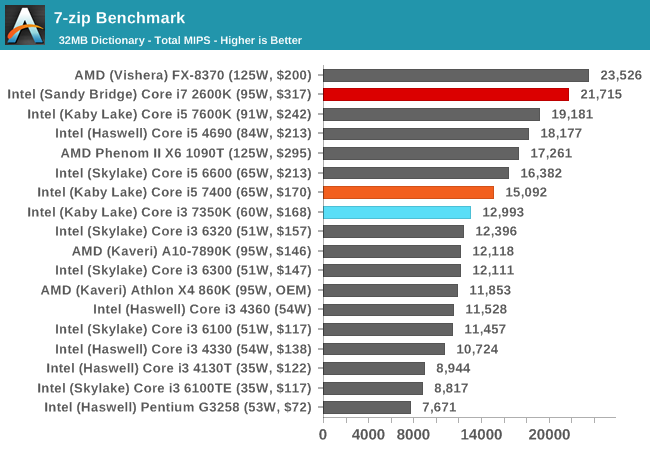
The difference between the i3-7350K and the i5-7400 shows that 7-zip prefers cores over threads, but the Core i7-2600K results show it can use both to good effect, even on older microarchitectures, scoring almost double the i3-7350K.
POV-Ray
Ray-tracing is a typical multithreaded test, with each ray being a potential thread in its own right ensuring that a workload can scale in complexity easily. This lends itself to cores, frequency and IPC: the more, the better.
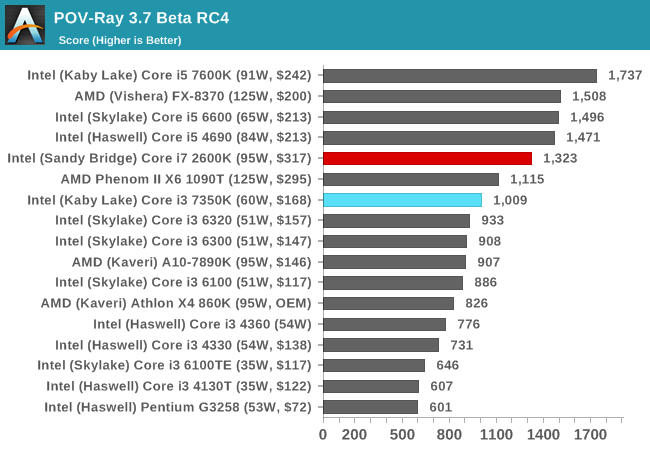
POV-Ray is a benchmark that is usually touted as liking high IPC, high frequency and more threads. The i7-2600K, despite having double the resources of the Core i3-7350K, is only 30% ahead.
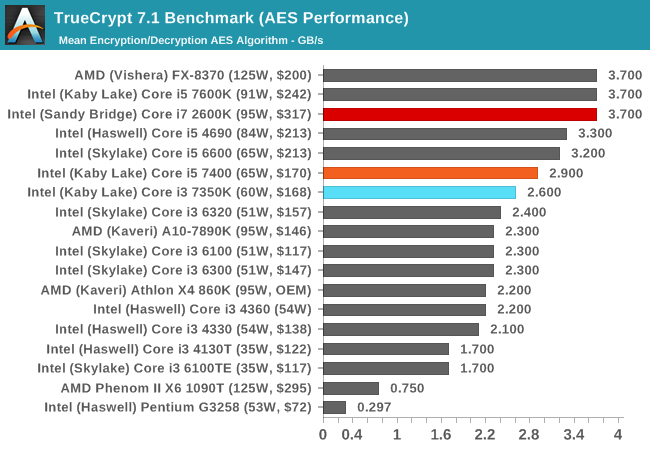
AES via TrueCrypt
Despite TrueCrypt no longer being maintained, the final version incorporates a good test to measure different encryption methodologies as well as encryption combinations. When TrueCrypt was in full swing, the introduction of AES accelerated hardware dialed the performance up a notch, however most of the processors (save the Pentiums/Celerons) now support this and get good speed. The built-in TrueCrypt test does a mass encryption on in-memory data, giving results in GB/s.
Alien: Isolation
If first person survival mixed with horror is your sort of thing, then Alien: Isolation, based off of the Alien franchise, should be an interesting title. Developed by The Creative Assembly and released in October 2014, Alien: Isolation has won numerous awards from Game Of The Year to several top 10s/25s and Best Horror titles, ratcheting up over a million sales by February 2015. Alien: Isolation uses a custom built engine which includes dynamic sound effects and should be fully multi-core enabled.

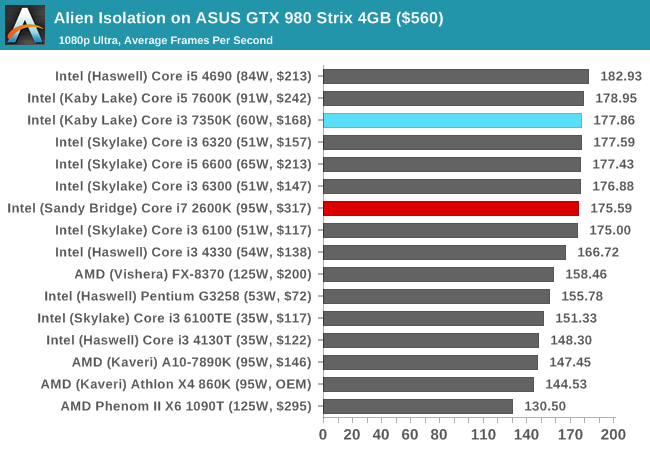
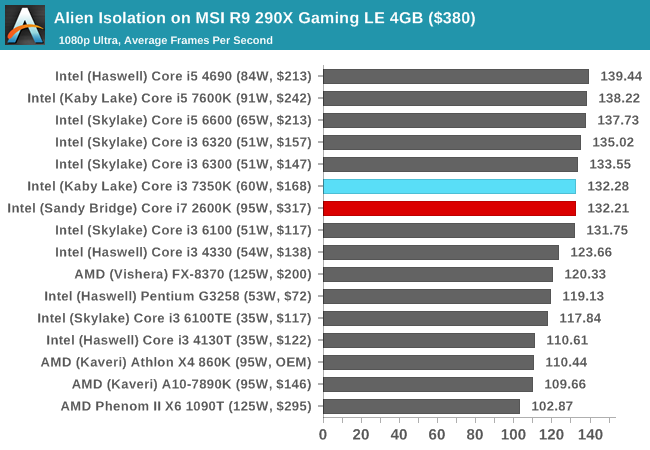
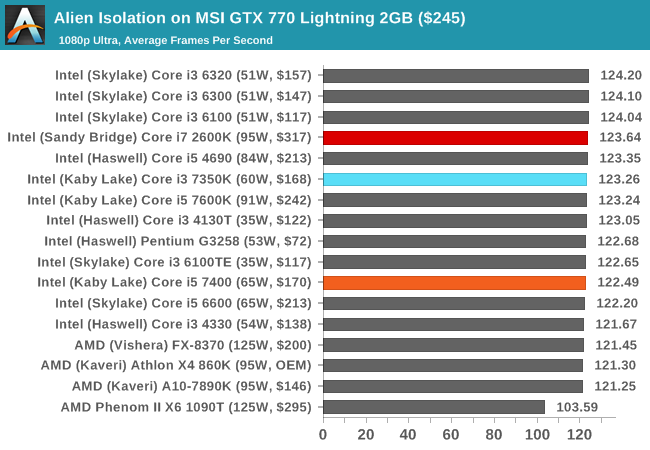
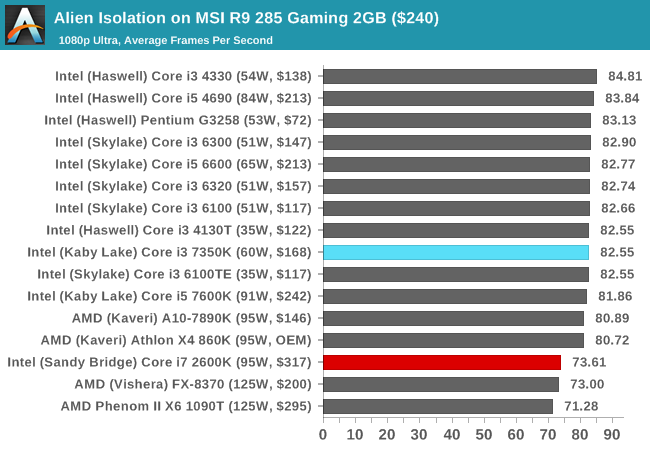
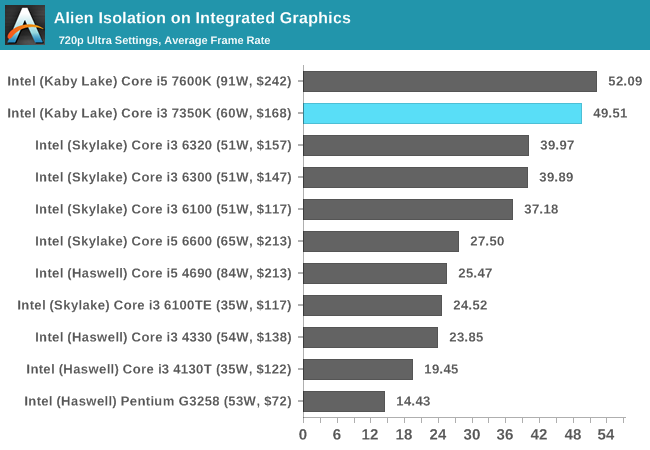
Aside from a small dip by the Core i7-2600K when using the R9 285, the i3-7350K matches the other CPUs in Alien Isolation.
Total War: Attila
The Total War franchise moves on to Attila, another The Creative Assembly development, and is a stand-alone strategy title set in 395AD where the main story line lets the gamer take control of the leader of the Huns in order to conquer parts of the world. Graphically the game can render hundreds/thousands of units on screen at once, all with their individual actions and can put some of the big cards to task.
For low end graphics, we test at 720p with performance settings, recording the average frame rate. With mid and high range graphics, we test at 1080p with the quality setting. In both circumstances, unlimited video memory is enabled and the in-game scripted benchmark is used.

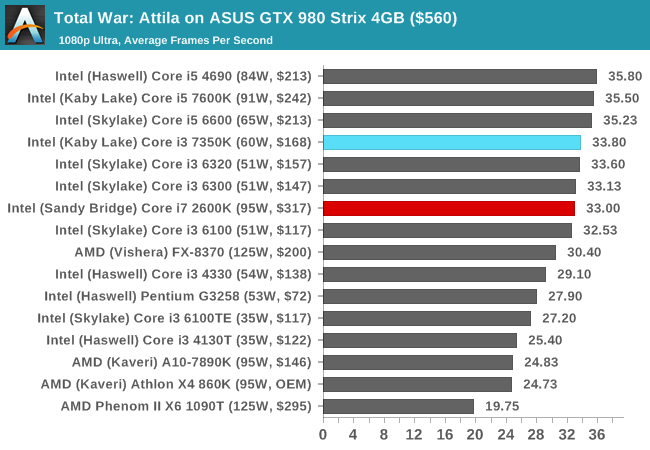
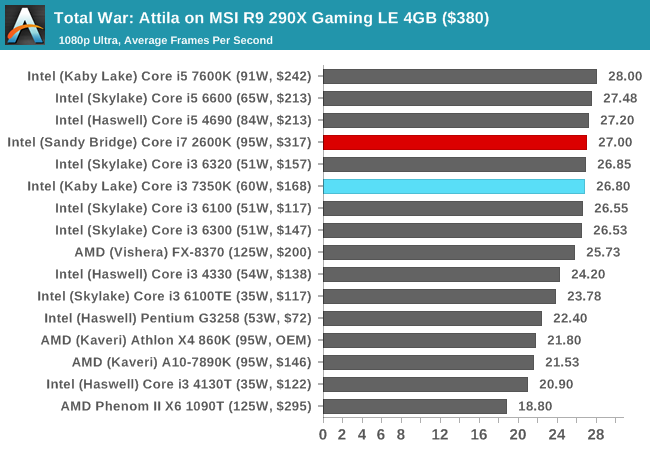
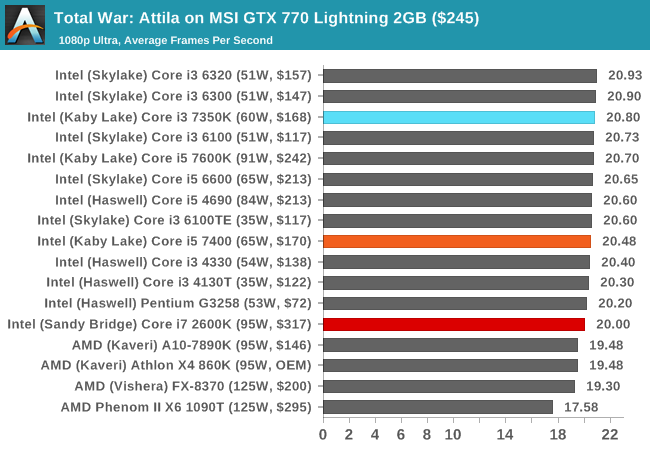
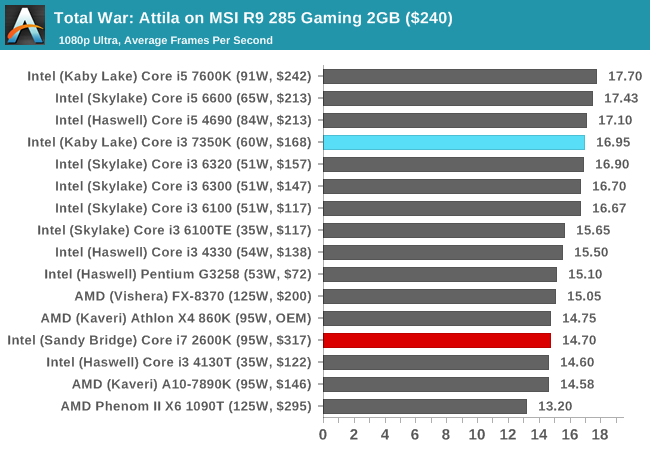
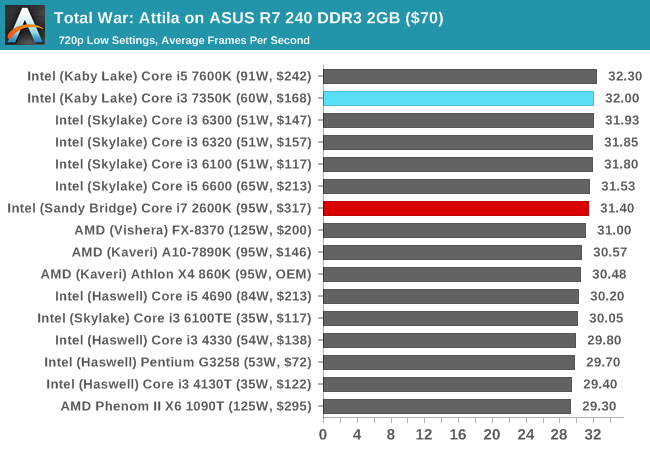
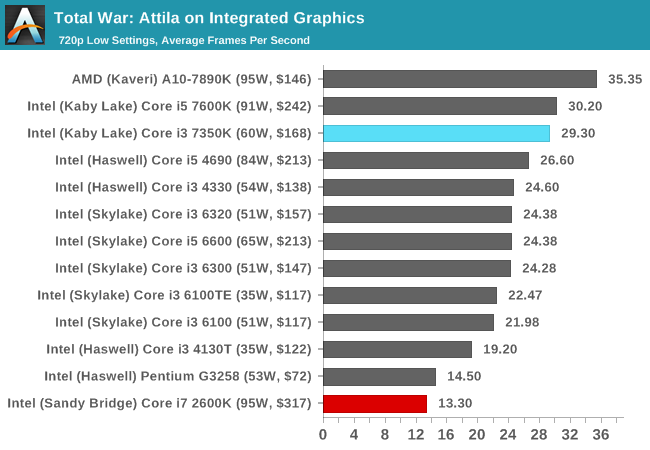
Similar to Alien Isolation, the only discrete GPU there seems to be much of a difference between the i3 and i7 is on the R9 285, where the newer microarchitecture has the advantage. The integrated graphics in Sandy Bridge were laughable, and the Core i3 offers over double the performance here.
Grand Theft Auto V
The highly anticipated iteration of the Grand Theft Auto franchise finally hit the shelves on April 14th 2015, with both AMD and NVIDIA in tow to help optimize the title. GTA doesn’t provide graphical presets, but opens up the options to users and extends the boundaries by pushing even the hardest systems to the limit using Rockstar’s Advanced Game Engine. Whether the user is flying high in the mountains with long draw distances or dealing with assorted trash in the city, when cranked up to maximum it creates stunning visuals but hard work for both the CPU and the GPU.
For our test we have scripted a version of the in-game benchmark, relying only on the final part which combines a flight scene along with an in-city drive-by followed by a tanker explosion. For low end systems we test at 720p on the lowest settings, whereas mid and high end graphics play at 1080p with very high settings across the board. We record both the average frame rate and the percentage of frames under 60 FPS (16.6ms).

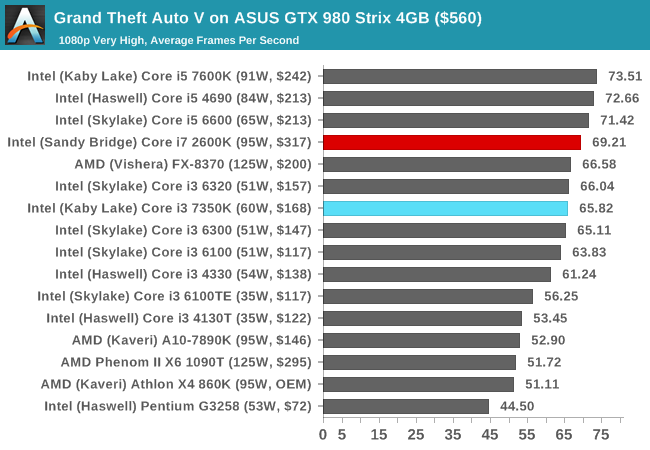
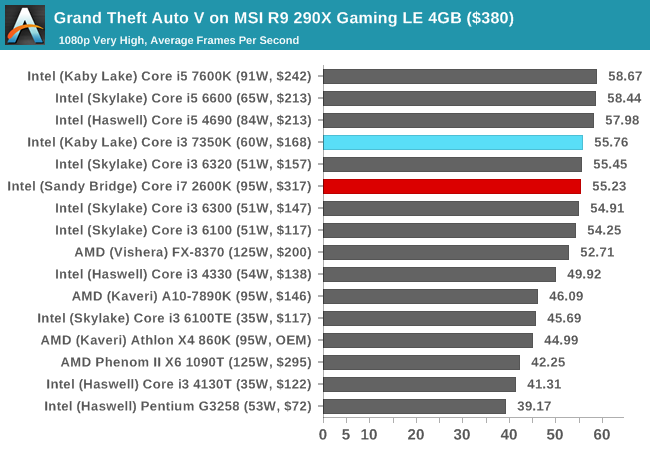
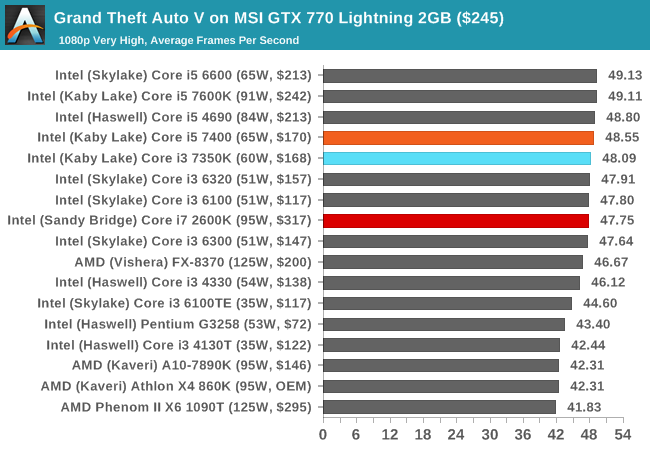
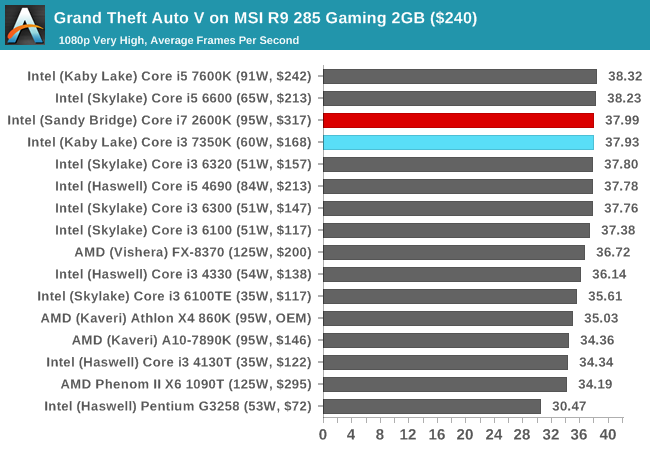
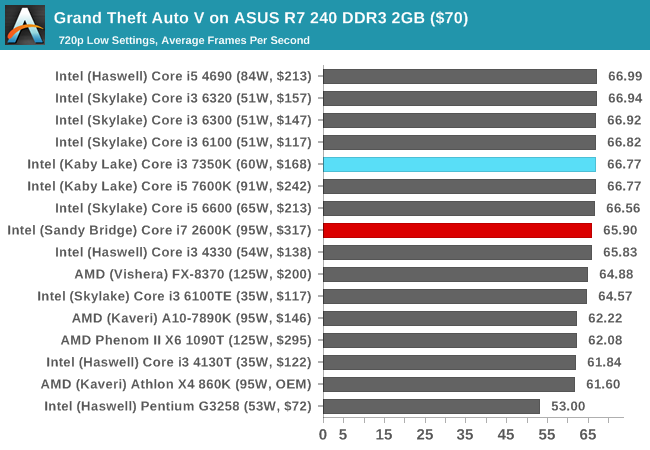
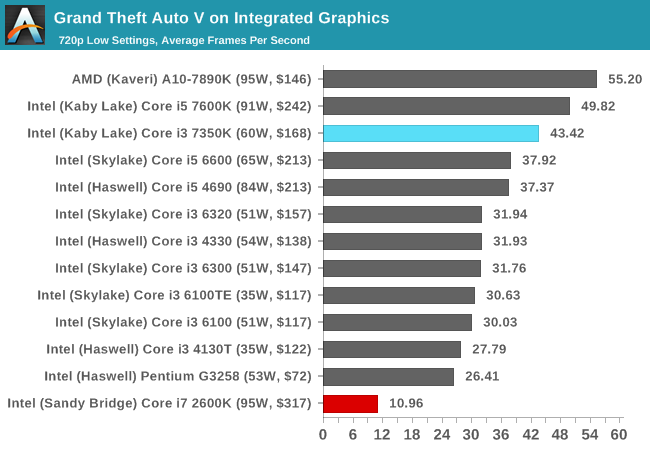
The older Core i7-2600K eeks out a small ~5 FPS advantage over the Core i3 when running a GTX 980 at 1080p maximum settings, but with all other GPUs the differences are minimal. With integrated graphics, the Core i3 shows it can pummel the older IGP into the ground.
GRID Autosport
No graphics tests are complete without some input from Codemasters and the EGO engine, which means for this round of testing we point towards GRID: Autosport, the next iteration in the GRID and racing genre. As with our previous racing testing, each update to the engine aims to add in effects, reflections, detail and realism, with Codemasters making ‘authenticity’ a main focal point for this version.
GRID’s benchmark mode is very flexible, and as a result we created a test race using a shortened version of the Red Bull Ring with twelve cars doing two laps. The car is focus starts last and is quite fast, but usually finishes second or third. For low-end graphics we test at 1080p medium settings, whereas mid and high-end graphics get the full 1080p maximum. Both the average and minimum frame rates are recorded.

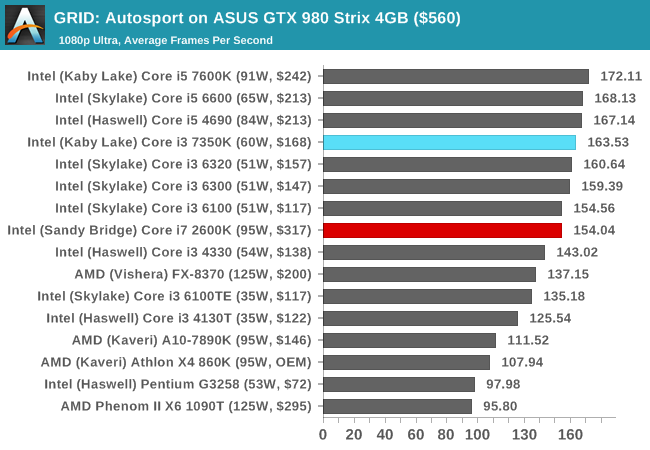
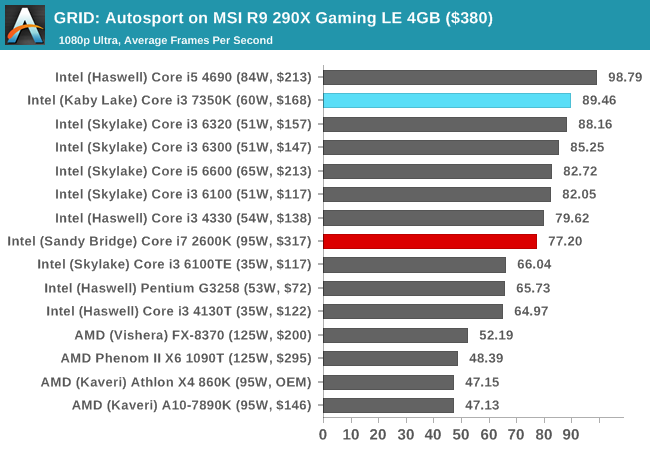
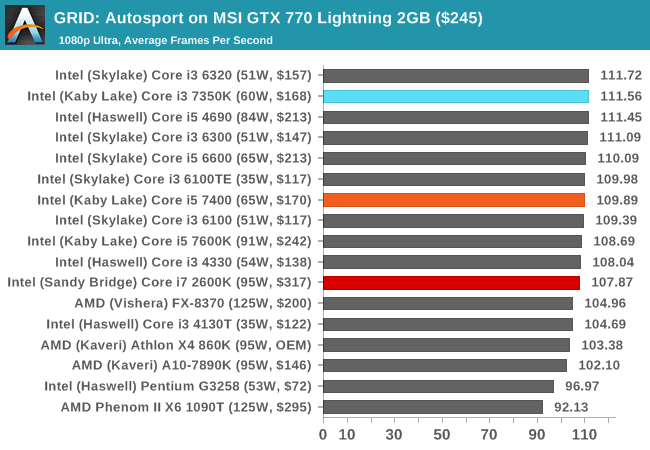
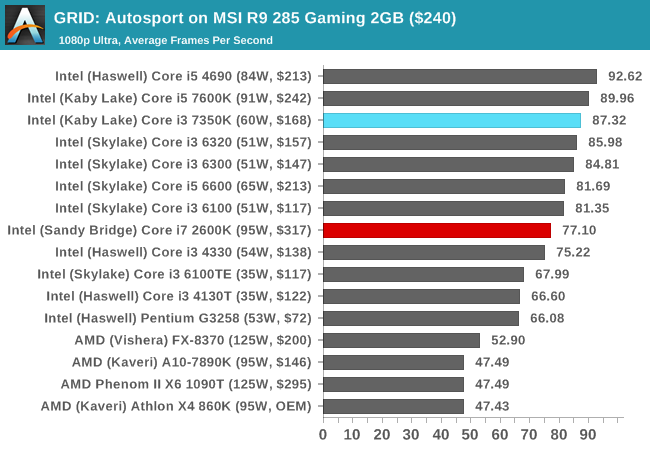
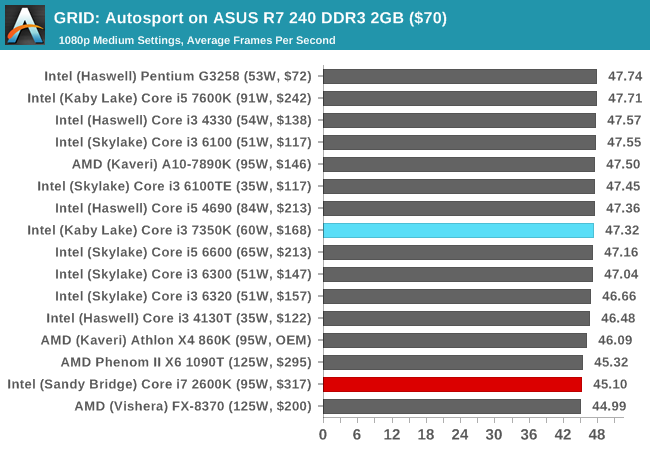
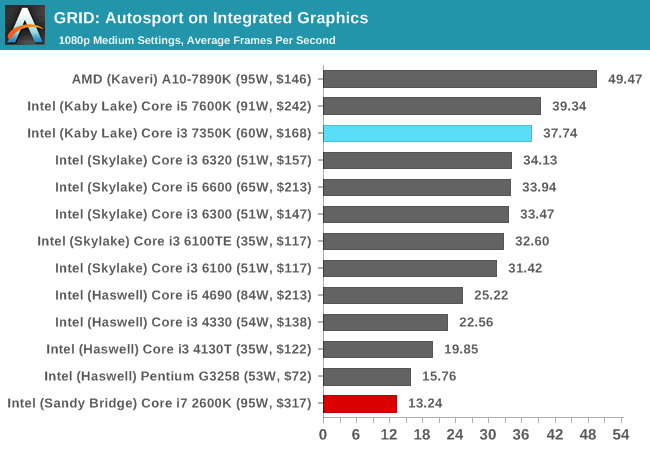
GRID prefers a high frequency and high IPC, and so we see the Core i3-7350K getting noticably better frame rates over the 2600K at 1080p using all our high-end and mid-range GPUs - only at 720p using an R7 240 did we see a minimal difference. The integrated graphs are still amusing to look at.
Shadow of Mordor
The final title in our testing is another battle of system performance with the open world action-adventure title, Shadow of Mordor. Produced by Monolith using the LithTech Jupiter EX engine and numerous detail add-ons, SoM goes for detail and complexity to a large extent, despite having to be cut down from the original plans. The main story itself was written by the same writer as Red Dead Redemption, and it received Zero Punctuation’s Game of The Year in 2014.
For testing purposes, SoM gives a dynamic screen resolution setting, allowing us to render at high resolutions that are then scaled down to the monitor. As a result, we get several tests using the in-game benchmark. For low-end graphics we examine at 720p with low settings, whereas mid and high-end graphics get 1080p Ultra. The top graphics test is also redone at 3840x2160, also with Ultra settings, and we also test two cards at 4K where possible.

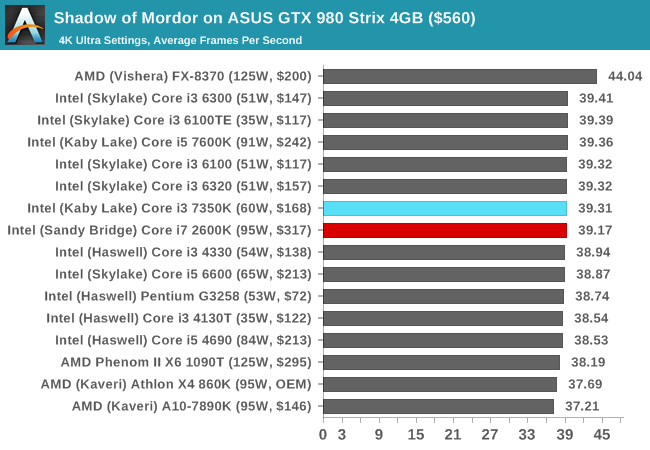
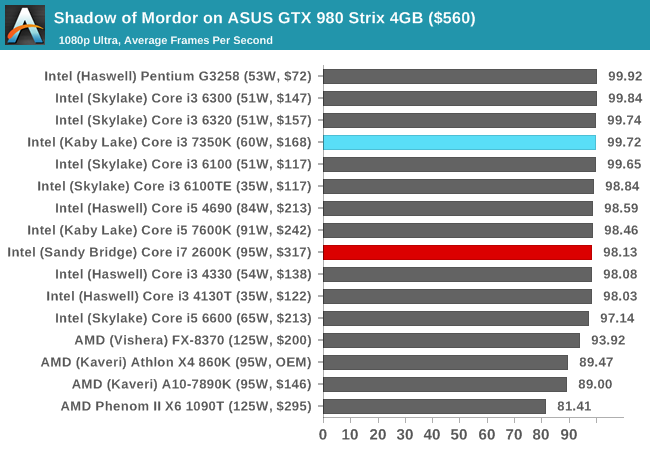
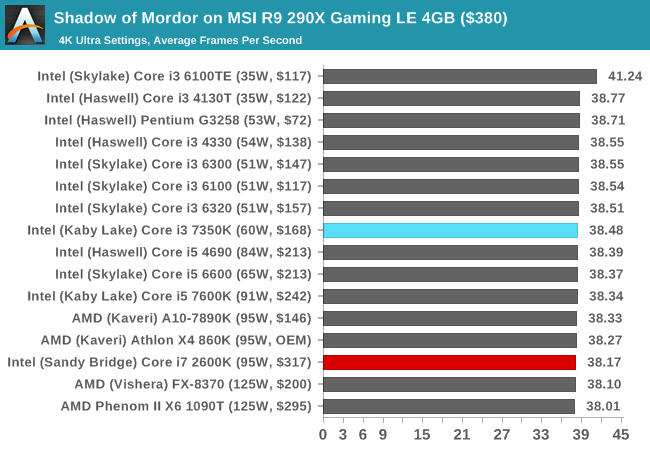
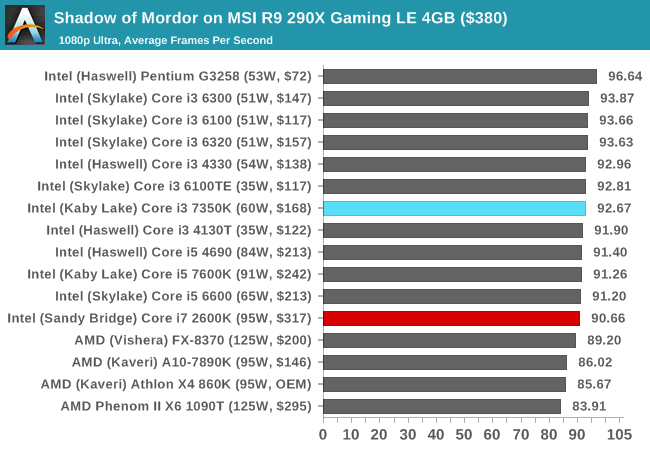
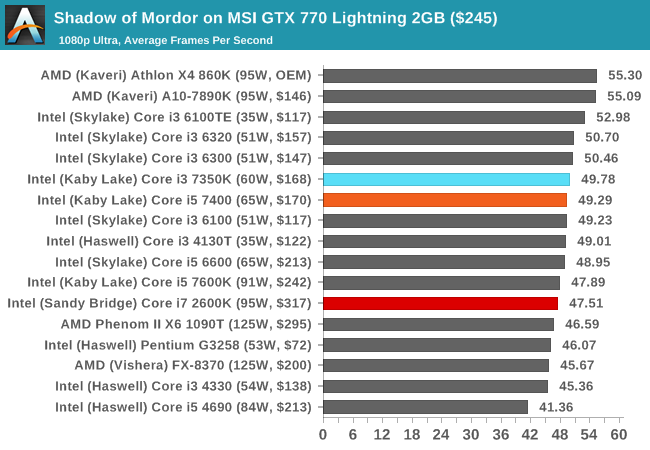
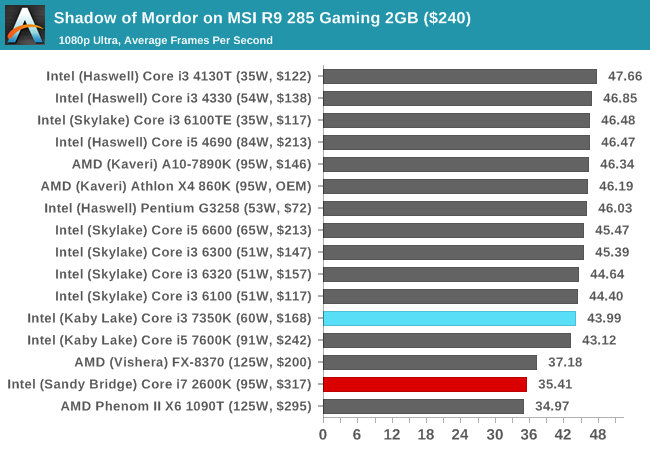
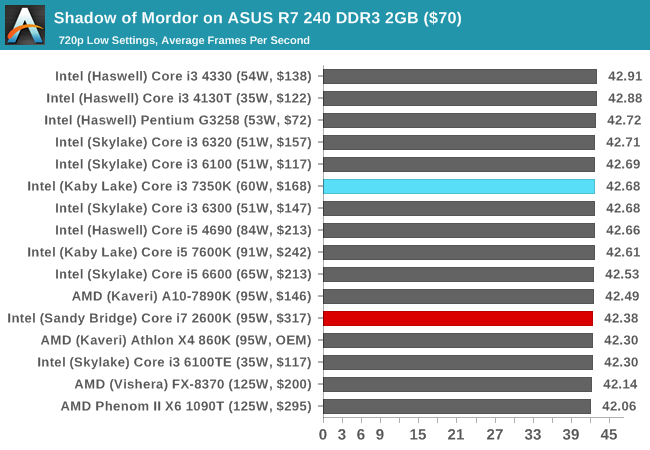
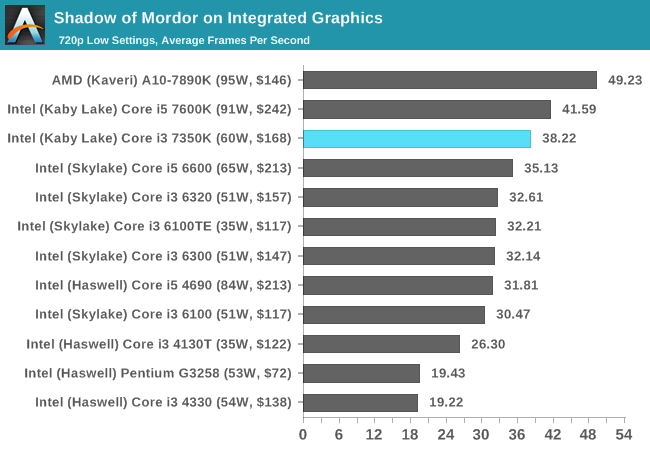
The only real difference here between the newer Core i3-7350K and the older Core i7-2600K is with our mid-range cards (GTX 770 and R9 285), whereby the older CPU seems to have a deficit 'in general' to the other CPUs we've tested. This might be CPU instruction related, although these results aren't seen on the other cards.
Power Consumption
As with all the major processor launches in the past few years, performance is nothing without a good efficiency to go with it. Doing more work for less power is a design mantra across all semiconductor firms, and teaching silicon designers to build for power has been a tough job (they all want performance first, naturally). Of course there might be other tradeoffs, such as design complexity or die area, but no-one ever said designing a CPU through to silicon was easy. Most semiconductor companies that ship processors do so with a Thermal Design Power, which has caused some arguments recently based presentations broadcast about upcoming hardware.
Yes, technically the TDP rating is not the power draw. It’s a number given by the manufacturer to the OEM/system designer to ensure that the appropriate thermal cooling mechanism is employed: if you have a 65W TDP piece of silicon, the thermal solution must support at least 65W without going into heat soak. Both Intel and AMD also have different ways of rating TDP, either as a function of peak output running all the instructions at once, or as an indication of a ‘real-world peak’ rather than a power virus. This is a contentious issue, especially when I’m going to say that while TDP isn’t power, it’s still a pretty good metric of what you should expect to see in terms of power draw in prosumer style scenarios.
So for our power analysis, we do the following: in a system using one reasonable sized memory stick per channel at JEDEC specifications, a good cooler with a single fan, and a GTX 770 installed, we look at the long idle in-Windows power draw, and a mixed AVX power draw given by OCCT (a tool used for stability testing). The difference between the two, with a good power supply that is nice and efficient in the intended range (85%+ from 50W and up), we get a good qualitative comparison between processors. I say qualitative as these numbers aren’t absolute, as these are at-wall VA numbers based on power you are charged for, rather than consumption. I am working with our PSU reviewer, E.Fylladikatis, in order to find the best way to do the latter, especially when working at scale.
Nonetheless, here are our recent results for Kaby Lake at stock frequencies:
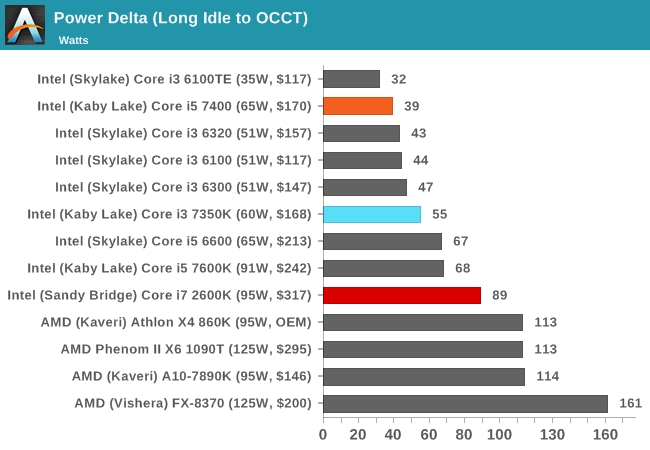
The Core i3-7350K, by virtue of its higher frequency, seems to require a good voltage to get up to speed. This is more than enough to go above and beyond the Core i5, which despite having more cores, is in the nicer part (efficiency wise) in the voltage/frequency curve. As is perhaps to be expected, the Core i7-2600K uses more power, having four cores with hyperthreading and a much higher TDP.
Overclocking
At this point I’ll assume that as an AnandTech reader, you are au fait with the core concepts of overclocking, the reason why people do it, and potentially how to do it yourself. The core enthusiast community always loves something for nothing, so Intel has put its high-end SKUs up as unlocked for people to play with. As a result, we still see a lot of users running a Sandy Bridge i7-2600K heavily overclocked for a daily system, as the performance they get from it is still highly competitive.
There’s also a new feature worth mentioning before we get into the meat: AVX Offset. We go into this more in our bigger overclocking piece, but the crux is that AVX instructions are power hungry and hurt stability when overclocked. The new Kaby Lake processors come with BIOS options to implement an offset for these instructions in the form of a negative multiplier. As a result, a user can stick on a high main overclock with a reduced AVX frequency for when the odd instruction comes along that would have previously caused the system to crash.
For our testing, we overclocking all cores under all conditions:
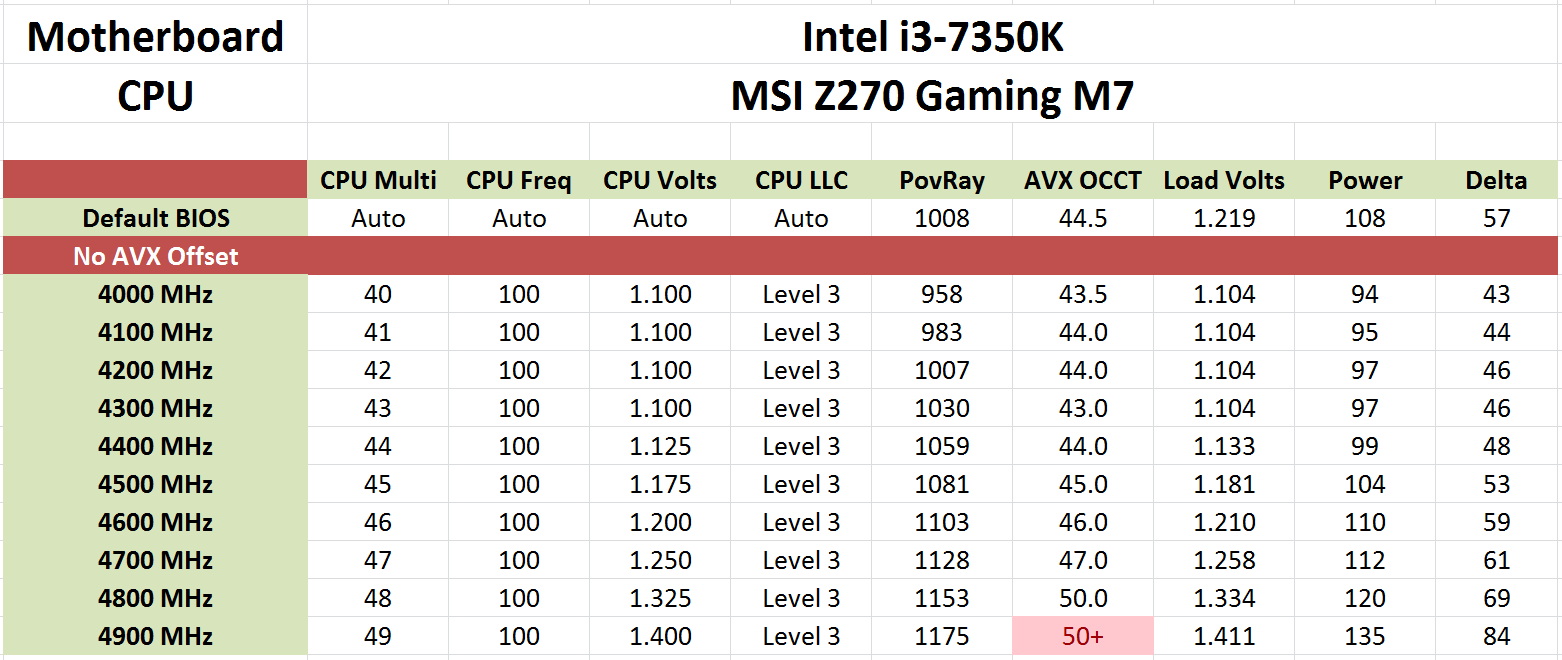
The overclocking experience with the Core i3-7350K matched that from our other overclockable processors - around 4.8-5.0 GHz. The stock voltage was particularly high, given that we saw 1.100 volts being fine at 4.2 GHz. But at the higher frequencies, depending on the quality of the CPU, it becomes a lot tougher maintain a stable system. With the Core i3, temperature wasn't really a feature here with our cooler, and even hitting 4.8 GHz was not much of a strain on the power consumption either - only +12W over stock. The critical thing here is voltage and stability, and it would seem that these chips would rather hit the voltage limit first (and our 1.4 V limit is really a bit much for a 24/7 daily system anyway).
A quick browse online shows a wide array of Core i3-7350K results, from 4.7 GHz to 5.1 GHz. Kaby Lake, much like previous generations, is all about the luck of the draw - if you want to push it to the absolute limit.
Core i3-7350K vs Core i7-2600K
When I started testing for this review, finding out how close the Core i3-7350K was to the favored Core i7-2600K was anticipated to be interesting. Several years of IPC increases in favor of the Core i3, plus the extra frequency and overclockability, were to be put against brute force in the form of more, but older, cores. The Core i7-2600K is certainly no slouch. It's a good overclocking chip in its own right, hitting almost 5.0 GHz on a good sample, which has made it a very difficult processor for Intel to get users to upgrade from in this recent area of minimal IPC increases per generation.
That’s not to say that IPC increases are entirely Intel’s fault – at some point there is only so many knobs you can turn and twist in a given CPU microarchitecture. But the lack of IPC gain can come from the big questions: if we have GPUs at 250-300W, why not CPUs? Is Intel’s process focused on performance, power, or die size? If you speak to a few analysts, you get a wide variety of reasoning as to how Intel does things, but money is usually the key factor. This is perhaps a topic to discuss on a podcast!
But to the matter at hand: there will be a time where a Core i3 based CPU will match the performance of the older Core i7-2600K. This is what the testing was about: at what point will we have enough frequency and IPC gain to match the older chip, potentially saving a bunch of power in the process? It’s not necessarily a question of upgrading – high-performance enthusiasts rarely upgrade to a system that gives equal performance at lower power, but it does offer that understanding that perhaps the Core i7-2600K might be showing its age.
At a high level, the two CPUs have the following:
| Kaby Lake i3 vs Sandy Bridge i7 Comparison Launch Pricing |
|||||||||
| CPU | Year | Cores Threads |
Freq | Turbo | L3 | IGP | DRAM | TDP | Price |
| Core i3-7350K | 2017 | 2/4 | 4.2 | - | 4MB | HD 630 | DDR4-2400 | 60W | $168 |
| Core i7-2600K | 2011 | 4/8 | 3.4 | 3.8 | 8MB | HD 3000 | DDR3-1333 | 95W | $317 |
The Core i7-2600K has more cores and more cache. The Core i3-7350K has a higher frequency, better memory controller, better integrated graphics, is more efficient, and was released at almost half the cost. The big question is if frequency plus IPC can match the brute force of more cores.
Throughout the results, each benchmark that has results between the two processors has commentary on the Kaby Lake-i3 vs Sandy Bridge-i7 performance. Here’s a brief summary:
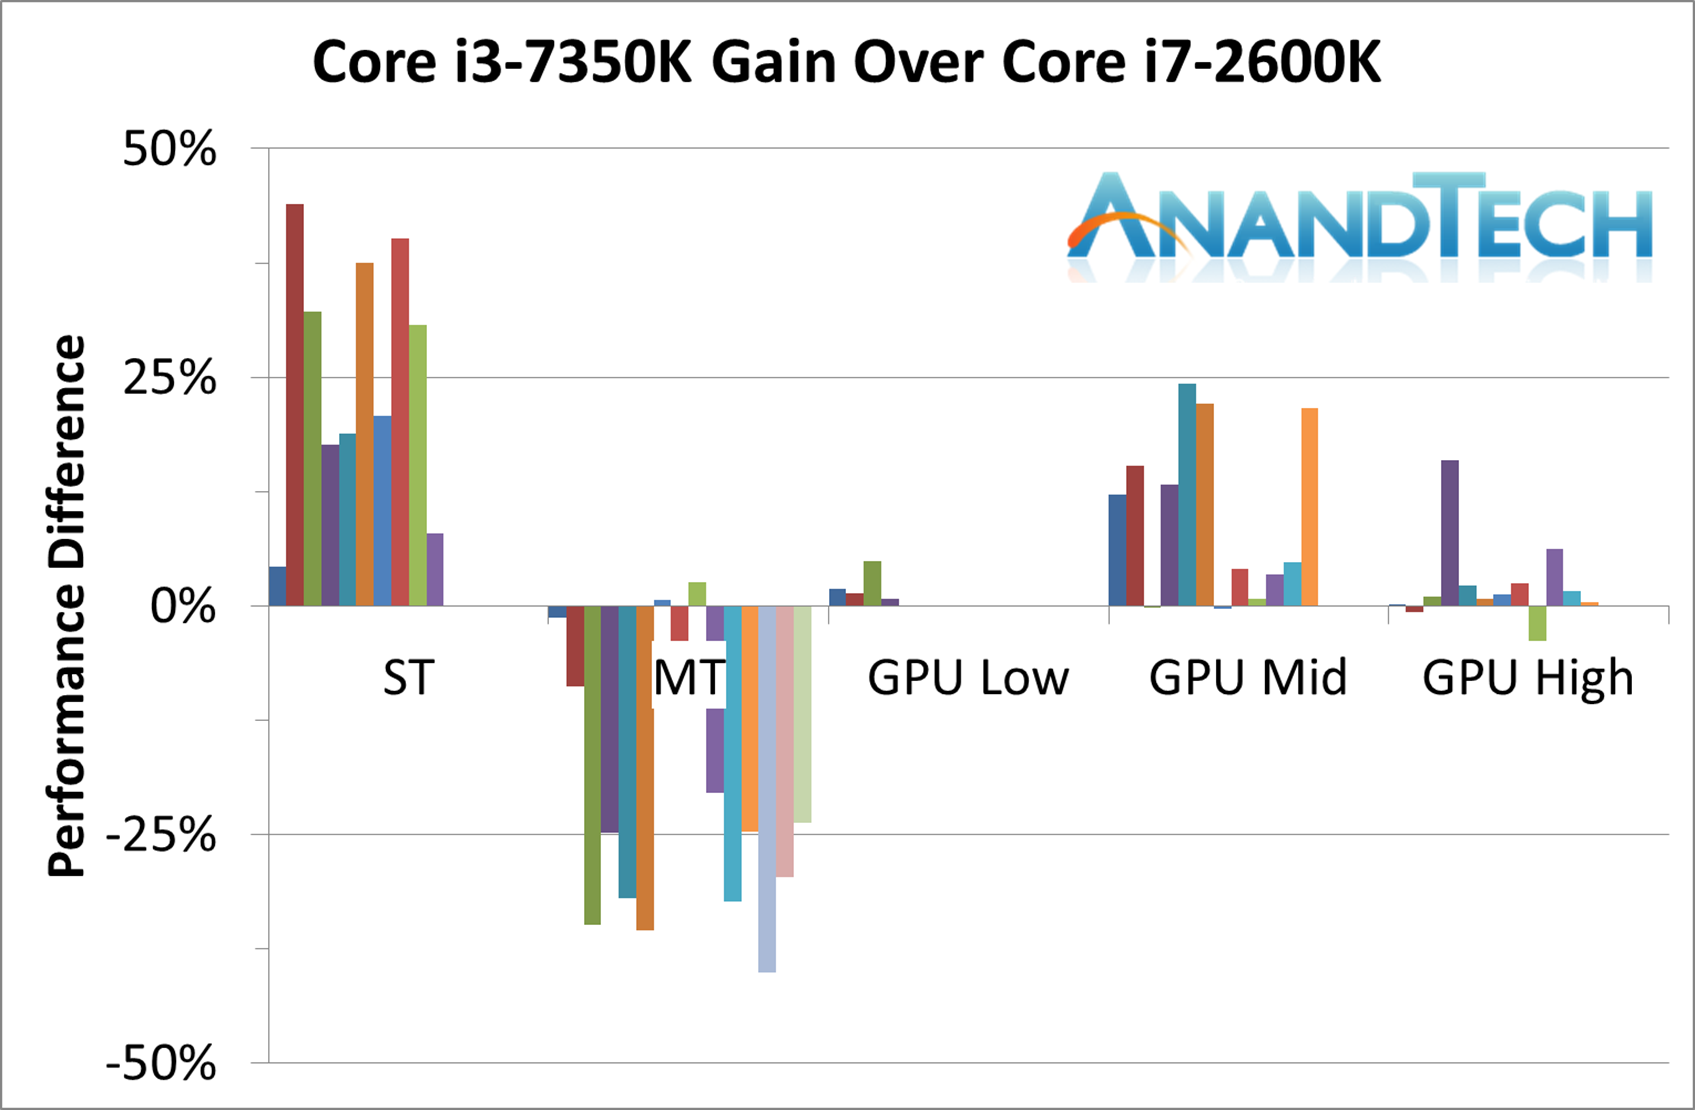
| Kaby Lake i3 vs Sandy Bridge i7 Performance Difference | |||
| Average | Peak | Minimum | |
| CPU Single Thread | +25% | +44% | +4% |
| CPU Multi-Thread | -18% | -40% | +3% |
| Low GPU (R7 240) | +2% | +5% | +1% |
| Mid GPU (R9 285/GTX 770) | +10% | +24% | 0% |
| High GPU (R9 290X/GTX 980) | +2% | +16% | -5% |
| Integrated Graphics | +200% | +296% | +120% |
As expected, the Core i3-7350K takes the single threaded performance win. In every benchmark the Core i3 was ahead up to +44%, with an average of +25%.
With the multithreaded CPU tests, the extra cores and threads of the older Core i7-2600K were often more than enough to overcome the newer part. The Core i3-7350K does, on average, -18% less work than the Core i7-2600K, which manifests itself as anything from being near equal to a -40% loss in throughput (or taking almost 1.8x the time to finish the same task). Benchmarks that fall into the latter category are mostly tasks that have large threads competing for size in the cache, meaning the contest essentially becomes two cores vs four cores. Even with CPU and IPC, that’s a tough mark to jump over.
For the gaming tests, putting aside the obvious win on integrated graphics for Kaby Lake, in our game tests we saw parity at the high end. Only one serious high-end GPU test saw a win for Kaby Lake, giving +16% performance gain, but the interesting results occur on mid-range cards. For mid-range, the newer Core i3 test out-performed the older Core i7 by an average of 10%, which ranged anywhere from equal to +24% (Mordor at 1080p Ultra).
Ultimately the Core i3 parts are marketed towards the mid-range GPU gaming community, and the addition of overclocking may be enough to push a user to get a Core i3-K instead of a Core i5, migrating money over to a different part of the PC. But for our gaming tests, the Core i3-7350K certainly matches the Core i7-2600K.
Ultimately, however, the users who fully stretch the legs of the Core i7 through other means, such as compute-heavy work, already need the power of all the cores. As shown in our multithreaded tests, while the Core i3 is hot on the heels of the Core i7-2600K, the deficit of having two fewer cores is very difficult to overcome. That becomes more difficult as we overclock both CPUs into the 4.8 GHz region, where the 400-600 MHz frequency advantage of the Core i3 is lost and the contest is purely on IPC, cores and stability.
The Core i3-7350K, as a CPU, is not enough to encourage users who already push the Core i7-2600K to the absolute limit and want to stay there. For everyone else though, where responsiveness is more important, or in casual gaming, the Core i3-7350K becomes an adequate side step from the i7-2600K to decrease power consumption and move onto a new platform (and have the joy of building a new PC again). Windows 10 users also get the benefit of Speed Shift, affording more ‘free’ performance for responsive tasks.
It is worth noting that moving to the Core i3-7350K affords non-CPU related benefits. Moving from a P67/Z68 motherboard to a Z270 motherboard means:
- GPU slots operate at PCIe 3.0, rather than PCIe 2.0 (on Z68)
- More chipset PCIe lanes (24 lanes at PCIe 3.0 rather than 8 lanes at PCIe 2.0)
- Support for bootable NVMe storage and PCIe storage
- Newer audio codecs and networking controllers
- Updated Intel RST (RAID/Caching)
- A move from DDR3-1333 to DDR4-2400
- Native USB 3.0 Ports from the chipset rather than from controllers
- USB 3.1 (10 Gbps) on board via controllers rather than a add-in PCIe card
- Potential Thunderbolt 3 support (depending on motherboard)
- USB Type-C
- This RGB fad that apparently sells like hot cakes
- More SATA 6 Gbps ports (six on Z270 vs two on Z68)
At What Point Will the Performance of A Core i3 Beat the Core i7-2600K?
If we’re only speaking performance (I’m sure Intel would rather happily speak efficiency), judging by our benchmark results, we’re almost there already. For all but the most strenuous tasks that require large caches, the Core i3 already wins out. Unfortunately these are the tasks where the Core i3 needs a clear 2x performance gain per core to match the Core i7-2600K. For these tasks, anywhere from -30% to -40% loss to the Core i3 in our test can be a deciding factor in purchasing.
Let’s take a score based test, such as POV-Ray. Here the Core i3-7350K scored 1009 points, compared to the Core i7-2600K which scored 1323 points (or +31.1%). Based on the overclocking tests, each 100 MHz on the Core i3 resulted in +25 points, and that rise was essentially linear from 4.0 GHz to 4.8 GHz.
With extrapolation, the 314 point deficit requires an extra ~1250 MHz for the Core i3 to match that result.
So, all we need is a 5.45 GHz dual-core processor with Kaby Lake IPC.
Or, think of it another way. If we assume Intel creates a 5% IPC increase year-on-year, a 4.2 GHz Core i3 will score 1059 next generation, then 1112, then 1168, and so on, until we hit a score of 1352 in six more generations. Roll on 2025?
(As an aside, the best tested Kaby Lake CPUs from the world’s best overclockers can reach a semi-stable 5.3-5.4 GHz using water cooling, using AVX offset, but beyond that (and for 100% stability) requires sub-zero cooling.)
Casual Enthusiasts Rejoice
No matter your taste for being labeled, the PC and gaming market is awash with different segments that loosely collate different requirements. Some want high-performance at any cost, others are power conscious, and some want the best gaming performance for their budget. For this latter group, the Core i3-7350K is a serious contender to throw some money at.
In our single GPU tests (which are admittedly showing their age a small bit), at 1080p and 4K, the Core i3-7350K was on par with the Core i5-7600K and Core i7-7700K. The Core i3 part is not seriously marketed at SLI/CFX configurations, so maintaining a good level performance at mainstream resolutions using a single graphics card is important in this performance for a 'budget' build. The high single core frequency at 4.2 GHz, or more when overclocked, ensures that the Core i3 hits a high level of performance in most DX11 gaming where performance can differ. Out of our gaming tests, the Core i5-7600K offered a small gain with mid-range GPUs on Grand Theft Auto, but for the most part performance was on par or within a few percent.
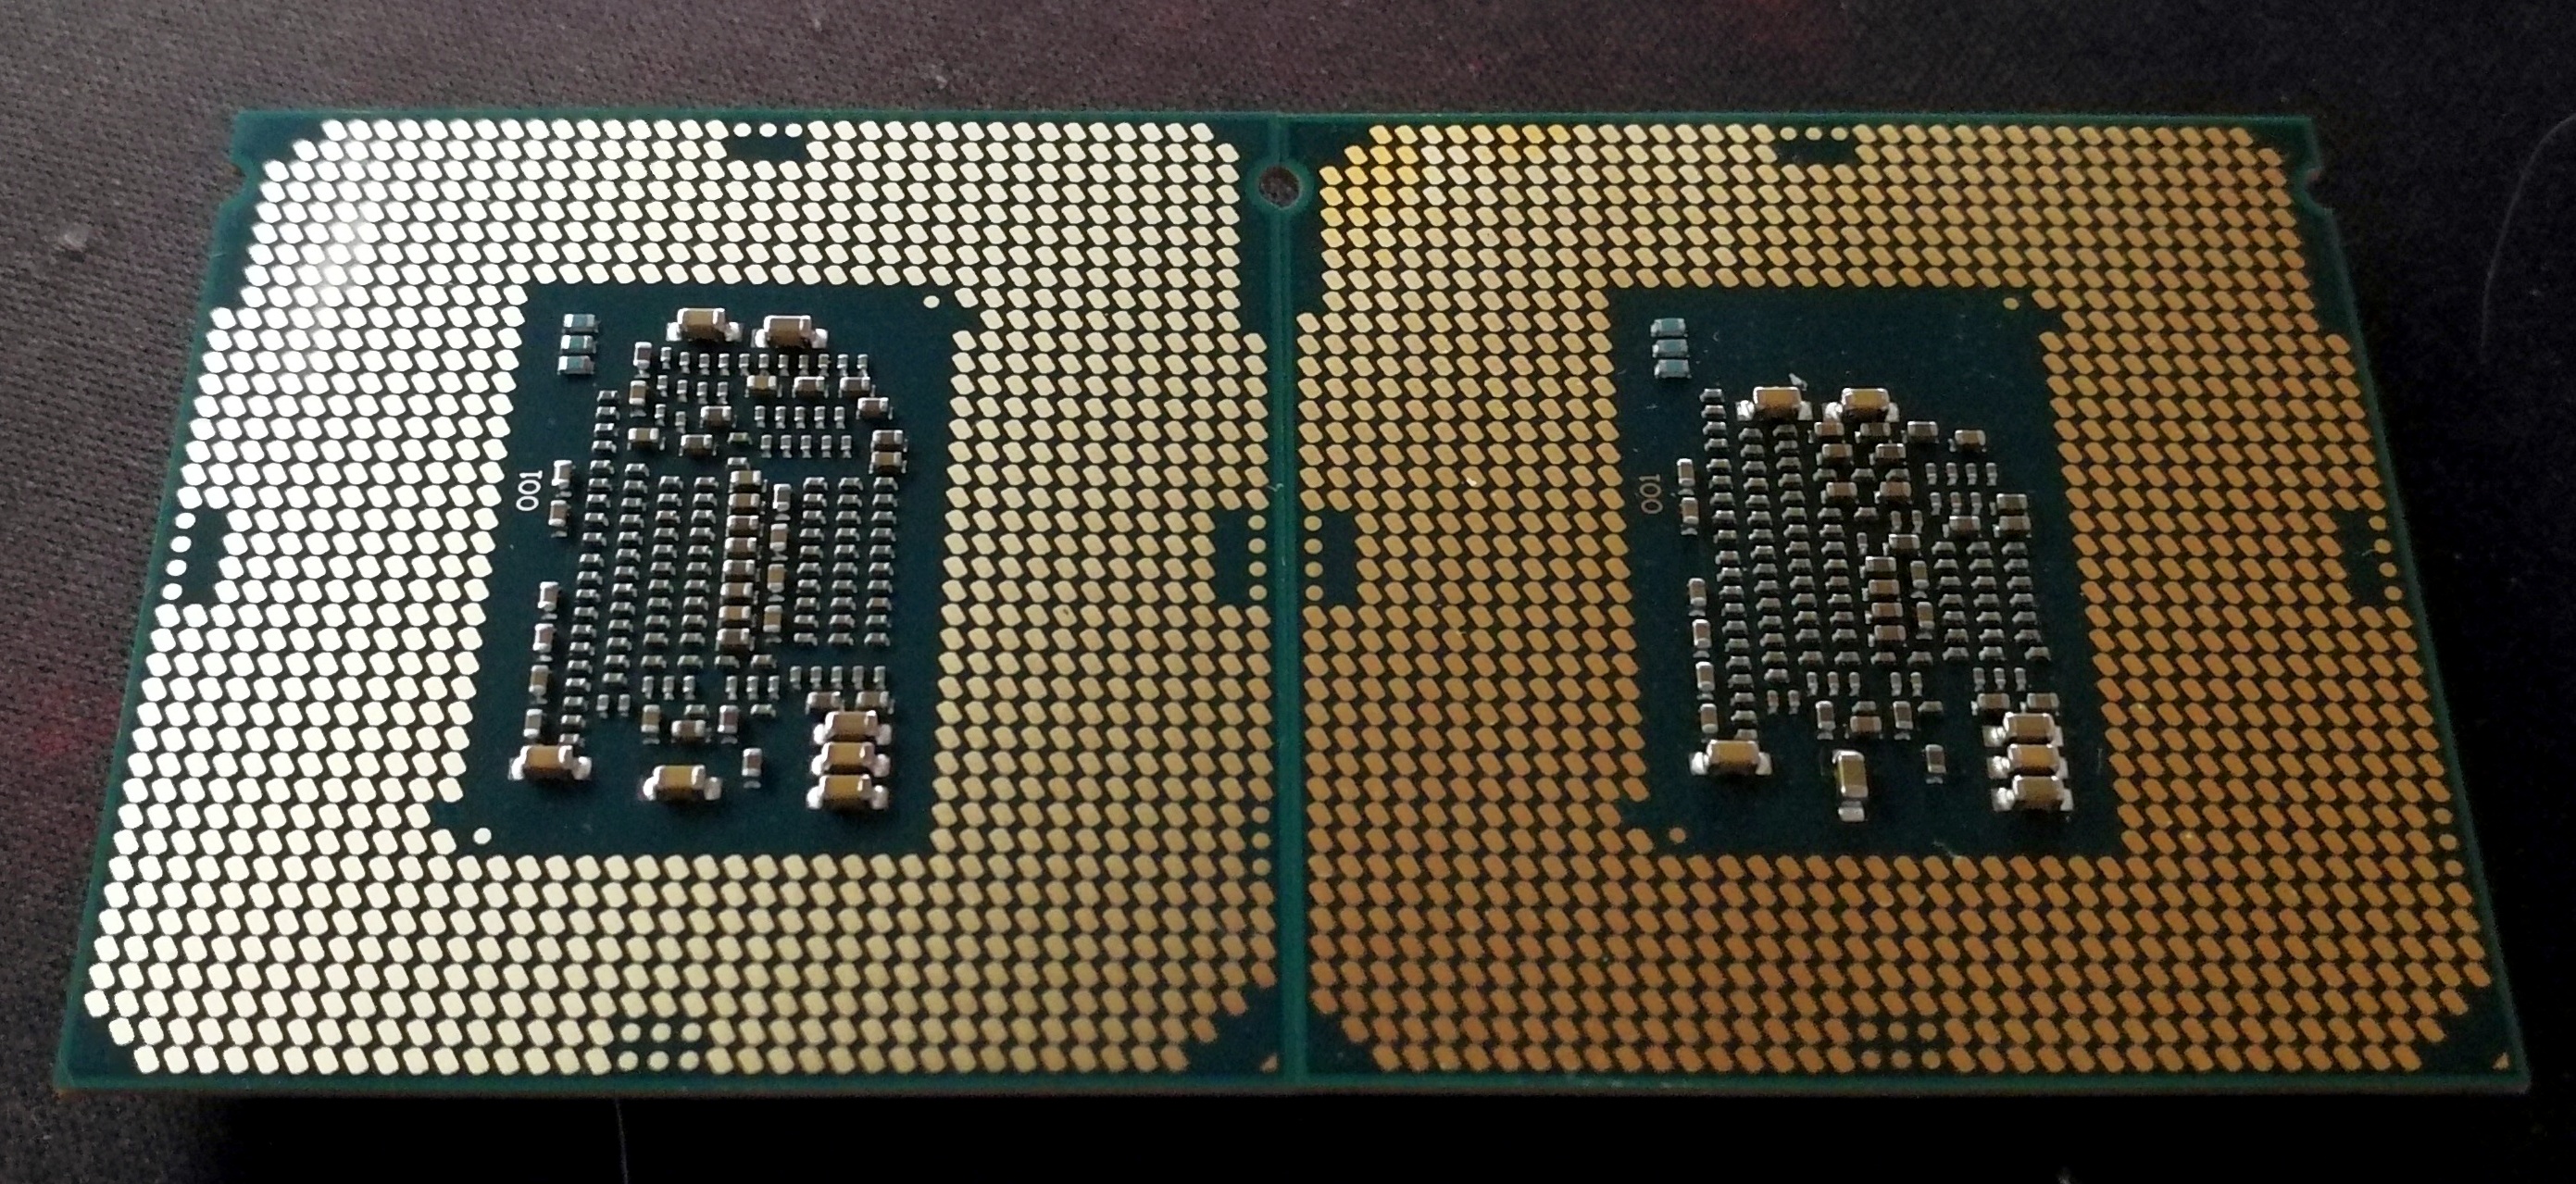
Core i7-7600K (left) and Core i3-7350K (right)
For underlying performance, the Core i3-7350K is one of the fastest single threaded performers on the market. The combination of 4.2 GHz and Kaby Lake IPC means that only the i7-7700K is the only one that beats it. For basic programming and web work, having one of the fastest chips on the market may help improve the experience. However, starting to add more complex work in to the mix shows that the dual core chip can be a bottleneck – any workload with heavy threads, such as compute (compression, rendering, matrix compute), is going to hand a performance advantage to a Core i5. A good example of this is Agisoft: the Core i5-7400 (which costs $14 more, quad core, 3.0-3.5 GHz) completes the work ~10% quicker.
For overclocking, the Core i3-7350K matches the other Kaby Lake overclocking parts. Our retail stepping sample achieved 4.8 GHz without any AVX offset, similar to our Core i5-7600K and Core i7-7700K. One of the upsides of the overclock was the power consumption: due to the 1.2 volts applied to the CPU at stock frequencies, our overclock only produced another +12W in power consumption. It was perhaps surprising that the Core i5-7400 had a much lower power consumption than the dual core, but the high base frequency leads to a higher stock voltage which translates to power consumption.
What would be interesting to see is how the power consumption changes with some of the lower clocked Core i3 parts. From our overclocking/underclocking results, a 4.0 GHz Core i3 at 1.100 volts would only consume 43W.
Ultimately, the state of the Core i3-7350K depends on what you are interested in as an enthusiast.
- Overclocking? It’s a fun choice.
- Responsiveness? Top class.
- Mainstream 1080p Gaming? A cheaper equivalent to the Core i5.
- Power? A lower clocked i3 is better on efficiency.
- Heavy workloads? Spend $14 and go for a Core i5.
The idea internally (inside my head) is to rerun this set of interesting Intel CPUs on Windows 10 with newer DX12 games and newer GPUs over the next few months. It’s going to be fun. I think.
More about Kaby Lake
For readers that want a more in-depth take on Kaby Lake as a platform, we have a dedicated article full of information for you. We also have other articles in our Kaby Lake bonanza.
Other articles include:
Intel Launches 7th Generation Kaby Lake (Overview and Core Improvements)
The Intel Core i7-7700K Review: The New Out-of-the-box Performance Champion
The Intel Core i5-7600K Review: The More Amenable Mainstream Performer
The Intel Core i3-7350K Review: When a Core i3 Nearly Matches the Core i7-2600K (This Review)
Still to come
Calculating Generational IPC Changes from Sandy Bridge to Kaby Lake
Intel Core i7-7700K, i5-7600K and i3-7350K Overclocking: Hitting 5.0 GHz on AIR
Intel Launches 200-Series Chipset Breakdown: Z270, H270, B250, Q250, C232
Intel Z270 Motherboard Preview: A Quick Look at 80+ Motherboards


