Original Link: https://www.anandtech.com/show/9434/asrock-beebox-review-a-fanless-braswell-ucff-pc
ASRock Beebox Review: A Fanless Braswell UCFF PC
by Ganesh T S on July 14, 2015 8:00 AM EST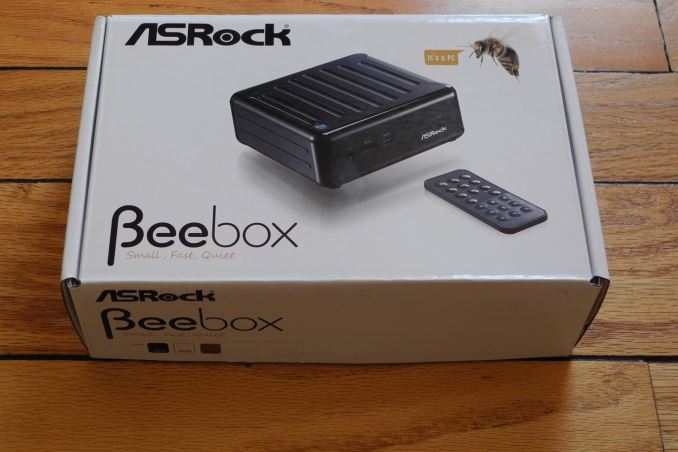
Introduction and Setup Impressions
ASRock had taken an early lead in serving the mini-PC market, thanks to its Vision / Core series units. Based on motherboards meant for the notebook market (smaller than mini-ITX, but larger than pico-ITX), they have been regularly refreshed since the ION days. Over the last couple of years, mini-PCs in the ultra-compact form factor (UCFF) - tagged as NUCs after being made popular by the Intel Next Unit of Computing systems - have emerged as one of the bright spots in the troubled PC market. Strangely, ASRock didn't have any play in this UCFF NUC form-factor. That changes with the arrival of Intel's Cherry Trail based on 14nm Braswell. The ASRock Beebox is a NUC based on the Intel Celeron N3xxx, and carries some unique features that include fanless operation, a USB Type-C port in the front panel and support for up to three simultaneous display (including 4K ones).
The ASRock Beebox is available with either the Celeron N3000 or the Celeron N3105 as the internal SoC. Each of these units can come either barebones (i.e, no internal storage or memory) or, as a ready-to-go system (with or without the OS). ASRock supplied us with the following reference pricing sheet for the N3000 series.
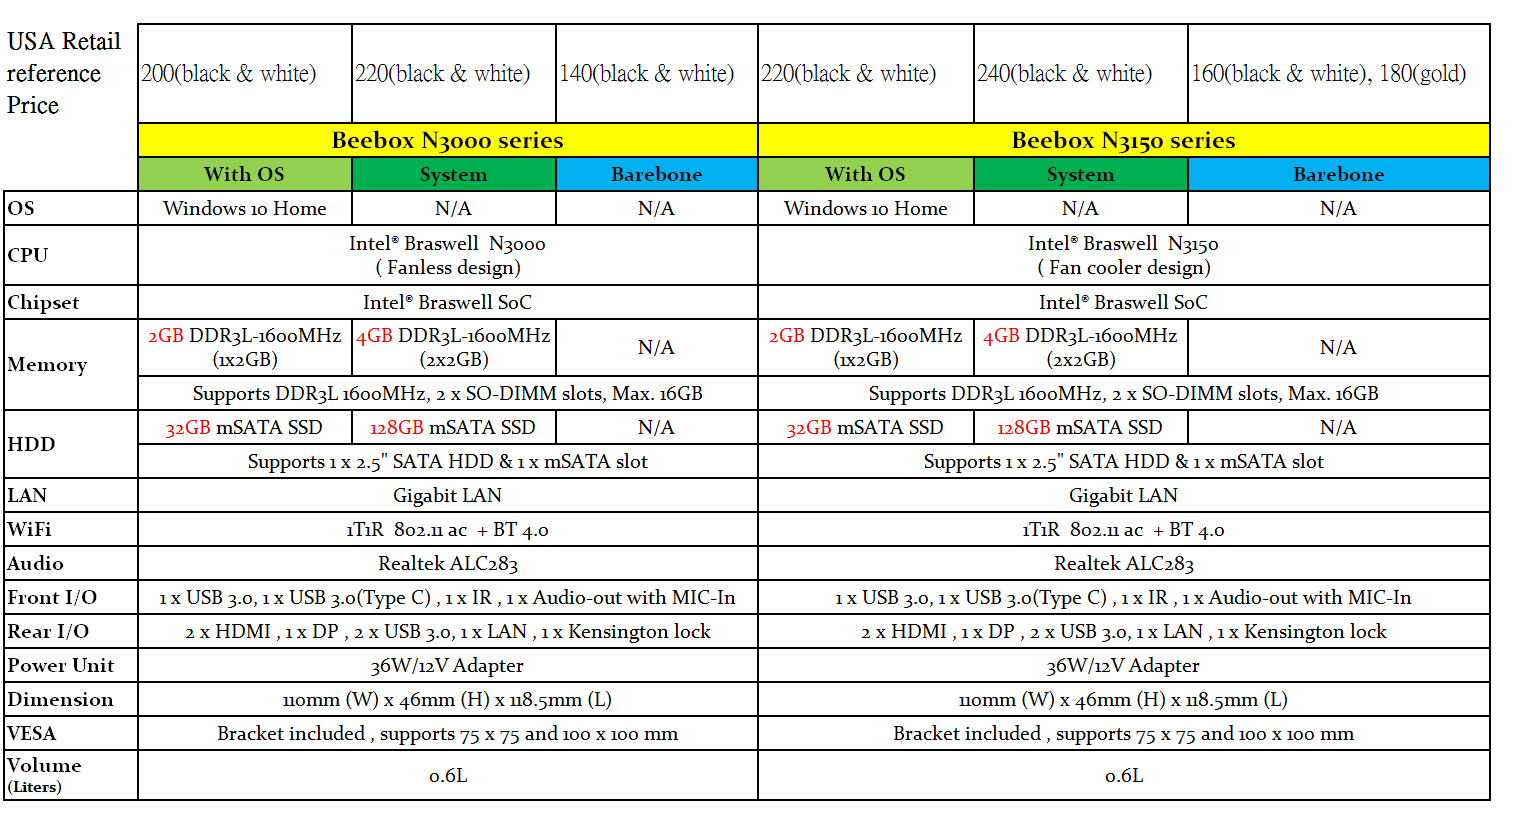
For a $20 premium, the increase in the internal storage from 32GB to 128GB is quite welcome. Both memory slots get occupied (and 4 GB of RAM is appropriate for the system's use-cases in the intended target market - digital signage, embedded applications and industrial usage). Note that only the N3000 series is fanless. The N3150 series uses active cooling. The specifications of our ASRock Beebox N3000-NUC review configuration are summarized in the table below.
| ASRock Beebox N3000-NUC Specifications | |
| Processor | Intel Celeron N3000 (2C/2T Airmont x86 @ 1.04 / 2.08 GHz, 14nm, 2 MB L2, 4W TDP, 3W SDP) |
| Memory | 2x 2 GB DDR3L-1600 C11 |
| Graphics | Intel HD Graphics |
| Disk Drive(s) | Team Group TIM3F49128GMBA04S6 128 GB mSATA 6 Gbps SSD |
| Networking | 1x Realtek RTL8168 GbE, 1x1 Realtek 8821AE 802.11ac Wi-Fi |
| Audio | Capable of 5.1/7.1 digital output over HDMI |
| Operating System | Retail unit is barebones, but we installed Windows 8.1 Pro x64 |
| Pricing (As configured) | $220 |
| Full Specifications | ASRock Beebox N3000-Series Specifications |
The ASRock Beebox N3000-NUC kit doesn't come with any pre-installed OS, but does come with a CD containing Windows drivers. In any case, we ended up installing the latest drivers downloaded off ASRock's product support page. In addition to the main unit, the other components of the package include a 36 W (12V @ 3A) adapter with a replaceable US power connector, a VESA mount (along with the necessary screws), a driver CD, user's manual and a quick-start guide. In addition, we also have the appropriate cables - both data and power - to install a 2.5" drive in the system. A small IR remote control with a pre-installed CR232 battery is also part of the package.

The gallery below takes us around the hardware in the unit.


One of the interesting aspects shown in the gallery above is the chassis and motherboard design to accommodate a 2.5" drive with the SATA port and the power pins to the right of the SO-DIMM slots. The other aspect is the maximum possible memory in the system. Even though Intel's official specs indicate a maximum memory size of only 8 GB, we were able to install 2x 8GB panram P8D3L1600C116G2VS sticks for a total of 16 GB of RAM. These operate with the same latencies as that of the pre-installed sticks - no benchmark improvements were found with the panram sticks, but there was a slight increase in the power consumption. So, we retained the pre-installed DRAM kit for our benchmarking purposes.
In the table below, we have an overview of the various systems that we are comparing the ASRock Beebox N3000-NUC against. Note that they may not belong to the same market segment, but all of them are fanless units. The relevant configuration details of the machines are provided so that readers have an understanding of why some benchmark numbers are skewed for or against the ASRock Beebox N3000-NUC when we come to those sections.
| Comparative PC Configurations | ||
| Aspect | ASRock Beebox N3000-NUC | |
| CPU | Intel Celeron N3000 | Intel Celeron N3000 |
| GPU | Intel HD Graphics (Gen8-LP) | Intel HD Graphics (Gen8-LP) |
| RAM | Team Group TI9B8S05H41159 11-11-11-28 @ 1600 MHz 2x2 GB |
Team Group TI9B8S05H41159 11-11-11-28 @ 1600 MHz 2x2 GB |
| Storage | Team Group TIM3F49128GMBA04S6 (128 GB; mSATA 6Gb/s; 20nm; MLC) |
Team Group TIM3F49128GMBA04S6 (128 GB; mSATA 6Gb/s; 20nm; MLC) |
| Wi-Fi | Realtek 8821AE Wireless LAN 802.11ac (1x1 802.11ac - 433 Mbps) |
Realtek 8821AE Wireless LAN 802.11ac (1x1 802.11ac - 433 Mbps) |
| Price (in USD, when built) | $220 | $220 |
Performance Metrics - 1
The ASRock Beebox N3000-NUC was evaluated using our standard test suite for low power desktops / industrial PCs. We revamped our benchmark suite in early 2014 after the publication of the Intel D54250WYK NUC review. We reran some of the new benchmarks on the older PCs also, but some of them couldn't be run on loaner samples. Therefore, the list of PCs in each graph might not be the same.
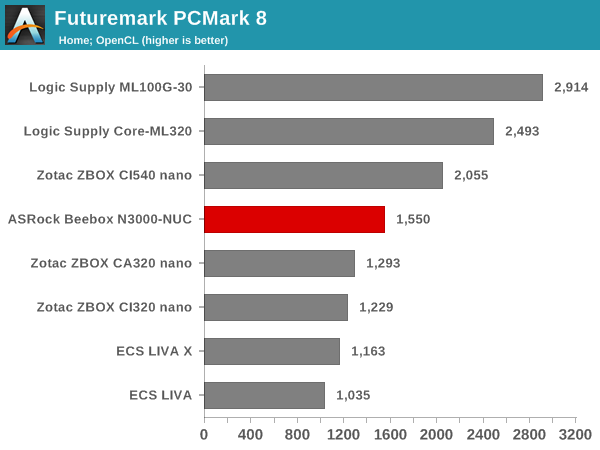
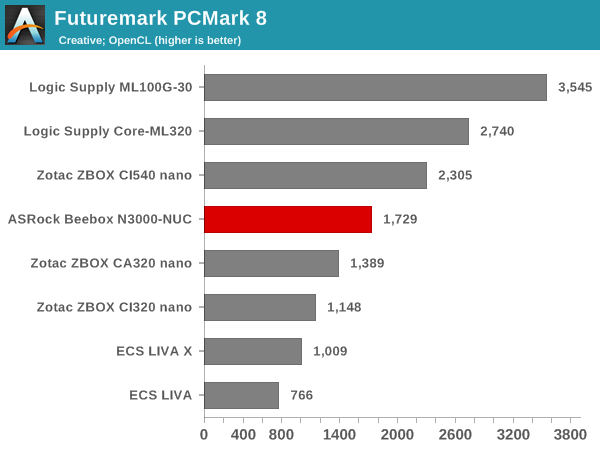
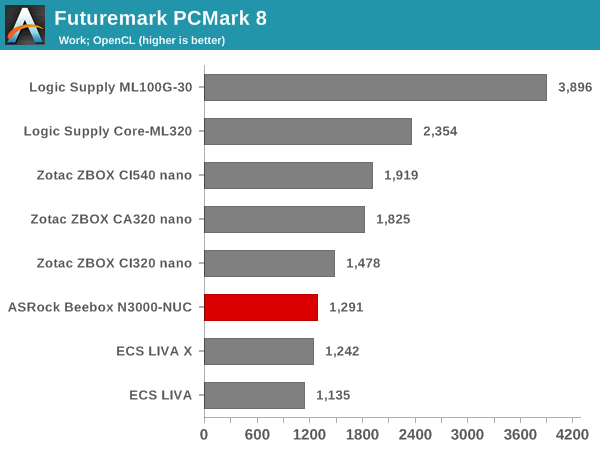
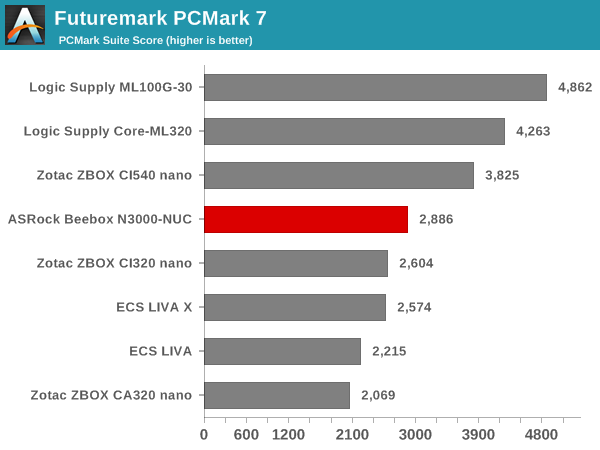
Futuremark PCMark 8
PCMark 8 provides various usage scenarios (home, creative and work) and offers ways to benchmark both baseline (CPU-only) as well as OpenCL accelerated (CPU + GPU) performance. We benchmarked select PCs for the OpenCL accelerated performance in all three usage scenarios. These scores are heavily influenced by the CPU in the system. The Celeron N3000 Cherry Trail SoC is obviously not as powerful as the Core-Y or Core-U platforms in the Logic Supply industrial PCs or even the Zotac ZBOX CI540 nano (Y-series). However, it shows marked improvement over the Bay Trail-based units.
Miscellaneous Futuremark Benchmarks
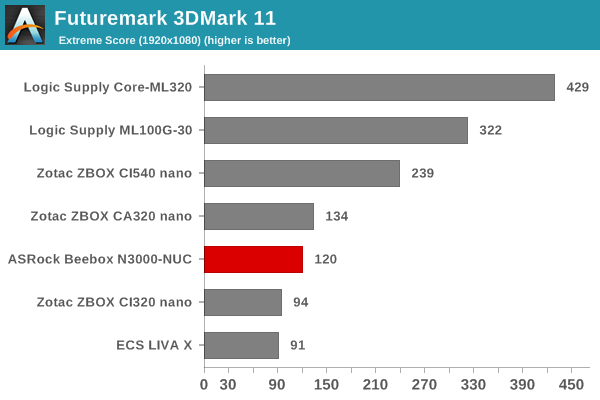
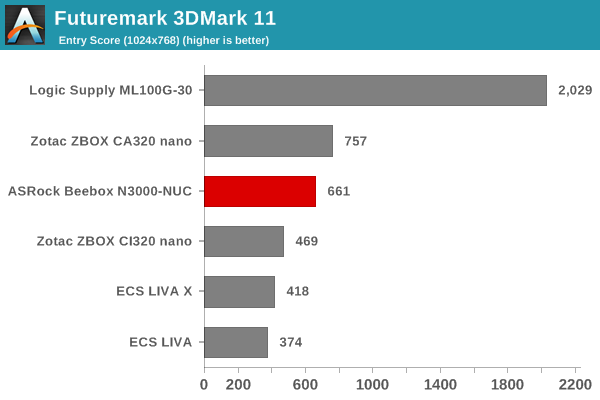
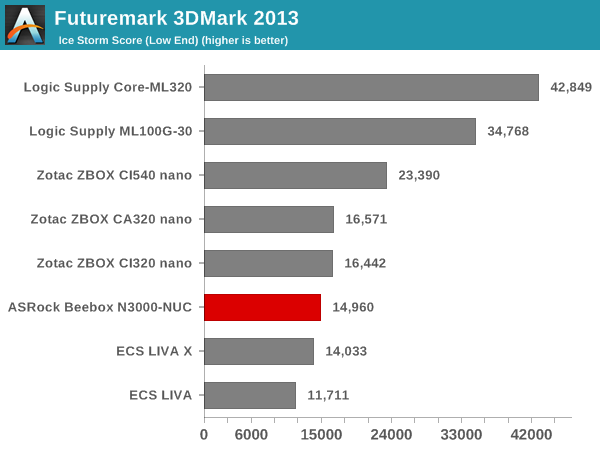
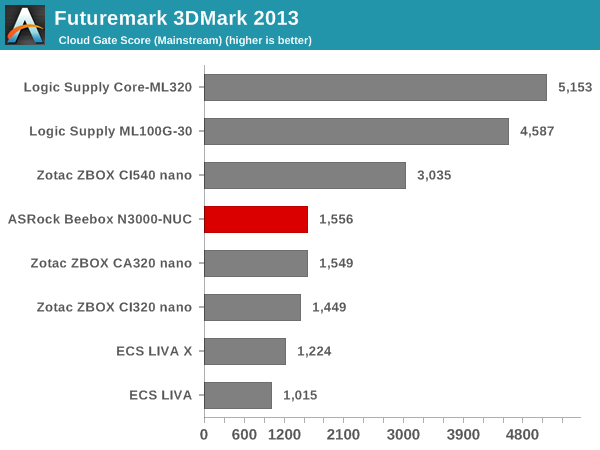
GPU performance shows a similar trend to the CPU performance. The difference when compared to Bay Trail is considerable.
3D Rendering - CINEBENCH R15
We have moved on from R11.5 to R15 for 3D rendering evaluation. CINEBENCH R15 provides three benchmark modes - OpenGL, single threaded and multi-threaded. Evaluation of select PCs in all three modes provided us the following results.
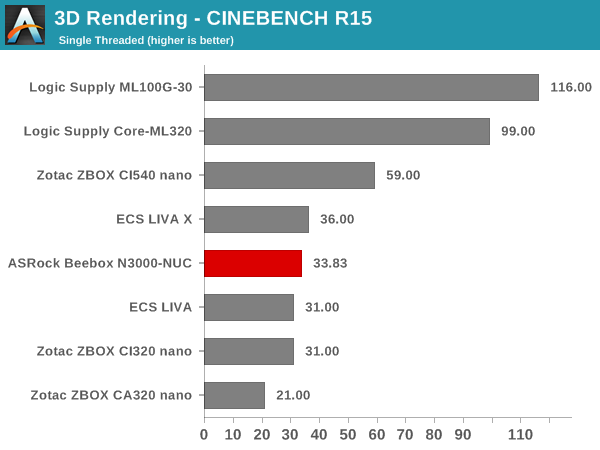
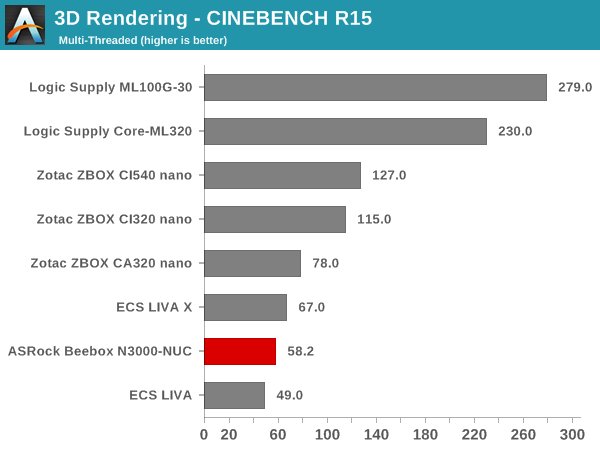
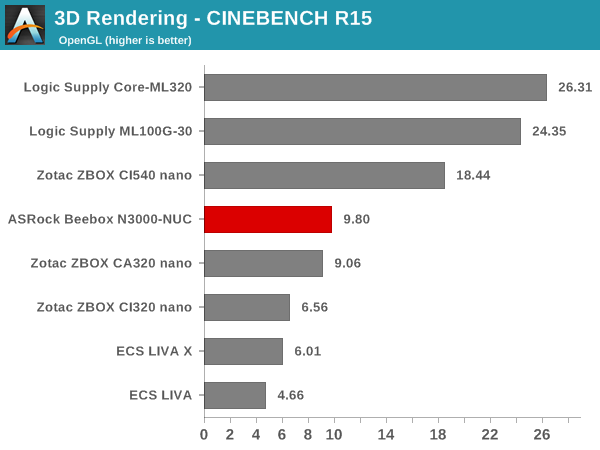
In Cinebench R15, the issues with the Celeron N3000 being a 2C/2T SoC come into play. In the multi-threaded benchmark, the quad-core Bay Trail SoCs in the ECS LIVA X and Zotac ZBOX CI320 nano manage better scores.
Performance Metrics - II
In this section, we mainly look at benchmark modes in programs used on a day-to-day basis, i.e, application performance and not synthetic workloads.
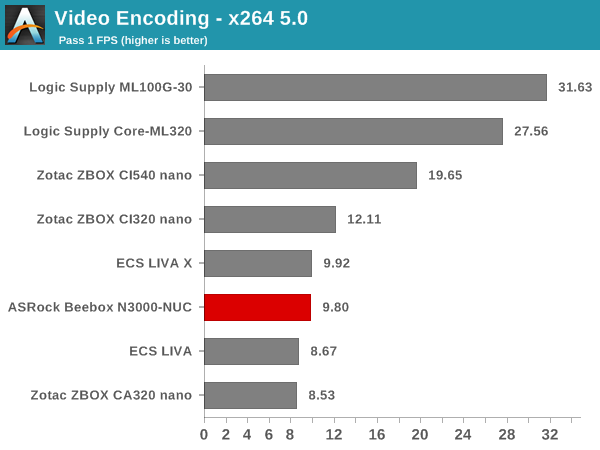
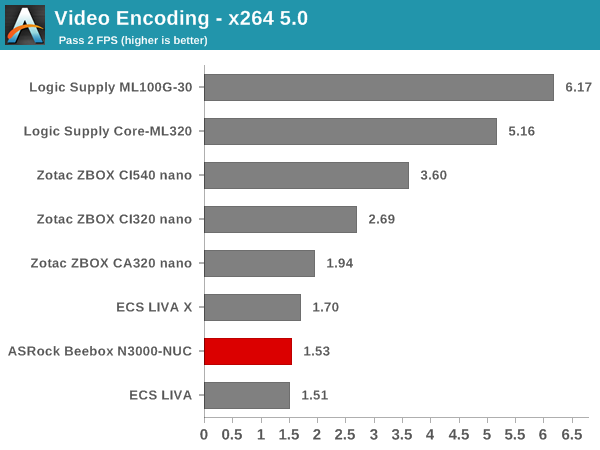
x264 Benchmark
First off, we have some video encoding benchmarks courtesy of x264 HD Benchmark v5.0. This is simply a test of CPU performance. As expected, the dual-core Celeron N3000 manages to match or only slightly beat the other dual-core Bay Trail solutions.
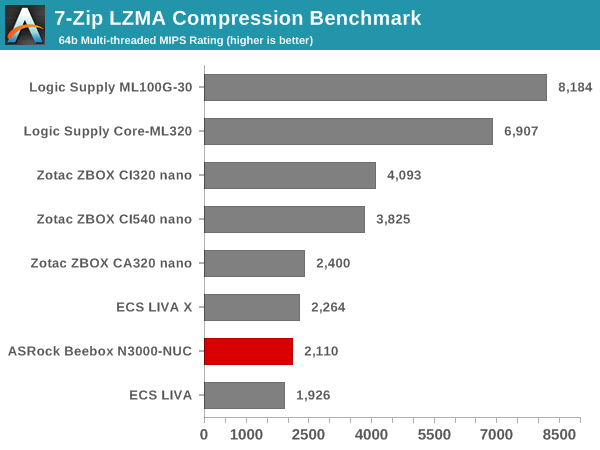
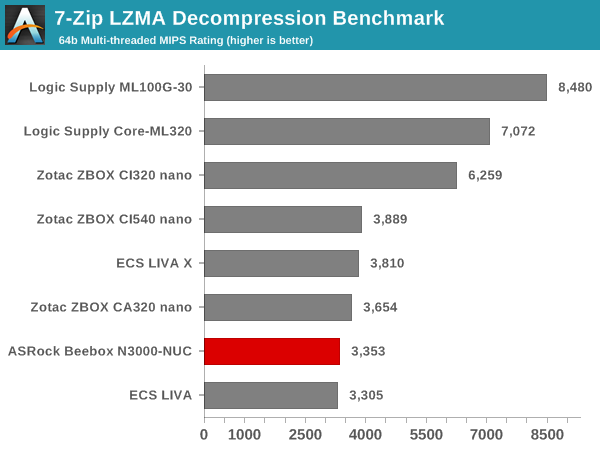
7-Zip
7-Zip is a very effective and efficient compression program, often beating out OpenCL accelerated commercial programs in benchmarks even while using just the CPU power. 7-Zip has a benchmarking program that provides tons of details regarding the underlying CPU's efficiency. In this subsection, we are interested in the compression and decompression MIPS ratings when utilizing all the available threads. The results are similar to what we obtained for the x264 benchmark.
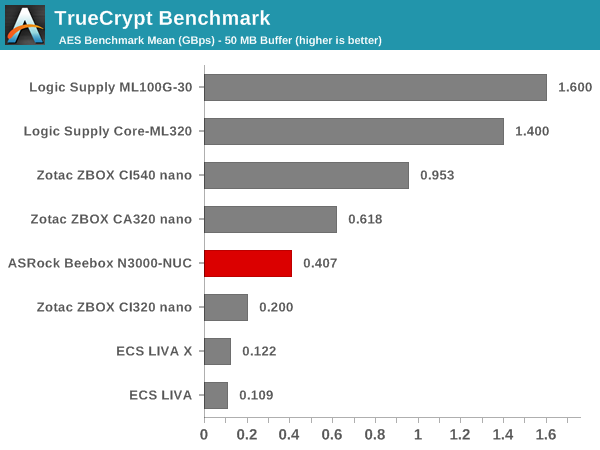
TrueCrypt
As businesses (and even home consumers) become more security conscious, the importance of encryption can't be overstated. CPUs supporting the AES-NI instruction for accelerating the encryption and decryption processes have, till now, been the higher end SKUs. However, starting with Bay Trail, even the lowly Atom series has gained support for AES-NI. The Celeron N3000 in the Beebox does have AES-NI support. TrueCrypt, a popular open-source disk encryption program can take advantage of the AES-NI capabilities. Even though TrueCrypt is no longer under development, its internal benchmark provides some interesting cryptography-related numbers to ponder. In the graph below, we can get an idea of how fast a TrueCrypt volume would behave in the ASRock Beebox N3000-NUC and how it would compare with other select PCs. This is a purely CPU feature / clock speed based test.
Agisoft Photoscan
Agisoft PhotoScan is a commercial program that converts 2D images into 3D point maps, meshes and textures. The program designers sent us a command line version in order to evaluate the efficiency of various systems that go under our review scanner. The command line version has two benchmark modes, one using the CPU and the other using both the CPU and GPU (via OpenCL). The benchmark takes around 50 photographs and does four stages of computation:
- Stage 1: Align Photographs
- Stage 2: Build Point Cloud (capable of OpenCL acceleration)
- Stage 3: Build Mesh
- Stage 4: Build Textures
We record the time taken for each stage. Since various elements of the software are single threaded, others multithreaded, and some use GPUs, it is interesting to record the effects of CPU generations, speeds, number of cores, DRAM parameters and the GPU using this software.
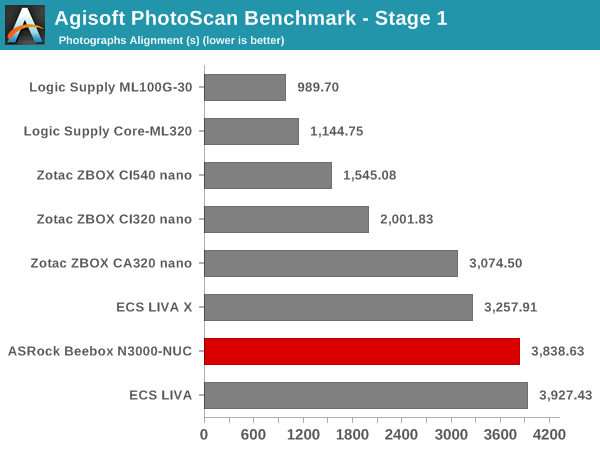
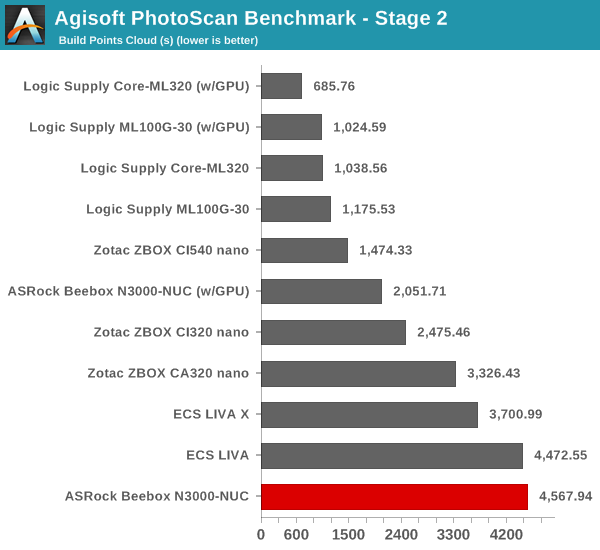
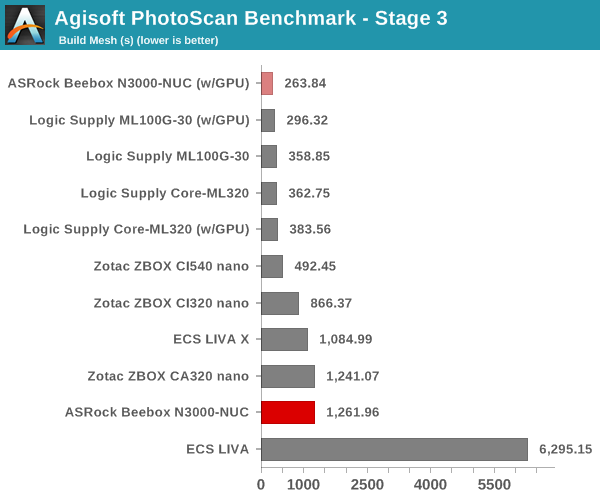
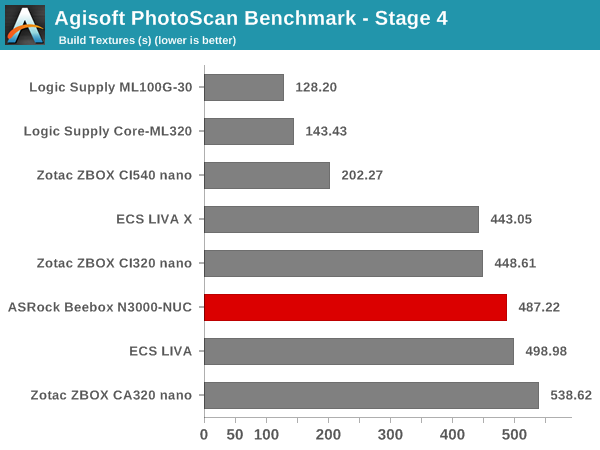
The results don't present any surprises. In general, the CPU performance of Cherry Trail SoCs can match / slightly beat the corresponding Bay Trail SoCs, but GPU performance shows marked increase.
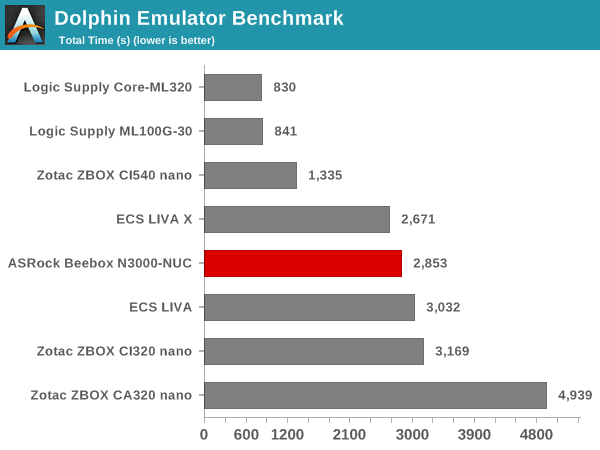
Dolphin Emulator
Wrapping up our application benchmark numbers is the Dolphin Emulator benchmark mode results. This is again a test of the CPU capabilities, and the Beebox makes an appearance in the middle of the pack as expected.
Networking and Storage Performance
We have recently started devoting a separate section to analyze the storage and networking credentials of the units under review. On the storage side, one option would be repetition of our strenuous SSD review tests on the drive(s) in the PC. Fortunately, to avoid that overkill, PCMark 8 has a storage bench where certain common workloads such as loading games and document processing are replayed on the target drive. Results are presented in two forms, one being a benchmark number and the other, a bandwidth figure. We ran the PCMark 8 storage bench on selected PCs and the results are presented below.
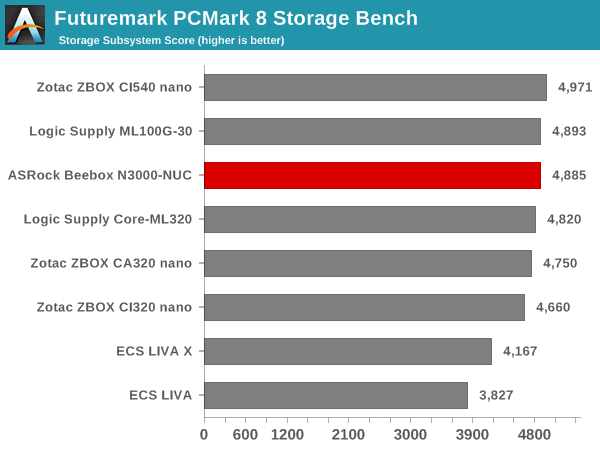
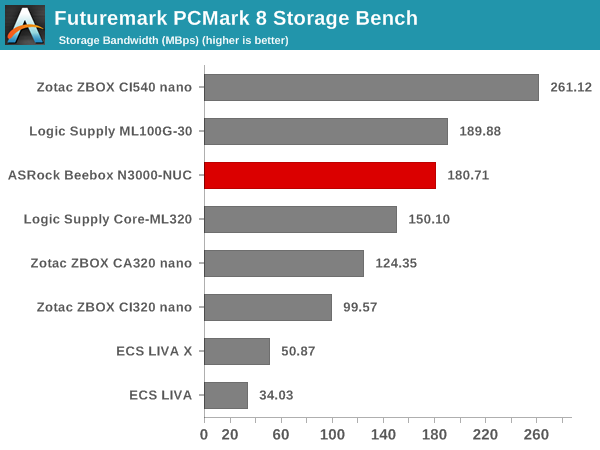
It must be noted that the SSD in our review sample was industrial-grade. The claimed speeds of 510 MBps reads and 300 MBps writes indicate that the controller in the mSATA SSD is likely the Silicon Motion SM2246EN. The PCMark 8 storage bench numbers keep the Beebox in the top half of the graph.
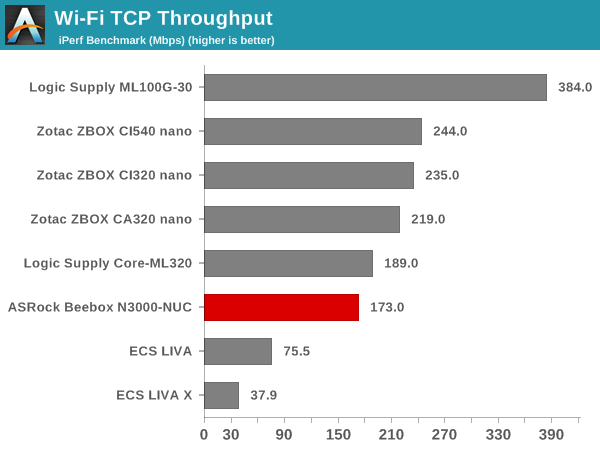
On the networking side, we restricted ourselves to the evaluation of the WLAN component. Our standard test router is the Netgear R7000 Nighthawk configured with both 2.4 GHz and 5 GHz networks. The router is placed approximately 20 ft. away, separated by a drywall (as in a typical US building). A wired client (Zotac ID89-Plus) is connected to the R7000 and serves as one endpoint for iPerf evaluation. The PC under test is made to connect to either the 5 GHz (preferred) or 2.4 GHz SSID and iPerf tests are conducted for both TCP and UDP transfers. It is ensured that the PC under test is the only wireless client for the Netgear R7000. We evaluate total throughput for up to 32 simultaneous TCP connections using iPerf and present the highest number in the graph below.
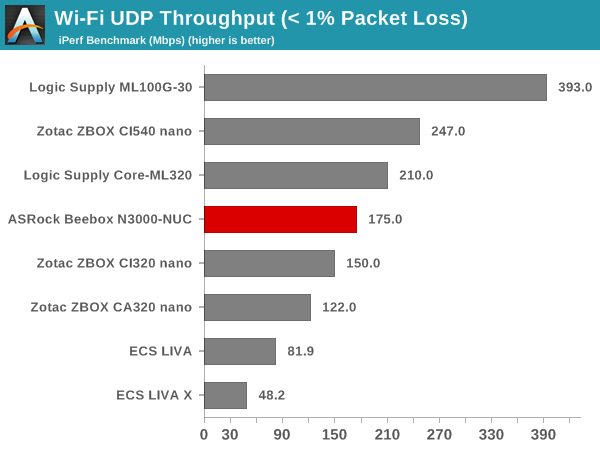
In the UDP case, we try to transfer data at the highest rate possible for which we get less than 1% packet loss.
The Realtek 8821AE 1x1 802.11ac / BT 4.0 combo is no stranger to our testbed. We have seen it before in our GIGABYTE BRIX Pro as well as BRIX Gaming reviews. Unfortunately, the performance of the mPCIe card in the Beebox is not that great - this could be due to a number of factors such as host CPU limitations (Cherry Trail vs. Core-series) and/or antenna placement.
HTPC Credentials
Given the Beebox's fanless nature and the presence of Intel HD Graphics, we expect many purchasers to use it as a media playback machine / HTPC. Given the specifications, it is quite clear that we are not looking at a madVR capable machine, but one targeted at the entry-level / average HTPC user or someone looking for a HTPC to put in a second or third room (non-primary HTPC). There are two HTPC aspects that we will explore in this section, one related to network streaming (OTT services), and the other related to local file playback. Prior to that, we have a small sub-section dealing with refresh rate accuracy.
Refresh Rate Accurancy
Starting with Haswell, Intel, AMD and NVIDIA have been on par with respect to display refresh rate accuracy. The most important refresh rate for videophiles is obviously 23.976 Hz (the 23 Hz setting). As expected, the ASRock Beebox N3000-NUC has no trouble with refreshing the display appropriately in this setting.
The gallery below presents some of the other refresh rates that we tested out. The first statistic in madVR's OSD indicates the display refresh rate.


Network Streaming Efficiency
Evaluation of OTT playback efficiency was done by playing back our standard YouTube test stream and five minutes from our standard Netflix test title. Since YouTube now defaults to HTML5 for video playback, we have stopped evaluating Adobe Flash acceleration. Note that only NVIDIA exposes GPU and VPU loads separately. Both Intel and AMD bundle the decoder load along with the GPU load. The following graph shows the power consumption at the wall for playback of the HTML5 stream in Mozilla Firefox (v 38.0.5).
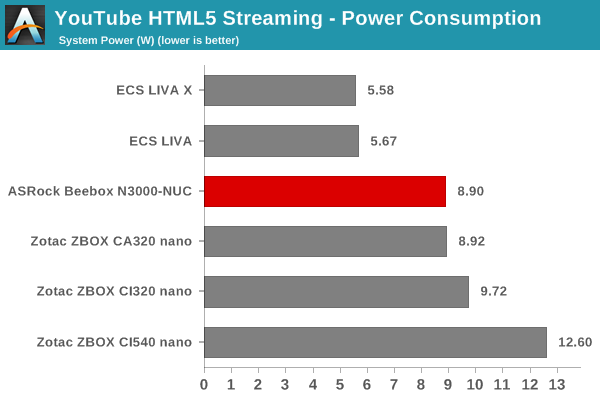
GPU load was around 31.74% for the YouTube HTML5 stream and 7.6% for the steady state 6 Mbps Netflix streaming case.
Netflix streaming evaluation was done using the Windows 8.1 Netflix app. Manual stream selection is available (Ctrl-Alt-Shift-S) and debug information / statistics can also be viewed (Ctrl-Alt-Shift-D). Statistics collected for the YouTube streaming experiment were also collected here.
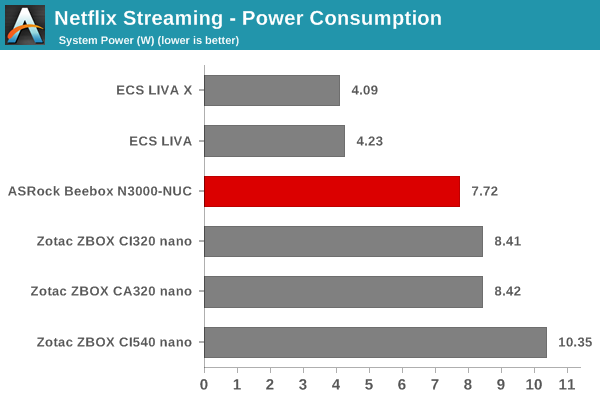
The ASRock Beebox doesn't seem to be the most power-efficient fanless PC available, but it does seem to be the best when it comes to models with replaceable RAM and internal storage.
Decoding and Rendering Benchmarks
Prior to testing out the decoding and rendering performance, we take a look at the DXVA decoding support available via Intel's Braswell GPU drivers.
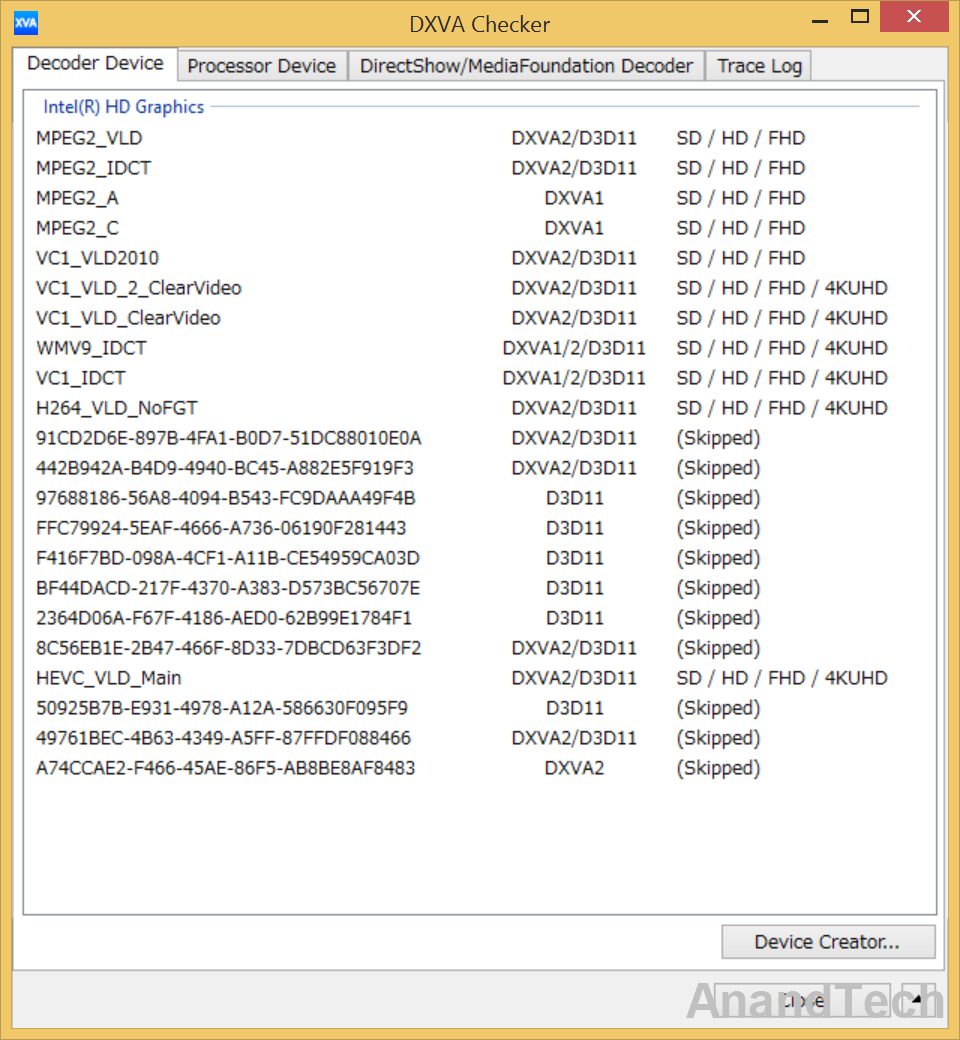
The above screenshot shows that there is hardware acceleration available for MPEG-2, VC-1, H.264 and HEVC. However, there is no HEVC Main10 support.
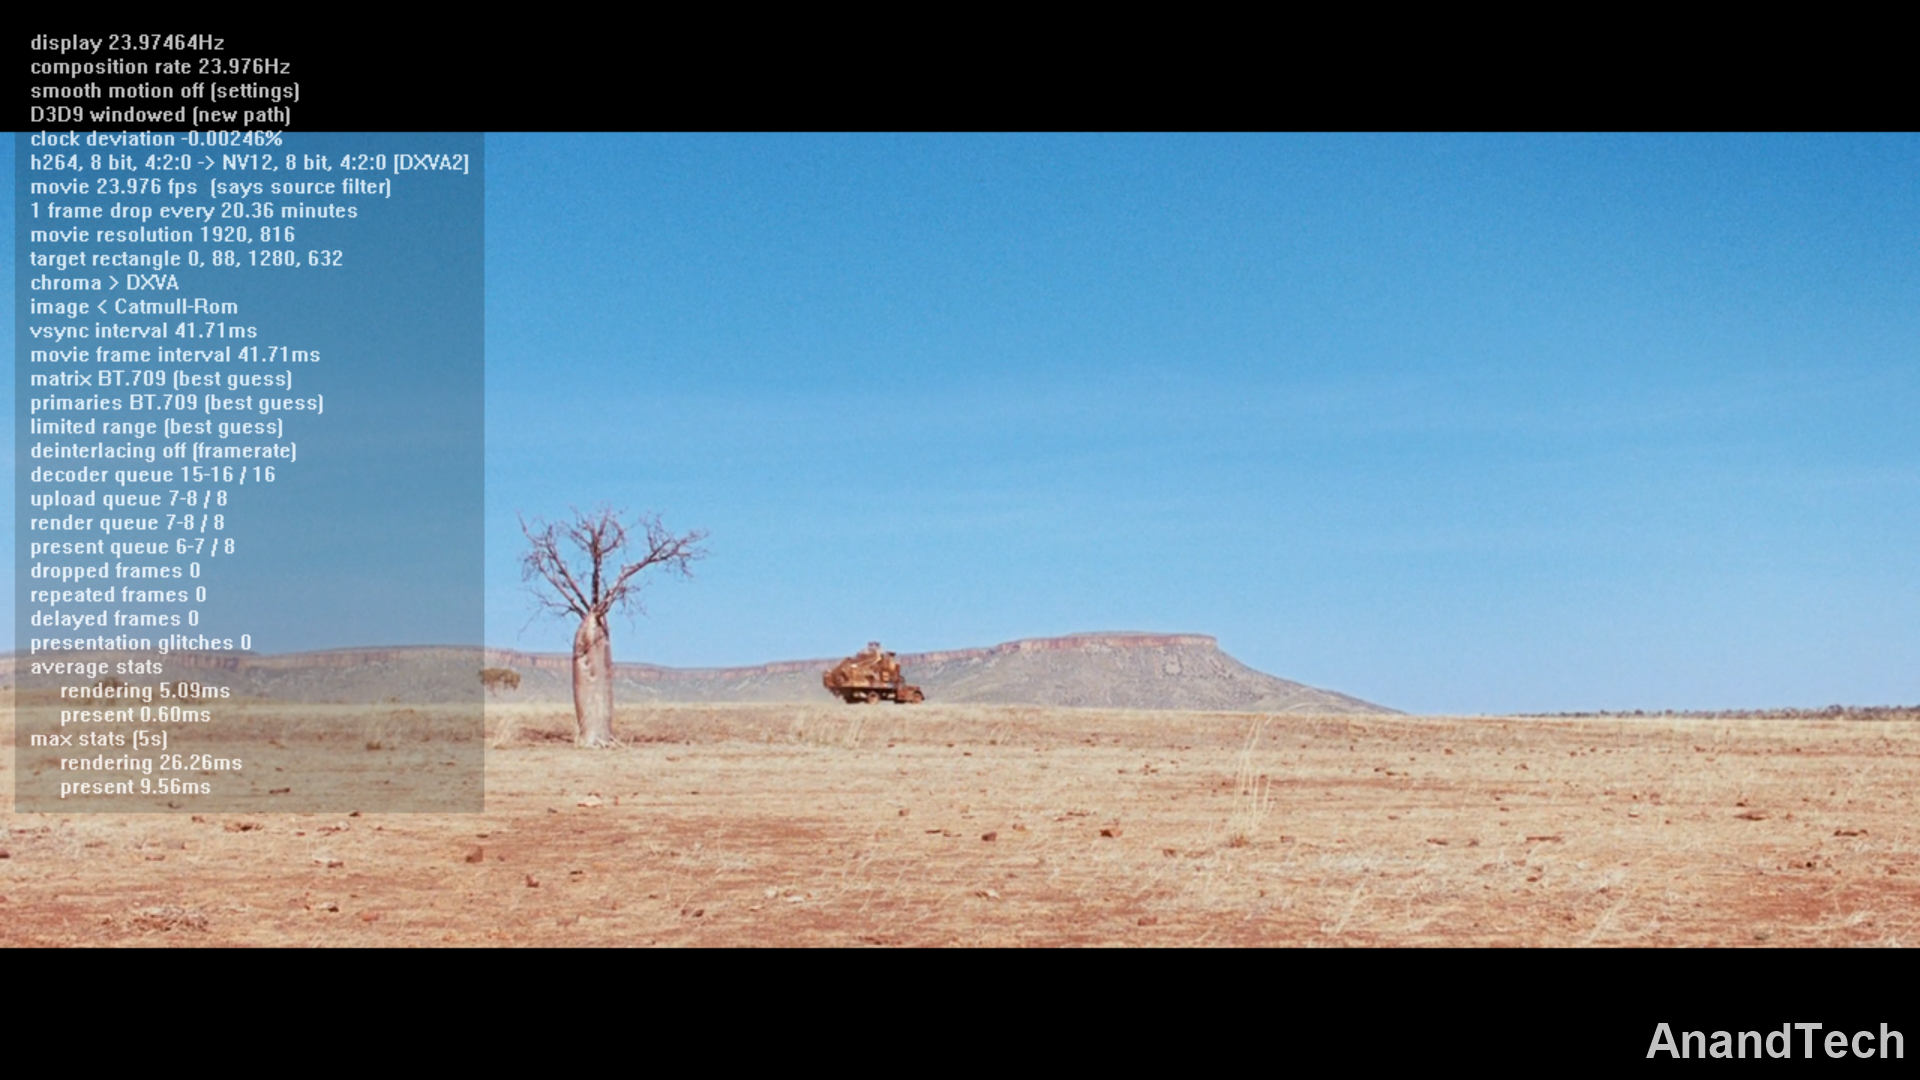
In order to evaluate local file playback, we concentrate on EVR-CP and Kodi. We already know that EVR works quite well even with the Intel IGP for our test streams. In our earlier reviews, we focused on presenting the GPU loading and power consumption at the wall in a table (with problematic streams in bold). Starting with the Broadwell NUC review, we decided to represent the GPU load and power consumption in a graph with dual Y-axes. Nine different test streams of 90 seconds each were played back with a gap of 30 seconds between each of them. The characteristics of each stream are annotated at the bottom of the graph. Note that the GPU usage is graphed in red and needs to be considered against the left axis, while the at-wall power consumption is graphed in green and needs to be considered against the right axis.
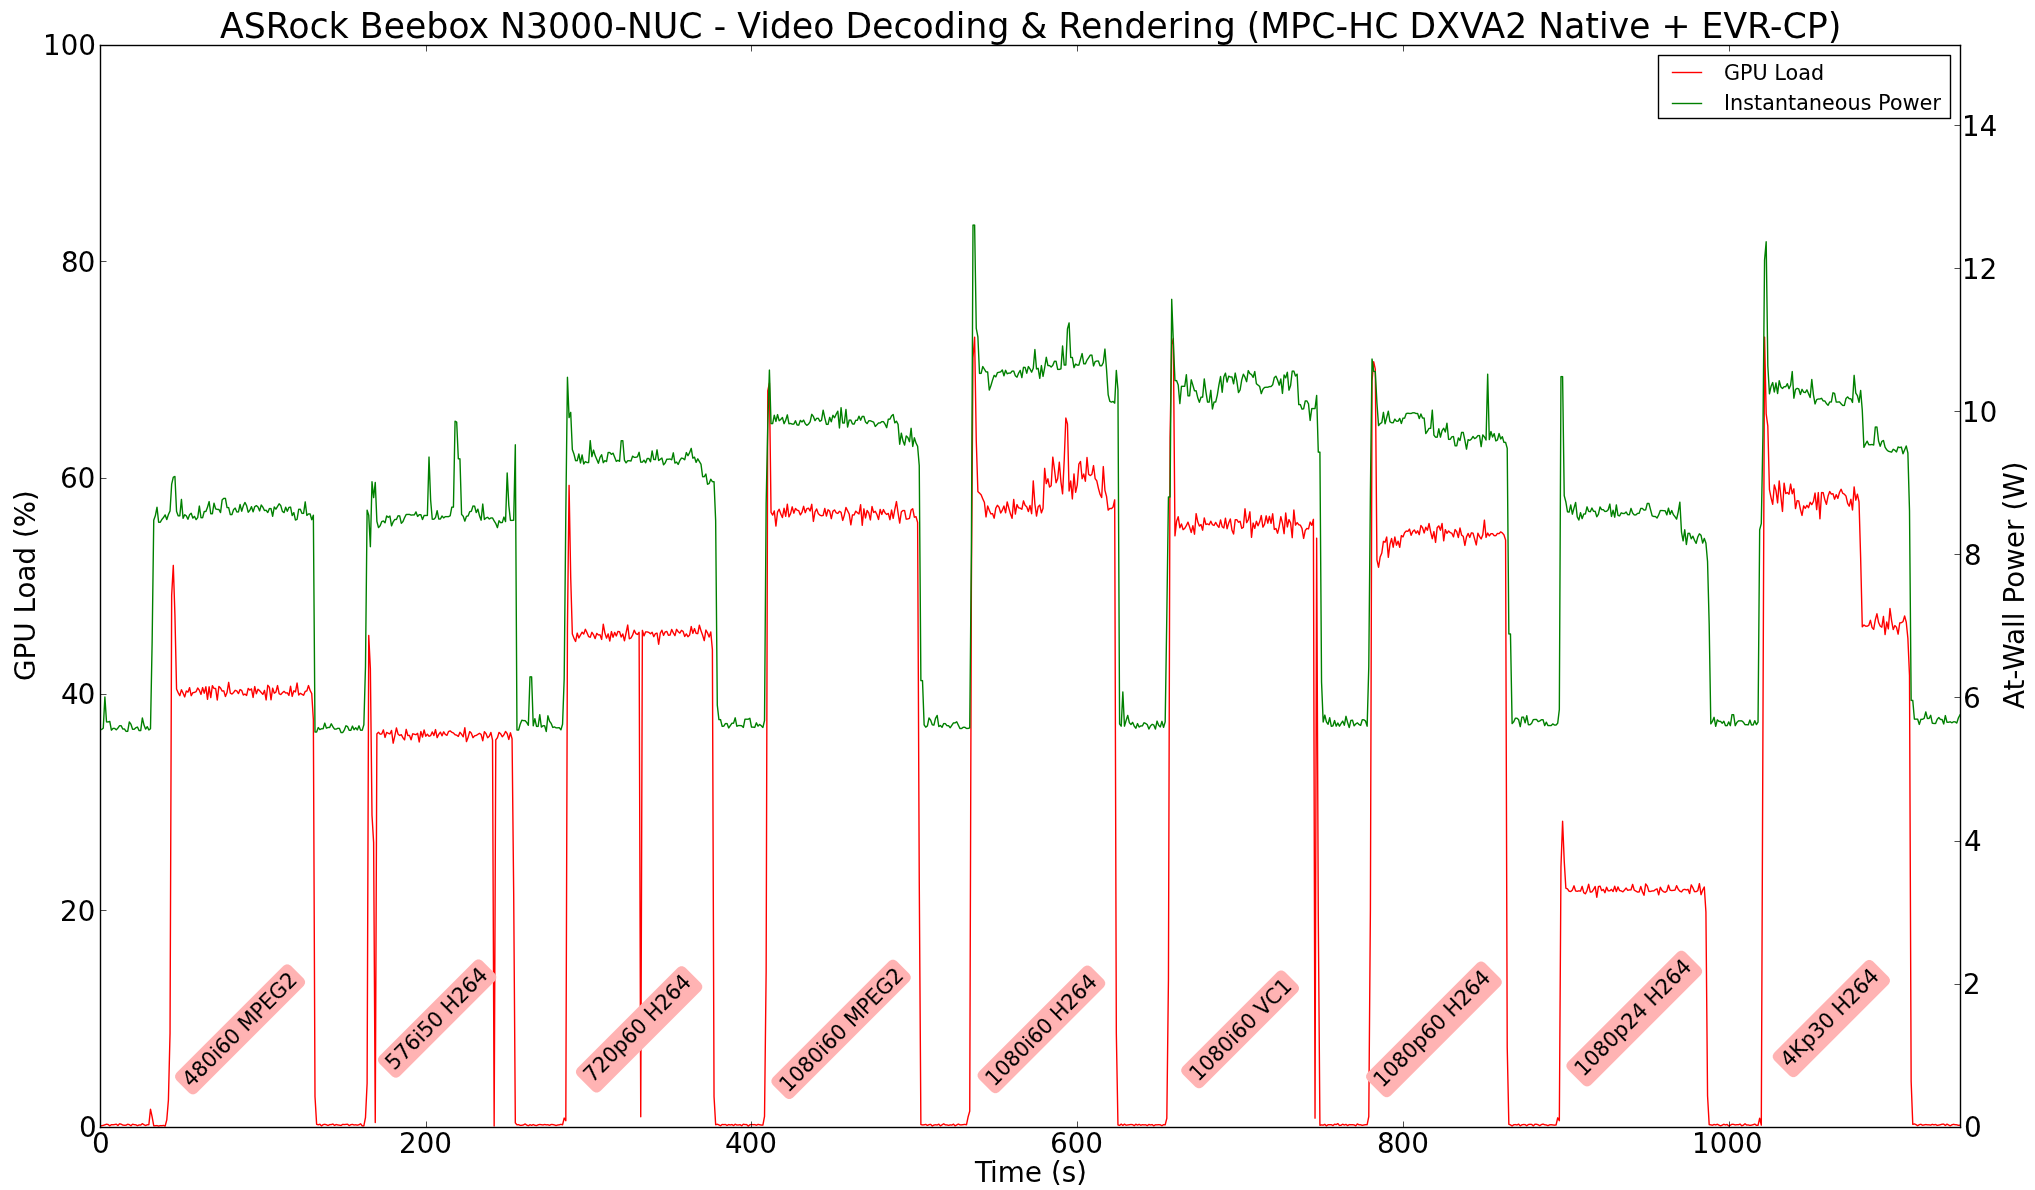
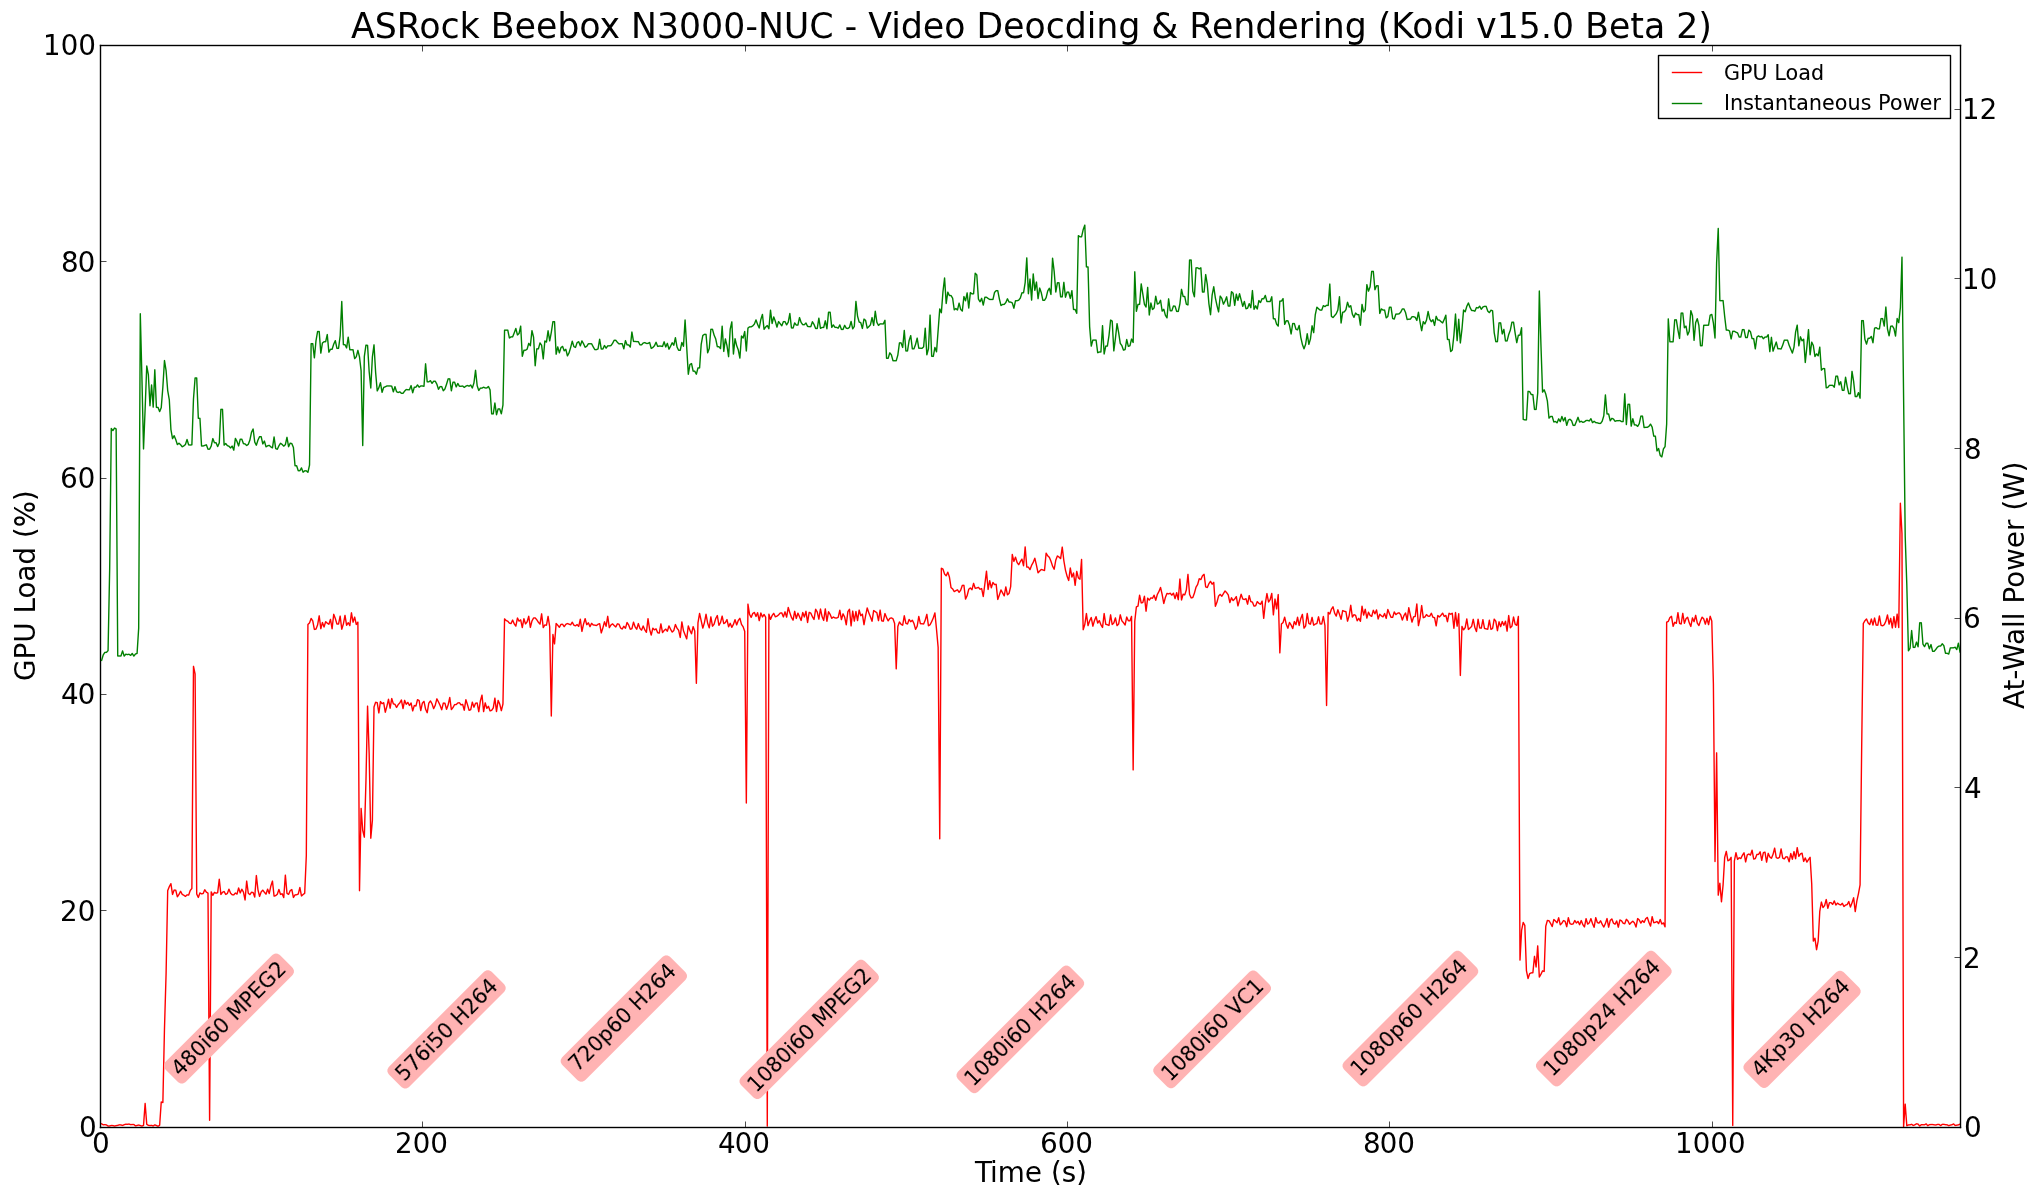
Frame drops are evident whenever the GPU load consistently stays above the 85 - 90% mark. In addition to tracking that aspect in the graphs below, we also get an idea of the system's power efficiency for decode and playback of some common codecs.
In both cases, the ASRock Beebox / Braswell has no problem in playing back our test streams without frame drops. Note that we have not tested out HEVC decoding and rendering - we still believe that, despite the 4K output capabilities, the core platform needs a more well-rounded set of features before it can be recommended for a 4K HTPC setup. Braswell doesn't have HDMI 2.0 or HDCP 2.2, and can't decode HEVC Main10 profile videos even in hybrid decode mode. However, given the $220 price, it is not a big deal.
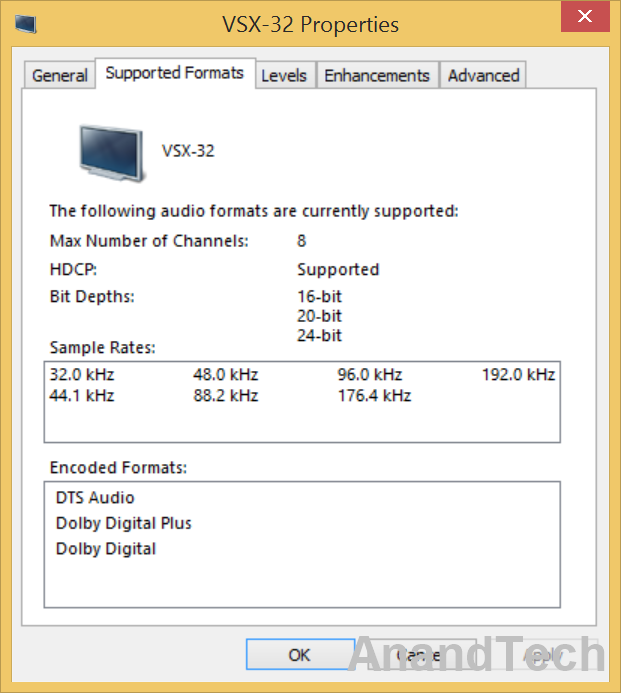
HDMI Audio
One of the issues plaguing early Bay Trail-based units was the absence of HD audio bitstreaming support (DTS-HD MA and Dolby TrueHD). Unfortunately, there seems to be a similar issue with Cherry Trail. The Intel drivers for the Beebox don't have HD audio bitstreaming support, and it is not clear when (if at all) Intel would provide Windows drivers with the feature enabled.
It remains to be seen if the Linux case is any different (the OpenELEC beta that I tried late last month didn't run on the Beebox).
Power Consumption and Thermal Performance
The power consumption at the wall was measured with a 1080p display being driven through the HDMI port. In the graphs below, we compare the idle and load power of the ASRock Beebox N3000-NUC with other low power PCs evaluated before. For load power consumption, we ran Furmark 1.12.0 and Prime95 v27.9 together. In our initial run, the idle power was quite hight (more than 7 W). However, the installation of the Intel iRMT driver (Ready Mode Technology) was necessary to make the system behave well with the default BIOS settings. We repeated our tests after installing iRMT and recorded the numbers below.
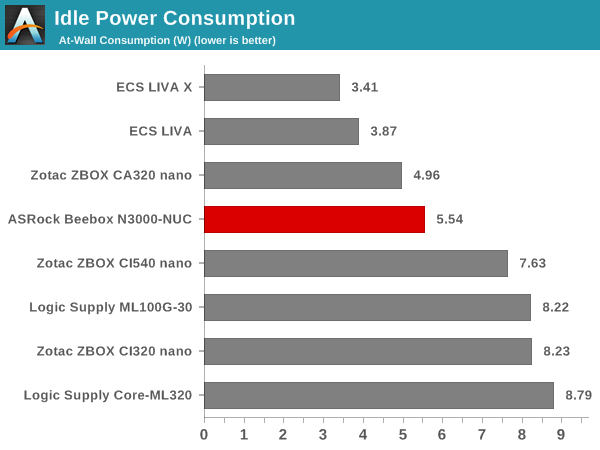
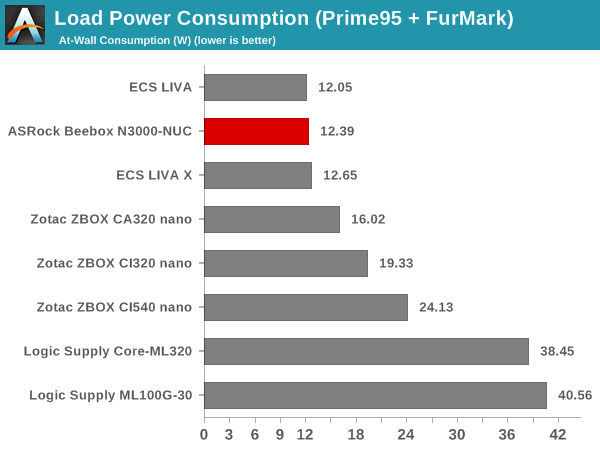
The load power consumption is impressive, but it must be remembered that the SoC has only two cores and a TDP of 4W. The idle power consumption is reasonable, once the replaceable RAM and internal storage are considered.
The various clocks in the system as well as the temperatures within the unit are presented below. We start with the system at idle, followed by 30 minutes of pure CPU loading. This is followed by another 30 minutes of both CPU and GPU being loaded simultaneously. After this, the CPU load was removed, allowing the GPU to be loaded alone for another 30 minutes.
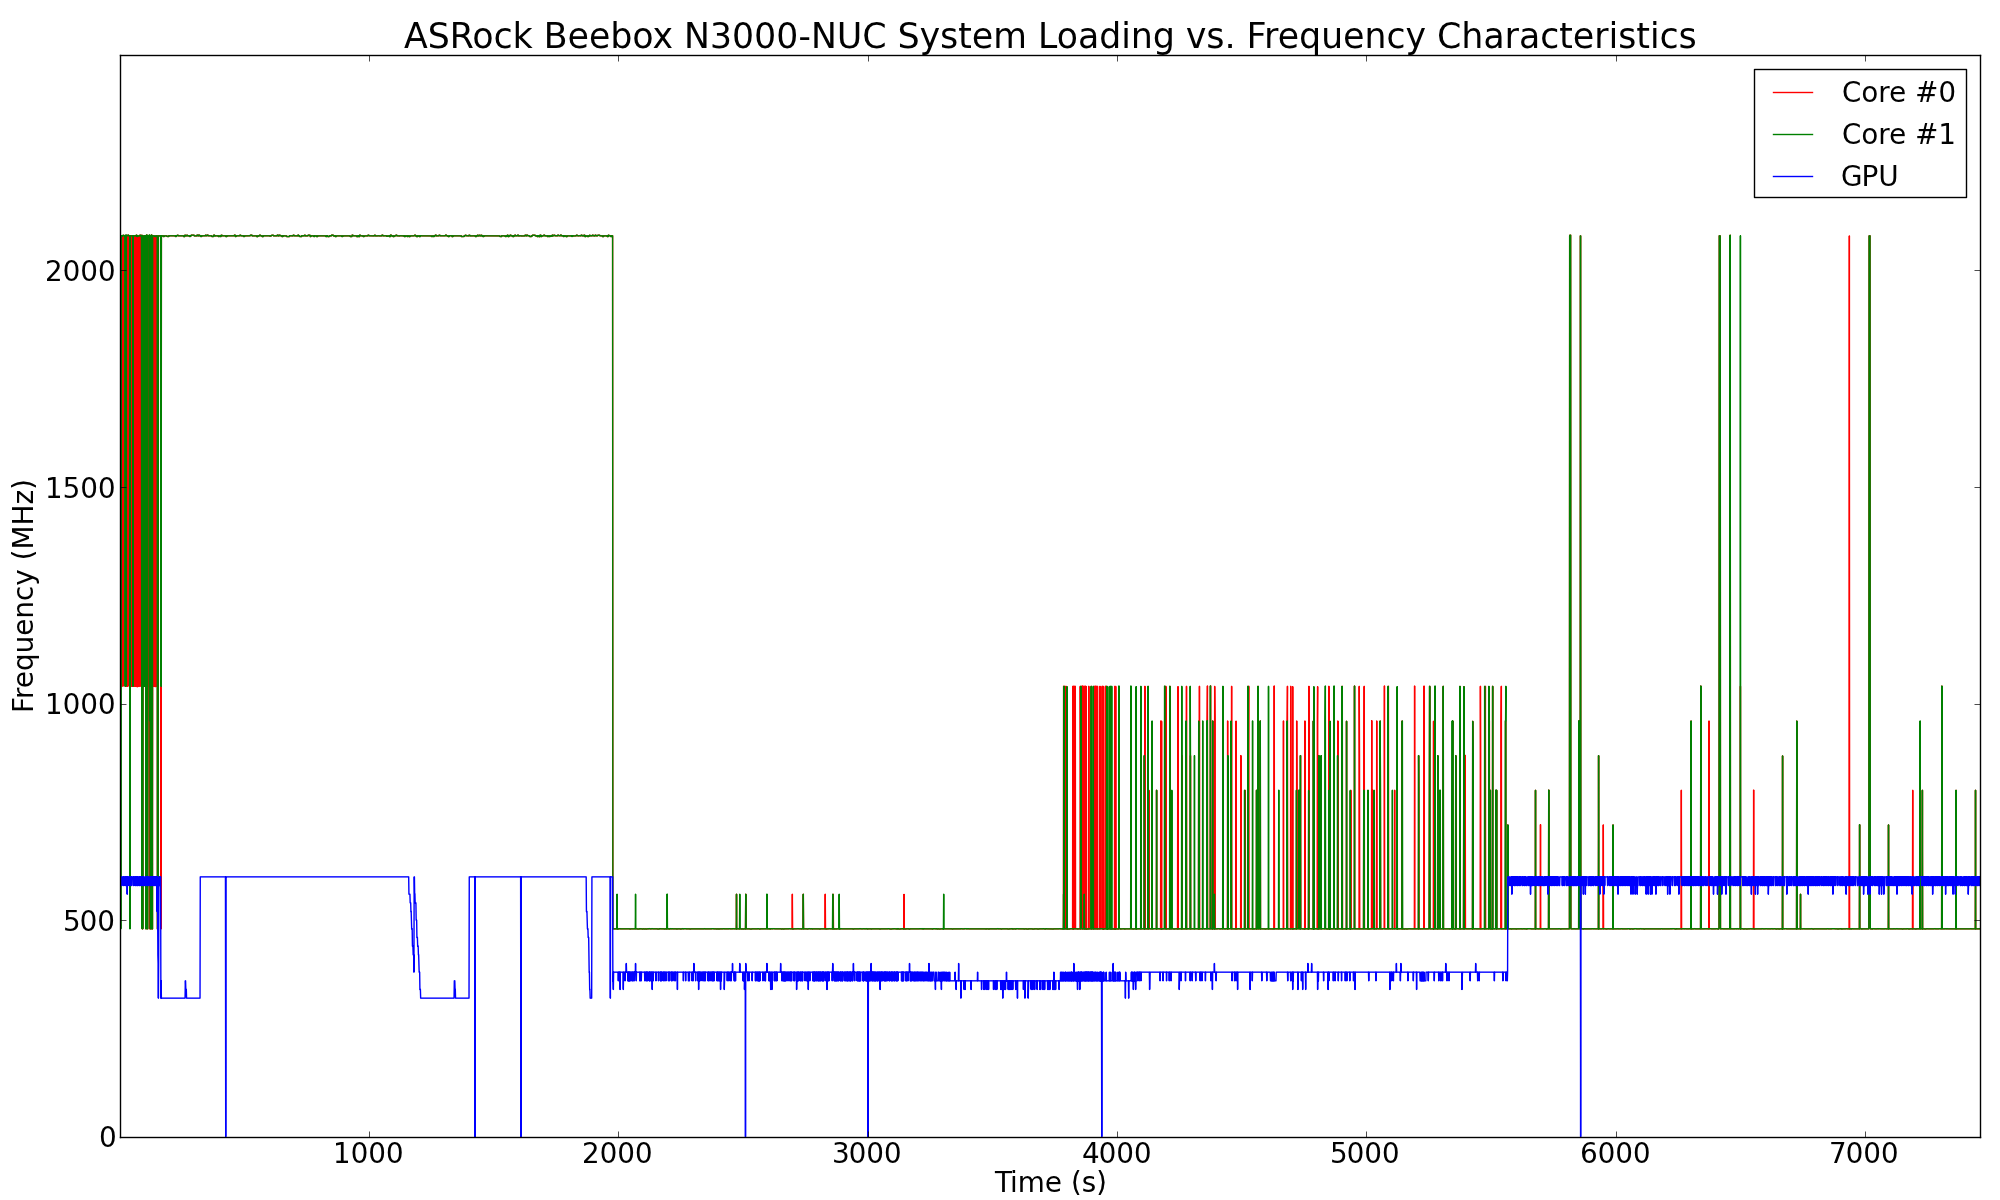
The Celeron N3000 manages to stay at the maximum turbo frequency of 2.08 GHz throughout the pure CPU stress segment. As soon as the GPU starts getting stressed alongside, the CPU cores drop down to around 500 MHz and the GPU starts clocking between 360 MHz and 400 MHz. Removing the CPU stress aspect allows the core to ramp up to 1.04 GHz as necessary to keep Furmark going along smoothly. It can be said that all these frequencies are managed to ensure that the TDP limits are obeyed. Sustained operation at the maximum turbo frequency for pure CPU loading indicates that the system's thermal design doesn't hobble the performance of the unit in any way.
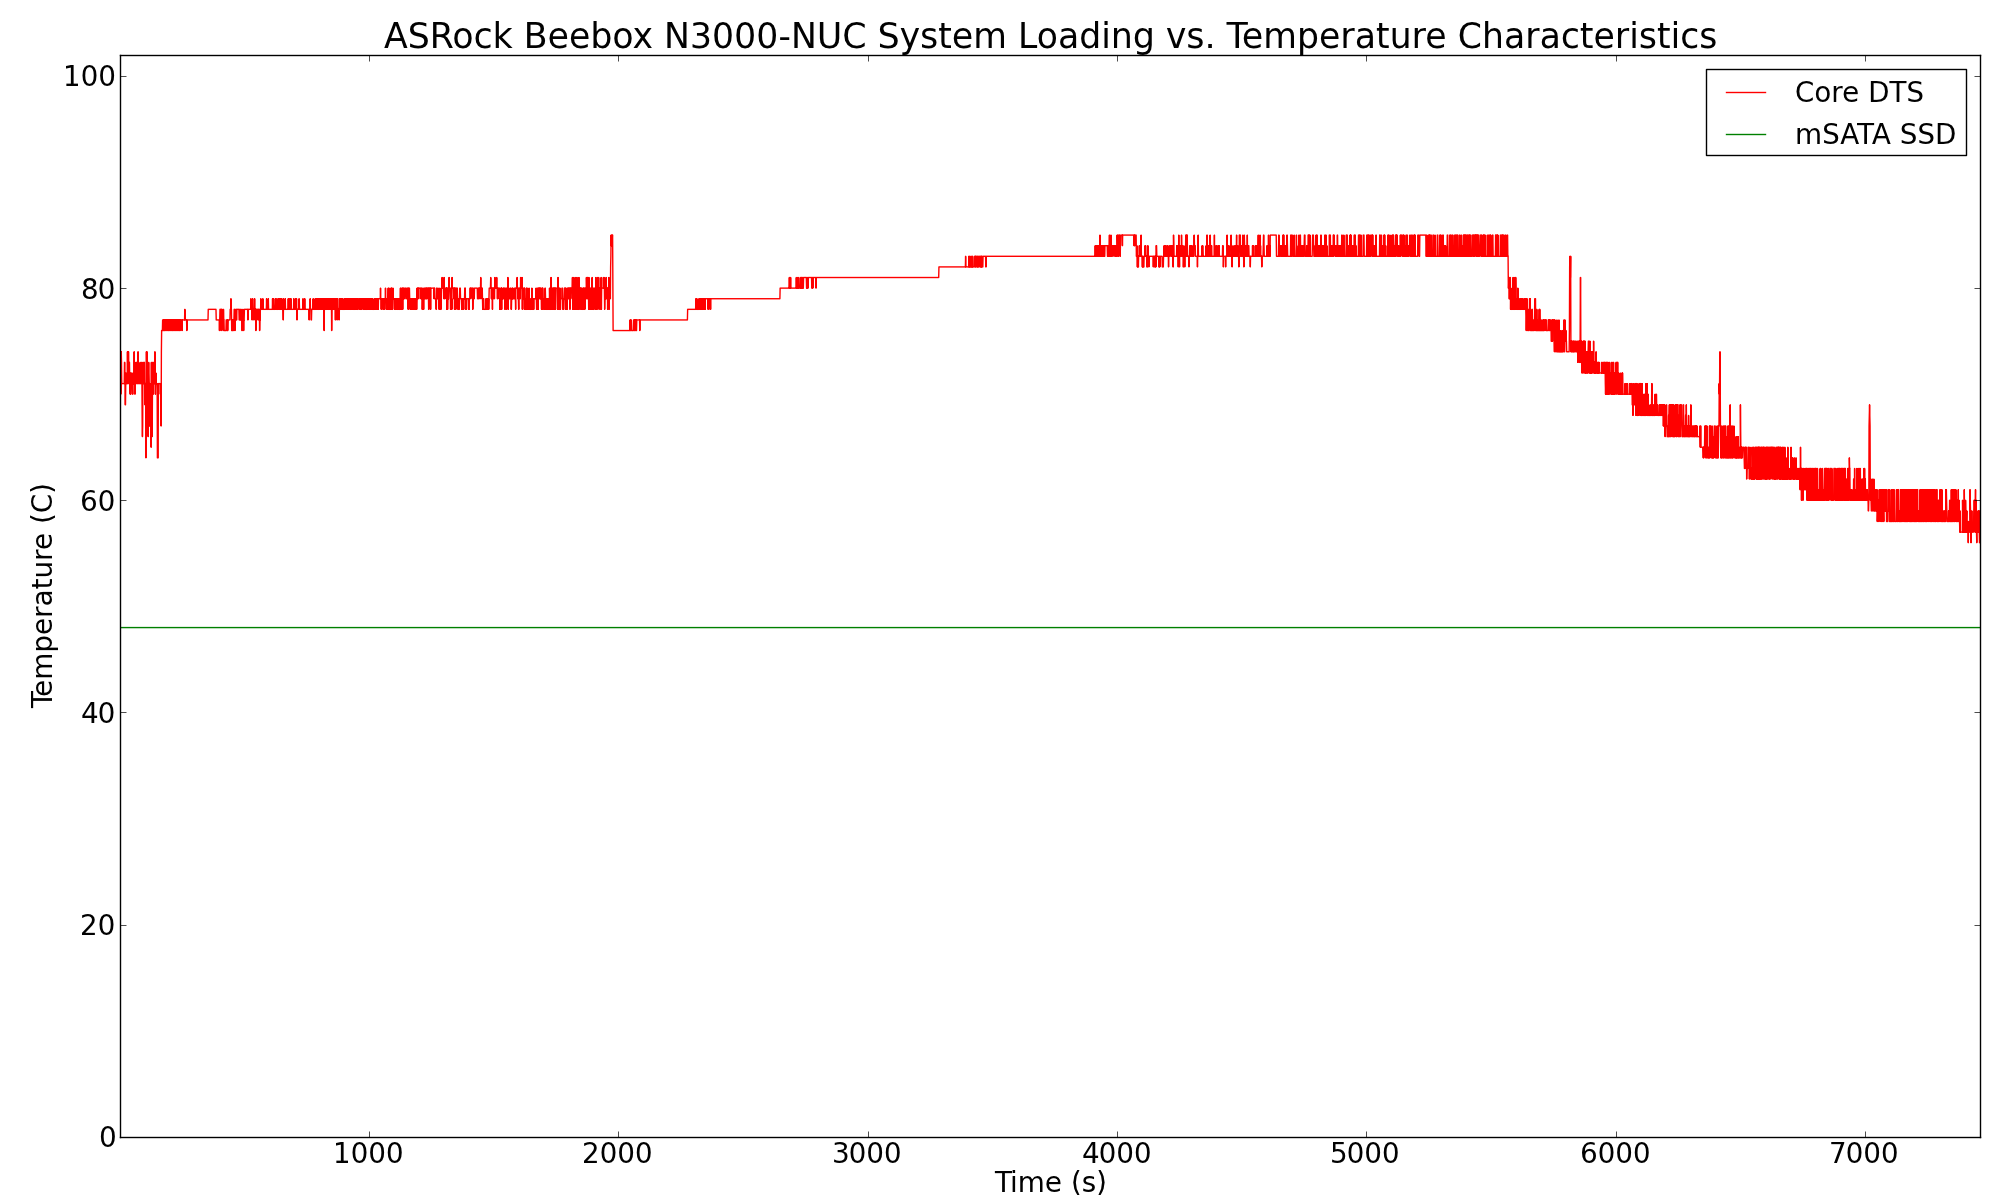
Looking at the internal temperature during the loading process, we find that the thermal solution is able to keep the SoC well below the maximum junction temperature of 90 C. Even under heavy GPU loading (which seems to heat up the SoC faster than pure CPU loading), the temperature stabilizes around 84 C.
Another important aspect to keep note of while evaluating fanless PCs is the chassis temperature. Using Seek Thermal's thermal imager, we observed the chassis temperature after the CPU package temperature reached the steady state value in the above graph.
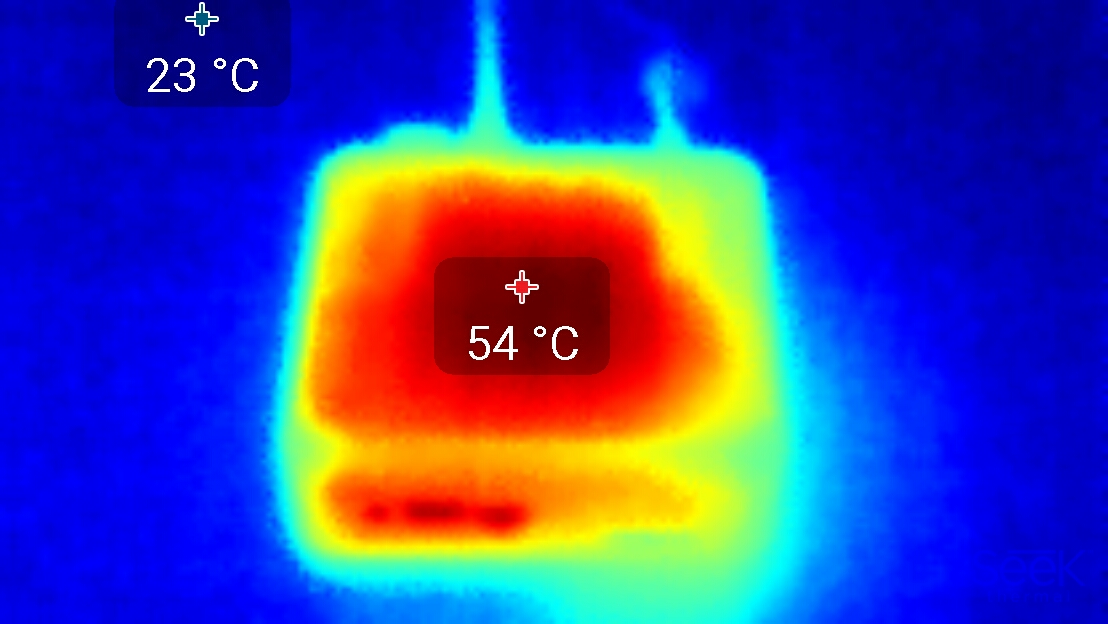


Even under extreme stress, the chassis temperature didn't cross 60 C. As FanlessTech notes, the thermal solution is very similar to that of the Zotac ZBOX C-series - a thermal pad on a small heat sink. However, this crude solution seems to be good enough for the Celeron N3000 - chassis temperatures remain in the safe territory, there is no thermal throttling and the SoC temperature remains well below TJmax.
Final Words
The ASRock Beebox N3000-NUC provided us with the opportunity to evaluate Braswell in a non-mobile form factor. We have already looked at the performance of Intel's Airmont in the Microsoft Surface 3. However, that was in a much more thermally limited configuration. The Beebox is also the first UCFF PC sporting Cherry Trail, and it shows what can be done with power-efficient 14nm SoC in the NUC form factor without active cooling. The fanless aspects make the Beebox suitable for a wide variety of applications including embedded and industrial uses. The surprising aspect is the use of industrial-grade DRAM and SSD modules despite the $220 price point.
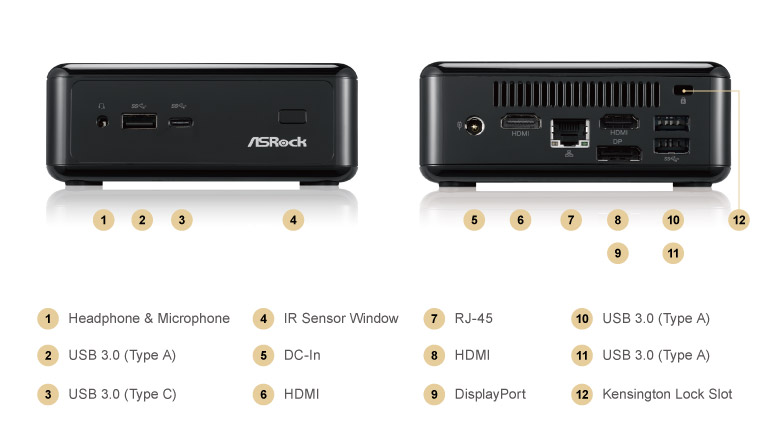
ASRock manages to cram in plenty of features in the small chassis - a USB Type-C port in the front panel, two full-sized HDMI ports and one full-sized Display Port outputs in the rear along with the usual NUC ports - three USB 3.0 and one GbE LAN slot. There is also an IR receiver (and a bundled mini-remote) for wireless control of media playback on the PC. The Beebox is also the smallest NUC that we have seen with support for a 2.5" drive. It is also the only NUC we are aware of with three simultaneous display outputs.
The thermal solution might not be the most elegant or efficient passive cooling setup. However, it gets the job done - the system doesn't throttle and temperatures are maintained well below the junction temperature even under stress. If this is what needs to be done to keep the costs of passively cooled systems down, we don't mind. Consumers looking for more powerful passively cooled systems can always go for the Core-series units from vendors such as Logic Supply.
Despite the above positive aspects, there is scope for improvement from both Intel and ASRock's perspective:
- Intel needs to supply GPU drivers with HD audio bitstreaming (DTS-HD MA and Dolby TrueHD) enabled
- Intel could have improved CPU performance a bit more when compared to Silvermont (particularly given the huge improvement in GPU performance)
- ASRock's chassis design could do with some improvement - a metal chassis would probably bring down the idling temperature below 50 C. In the case that plastic is unavoidable due to cost issues, a perforated top similar to the Zotac ZBOX C-series units could help improve aesthetics.
- ASRock is known for its premium mini-PCs, and it would have been interesting to see what they could have done with the Intel Core-M in a similar chassis.
The Beebox N3000-NUC series starts at $140, and a ready-to-go build without the OS is just $220. This is very good value for the money. In comparison to other fanless mini-PCs, there is almost no pricing premium. However, we get all the performance to power ratio advantages that come along with 14nm silicon. ASRock has also managed to put in plenty of premium features without driving up the price.


