Original Link: https://www.anandtech.com/show/767
NVIDIA GeForce3 Investigation: What NVIDIA didn't tell us
by Kert Chian on May 15, 2001 1:18 AM EST- Posted in
- GPUs
What didn't NVIDIA tell us about their latest creation? Hopefully, you will find the answers at the end of this article. This article sets out to unravel the secrets held within the little black box that is the GeForce3. As a matter of fact, quite a few of these nuggets of information are publicly available but require patience in sifting through the noise and funny names; others from running benchmarks on an 850 MHz Athlon Thunderbird at a dozen different settings day in and day out, swapping a GeForce2 Ultra with a GeForce3 using the latest drivers (Driver version: 4.13.01.1210). Still others come under the section of industrial secrets. The GeForce3's depth buffer optimizations (Z-compression, Z-occlusion culling and Crossbar memory controller) belong to this category.
A Hercules GeForce3

This review isn't intended to be a large comparison of cards, rather it was designed to focus on some of the technologies behind the 57 million transistor GeForce3 core. We suggest that you take a look at our first two reviews of the GeForce3 (Architecture Overview and Performance Review) before proceeding with this one.
The Test
|
Windows 98 SE Test System |
|||||||
|
Hardware |
|||||||
| CPU(s) | AMD Athlon-B (Thunderbird) 850MHz (100MHz DDR FSB) | ||||||
| Motherboard(s) | ASUS A7V133 | ||||||
| Memory | 256MB PC133 Hyundai SDRAM | ||||||
| Hard Drive |
Seagate Barracuda 20GB 7200RPM Ultra ATA 66 |
||||||
| CDROM |
Acer 24X |
||||||
| Video Card(s) |
NVIDIA GeForce2 Ultra 64MB DDR (clocked at 200/230 - core/mem) |
||||||
| Ethernet |
N/A |
||||||
|
Software |
|||||||
|
Operating System |
Windows 98 |
||||||
| Video Drivers |
|
||||||
Note: The GeForce2 Ultra was clocked at a 200MHz core instead of 250MHz to provide for a better tool in our analysis of the GeForce3's advantages.
Z-compression, Z-occlusion culling and Crossbar memory controller
By implementing 4:1 lossless data compression, Z-buffer bandwidth is reduced by a factor of four. In the 3D Mark 2000 fillrate test, translucent quadrilaterals that occupy the entire screen are rendered repeatedly. Because the triangles are translucent and therefore do not occlude one another, Z-occlusion culling does not interfere with fillrate measurement. In addition, framebuffer bandwidth is well-utilized because the test consists of large triangles that occupy half the screen resolution. By this process of exclusion, the vast 32-bit fillrate improvements as is obvious in figure 1 may be fully attributed to Z-compression. The only surprise is 16-bit fillrate, which trails GeForce2 slightly. The likely explanation is that there are no bandwidth constraints in the 16-bit test, and that GeForce2 has better fillrate efficiency (at least in 16-bit mode).
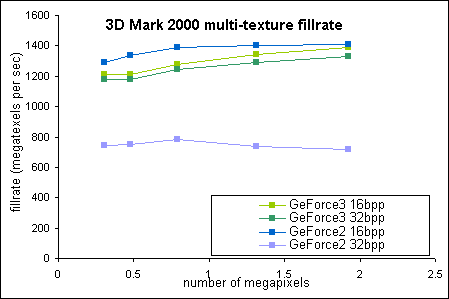
Figure 1: 3D Mark 2000 multi-texture fillrate for GeForce2 and GeForce3
| 16-bit fillrates | 32-bit fillrates | |||
| Resolution | GeForce2 | GeForce3 | GeForce2 | GeForce3 |
| 640x480 |
1293.2
|
1212.3
|
743.7
|
1176.2
|
| 800x600 |
1335.8
|
1212.9
|
750.7
|
1176.6
|
| 1024x768 |
1388.5
|
1278
|
782.8
|
1244.8
|
| 1280x1024 |
1405.2
|
1345.5
|
739.4
|
1292.2
|
| 1600x1200 |
1408.1
|
1391.5
|
717.5
|
1327.5
|
The vastly superior 32-bit fillrate, as measured in 3D Mark 2000, is in
fact borne out in real-world benchmarks. As a matter of fact, GeForce3 32-bit
fillrate frequently exceeds GeForce2 16-bit fillrate! The high polygon counts
and wasted overdraw of such benchmarks provide ample opportunities for further
optimizations, and serve as indirect proof of the existence of Z-occlusion
culling and crossbar memory controllers.
To reduce the wasted bandwidth that results from texturing occluded pixels,
Z-occlusion culling has been implemented. Efforts at understanding GeForce3
Z-occlusion culling were thwarted by NVIDIA's reluctance to reveal what
they perceived as proprietary information. In the absence of an official
explanation, we can only make a few deductions. A very important principle
is that early Z-testing, i.e. prior to texture mapping, is a tradeoff between
bandwidth reduction and overall rendering time. The more extensive the early
Z-testing, the greater the time spent and the longer the overall rendering
time. It is also important that the application sends objects for rendering
approximately in a front to back sequence. With that in mind, three considerations
for early Z-testing are discussed.
First, does early Z-testing involve evaluating whole polygons or
the depth value of each pixel? Evaluating whole polygons may take place
even earlier in the graphics pipeline, i.e prior to triangle setup. Triangular
artifacts may result if the criteria for rejecting polygons are overly aggressive.
In addition, occluding polygons that intersect may not be resolved satisfactorily.
On the other hand, evaluating pixels are less prone to visual artifacts.
From a reading of the GeForce3 whitepapers, one may infer a per pixel process
is being used.
Second, we must apply early Z-testing very selectively when there is a reasonably good chance that the pixels or polygons that are being tested are in fact occluded. This especially holds true in a per pixel process. One way this may be achieved is by choosing pixels in that are in a foremost position. NVIDIA has a patent to greatly accelerate the generation of pixels with high pixel to texel ratios during triangle setup. A pixel with a high pixel to texel ratio would seem like a good candidate for use as an occluder. Furthermore, being able to generate such pixels a few orders of magnitude faster than the usual triangle setup is a big plus.
Third, is the early Z-testing on-chip or off-chip? Obviously, being able to keep operations on-chip will be tremendously fast, but there are limits to the amount of depth information that may be stored on-chip. So, having an off-chip repository might be a more flexible and a more scaleable as far as storage space is concerned. The bandwidth overhead may be amortized by a crossbar memory controller that load balances itself to service early Z checks.
Crossbar memory controller
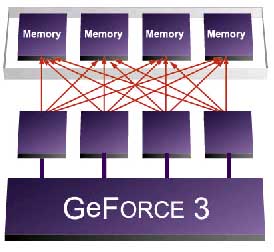
The crossbar memory controller, of which there are four,
is capable of 64-bits of individual access. These controllers communicate
with each other, the framebuffer and the rest of the graphics subsystem.
If there are only 64-bits of framebuffer access (equivalent to a scanline
with two 32-bit pixels or four 16-bit pixels), it is entirely plausible
that the other three controllers may be load balanced to service early Z-checks
or texture queues.
The 'Serious Sam Test 2' benchmark shows the synergistic effects of the
aforementioned bandwidth optimizations. There are on average 12,500 triangles
per frame. Objects that require three texture layers are rendered in at
least two passes. In a sense, this puts the GeForce3 at a disadvantage as
two passes can be collapsed into a single pass on its quad-texturing hardware
and thereby save a framebuffer readback.
With reference to figure 1, recall that 16-bit theoretical fillrates of
GeForce2 and GeForce3 are comparable. However, figure 2 (below) shows GeForce3
with a significant lead over GeForce2 in 16-bit rendering. Z-compression
is a definite factor here. Again with reference to figure 2, note that GeForce3
at 32-bit color only comes close to, but does not exceed, GeForce2 at 16-bit
rendering. This is in spite of GeForce3 using only a 16-bit Z-buffer as
well as Z-buffer optimizations. It would appear that GeForce3 is unable
to compensate for the 32-bit color buffer readbacks that are a consequence
of multi-pass rendering.
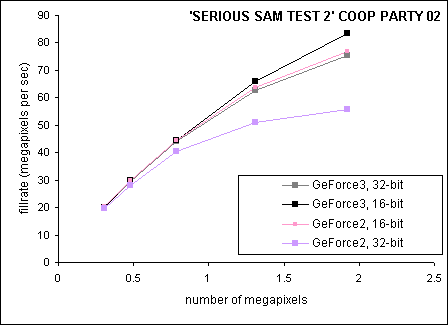
Figure 2: Serious Sam Test 2
| Resolution | 640x480 | 800x600 | 1024x768 | 1280x1024 | 1600x1200 |
| GeForce3, 16-bit |
65.1 |
62 |
56.6 |
50.4 |
43.5 |
| GeForce3, 32-bit |
65.4 |
61.4 |
56.0 |
47.8 |
39.2 |
| GeForce2, 32-bit |
64.4 |
58.7 |
51.3 |
38.9 |
29.0 |
| GeForce2, 16-bit |
66.2 |
62.3 |
56.7 |
48.6 |
40.0 |
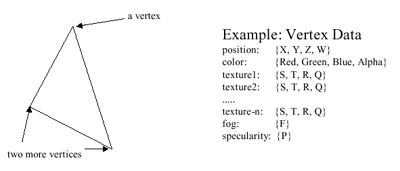
Vertex shader
The vertex shader, a logical progression from hardwired transformation and lighting, permits the modification of the attributes of each vertex such that the resultant output has a different position in space, color or texture coordinates. All of these vertex changes create the special effect for the object.
The 'Dronez rolling demo' (figure 3) features smooth animation that is made possible by keyframe interpolation, vertex blending for realistic looking characters and per pixel lighting, all accelerated with vertex shaders. In the case of hardware with fixed transformation pipeline, these processes are handled on the central processing unit. Unlike vertex shader emulation that totally bypasses the fixed hardware transformation pipe, the developers have an effective software fallback mechanism that takes advantage of fixed hardware transformation whenever possible.
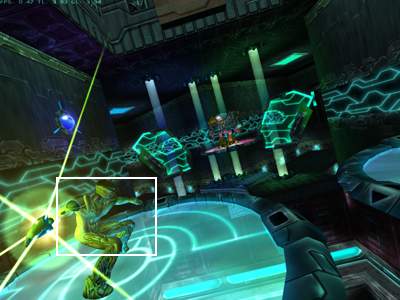
Figure 3: Dronez Rolling Demo. The boxed region is rendered at high resolution
in figures 4 to 7.
Vertex blending prevents the distortion of vertices around a joint. Its effect can best be appreciated by comparing the wireframe and textured models below, paying attention to the shoulder, hip and knee joints (figures 4 to 7). Since these joints are influenced by at least two bones, the different positions resulting from the influence of each bone are blended together to generate a single vertex position. With the vertex blended (or skinned), the light vector of each vertex needs to be realigned to a position that is suitable for per pixel lighting. Per pixel lighting occurs further along the graphics pipeline, during the texture mapping stage. The textured model in figure 5 also shows per pixel lighting. Note the subtle bump mapping, especially on the left leg.
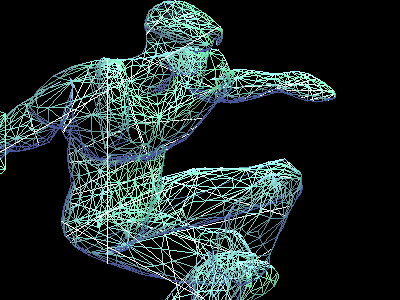
Figure 4: Wireframe model showing vertex blending
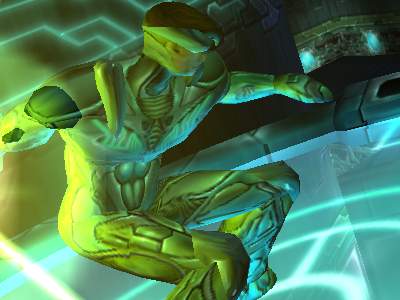
Figure 5: Textured model showing vertex blending and per pixel lighting
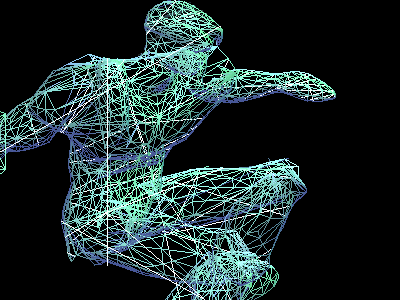
Figure 6: Wireframe model without vertex blending
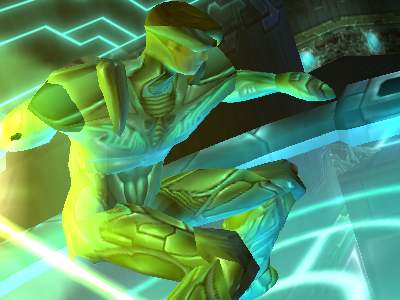
Figure 7: Textured model showing distortion at the major joints as well as
vertex lighting
The Performance Impact of Vertex Shaders
In the 'Dronez rolling demo', enabling vertex shaders has the effect of doubling or tripling GeForce3's triangle load (Figure 8). Triangle loads with vertex shaders enabled and disabled average 15300 and 7800 triangles per frame respectively. It must be emphasized that the degree of tesselation and quality of animation is similar in either mode. The more likely explanation to account for the divergent triangle counts is that in vertex shader mode, streams of vertex data are retrieved in multiple passes. Due to the limited space with which to store vertex attributes on the graphics processor, it is concievable that data may be retrieved in multiple passes for keyframe interpolation (two or more positions), vertex blending (matrices) and lighting (texture space coordinates). This does not necessarily imply that absolute geometry bandwidth is increased by a factor of two to three, provided that components of vertex data rather than the entire contents are retrieved during each pass.
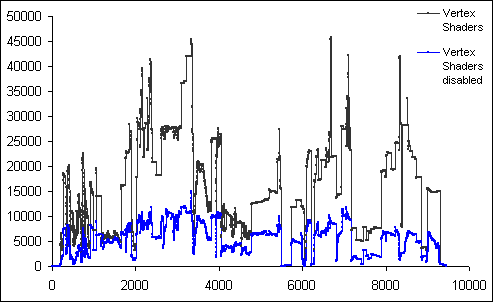
Figure 8: Triangle counts over 9000 plus frames of the 'Dronez rolling demo'.
Bump mapping enabled.
The rate at which vertices are modified is heavily dependent upon the instruction length of the vertex shader, in contrast to the invariant rate of hardwired transformation. GeForce3 executes one instruction in one cycle. To put this in perspective, consider that a simple transform with a six-instruction vertex shader processes 3.3 million vertices in one second. On the other hand, GeForce3's fixed transformation pipe is capable of approximately 16.6 million vertices per second (as measured on 3D Mark 2001). This dependency on instruction length is reflected in the fillrate graphs in figure 9. A vertex shader that only controls keyframe interpolation and vertex blending is faster than one which adds per pixel lighting after these animation routines. Having said this, figure 9 indicates that GeForce3 actually does an excellent job of relieving the central processing unit of vertex operations. At high resolution, the bottleneck shifts to memory bandwidth bandwidth.
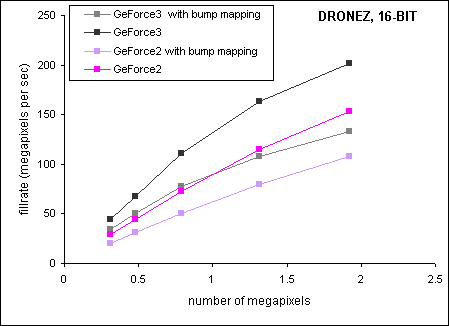
Figure 9: Dronez rolling demo. GeForce3 - vertex shader enabled. GeForce2
- vertex shader disabled.
| Resolution (16-bit color) | 640x480 | 800x600 | 1024x768 | 1280x1024 | 1600x1200 |
| GeForce2, bump mapping |
66.05 |
64.36 |
63.92 |
61.14 |
56.15 |
| GeForce2 |
94.5 |
93.35 |
92.22 |
87.96 |
79.76 |
| GeForce3, bump mapping |
112.45 |
104.18 |
98.46 |
82.67 |
69.56 |
| GeForce3 |
144.46 |
141.6 |
141.17 |
124.29 |
104.96 |
Anti-aliasing
The key difference between GeForce3 and GeForce2 anti-aliasing is that the
former is capable of multi-sampling while the latter resorts to supersampling.
GeForce2 renders the screen image at a much higher resolution than the current
display mode, and then scales and filters the image to the final resolution
before it is sent to the display. On the other hand, GeForce3 renders the same
pixel data into multiple locations offset by a small amount (less than a pixel
in size). These subpixels are generated at the end of the pixel processing stage,
just before framebuffer write.
GeForce3 consumes the same texture bandwidth even with anti-aliasing turned
on. Texture resolution is the same as without multi-sampling. In addition, the
same quantity of textures are used. There is, therefore, no improvement in texture
quality with anti-aliasing turned on. Quincunx multi-sampling merits further
elaboration. It generates two subpixels, as in 2-sample multi-sampling. It differs
from 2-sample multi-sampling in that it additionally samples from 3 neighbouring
pixels to compute the final pixel color. As can be imagined, this reduces texture
fidelity. A high frequency texture shows this to good effect (figures 10 to
11).
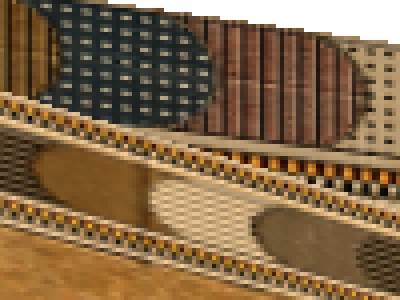
Figure 10: aliased image (enlarged 4x with nearest neighbour sampling)
Figure 11: Quincunx anti-aliasing (enlarged 4x with nearest neighbour sampling)
Contrast this with GeForce2 supersampling. Since the scene is rendered at a
higher resolution, a greater quantity of texture data is needed for the same
degree of anti-aliasing. In addition, textures of a higher resolution and clarity
are also used. The negative aspect is that texture bandwidth is increased by
a multiple of the degree of anti-aliasing. On a positive note, the anti-aliased
scene has sharper texture detail.
The following observations are made with regards to quality of anti-aliasing
at the edges. For the same degree of anti-aliasing, differences at the edges
between GeForce3 and GeForce2, if any, are not noticeable. 2-sample multi-sampling
generates far too few subpixels for high quality anti-aliasing. Quincunx multi-sampling
is very good below approximately 15 degrees from the vertical or horizontal,
better than 4-sample multi-sampling (figure 12). However, if all angles are
taken into account, the overall best solution still belongs to 4-sample multi-sampling.
 |
 |
 |
| 2-sample multi-sampling | Quincunx multi-sampling | 4-sample multi-sampling |
 |
 |
 |
| 2-sample multisampling | Quincunx multi-sampling | 4-sample multi-sampling |
Figure 13: Anti-aliasing at 40 degrees
Anti-aliasing performance
GeForce2 and GeForce3 anti-aliasing involve two stages. First, render samples to framebuffer. Second, blend samples and output anti-aliased image to framebuffer.
GeForce2 vs GeForce3 anti-aliasing
During the first stage of GeForce3 multi-sampling, texture bandwidth requirements are not increased from normal rendering. For GeForce2 supersampling, texture bandwidth is increased from normal rendering by a multiple of the degree of anti-aliasing. The 'super' color pixel buffer bandwidth is similar for both GeForce2 and GeForce3, given the same degree of anti-aliasing. Thanks to Z-compression, 'super' depth buffer bandwidth is lesser for GeForce3. During stage two, GeForce2 and GeForce3 consume the same bandwidth when during sampling for the same degree of anti-aliasing. When writing anti-aliased pixels to the framebuffer, GeForce2 additionally writes to the depth buffer. By virtue of its bandwidth advantage, GeForce3 has a sizeable performance gain over GeForce2 (figure 14).
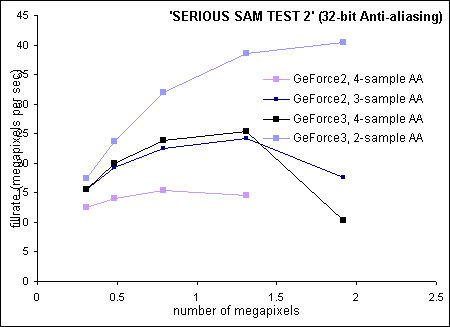
Figure 14: 32-bit anti-aliasing of GeForce2 and GeForce3
| Resolution (32-bit color) | 640x480 | 800x600 | 1024x768 | 1280x1024 | 1600x1200 |
| GeForce2, 4-sample AA |
40.9 |
29.2 |
19.5 |
11.1 |
not able |
| GeForce2, 3-sample AA |
50.6 |
40.3 |
28.7 |
18.4 |
9.2 |
| GeForce3, 4-sample AA |
50.4 |
41.7 |
30.4 |
19.3 |
5.4 |
| GeForce3, 2-sample AA |
56.9 |
49.3 |
40.6 |
29.4 |
21.1 |
Quincunx vs 2- and 4-sample GeForce3 multi-sampling
For low resolution anti-aliasing, 4-sample multi-sampling is faster than Quincunx because the latter uses a wider sampling frame, with poor cache coherency. At higher resolutions where bandwidth takes precedence, Quincunx uses less bandwidth than 4-sample multi-sampling. Quincunx only consumes greater bandwidth than 2-sample multi-sampling during the sampling stage two. In addition to retrieving two distinct samples as per 2-sample multi-sampling, Quincunx also retrieves three shared samples.
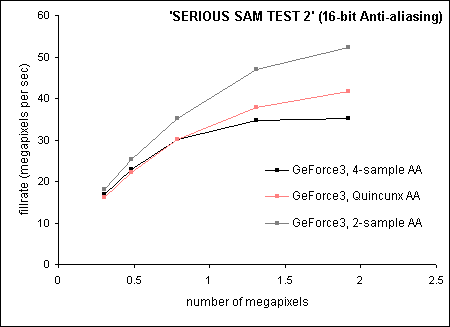
Figure 15: 16-bit GeForce3 multi-sampling
| Resolution (16-bit color) | 640x480 | 800x600 | 1024x768 | 1280x1024 | 1600x1200 |
| GeForce3, 2-sample AA |
58.9 |
52.6 |
44.8 |
35.9 |
27.2 |
| GeForce3, Quincunx AA |
52.8 |
46.1 |
38.4 |
28.9 |
21.7 |
| GeForce3, 4-sample AA |
54.6 |
47.7 |
38.4 |
26.4 |
18.3 |
Final Words
The vertex shader is a welcome breath of fresh air. One obvious future trend is extended instruction sets or increased instruction length as higher graphics processor performance becomes possible. Feedback of modified vertices may be important if precise collision or silhouette detection are required.
That brings us to the next issue. The shifting of geometry processing from the central processing unit to the graphics processing unit has several implications with regards to memory bandwidth. First, geometry traffic will further increase across the Accelerated Graphics Port bus (AGP) as the use of vertex shader becomes firmly entrenched. Because the graphics processor is good at what it does and as it shoulders greater responsibility, the demands placed on pixel bandwidth will become even heavier. To a certain extent, the pixel bandwidth load has been lightened by GeForce3's depth buffer optimizations but that still leaves much to be desired with regards to high resolution rendering and anti-aliasing with a full spectrum of colors.
The questions are: To what extent can current rendering architecture be leveraged? Is it possible to further optimize the mysterious Z-occlusion culling? What about color buffer compression? Perhaps a paradigm shift (buzzword alert!) is in order. Redefine the graphics pipeline on graphics application interfaces (API) with emphasis on early hidden surface removal and continue active developer support. NVIDIA would have the resources to do so, one suspects.
Special thanks goes out to Giovanni Caturano (Zetha), Markus Maki (Madonion) and Patric Ojala (Madonion) for their valuable inputs and insights.


