Original Link: https://www.anandtech.com/show/2853
MSI P55-GD65 - Mid-Range P55 for the Masses
by Gary Key on October 10, 2009 12:00 PM EST- Posted in
- Motherboards
Overview/Conclusion-
One of the more interesting boards we have tested is the MSI P55-GD65. This particular motherboard is aimed straight at the enthusiast/gaming audience who wants CrossFireX or SLI capabilities at a midrange price of $160. Like our recent review of the Gigabyte GA-P55M-UD2, we purchased the MSI P55-GD65 motherboard and tested the board and applications without any contact with MSI in order to approximate a true user experience. After spending significant time with the board, we have to say that MSI has produced a terrific board, but one with a few warts. Unfortunately, most of these warts could have been completely avoided with some forethought or as is apt to happen with MSI, additional BIOS tuning.
Let’s get to the warts that we found and then discuss a few of the better features that MSI has enabled on this board. We found it perplexing at best that MSI included features for the overclocking audience like the base-clock, power-on, and OC Genie buttons but completely left off features like reset and clear CMOS buttons. The oddly placed JMicron SATA port (seventh port - blue) seems like someone played pin the tail on the donkey for the location when it could have been placed at the top of the board next to the V-Check connector or even as a second eSATA port on the I/O panel. The inclusion of a floppy drive port and even IDE port are also questionable for a board in this category. Otherwise, the layout of this board is just fantastic, especially the PCIe/PCI layout.
The OC Genie overclocking technology could not be easier to use and it works exactly as MSI advertised. Even the 3.3GHz i5/750 and 3.7GHz i7/860 generated overclocks on perfectly acceptable voltages pleased us. We think MSI could have squeezed more out of the i5/750 and improved memory timings a little better, but at least the results made a difference in everyday usage without any fuss. Yet, this feature had a dark side.
It refused to work with several of our test power supplies and we are not talking $35 no name units (they all worked perfectly), but some of the best power supplies from Corsair, BFG, Thermaltake, and others. We could grant a pass on this if it was just one power supply, but we noticed a definite pattern with this board and its big brother, the P55-GD80 when using Channel Well based power supplies.
One area that just drove us crazy at times was overclocking various memory modules. The BIOS features 25 different settings for memory timings and each can be changed on a per-channel basis. Unlike other BIOS releases we have tested, you cannot change the timings of both memory channels with a single entry. Also, under manual mode, there are no auto settings for each memory timing option. So, instead of changing the four basic timings and maybe fine tuning tFAW, tRFC, and B2B only, the user is left with manually setting each sub-timing properly. For a lot of users, this will cause significant additional tuning time to make sure every memory setting is properly set when overclocking. Of course, you will get a crash course on memory tuning so that is a silver lining in the cloud.
Your other choice is to simply leave the memory timings on auto and hope for the best. We say hope for the best because if your SPD is not setup properly with several settings based on memory clock speeds, you could be running your memory at higher than advertised timings or getting stuck in an endless loop when overclocking. We had several modules (1600+ kits) that offered just a couple of memory SPD timings. They were fairly aggressive C6/C7 timings for 1066/1333 clock speeds, yet when we tried to overclock our memory to 2000, these settings were utilized and obviously the board did not POST.
On one hand you can blame the memory suppliers, but these same modules worked perfectly in other boards at high memory clocks. Fine tuning of the BIOS would solve most of these problems, including some tightening up of Vdroop variations that were around 0.05V under load with LLC disabled and an overshoot of 0.03V when enabled. Vdroop follows Intel’s guidelines, but on a enthusiast inspired board like this, it is possible reduce it and not have to enable LLC when overclocking, especially with MSI's excellent hardware design.
The only other two items worth mentioning is that S3 resume worked perfectly up to a 190bclk, after that, this board would not properly resume. We also had a few problems with PCIe speeds above 103 being stable. Both of these will only affect the more adventurous overclockers, but even our sub $100 ASRock P55M Pro had no problems with S3 resume up to a 215 bclk or PCIe speeds up to 110MHz.
Now, that might have sounded like a long list of dirty laundry items but overall this is still an excellent board. MSI's power consumption numbers are first rate and even match or exceed those of boards with less peripherals and slots at idle and near stock conditions. MSI’s continued use of their DrMOS hardware allows for these impressive power consumption numbers and provides for some excellent overclocking results. We also have to hand it to MSI for not playing the “More Phases are better…” game that Gigabyte and ASUS seem to be locked into at this time.
In the end, this board offers a great overclocking experience for users on air or water, especially with an i7/860 as Bclk rates can be kept lower while still hitting current CPU limits and keeping S3 resume enabled. While the board had problems clocking our i5/750 with 8GB of memory above DDR3-2000, running the memory in the DDR3-1680 range at C7 timings offered the same if not better performance as the same memory at DDR3-2055 with C9 timings.
All that said, the MSI P55-GD65 has a great layout, extensive BIOS options, excellent power consumption, and class leading performance in several benchmarks. If the board did not carry a few warts that either could have been solved easily in the design phase or with some additional BIOS tuning, it would certainly be at the top of our list in the mid-range P55 market. So while we were frustrated at times, our overall feeling is that this board deserves your full attention and should be on anyone’s short list when considering a P55 motherboard. Some additional BIOS tuning would make this board award worthy, maybe not in Gold territory, but definitely on the podium.
Performance Summary
Performance is indistinguishable from other P55 motherboards - these things all perform about the same at stock speeds:
Since incorporating DrMOS technology into their performance oriented boards, MSI has generally provided class leading power consumption results. The results are not any different with the P55-GD65 compared other boards.
Of course, one of the key questions that invariably comes up in regards to a board’s performance capability is just how well it overclocks.
Core i5/750 4GB Results -
Our only problem encountered during overclocking was the inability of the board to overclock 8GB of memory with our 8GB DDR3-2133 kit above 2000 with stability. For users looking for DDR3-2000+ performance with the i5/750, it will require a 4GB kit. However, we had absolutely no problems running our 8GB kit at DDR3-1684 with C7 timings. Performance was equal to C9 DDR3-2050 at lower VTT and VDimm settings in just about all applications and is our preferred setting.
Core i7/860 8GB Results-
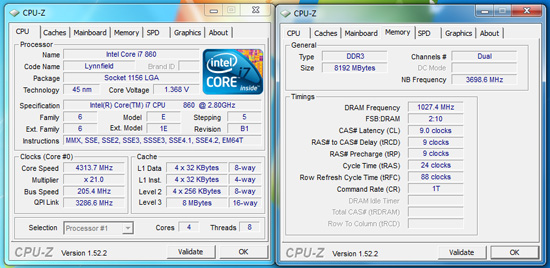
We had no problems clocking our i7/860 to 4.3GHz with 8GB of memory.
If you want more details on the MSI P55-GD65, please continue on.
Our board of interest today is the MSI P55-GD65. You can purchase this board for around $160 at various e-tailors.
MSI P55-GD65 Feature Set
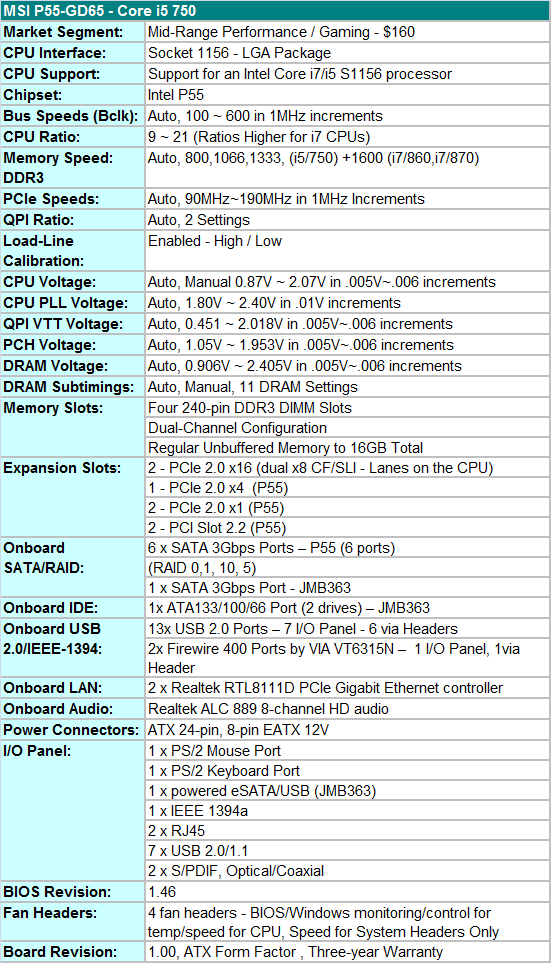
MSI includes a full featured set of components like the Realtek ALC 889 HD audio codec, dual Realtek RTL8111D Gigabit LAN controllers, Via VT6315N 1394a chipset, powered JMB363 eSATA/USB port on the I/O panel, and full support for the Core i7/i5 S1156 processor series.
MSI includes an extensive accessories bundle. You get the standard rear I/O panel cover along with 1 x IDE cable, 1 x Floppy cable, 4 x SATA cables, 1 x SATA power cables, SLI and CF bridges, a USB bracket, an informative manual, quick installation guide,OC Genie guide, Winki Guide, and two software CDs.
Of note in the software package is Winki. This is a Linux-based operating system similar to ASUS’ ExpressGate. Unlike ExpressGate, you boot Winki off the DVD or off a USB thumb drive once it is setup. Winki includes Open Office, Photo Viewer, Instant Messaging, Web and Skype functionality without booting into your primary OS .
BIOS
The BIOS layout is very good and offers a significant amount of settings for overclocking. MSI’s Cell Menu is where all the action takes place with a wide variety of adjustments including the CPU Core, PLL, VTT, PCH, VDimm and VRef voltages. Each of the settings is very granular and offers just about any range that a user could want or need. Clock and PCIe skews are not available but generally are not needed in this range.
One extremely nice function that MSI includes is that frequency and timing changes are directly visible in the BIOS when values are being changed. Overclocking profiles can be saved, loaded and individually named in one of the available eight slots. MSI's M-Flash (in-BIOS updating) worked very well with our board not having a problem with the BIOS being flashed 30 times in our testing. One item missing from the board is some type of BIOS backup or redundancy system that we find on the ASUS and Gigabyte boards in this price range.
MSI's BIOS-level fan speed control options are an improvement over other P55 boards, but not perfect. Users can select a target CPU fan speed between 40 and 70°C while setting a minimum fan speed between zero and 87.5% in 12.5% increments. The two system fan headers are only capable of speed changes with settings at 50, 75, or 100%. Unfortunately, they cannot be controlled by system temperature changes.
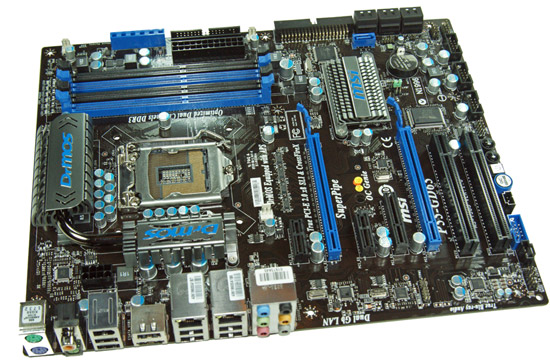
MSI P55-GD65 Layout
The GD-65’s board design is from MSI’s standard issue performance series. The basically all black design with a blue hue for certain accessories is a great look. The subtle gunmetal finished heatsink designs are tasteful and certainly leagues better than their old rollercoaster units.
It is obvious a lot of thought went in the general layout as it is also very good, but not perfect. The single blue JMicron powered SATA port is located on the other side of the six black P55 SATA slots and is difficult to reach in an CF/SLI setup. Of course, we still have a floppy port (why?) and an IDE port on a board that is suppose to take us into the future, not back to 1995.
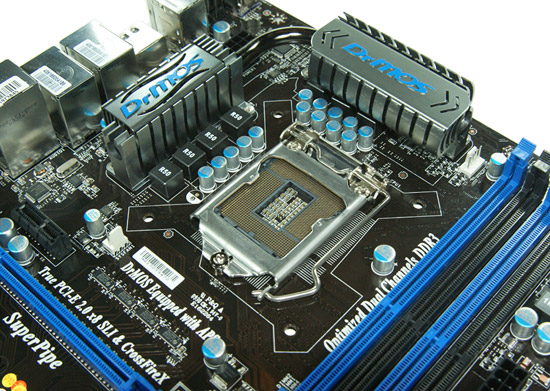
MSI utilizes a high quality DrMOS six-phase PWM setup on this board. Unlike traditional designs, each DrMOS phase circuit contains the MOSFET and driver IC in a single package. Based on our testing this setup will handle power requirements just as well as any eight to twelve phase design utilized on competing boards from Gigabyte, ASRock, ASUS or others. In fact, switching speeds are up to four times faster than traditional MOSFET/Choke setups along with a side benefit of cooler temperatures.
The GD65 supports dynamic power-phase switching along with onboard LEDs that notify you how many phases are active at any given time. MSI claims power is delivered to the CPU with 92% efficiency. We believe them based on clamp load measurements. Also, MSI has gone back to the drawing board on their heatpipe design with a new setup aptly named SuperPipes. No it is not a plumber’s dream come true, MSI’s heatpipes are now 60% larger at 8mm for improved cooling. In fact, DrMOS temperatures reached 36.3C under full load conditions with our i7/860 running at 4.3GHz with only our CPU cooler providing airflow around the PWM area.
The CPU area is generally open and will accommodate larger coolers like the Thermalright Ultra 120 eXtreme. Large push/pull coolers like the Vigor Monsoon III LT will block the first DIMM slot. A pattern we are seeing with just about every P55 board.
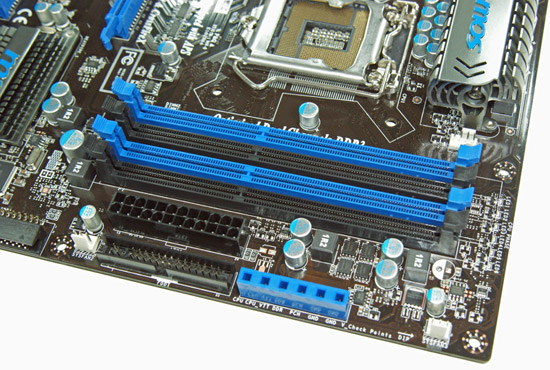
The floppy drive port (once again, why?), 24-pin ATX power connector, four DIMM slots, and V-Check block are located in the lower right hand corner of the board. This board supports dual channel memory configurations and 16GB of DDR3 memory when using 4GB DIMMS. Installing the memory with a video card inserted in the first x16 slot is easy.
The V-Check option is the blue plastic rectangle with six square holes. This box houses pins that offer voltage check points for VTT, DDR, CPU and PCH voltages. A user can take a multimeter and get a real-time readout of voltages instead of relying on BIOS or software readouts. We typically found readings to be within 0.01V~0.03V of what various software programs offered.
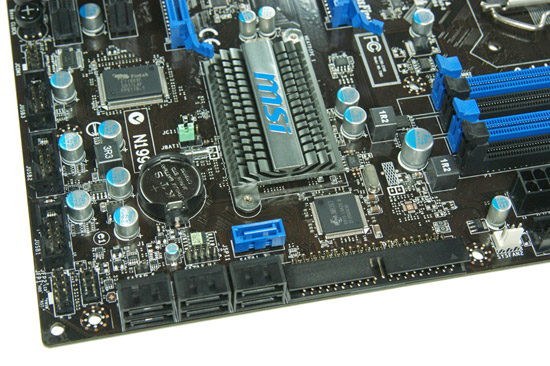
A low-profile heastsink design keeps the P55 chipset cool (not that it really needs it) and will not interfere with longer graphics cards in either slot. The six 3Gbps SATA ports offered by the P55 are along the edge of the board with right angle connectors. The only drawback is that this design can be troublesome in enclosures with the drive cage pushed up against the board but overall it is a preferred solution. The blue SATA port is run off the JMicron JMB363 as is the IDE port. We would rather see the IDE port dropped and the extra SATA port moved to the I/O panel as an eSATA option.
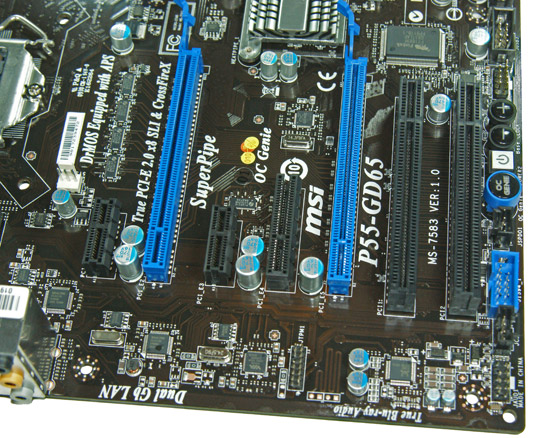
MSI includes two PCIe x16 slots (dual x8 with the second slot populated, both slots are run off the processor), two PCIe x1 slots (P55), two PCI slots (P55), and a PCIe x4 slot (P55). The second PCIe x1 and first PCI slot will be physically unavailable when utilizing a dual slot video card in both x16 slots.
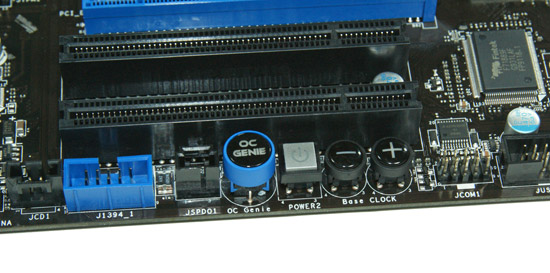
MSI includes their OC Genie and bclock buttons in addition to a power button. However, somebody probably fell asleep in the layout department as MSI failed to include reset and clear CMOS buttons. The two buttons most overclockers are going to use at one point or another.
MSI's "OC Genie" is a great technology that offers a hardware based solution to automatic overclocking. Basically, the user shuts down the system, presses the button, and starts the system again. The OC Genie will automatically take the system through a series of tests to overclock the CPU and memory. The whole process takes only a few seconds when it works.
We say “when it works” as we encountered several compatibility problems with various power supplies. Out of the eleven power supplies we utilize for compatibility testing, five of them caused OC Genie to lock hard, each time requiring a clear CMOS event to recover from the lock.
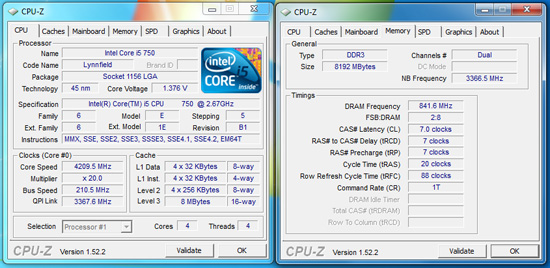
When it did work, our Core i5/750 was clocked to 3.3GHz and our Core i7/860 was clocked to 3.7GHz. We wished for a little more speed on the 750, but overall, the voltages and memory settings were in the safe zone and if a user is nervous about overclocking, this is a really quick and incredibly easy way to get additional performance from your system.
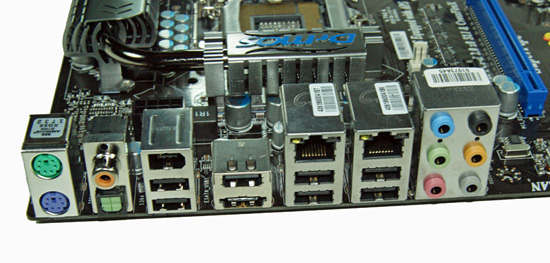
The I/O panel is loaded with goodies. We have seven USB 2.0 ports, PS/2 mouse and keyboards ports, a eSATA/USB powered port from the JMicron JMB363, IEEE 1394a port offered by the VIA VT6315N chipset, dual Gigabit Ethernet LAN ports via the Realtek RTL8111D chipset, optical out/coaxial out S/PDIF ports, and an audio panel that provides 8-channel audio output from the Realtek ALC 889 HD audio codec.


Software
MSI provides several software applications with the P55-GD65. We will take a quick look at their Control Center and Live Update 4 programs.
MSI Control Center
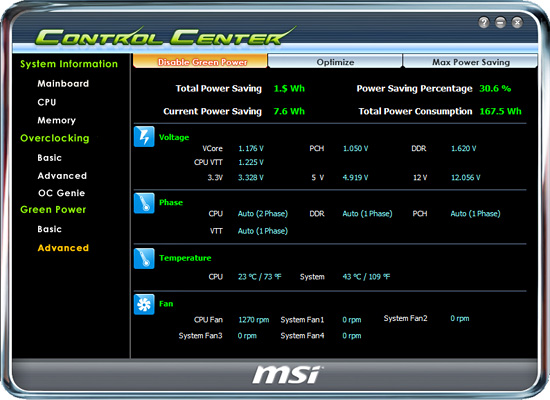
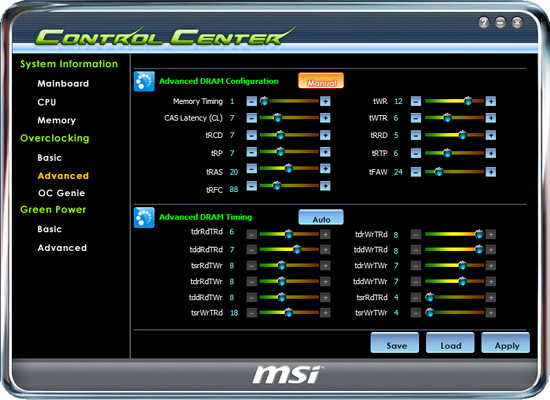
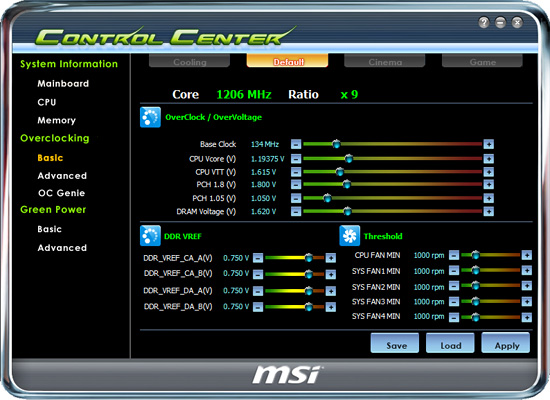
MSI’s Control Center offers a variety of functions from monitoring information to Windows based overclocking. The application worked quite well after we downloaded the latest version on the website. Realtime changes can be made to the base clock and five primary voltages. Changes to memory settings require a reboot.
Live Update 4
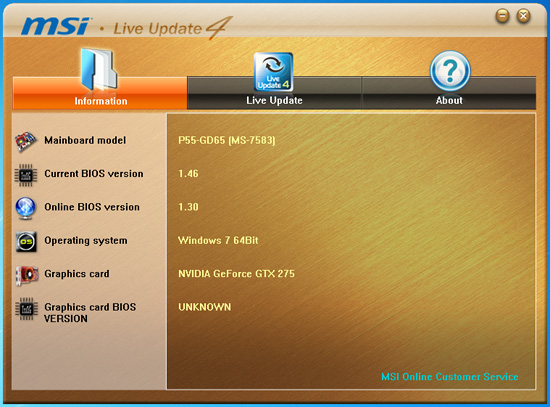
The Live Update 4 application will check your system and then MSI’s primary website for updates to the BIOS and various applications. The user can then choose to download and install the updates or not. We downloaded our BIOS update manually as the primary website was still showing a BIOS revision down one level from what we used in testing. However, our BIOS was provided in the support forum section and not in the BIOS section for the GD65.
DPC Latency
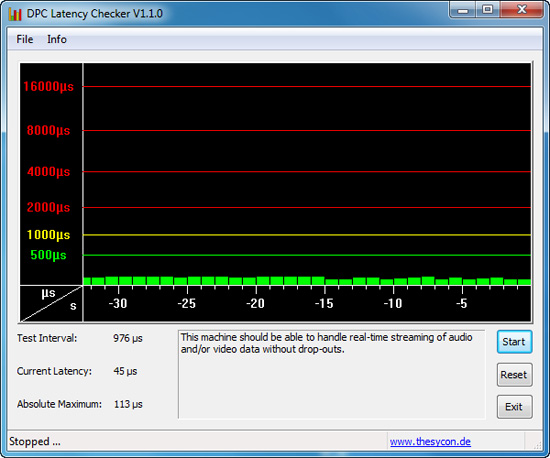
Our test used the Core i5/750
at stock settings with 8GB of memory installed with timings set to 6-6-6-18 at
DDR3-1333.
Overclocking
The P55-GD65 offers a very good overclocking experience. Some additional BIOS tuning would make this a great motherboard for most enthusiasts.
Core i5/750 8GB Results
Our maximum stable overclock on air-cooling with the Core i5/750 resulted in a 4.2GHz clock speed at a respectable 210MHz Bclk with a variety of 8GB DDR3-2000+ kits. The primary voltages settings were 1.3625V VCore, 1.38V VTT, 1.83V PLL, and 1.65V VDimm. The VCore setting is deceiving. We had to run the board with Load Line Calibration (Low Vdroop) enabled for stability. This meant setting our voltage manually to 1.3625V with load rates rising to 1.3975V.
We could not stably run our memory above DDR3-2000 with 8GB loaded and the i5/750. We scaled back to DDR3-1683 at C7 timings which offered the same performance, if not better, than DDR3-2050 C9.
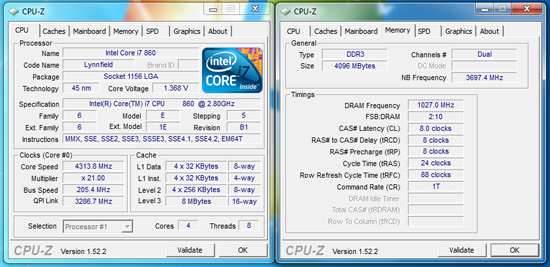
Core i7/860 8GB Results
Our i7/860 fared better clocking wise than the i5/750, with a 21x205 setting for 4.3GHz. Memory was set at DDR3-2055 with 9-9-9-24 1T timings at 1.65V.
VTT is set to 1.39V, PLL at 1.85V, VDimm at 1.65V, and VCore at 1.350V with LLC (Low Vdroop) enabled. Under load conditions VCore was +.015V~+.02V with low Vdroop enabled and -.04V~-.05V with it disabled. Our Core i7/870 clocks matched these exactly.
Core i7/860 4GB DDR3-2400 Results
MSI advertised up to DDR3-2400 speeds so we decided to verify their claim. Unfortunately, the board had serious problem running our DDR3-2400 Blade kit at 2400 with the stock 9-10-9-24 1T settings on 1.65V. We just could not dial in that memory speed. We had to settle for DDR3-2055 8-8-8-24 1T timings at 1.65V. The primary problem being that the board strictly utilizes the SPD under auto settings and the board tried setting the base 7-7-7-20 SPD settings at 2400. Even manually tuning each individual setting still resulted in a limit around DDR3-2100. Of course, our final settings is more than fast enough for application usage and let’s face it, nobody will be buying this board thinking they are going to break world records.
Thoughts
The overclocking results are very solid and certainly 4.2GHz~4.3GHz speeds are fast enough for most users. We have no concerns recommending the MSI P55-GD65 board for 24/7 overclocking use. When overclocked, the board is extremely stable. Our only concern is that S3 resume did not work properly with the Bclk set above 190.
Test Setup -
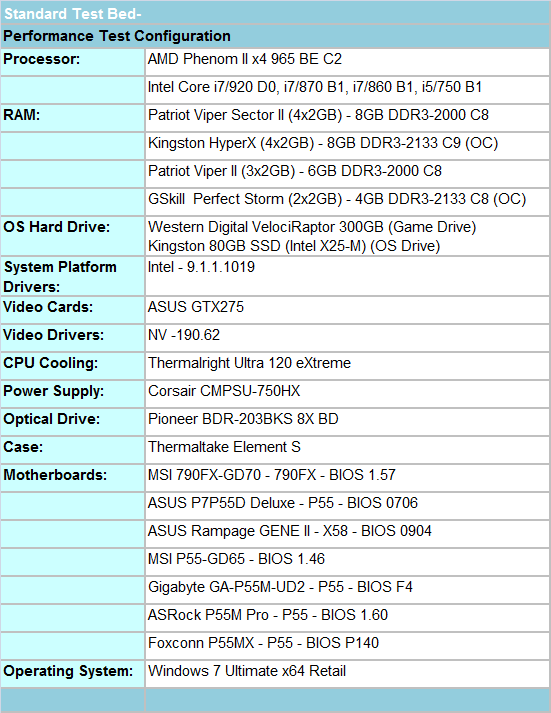
We utilized a wide variety of memory kits from Corsair, OCZ, Patriot, GSkill, Kingston, and Super Talent to verify memory compatibility on our test boards. Our OS and primary applications were loaded on the Kingston 80GB SSD drive and our games were operated off the WD 300GB VRaptor drive. We did a clean install of the OS and applications for each motherboard.
We chose the ASUS GTX275 video card and Corsair’s 750HX power supply. Our air cooler of choice is Thermalright’s Ultra 120 eXtreme, primarily for its exceptional performance during our overclocking tests. We also tested with the retail cooler and those results along with direct CPU comparisons can be found here.
Our 790FX/X58 results are provided for comparison only. For our test results we setup each board as closely as possible in regards to memory timings. Otherwise all other settings are left on auto. The P55 and 790FX motherboards utilized 8GB of DDR3, while the X58 platform contained 6GB. The P55 and X58 DDR3 timings were set to 7-7-7-20 1T at DDR3-1600 for the i7/920, i7/870, and i7/860 processors at both stock and overclocked CPU settings.
We used DDR3-1333 6-6-6-18 1T timings for the i5/750 stock setup as DDR3-1600 is not natively supported in current BIOS releases for this processor at a stock Bclk setting of 133. We had early BIOS releases that offered the native 1600 setting but stability was a serious problem and support was pulled for the time being. Performance is essentially the same between the two settings.
The AMD 790FX setup is slightly different as trying to run DDR3-1600 at CAS 7 timings on the 1:4 divider is extremely difficult. Without resorting to some serious overvolting and relaxing of sub-timings, we set our AMD board up at DDR3-1600 8-8-8-20 1T timings but with NB speed at 2200. The difference in performance between C7 and C8 DDR3-1600 is practically immeasurable in applications and games on this platform.
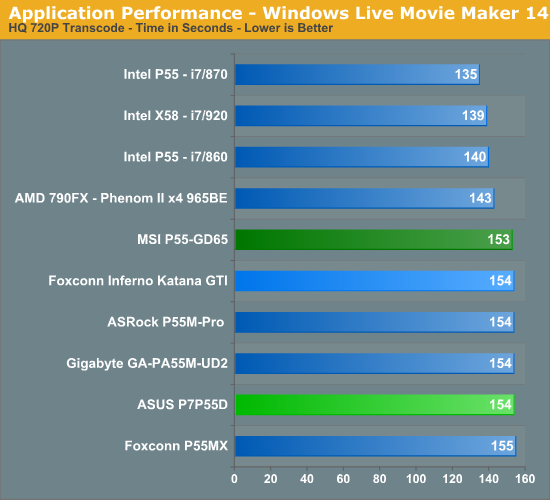
There's really no other way to say this: MSI’s P55-GD65 performs almost exactly the same as any other P55 motherboard in every single benchmark we ran.
Application tests, game tests, LAN tests, even USB, Firewire, and SATA controller performance was virtually identical across the board. We've known for a while now that motherboards of a given generation all perform the same, but there's honestly no more to it than that.
We've included a wealth of application, gaming and peripheral performance data for you to see for yourself, but honestly, features, overclocking potential, support, and price point are what matter here.
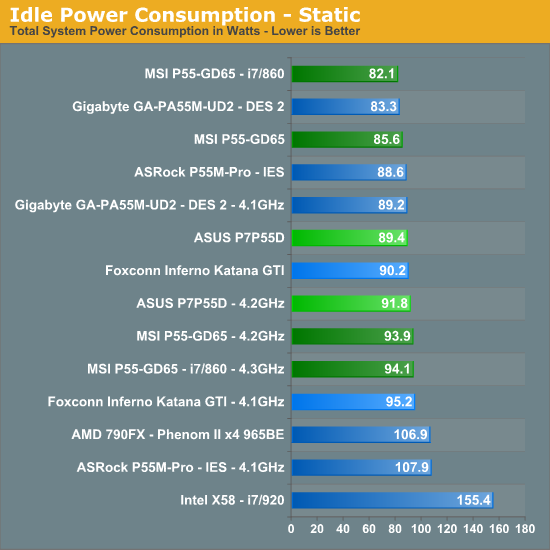
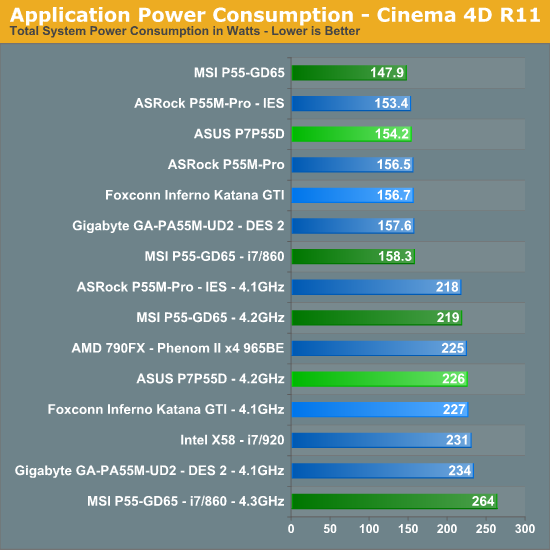
The biggest difference between the boards, from a performance standpoint, actually surfaces in power consumption:
At idle the MSI P55-GD65 draws the least amount of power with the Core i7/860, while the Core i5/750 draws right over 2W more than the micro-ATX based Gigabyte board. Why the 860 setup draws less power is something we are still working on, but even manually setting the voltages the same resulted in a similar 2W~3W difference. When the 750 is overclocked, it draws slightly more power than the ASUS P7P55D board which features a voltage offset option in the BIOS, allowing it to idle at 1.088V instead of the 1.352V on the MSI board. The load numbers favor the MSI board across the board.
Application/Gaming Performance
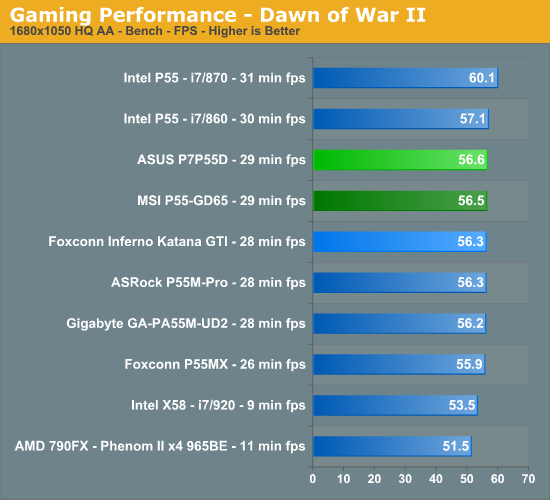
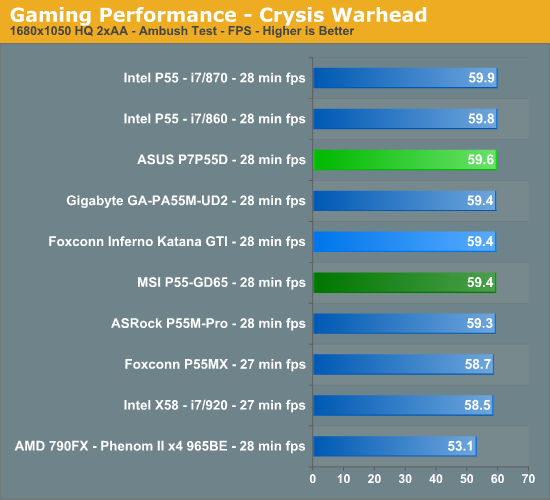
We're presenting all of the application/gaming performance data without commentary because, as we mentioned before - there's no real appreciable performance difference between these three boards. All of the boards were run with the Core i5 750 and we've included the Phenom II X4 965 BE as well as the i7 860, 870 and 920 purely for reference. Please check our Lynnfield launch article to see how well this processor performs against a variety of CPUs.
In many of our tests, the Core i5 750 is the same speed or faster than the Phenom II X4 965 BE. The lack of Hyper Threading prevents it from being a runaway success. In other cases, the Phenom II X4 965 is faster - and by a large degree.
Intel was very careful to disable HT on the 750, without it, there would be no reason to spend the extra money on the Core i7 860. Just as it was with Bloomfield, $284 is the sweet spot for Lynnfield if absolute performance is a requirement. Now for the benchmarks.
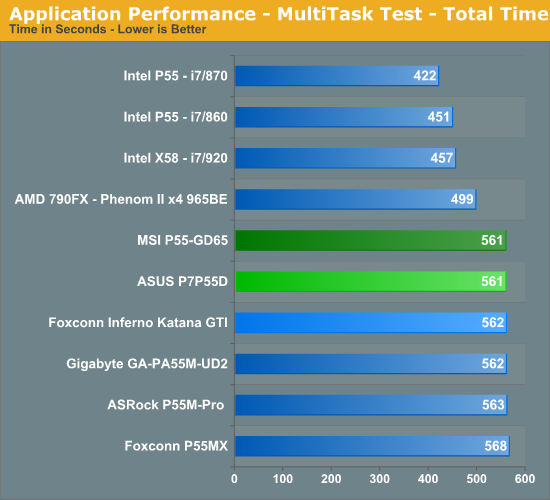
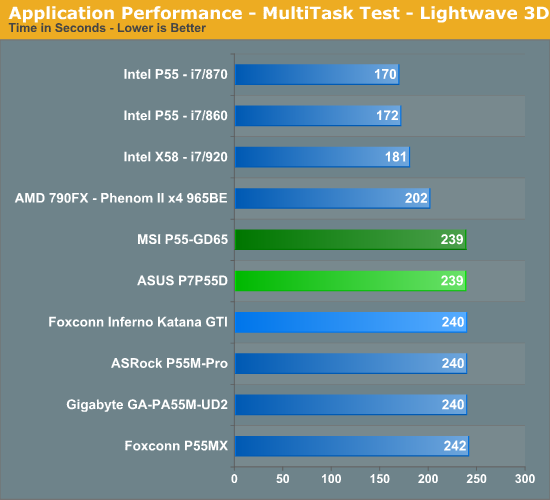
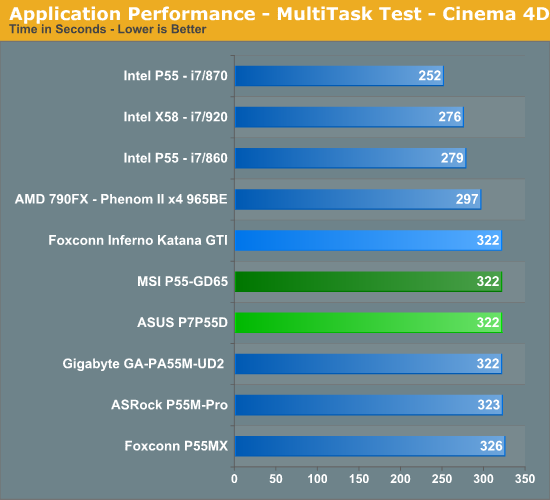
Multitasking-
The vast majority of our benchmarks are single task events that utilize anywhere from 23MB up to 1.4GB of memory space during the course of the benchmark. Obviously, this is not enough to fully stress test our 6GB or 8GB memory configurations. We devised a benchmark that would simulate a typical home workstation and consume as much of the 6GB/8GB as possible without crashing the machine.
We start by opening two instances of Internet Explorer 8.0 each with six tabs opened to flash intensive websites followed by Adobe Reader 9.1 with a rather large PDF document open, and iTunes 8 blaring the music selection of the day loudly. We then open two instances of Lightwave 3D 9.6 with our standard animation, Cinema 4D R11 with the benchmark scene, Microsoft Excel and Word 2007 with large documents, and finally Photoshop CS4 x64 with our test image.
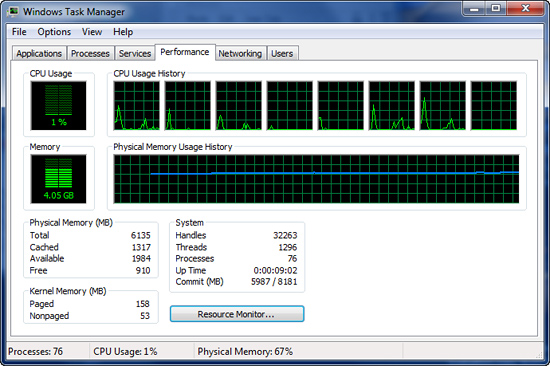
Before we start the benchmark process, our idle state memory usage is 4.05GB.
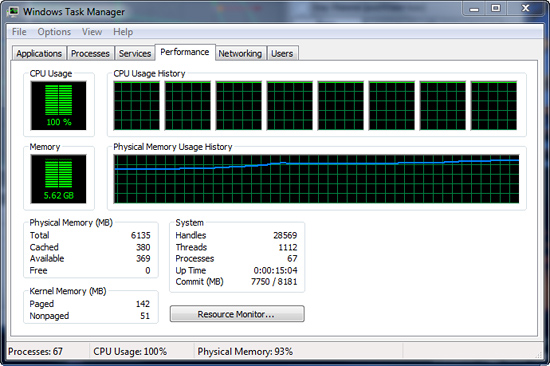
We wait two minutes for system activities to idle and then start playing Pinball Wizard via iTunes, start the render scene process in Cinema 4D R11, start a resize of our Photoshop image, and finally the render frame benchmark in Lightwave 3D. Our maximum memory usage during the benchmark is 5.62GB with 100% CPU utilization across all four or eight threads.
3D Rendering
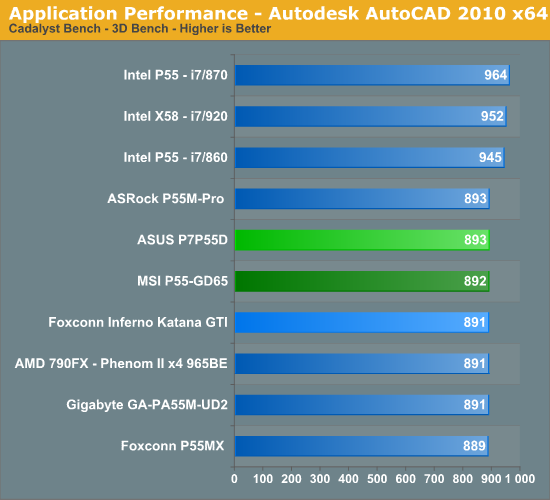
AutoCAD 2009 x64
We utilize AutoCAD 2010 x64 and the Cadalyst Labs 5 benchmark.
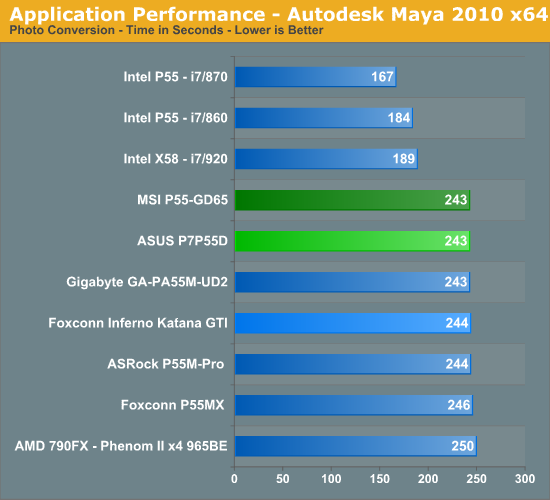
3ds Max 2010 x64
We utilize a rather large mental ray image and track the time it takes to render it.
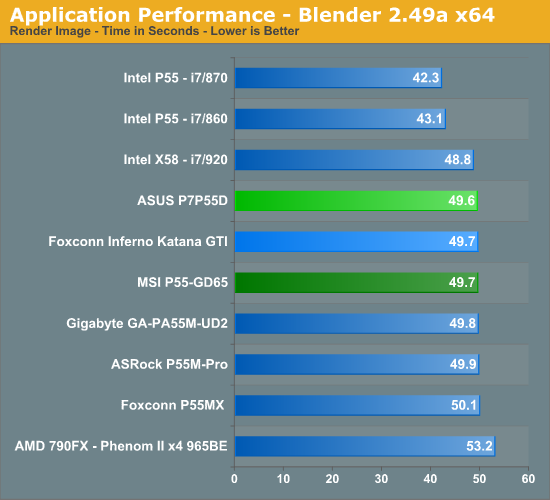
Blender 2.49a x64
We utilize the flying squirrel benchmark image and track the time it takes to render it.
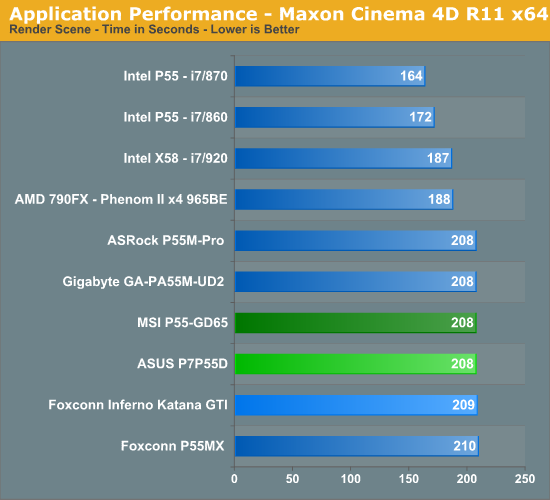
Cinema 4D R11 x64
Cinema 4D R11 is one of our favorite programs to create high-end 3D images and animations. We track the time it takes to render a swimming pool layout.
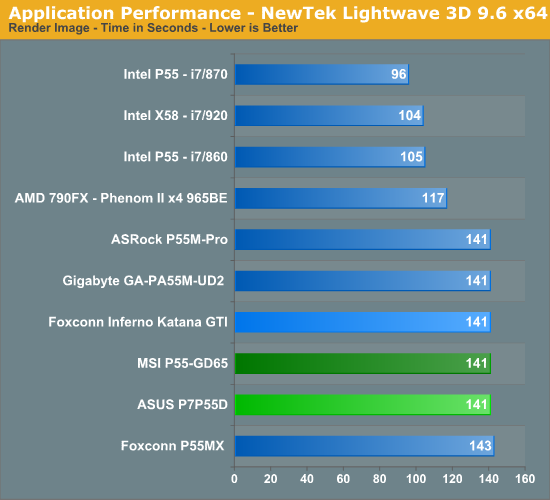
LightWave 3D 9.6 x64
Another popular 3D rendering program is Lightwave 3D 9.6. In this test we time the rendering of a single frame from an office building animation. The time to render the full scene is approximately four and a half hours.
Video
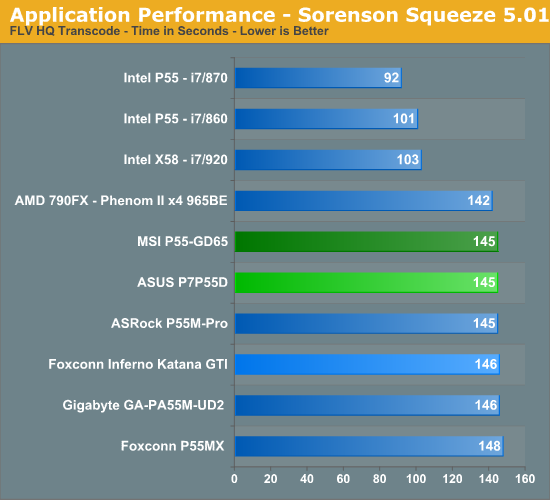
Sorenson Squeeze 5.01
We are using Sorenson Squeeze to convert eight AVCHD videos into HD Flash videos for use on websites. This application heavily favors core count and processor clock speed.
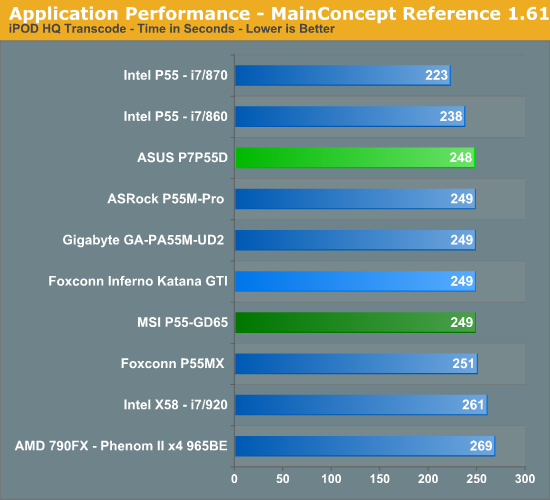
MainConcept Reference 1.61
One of our favorite video transcoding utilities is MainConcept Reference. We set our profile to iPOD HQ NTSC and then transcode a 651MB 1080P file to a iPOD friendly 34.7MB file.
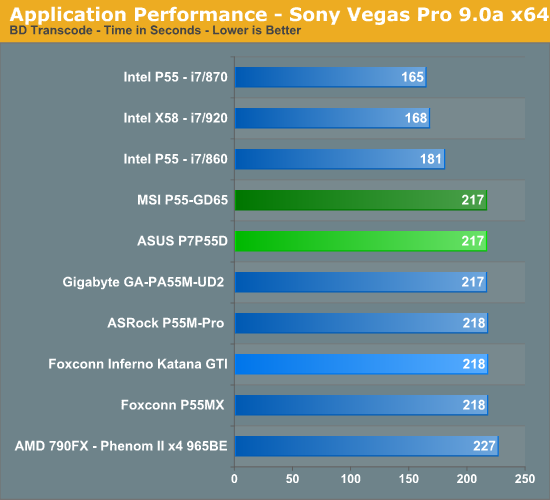
Sony Vegas Pro 9.0 x64
We transcode a 370MB 1080AVCHD file using the Mainconcept MPEG-2 1920x1080 60i, 25Mbps setting with 6-channel audio.
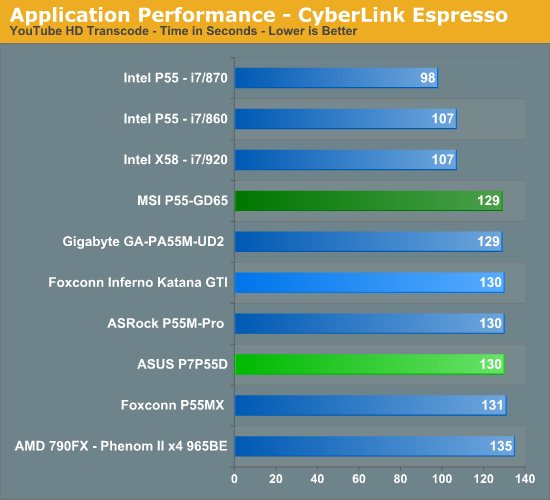
CyberLink MediaShow Espresso
We transcode a 370MB 1080AVCHD file into a HD friendly file suitable for publishing on YouTube. This program features GPU hardware accelerated decoding via ATI Stream or NVIDIA CUDA but is disabled in our test routines.
Audio
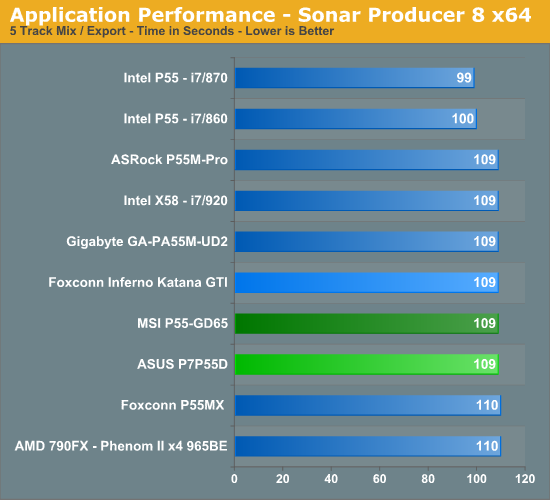
Sonar Producer 8 x64
We utilize Sonar Producer extensively at home when mixing various music tracks. This test performs a complex mix of five individual tracks into a single title. We covert these tracks into a WAV format utilizing a 192kHz sample rate along with all other options enabled. This title thrives on memory bandwidth.
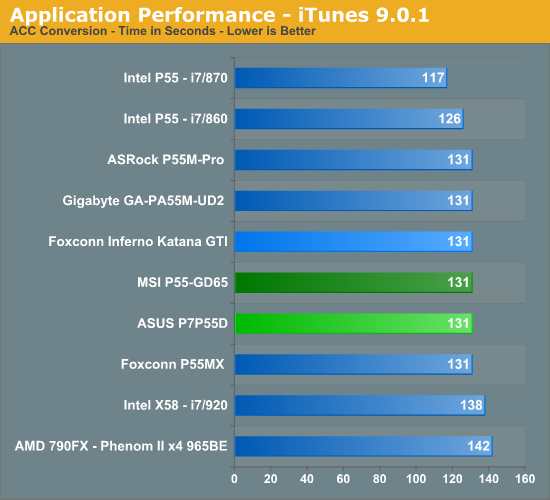
iTunes 9 x64
We import the album Tommy by The Who to our disk in WAV format. The directory consists of 25 songs totaling 751MB. We then convert this music collection to MP3 format utilizing 320Kbps VBR Highest audio settings or to an AAC format using the iTune Plus option.
General Applications-
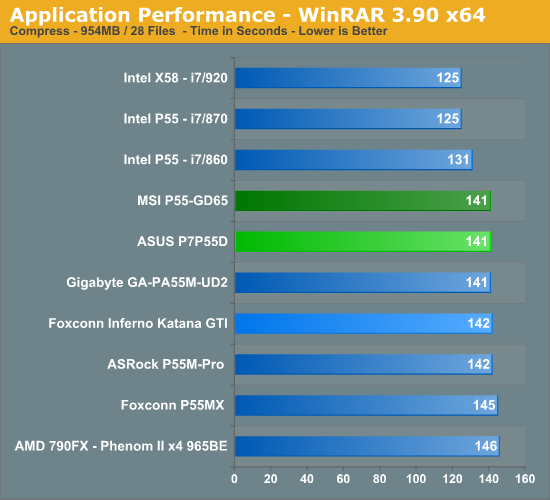
WinRAR 3.9 x64
This benchmark compresses our AT workload consisting of a main folder that contains 954MB of files in 15 subfolders. The result is a file approximately 829MB in size.
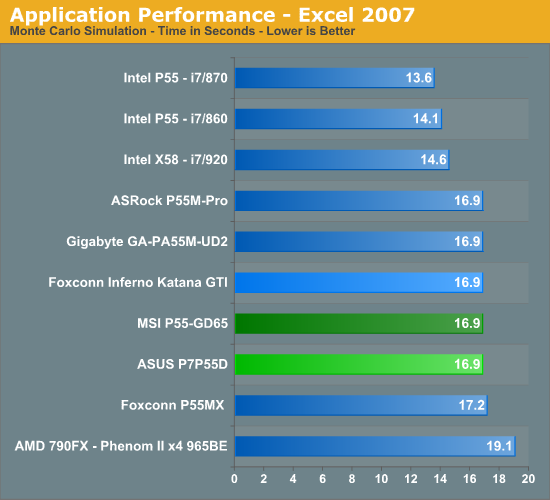
Microsoft Excel 2007 SP1
Excel can be a very powerful mathematical tool. In this benchmark, we are running a large Monte Carlo simulation on stock pricing data to estimate the riskiness of an investment portfolio.
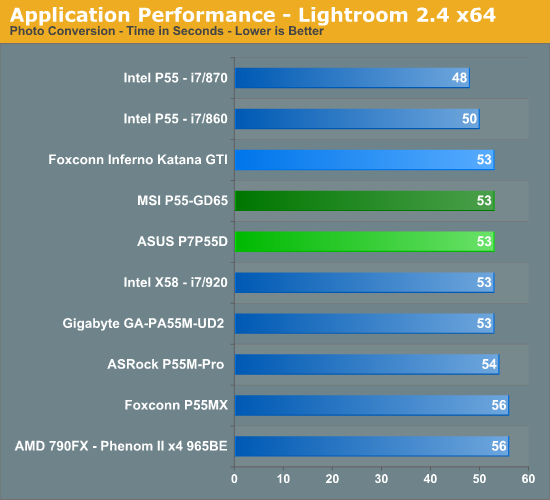
Adobe Lightroom 2.4 x64
Lightroom is a quick and easy to use program for batch conversions on digital photos. We perform a standard conversion of 50 RAW images into the JPEG format.
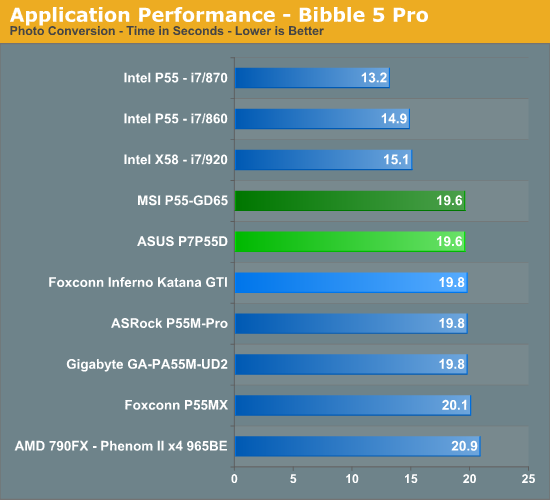
Bibble 5.0
We utilize Bibble Labs’ Bibble 5 v2 to convert 50 RAW image files into full size JPEG images with the program’s default settings. This program is fully multithreaded and multi-core aware.
Windows Live Movie Maker
We utilize our standard HD video file, add music, and start/ending transition effects.
Gaming-
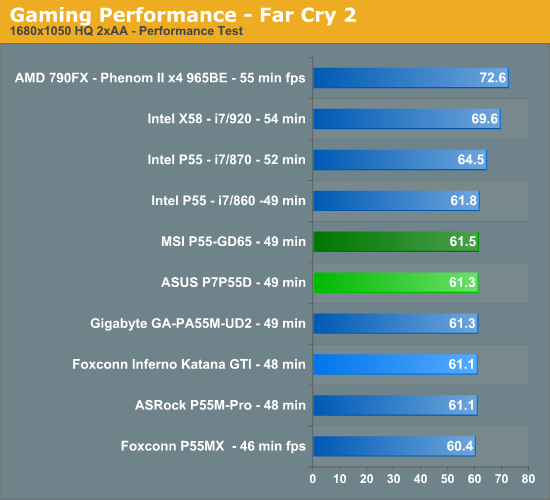
FarCry 2
Featuring fantastic visuals courtesy of the Dunia Engine, this game also features one of the most impressive benchmark tools we have seen in a PC game. We set the performance feature set to Very High, graphics to High, and enable DX10 with AA set to 2x. The in-game benchmark tool is utilized with the Ranch Small level and we report an average of three test runs.
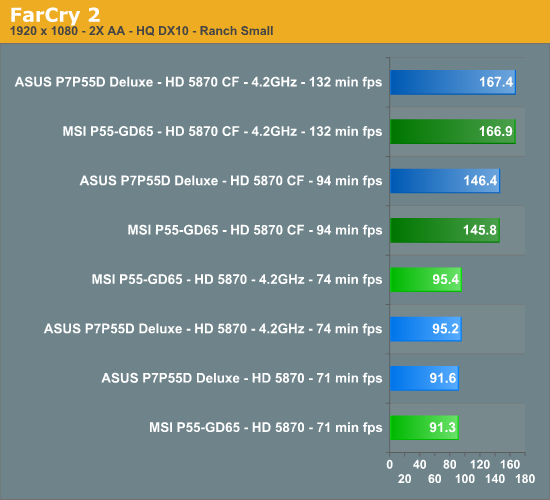
FarCry 2 CrossFireX
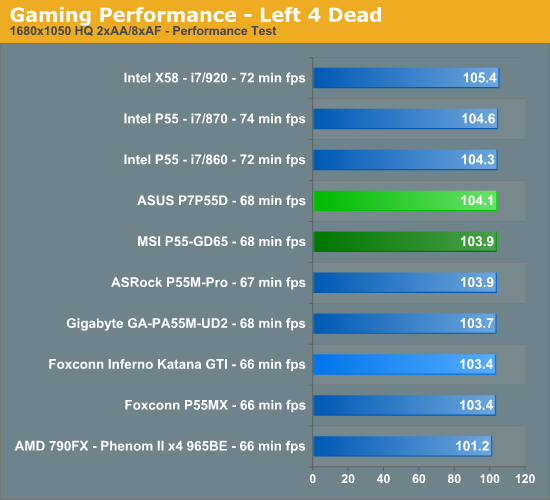
Left 4 Dead
This game is a blast and addictive to boot - provided you like killing hundreds of zombies while trying to take care of your teammates and sustaining high blood pressure rates. We enable all options, set AA to 2x and AF to 8x, and play back a custom demo of a game session from the Runway Finale chapter within the Dead Air campaign.
Warhammer 40K: Dawn of War II
We are big fans of the Warhammer franchise, especially Dawn of War II. One of the latest RTS games in our library is also one of the more demanding titles on both the CPU and GPU. We crank all options to High, enable AA, and then run the built-in performance benchmark for our result.
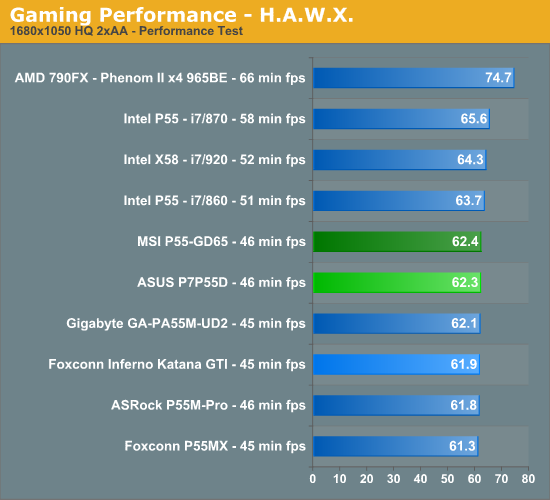
Tom Clancy's H.A.W.X.
While not a true flight simulation or even serious air combat game, it is a lot of fun and looks visually stunning on a 30” monitor with all options turned up. In our case, we set all options to high, enable 2xAA and DX10, and then use FRAPS to time a custom demo sequence. We run three loops of the benchmark and average our scores for the results.
Crysis Warhead
We utilize the Ambush level for our game test. We set the resolution to 1680x1050 with 2xAA, DX10, and 64-bit enabled.
Networking
The Windows 2000 Driver Development Kit (DDK) includes a useful LAN testing utility called NTttcp. We used the NTttcp tool to test Ethernet throughput and the CPU utilization of the various Ethernet Controllers used on the Intel motherboards. We set up one machine as the server; in this test, an Intel system with an Intel CSA Gigabit LAN connection. Intel CSA has a reputation for providing fast throughput and is a logical choice for our Gigabit LAN server.
On the server side, we used the following Command Line as suggested by the VIA whitepaper on LAN testing:
Ntttcpr -m 4,0,‹server IP› -a 4 -l 256000 -n 30000
On the client side (the motherboard under test), we used the following Command Line:
Ntttcps -m 4,0,‹client IP› -a 4 -l 256000 -n 30000
At the conclusion of the test, we captured the throughput and CPU utilization figures from the client screen.
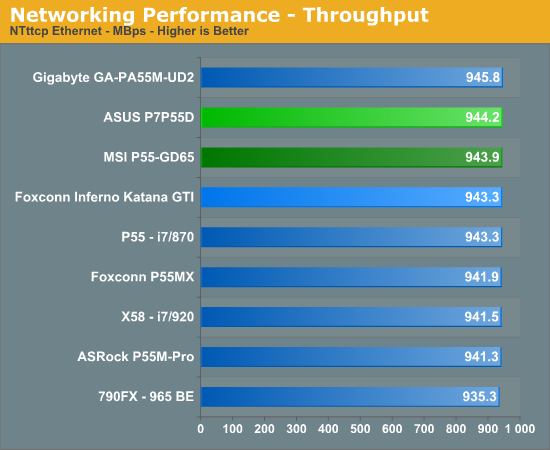
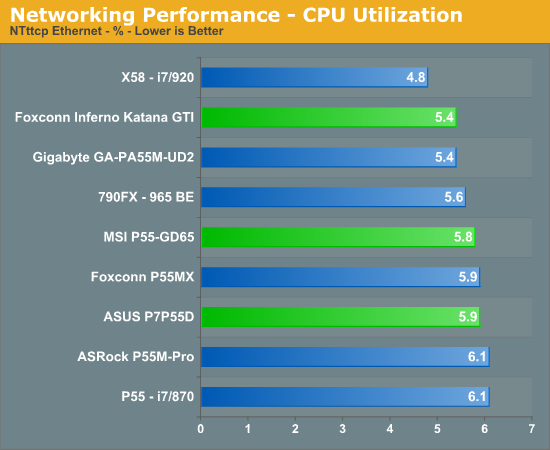
Our network throughput test indicates how well a particular controller design from Realtek, Marvell, or Intel performs instead of being indicative of true chipset performance. This also holds true for the CPU utilization results, though this test can also be influenced to certain degree by the BIOS code and chipset interconnect design.
The CPU utilization and throughput numbers favor the Realtek controller on the Gigabyte board, followed closely by the same Realtek chipset on the Foxconn and ASRock boards. In practice, few if any users will notice a difference, even if they have the requisite gigabit hub, as storage performance frequently bottlenecks the actual transfer rates.
For our second series of networking tests we utilize a Promise SmartStor NS4600 NAS unit equipped with two WD Caviar Black 640GB drives in RAID 1 operation. We are using two benchmarks from Intel’s popular NASPT 1.70 testing tool. The Promise NAS unit is connected to each test platform via a NetGear Gigabit Ethernet switch. We left all settings at their defaults on both the motherboard and Promise NAS unit. Our goal was to maximize the performance of the NAS unit to verify our network throughput capabilities on each motherboard.
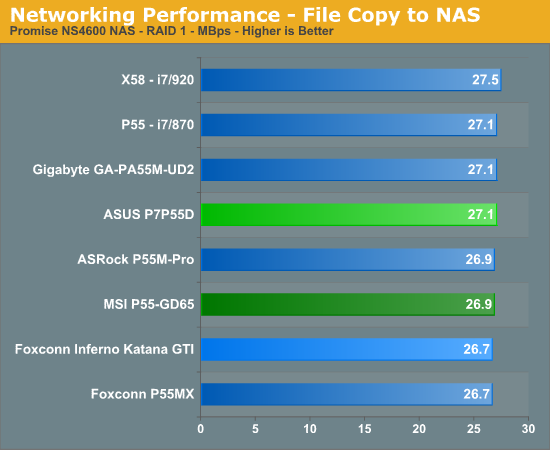
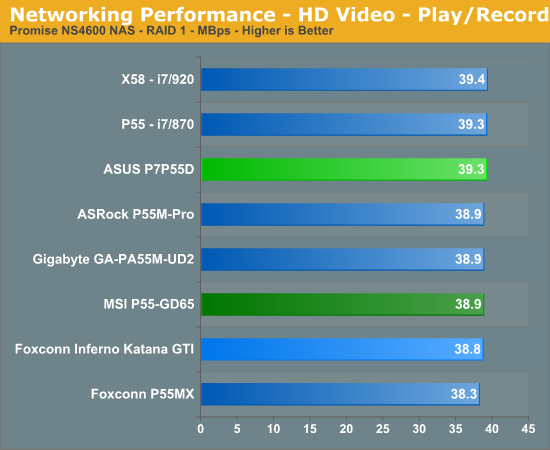
Our three P55 test subjects perform almost identically in our actual usage tests.
USB / FireWire Performance
Our USB transfer speed tests are conducted with an USB 2.0/FireWire based Lacie external hard drive unit featuring a 1TB 7200rpm Samsung drive. In the SSD to External test, we transfer a 3.82GB folder containing 2735 files of various sizes from our Kingston 80GB SSD to the Lacie drive. In the next two file tests, we use the same 3.82GB folder to transfer from our WD VRaptor 300GB hard drive to the external Lacie drive utilizing the USB 2.0 and IEEE 1394a interface.
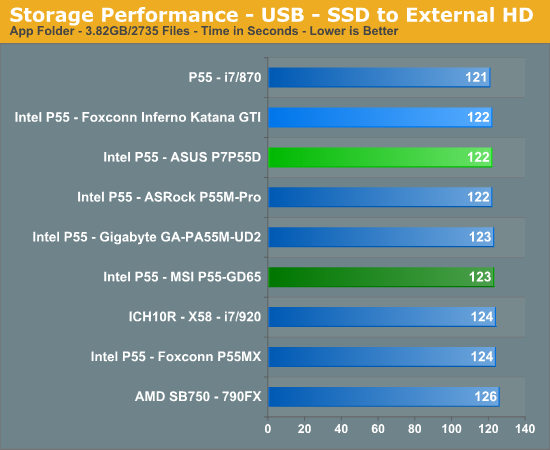
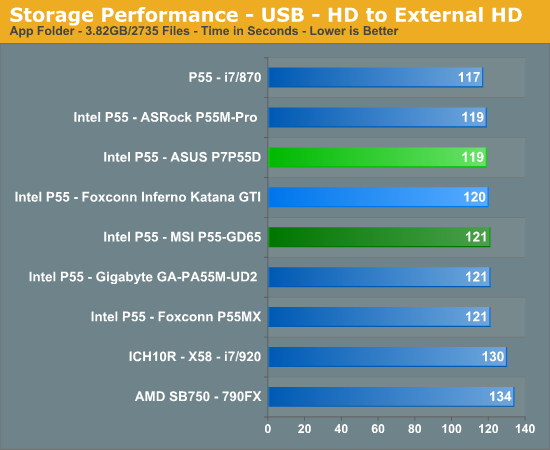
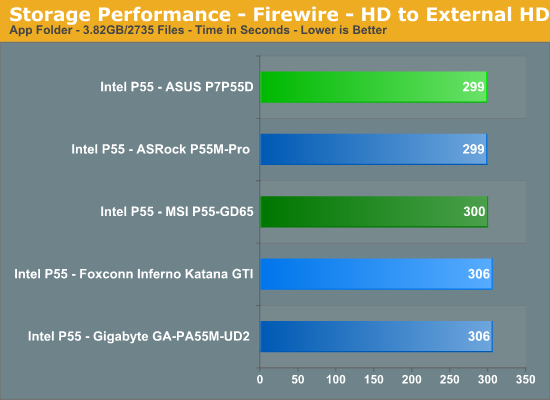
The MSI board performs in the middle of the pack in our USB tests. The VIA Firewire controller on the MSI board has a slightly higher write speed (+3Mb/s) under HDTach/HDTune and it shows up in our file transfer test compared to the Gigabyte/Foxconn boards.
Storage Performance
In our storage test, we utilize the same 3.82GB test folder and transfer it from our WD VRaptor drive to our Kingston 80GB SSD.
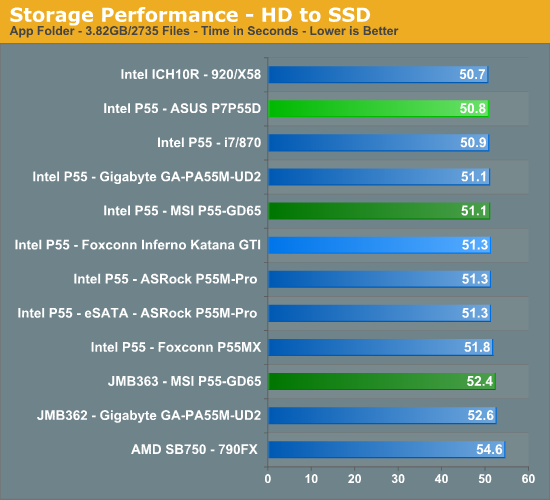
Once again, our P55 motherboards perform almost identically. The P55 chipset on the MSI board has a 3% advantage over the JMicron controller on the same board. However, any measurable differences were not recognized in actual usage.


