Original Link: https://www.anandtech.com/show/2242
Gigabyte GA-P35T-DQ6: DDR3 comes a knocking, again
by Gary Key on May 30, 2007 2:00 AM EST- Posted in
- Motherboards
The recent introduction of the Intel's new P35 chipset brought with it the official introduction of the 1333FSB and DDR3 support for Intel processors. The P35 chipset is also the first chipset to officially support the upcoming 45nm CPU architecture. We reviewed the P35 chipset and the new Intel ICH9 Southbridge in detail and found the combination to offer one of the best, if not the best, performance platforms for Intel's Core 2 Duo family of processors.
This does not necessarily mean the P35 is the fastest chipset on paper or by pure design; it's just that the current implementation of this "wünder" chip by the motherboard manufacturers has provided us with the overall top performing chipset in the Intel universe at this time. Of course this could change at a moment's notice based upon new BIOS or chipset releases, but the early maturity and performance levels of the P35 has surprised us.
Our first look at DDR3 technology provides a glimpse of where memory technology is headed for the next couple of years. We do not expect widespread support for DDR3 until sometime in 2008 but with the right DDR3 modules we have seen performance equaling or bettering that of current DDR2 platforms. However, this does not mean DDR2 memory technology is stagnant now; far from it, as we will soon see standard DDR2-1066 modules with fairly low latencies running at 1.8V with overclocking capabilities up to or exceeding DDR2-1500 in some cases.
What immediate impact this will have on the DDR3 memory market is unclear right now. Based on our early information we should see the more performance oriented DDR2 motherboards outperforming their DDR3 counterparts until DDR3 latencies and speeds are greatly improved. We do expect these improvements to come, just not quick enough to hold off the initial onslaught of DDR2-1066 and what is shaping up to be some impressive overclocking capabilities.
That brings us to today's discussion of the Gigabyte GA-P35T-DQ6 motherboard based upon the Intel P35 chipset with full DDR3 compatibility. This motherboard is Gigabyte's current flagship product and we expect the product to launch on or right after June 4th. Gigabyte was kind enough to provide us with a full retail kit for our preview article today.
The P35T-DQ6 motherboard is based on the same platform utilized by its DDR2 counterpart, the P35-DQ6, which has already provided an excellent performance alternative to the ASUS P5K series of motherboards. As we stated in our preview article, making a choice between the current P35 motherboards is difficult and is largely dependent upon the user's requirements.
We initially found the ASUS boards to be slightly more mature, as they offer a performance oriented BIOS with some additional fine tuning options not available in the other boards. However, that is quickly changing as we receive BIOS updates and new board designs from other manufacturers. We will provide an answer for what board we think best exemplifies the performance and capability of the P35 chipset in our roundup coming in the latter part of June.
In the meantime, we have our second DDR3 board in-house for testing and will provide some early results with this somewhat unique motherboard that brings an excellent level of performance to the table. The question remains if this board can outperform the ASUS P5K3 Deluxe, and we hope to provide some early answers to that question today. Let's take a quick glimpse at the Gigabyte GA-P35T-DQ6 now and see how it performs.
Gigabyte GA-P35T-DQ6 Basic Features
| Gigabyte GA-P35-DQ6 | |
| Market Segment: | Enthusiast - $279.99 |
| CPU Interface: | Socket T (Socket 775) |
| CPU Support: | LGA775-based Pentium 4, Celeron D, Pentium D, Pentium EE, Core 2 Duo, Core 2 Extreme |
| Chipset: | Intel P35 MCH and Intel ICH9R |
| Bus Speeds: | Auto, 100 ~ 700 in 1MHz increments |
| Memory Ratio: DDR3 | Auto, 2.40, 3.0, 3.20, 4.0 |
| PCIe Speeds: | Auto, 90MHz~150MHz in 1MHz Increments |
| Core Voltage: | Normal, .00625V ~ 2.35000V in 0.00500V increments |
| PCIe Voltage: | Normal, +.05V ~+.35V in +.05V increments |
| FSB Voltage: | Normal, +.05V ~+.35V in +.05V increments |
| CPU Clock Multiplier: | Auto, 6x-16x in 1X increments if CPU is unlocked, downwards unlocked, Core 2 Duo |
| DRAM Voltage: DDR3 | Normal, +.05V ~ +1.55V in +.05V increments |
| DRAM Timing Control: | Auto, 12 DRAM Timing Options |
| Performance Enhancement: | Standard, Turbo, Extreme |
| NB Voltage: | Normal, +.025V ~ +.375V in +.025V increments |
| Memory Slots: | Four 240-pin DDR3 DIMM Slots Dual-Channel Configuration Regular Unbuffered Memory to 8GB Total |
| Expansion Slots: | 2 - PCIe X16 (1x16, 1x4 electrical for CrossFire or Multi-GPU) 3 - PCIe x1 2 - PCI Slot 2.2 |
| Onboard SATA/RAID: | 6 SATA 3Gbps Ports - ICH9R (RAID 0,1, 10, 5) 2 SATA 3Gbps Port - JMicron JMB363 - RAID 0, 1 |
| Onboard IDE: | 1 ATA133/100/66 Port (2 drives) - JMicron JMB363 |
| Onboard USB 2.0/IEEE-1394: | 12 USB 2.0 Ports - 4 I/O Panel - 8 via Headers 3 Firewire 400 Ports by TI TSb43AB23 - 1 I/O Panel, 2 via Header |
| Onboard LAN: | Realtek RTL8111B PCIe Gigabit Ethernet controller |
| Onboard Audio: | Realtek ALC889A - 8-channel HD audio codec |
| Power Connectors: | ATX 24-pin, 8-pin EATX 12V, 4-pin Molex connector |
| I/O Panel: | 1 x PS/2 Keyboard 1 x PS/2 Mouse 1 x Parallel Port 1 x Serial Port 1 x S/PDIF Coaxial/Optical - Out 1 x IEEE 1394a 1 x Audio Panel 1 x RJ45 4 x USB 2.0/1.1 |
| BIOS Revision: | F2N |
| Board Revision: | v1.0 |
Gigabyte has provided the user a fairly comprehensive BIOS that is enthusiast oriented in the latest F2N release. In our opinion, Gigabyte continues to annoy the crowd that will buy this board by insisting on using the Ctrl-F1 sequence to open up the additional performance oriented BIOS settings. However, with the "secret" settings revealed we were able to match all BIOS settings on the ASUS P5K3 when tuning the board.
The most important option to change is the Performance Enhance setting from Normal to Turbo. This will improve memory performance in much the same way as the Transaction Booster from ASUS, although the level of fine tuning does not match the ASUS board. We found the Extreme setting to be just that: on the extreme fringe of usefulness. We could not complete our benchmarks when using it. We measured VCore droop to be around .03V under load testing with our QX6700.
Gigabyte GA-P35T-DQ6 Board Layout and Features
 |
| Click to enlarge |
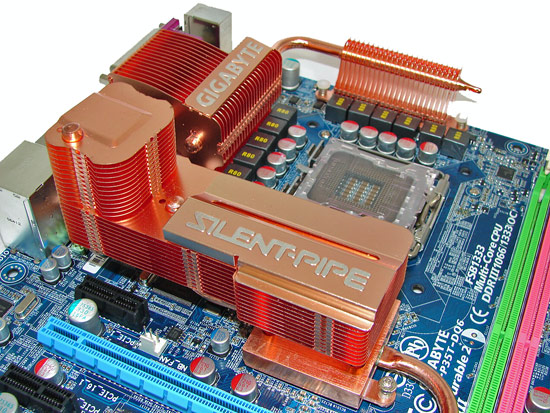
Gigabyte provides the user with a good layout considering the massive heatsink system employed on this board. The board features a dual six-phase power regulation system and 100% use of conductive polymer aluminum capacitors that provided excellent stability during testing at stock and overclocked speeds. The P35T-DQ6 installed easily into our Cooler Master CM Stacker 830 case and cable management was very good for power, optical, and hard drives, although the 8-pin ATX connector was a tight fit due to the heatpipe system.
 |
| Click to enlarge |
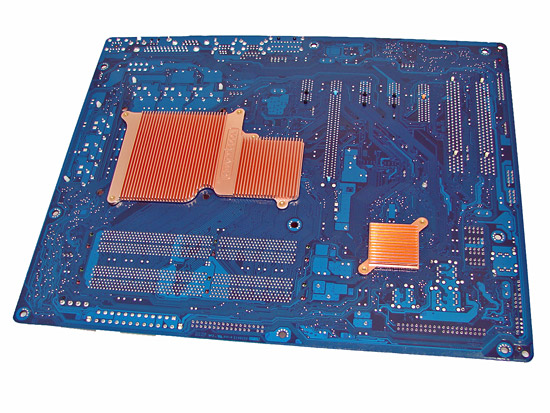
During our overclocking tests we found the massive heatpipe system worked well but additional airflow was required to ensure stability. However, our larger heatsinks such as the Scythe Infinity barely fit and were difficult to install. Also note that the cooling backplate on the bottom of the board requires removal or the use of longer screws to attach coolers that require a backplate mount.
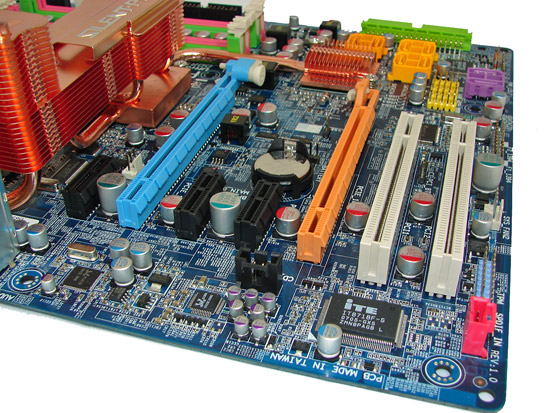
The board comes with two PCI Express x16 connectors (1x16 electrical, 1x4 electrical), three PCI Express x1, and two PCI 2.2 connectors. This is a very good dual x16 connector design. The second PCI Express x1 slot and first PCI slot will be physically unavailable if you utilize a double slot card design in either x16 slot.
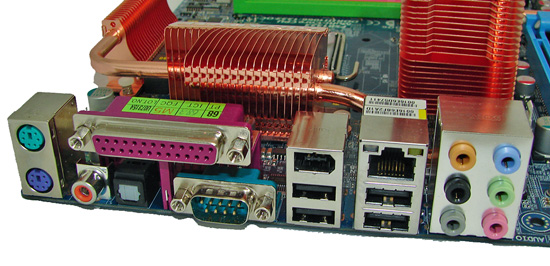
Unlike the ASUS P5K series, Gigabyte took a more legacy approach with the rear panel options. The standard PS/2 mouse and keyboard ports, parallel, and serial ports are included compared to ASUS only including a PS/2 keyboard port.
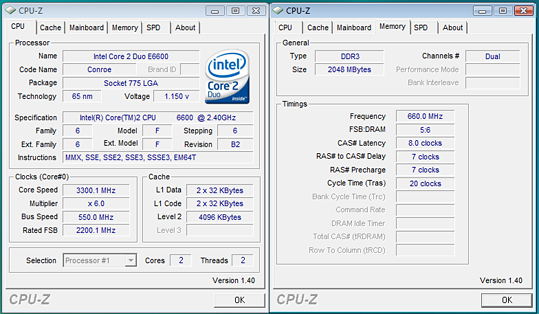
E6600 Dual Core Overclocking
| Gigabyte P35T-DQ6 Dual Core Overclocking Testbed |
|
| Processor: | Intel Core 2 Duo E6600 Dual Core, 2.4GHz, 4MB Unified Cache 1066FSB, 9x Multiplier |
| CPU Voltage: | 1.4875V / 1.4500 (default 1.3250V) |
| Cooling: | Tuniq 120 Air Cooling |
| Power Supply: | OCZ ProXStream 1000W |
| Memory: | Corsair DDR3 CM3X1024-1333C9DHX (2x1GB, 4x1GB) 8-7-7-20 |
| Video Cards: | 1 x MSI HD 2900XT |
| Hard Drive: | Western Digital 150GB 10,000RPM SATA 16MB Buffer |
| Case: | Cooler Master CM Stacker 830 |
| Maximum CPU OC: | 420x9 (8-7-7-20, 1344MHz, 1.55V), CPU 1.4875V 3780MHz (+58%) |
| Maximum FSB OC: | 550x6 (8-7-7-20, 1320MHz, 1.55V), CPU 1.4500V 3300MHz (+107% FSB) |
| . | |

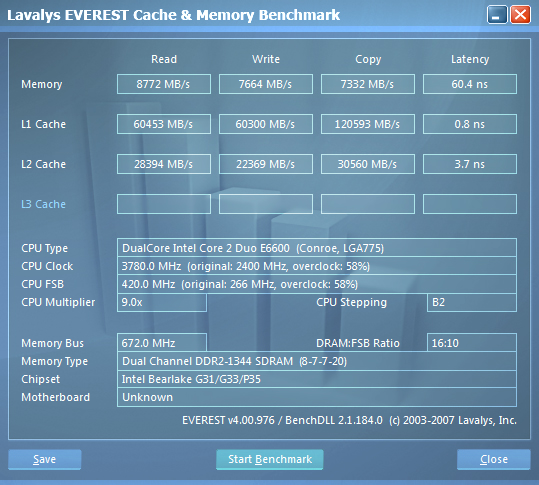
We were easily able to reach a final benchmark stable setting of 9x420 FSB resulting in a clock speed of 3780MHz. We were able to run our Corsair DDR3 CM3X1024-1333C9DHX at timings of 8-7-7-20 with a minimal increase in voltage to 1.55V with 4GB or 2GB of memory. We did encounter one problem and that was trying to run our memory past 1400MHz while the FSB was above 400 with the E6600. The board would boot and enter Vista up to 1600MHz but we could not complete our entire test suite unless we kept the memory below 1400MHz. We attribute this to an early BIOS design that favors tighter memory timings and latencies over high memory overclocks. Vdroop was very acceptable on this board during overclocking with an average drop of .02 ~.03V during load testing with our E6300, E6600, and X6800 CPUs.

We dropped the multiplier on our E6600 to six and were able to reach 550 FSB without an issue on the F2N BIOS. We were not able to enter Vista at 6x551 up to 6x600 although the board would POST. We managed to eke out a 6x592 result on the DDR2 version of this board so we attribute the seemingly hard lock at 550FSB to the BIOS at this time. The issue at this time with the high FSB settings is that latencies and access times suffer at the expense of memory bandwidth.
We are still working on finding the best memory multipliers and timings to utilize along with exact chipset strap changes. They tend to float between BIOS releases but we will provide a full range of results and settings in a future article. Gigabyte still has some fine tuning left to complete but overall the BIOS is in really good shape from both a performance and stability standpoint. Once the board is dialed in, stability is absolutely superb.
QX6700 Quad Core Overclocking
| Gigabyte P35T-DQ6 Quad Core Overclocking Testbed |
|
| Processor: | Intel Core 2 Extreme QX6700 Quad Core, 2.66GHz, 8MB Unified Cache 1066FSB, 10x Multiplier |
| CPU Voltage: | 1.4750V (default 1.3500V) |
| Cooling: | Tuniq 120 Air Cooling |
| Power Supply: | OCZ ProXStream 1000W |
| Memory: | Corsair DDR3 CM3X1024-1333C9DHX (2x1GB, 4x1GB) 9-7-7-20 |
| Video Cards: | 1 x MSI HD 2900XT |
| Hard Drive: | Western Digital 150GB 10,000RPM SATA 16MB Buffer |
| Case: | Cooler Master CM Stacker 830 |
| Maximum CPU OC: | 365x10 (9-7-7-20, 1460MHz, 1.60V), CPU 1.4750V 3650MHz (+37%) |
| Maximum FSB OC: | 457x8 (9-7-7-20, 1462MHz, 1.60V), CPU 1.4750V 3656MHz (+72% FSB) |
| . | |

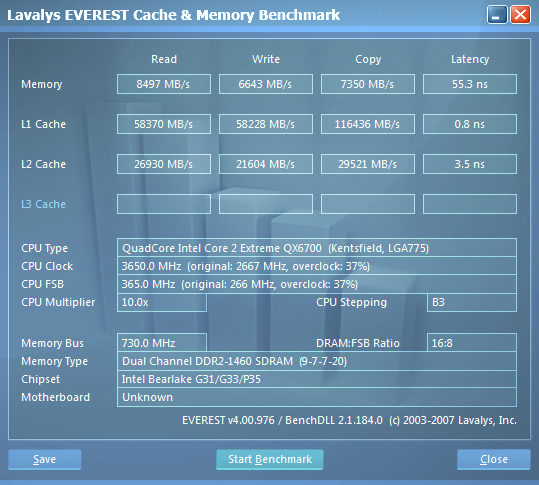
Needless to say, quad core overclocking on the P35 platforms has been an unknown to some extent due to the limited availability of boards. Our board reached a final 365FSB that we found to be extremely stable during testing and exceeded the 361FSB we have reached on the ASUS DDR3 board. Of note is that our processor will actually do 3920MHz but we had to run slightly higher voltages on this board and reached the limits of air-cooling at 3650MHz. Our memory timings had to be relaxed slightly with CAS being set to 9 and voltages increased to 1.60V for 2GB and 1.70V for 4GB configuration.
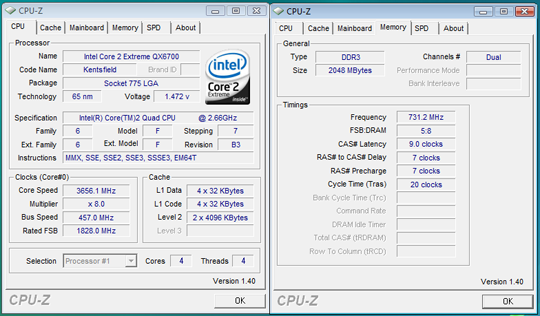

We dropped the multiplier on our QX6700 to eight and were rewarded with a final 8x457FSB setting that was limited to air-cooling. However, even with some quick test runs with water cooling we found our final FSB would not exceed 470MHz due to problems with our memory running stable once we neared the 1600MHz mark with it. Gigabyte is currently working on this problem and we hope to have an update shortly. We see the 8x457 setting offering the best write and copy scores with read and latency performance just trailing the 10x365 settings. In preliminary testing, our 8x457 setting generally scored about 1% better in most of our application and game benchmarks. We will have overclocked scores in our roundup article.
Test Setup
| Standard Test Bed Vista Ultimate 64-Bit Test Configuration |
|
| Processor: | Intel Core 2 Duo QX6700 (2.66GHz, 8MB Unified Cache) |
| RAM: | OCZ Reaper PC2-9200 (4x1GB) 3-4-3-8 975X, 4-4-4-10 P35, P965, 680i Corsair DDR3 CM3X1024-1333C9DHX (4x1GB) 8-7-7-20 |
| Hard Drive: | Western Digital 150GB 10,000RPM SATA 16MB Buffer |
| System Platform Drivers: | Intel - 8.3.0.1013 |
| Video Cards: | 1 x MSI HD 2900XT |
| Video Drivers: | ATI 8.37.4.3 (HD2900XT Release Drivers) |
| CPU Cooling: | Tuniq 120 |
| Power Supply: | OCZ ProXStream 1000W |
| Optical Drives: | Plextor PX-760A, Plextor PX-B900A |
| Case: | Cooler Master CM Stacker 830 |
| Motherboards: | Intel D975XBX2 (Intel 975X) - BIOS 2692 ASUS P5K Deluxe (Intel P35) - BIOS 0304 ASUS P5K3 Deluxe (Intel P35) - BIOS 0411 MSI P35 Platinum (Intel P35) - BIOS 7345P01 Gigabyte P35-DQ6 (Intel P35) - BIOS F4 Gigabyte P35T-DQ6 (Intel P35) - BIOS F2N DFI Infinity P965 (Intel P965) - BIOS 424 EVGA 680i LT SLI (NVIDIA 680i LT) - BIOS P04 |
| Operating System: | Windows Vista Ultimate 64-Bit |
| . | |
Test conditions were maintained the same, as much as possible, over the platforms tested. Our game tests were run at settings of 1280x1024 HQ to ensure our GPU was not a bottleneck during testing. All results are reported in our charts and color-coded for easier identification of results.
We utilize new drive images on each board in order to minimize any potential driver conflicts. Our 3DMark results are generated utilizing the standard benchmark resolution for each program. We run each benchmark five times, throw out the two low and high scores, and report the remaining score. All results are run at stock speeds for this article although we will provide overclocked results in the next article that covers this board.
Our choice of software applications to test is based on programs that enjoy widespread use and produce repeatable and consistent results during testing. Microsoft Vista has thrown a monkey wrench into testing as the aggressive nature of the operating system to constantly optimize application loading and retrieval from memory or the storage system presents some interesting obstacles. This along with the lack of driver maturity will continue to present problems in the near future with benchmark selections. Our normal process was to change our power settings to performance, delete the contents of the prefetch folder, and then reboot after each benchmark run. This is a lengthy process to be sure, but it results in consistency over the course of benchmark testing. All applications were run with administer privileges.
The Gigabyte P35T-DQ6 test results we will present today are still preliminary. The BIOS we are utilizing is still under development and not all of the kinks have been worked out to our satisfaction. The main problems we encountered center around DDR3 overclocking past 1600MHz and strange behavior when overclocking the FSB past 460FSB and trying to run our memory higher than 1500MHz or lower than 1300MHz. We are still trying to nail down chipset strap changes and latency issues at high FSB speeds with this latest BIOS release.
We also had a problem overclocking past 550FSB speed on this board as there seemed to be an almost hard lock. We could POST to a 600FSB setting but the board would always freeze from 551FSB to 600FSB when entering Windows Vista regardless of memory, multiplier, or voltage settings. The points at which the chipset straps change tend to float with each BIOS release we receive or memory multiplier we utilize. To be fair, some of these problems are also occurring on the ASUS board and we hope to have a final report when our P35 roundup is published in the latter part of June.
Memory Performance
 |
| Click to enlarge |
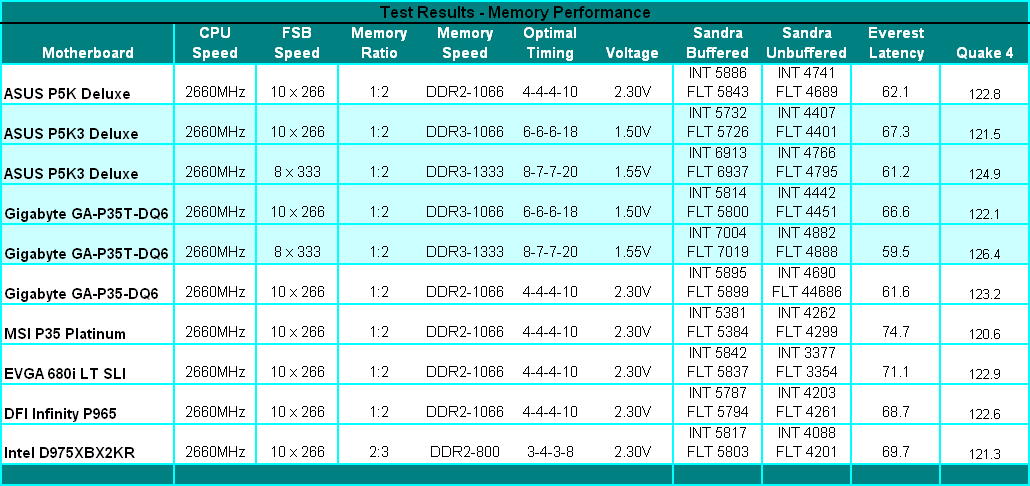
We optimized each BIOS to provide the best performance at similar memory timings while still being able to complete our entire benchmark test suite. We will fully optimize each board based upon its best performance potential in our upcoming chipset shootout. However, for now we are comparing like timings on each board to show differences in the way each manufacturer implements other BIOS enhancements such as ASUS's Transaction Booster or Gigabyte's Turbo Memory enhancement. Despite the cliché names, we generally see an improvement in unbuffered memory and latency results of up to 7% when they are enabled.
Gigabyte's latest F2N BIOS has brought their DDR3 memory performance up to and it is now surpassing ASUS's DDR3 performance. We expect MSI to improve their memory performance greatly in a soon to be released performance BIOS. In the meantime, we notice that DDR3-1066 memory performance is just not worth the price of admission. In fact, we cannot recommend anything less than DDR3-1333 if you are considering a DDR3 board. The performance penalties are just too severe as our original P35 chipset preview article showed. In fact, we have removed DDR3-1066 scores from our results now. Stay away; stay far away. (DDR3-1066 reminds us a bit of DDR2-400, and we expect it to have a similar shelf life.)
We see our Gigabyte P35T-DQ6 offering the best overall memory bandwidth, latency, and Quake 4 scores in our tests. The price for this is a seeming lack of ability for this board to run DDR3 past 1600MHz with our QX6700 in a stable manner. Whether this is the BIOS, our early DDR3 samples, or chipset issues is up for debate at this point. What we do know is our ASUS P5K3 board will run up to DDR3-1800 with the same memory and that Gigabyte is currently working to address our problem.
Rendering Performance
We are using the Cinebench 9.5 benchmark as it tends to heavily stress the CPU and FSB subsystems while performing graphics modeling and rendering. Cinebench 9.5 features two different benchmarks with one test utilizing a single core and the second test showcasing the power of multiple cores in rendering the benchmark image. We utilize the standard multiple core benchmark demo and default settings.
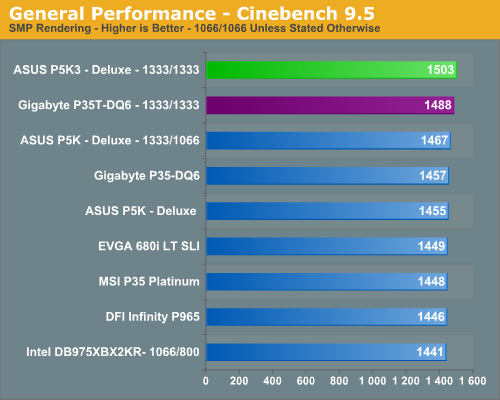
The improved CPU throughput speeds of the P5K3 board results in the top score, putting it 1% ahead of the Gigabyte DDR3 board. We will see this pattern continue in a couple of benchmarks that are CPU limited as the ASUS board has better CPU throughput. The remaining boards are all clustered within 2% of each other, with most of the P35 boards placing ahead of the incumbents. This is one benchmark that clearly benefits from improved front side bus speeds and memory bandwidth.
File Compression Performance
In order to save space on our hard drives and ensure we had another CPU crunching utility, we will be reporting our file compression results with the latest version of WinRAR that fully supports multi-treaded operations and should be of particular interest for those users with dual core or multi-processor systems. Our series of file compression tests utilizes WinRAR 3.62 to compress our test folder that contains 444 files, ten subfolders, and 602MB worth of data. All default settings are utilized in WinRAR along with our hard drive being defragmented before each test.
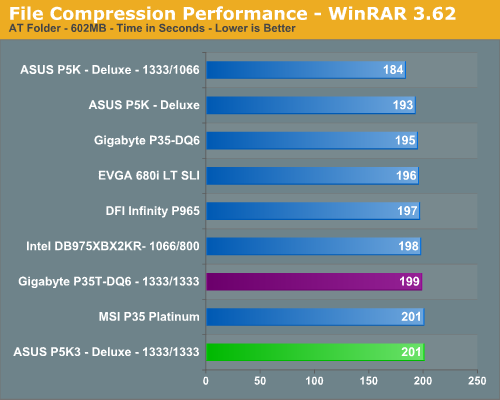
Our 1333FSB/DDR2-1066 platform provides the top score and actually distances itself from the other boards in this CPU intensive test that heavily relies on memory throughput and latency for improved performance. We see the DDR3 configurations finishing last, as it trail DDR2 right now in terms of latencies. The nature of file compression is such that memory is accessed almost constantly in a very random fashion, so page misses requiring additional time as memory bank swapping is a common occurrence.
Synthetic Graphics Performance
The 3DMark series of benchmarks developed and provided by Futuremark are among the most widely used tools for benchmark reporting and comparisons. Although the benchmarks are very useful for providing apples-to-apples comparisons across a broad array of GPU and CPU configurations they are not a substitute for actual application and gaming benchmarks. In this sense we consider the 3DMark benchmarks to be purely synthetic in nature but still very valuable for providing consistent measurements of performance.
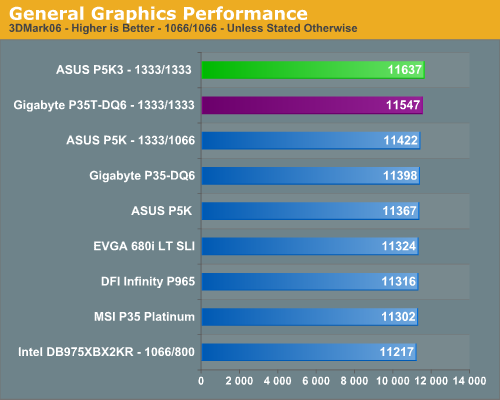
In our 3DMark06 test, all of the boards are bunched together with a 3.7% spread from top to bottom. The 975X board takes last place by a small margin and we expect this to improve once we have new R600 drivers. The P5K3 board offered the best CPU and SM2.0 scores in this benchmark although the P35T-DQ6 offered the best SM3.0 scores. This is one of a few tests that show the ASUS DDR3 board to have slightly better performance than the Gigabyte DDR3 board when the benchmark is CPU limited.
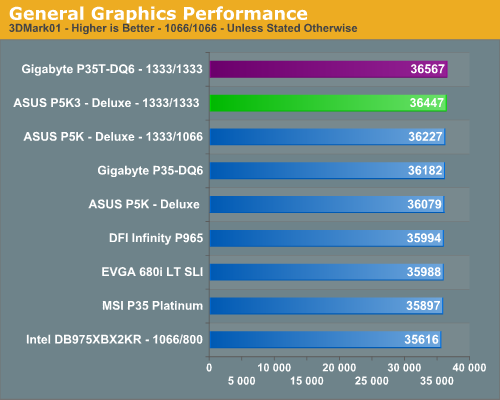
In the more memory sensitive 3DMark01 benchmark we see our Gigabyte P35T-DQ6 board taking top honors with a very strong showing against the ASUS boards. Our 975X board is slightly handicapped at the 1066FSB/DDR2-800 settings although this chipset continues to offer excellent memory performance in this type of benchmark. The spread from top to bottom is only 2.6%, however, so minor differences in performance are not really noticeable in either 3DMark unless you count on the differences for individual benchmark scores.
General System Performance
The PCMark05 benchmark developed and provided by Futuremark was designed to evaluate overall system performance for the typical home computing user. This tool provides both system and component level benchmarking results utilizing subsets of real world applications or programs. This benchmark is useful for providing comparative results across a broad array of Graphics, CPU, Hard Disk, and Memory configurations along with multithreading results. In this sense we consider the PCMark benchmark to be both synthetic and real world in nature, and it again provides for consistency in our benchmark results.
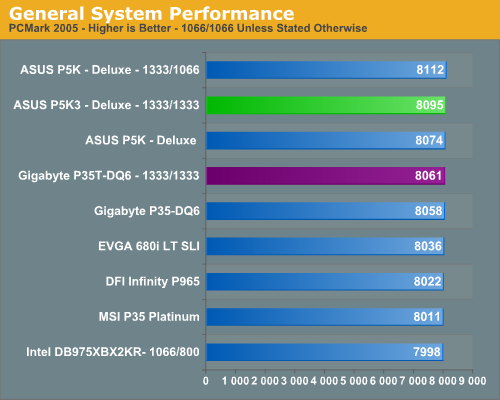
The ASUS boards have always done well in this benchmark due to very strong multitasking performance and the same holds true once again in our test with the Gigabyte DDR3 board. The spread in overall scores is only 1.5%, although in individual areas the differences between the boards may be more or less pronounced.
Media Encoding Performance
We are utilizing an updated video encoding test suite for this article that includes AnyDVD, Nero Recode 2, Windows Media Encoder 9, and QuickTime Pro 7.1.
Our first encoding test is quite easy - we take our original Office Space DVD and use AnyDVD Ripper to copy the full DVD to the hard drive without compression, thus providing an almost exact duplicate of the DVD. We then fire up Nero Recode 2, select our Office Space copy on the hard drive, and perform a shrink operation to allow the entire movie along with extras to fit on a single 4.5GB DVD disc. We leave all options on their defaults except we turn off the advanced analysis option. The scores reported include the full encoding process and are represented in seconds, with lower numbers indicating better performance.
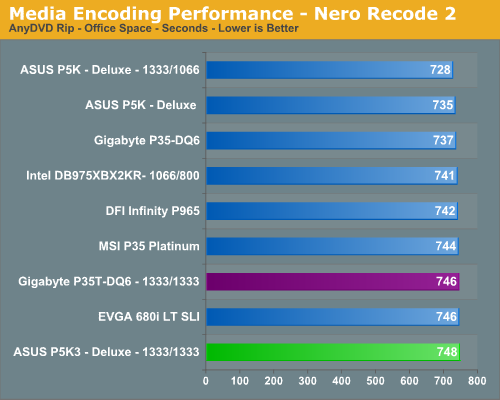
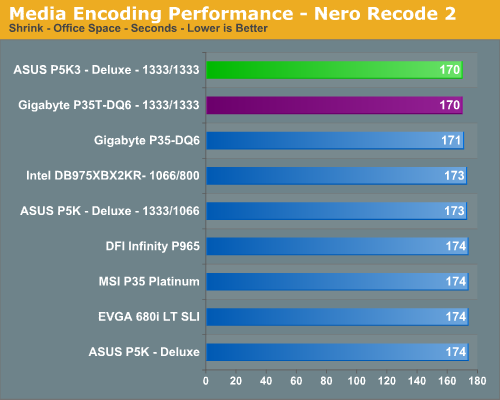
The AnyDVD Rip results do not show our DDR3 boards performing well against the DDR2 boards, especially against the same chipset. Even though memory timings are higher, the increased bandwidth and latency would normally bring the DDR3 boards within range of the DDR2 boards in a test that is CPU throughput and disk intensive. The 3% performance deficit is unusual, indicating that the high volume of data being transferred may cause memory latencies to be a more significant factor. The Shrink results are more in alignment with the DDR3 boards showing up to a 2% difference in this test.
Our next test has us converting our day at the beach AVI file into a high definition WMV file suitable for our Grandparents to view on their new HDTV. We ensured our quality settings were set to High Definition. The balance of options is set to standard settings and then we let this program do its magic. We are reporting the numbers in seconds to complete the conversion.
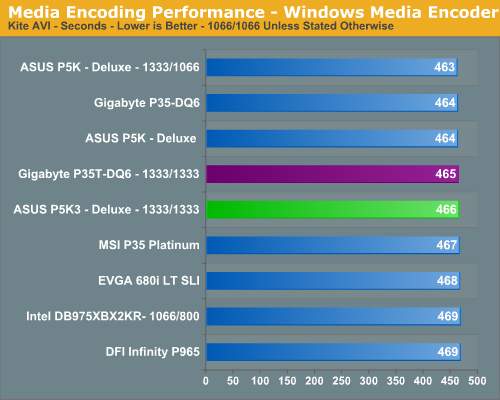
We see the boards with the best memory bandwidth and latency performance once again leading in a test that still favors the DDR2 boards. Our DDR3 boards finish in the middle of the pack. The overall difference in scores between all boards is a rather small 1.3%.
Next on the list is our QuickTime Pro 7.1 test that will convert our newly downloaded .MOV file into a plasma screen pleasing H.264 format. We ensured our quality settings were set to their highest levels and then let the horses loose. The values reported are in seconds for the conversion time, with lower numbers being better.
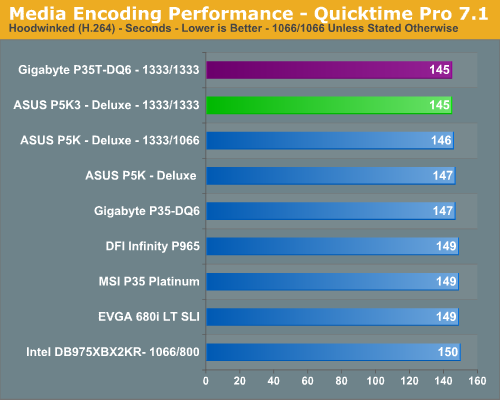
The DDR3-1333 platforms have a slight advantage in this test although the differences are truly minimal. Outside of the MSI board, all of the P35 boards are scoring slightly faster than the older chipsets, and the total range of scores differs by 3.5%.
Audio Encoding Performance
Our previous audio test suite consisted of Exact Audio Copy v095.b4 and LAME 3.98a3. We did run these tests with basically the same results but we will now utilize iTunes 7.1 as it is one of the most utilized audio applications available due to the immense popularity of the iPod. As in previous articles, we are using the INXS Greatest Hits CD for testing, which contains 16 tracks totaling 606MB of songs.
Our two audio tests have us utilizing iTunes to convert our WAV files into ACC or MP3 compatible formats. We utilize the 320kbps setting for both tests with the MP3 test also utilizing the variable bit rate option.
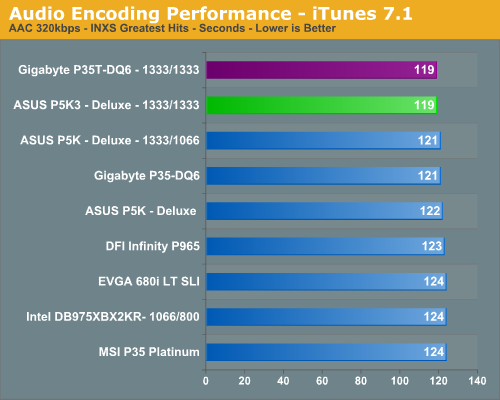
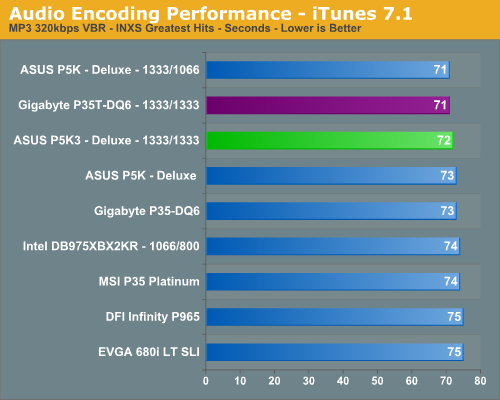
We see iTunes favoring boards with excellent CPU throughput and memory bandwidth with the 1333FSB showing a slight advantage in this test. All of the P35 boards place ahead of the older chipsets, with the exception of the MSI board. As we have mentioned already, the MSI board appears to be a couple of BIOS updates behind the Gigabyte and ASUS offerings right now, so we expect its scores to improve greatly in the next BIOS update.
Multimedia Performance
We will take a brief look at general multimedia performance with our test suite for that includes Adobe Photoshop CS3, Adobe Photoshop Elements 5.0, and Windows Movie Maker.
We utilize the widely available Retouch Artists Photoshop Speed Test for measuring platform performance in Adobe's Photoshop CS3. The benchmark applies a number of actions to a test image while we measure the total time elapsed during the active portion of the test. We set history states to 1, cache levels to 4, and CS3 is configured to make use of all available system memory. The scores reported include the full conversion process and are represented in seconds, with lower numbers indicating better performance.
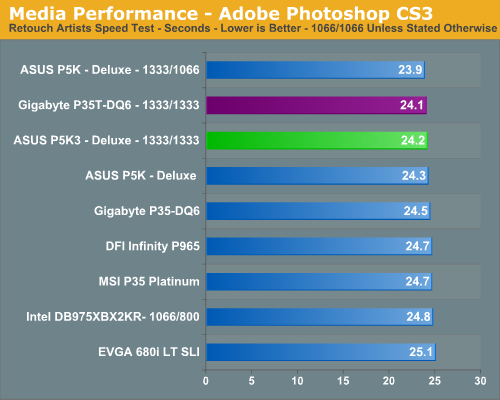
The results are in alignment with the majority of our tests to date. The 1333FSB platforms hold an advantage, although minor, in tests where CPU throughput and memory bandwidth/latency are important. The Gigabyte P35T finishes right in front of the ASUS P5K3 thanks to slightly better latencies and memory bandwidth.
Our next test is one recommended by Intel, but the test itself appears to be fair for all platforms and results are very repeatable. This test simply measures the amount of time required to fix and optimize 103 different photos weighing in at 63MB. Time is measured in seconds and lower times indicate better performance.
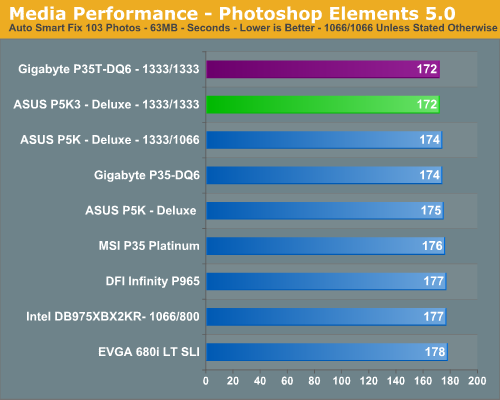
This test not only stresses the CPU/memory pipeline but also gives the storage systems a good workout. However, our results basically mirror those of our other media tests with the 1333FSB boards finishing slightly ahead and the Gigabyte/ASUS boards fighting for first place in the DDR3 setups.
Next on the list is our Windows Movie Maker test that will meld our world vacation content (recorded off TV) into a newly downloadable file that can be viewed on our Xbox 360 in a pleasing 720P format. The values reported are in seconds for the conversion time, with lower numbers being better.
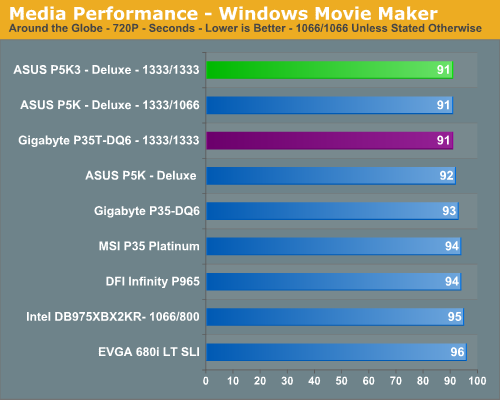
The new Intel P35 DDR2 platform boards come out on top in this test, with the DDR3 1333FSB offerings providing better performance than the other chipsets due to better memory bandwidth while still providing very good latencies. The total spread is 5.5% here, showing that the BIOS optimizations of our P35 boards can certainly be noticed in video encoding operations.
Gaming Performance
As usual, gaming performance was tested with a variety of current games. We ran benchmarks with our standard 1280x1024 resolution with all games set to High Quality mode. Given the number of users that run 19" LCDs these days, 1280x1024 represents one of the most commonly used resolutions. We will provide final CrossFire numbers in our P35 roundup.
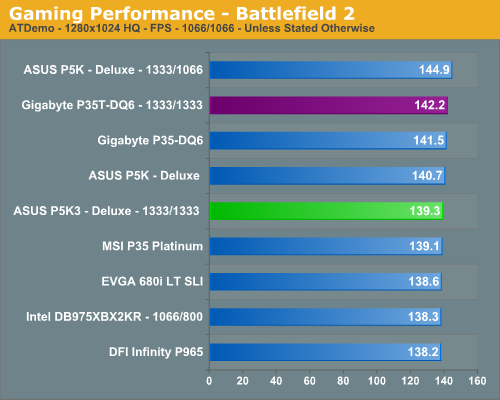
Battlefield 2
This benchmark is performed using DICE's built-in demo playback functionality with additional capture capabilities designed in-house. When using the built-in demo playback features of BF2, frames rendered during the loading screen are counted in the benchmark. In order to get a real idea of performance, we use the instantaneous frame time and frames per second data generated from our benchmark run. We discard the data collected during the loading screen and calculate a result that represents actual game play. While DICE maintains that results over 100fps aren't always reliable, our methods have allowed us to get useful data from high performing systems.
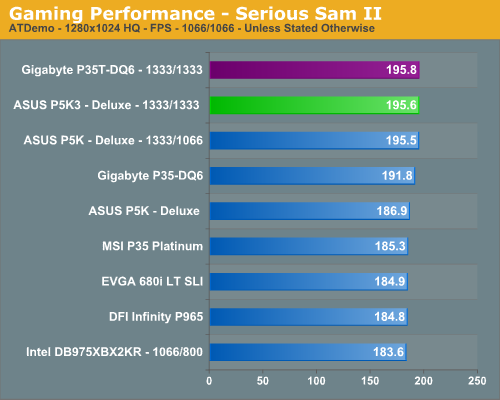
Serious Sam 2
This benchmark is performed using Croteam's built-in demo capability in the Serious Sam 2 engine. We utilize the included Branchester Demo and capture the playback results using the Ctrl-~ function. The benchmark features a large number of combatants, explosions, and general mayhem. The benchmark is can be CPU bandwidth or GPU sensitive depending upon the settings and resolution. We typically find this game is very playable at average in-game frame rates of 55 and above. We maximize all settings except antialiasing and anisotropic filtering within the general and advanced video settings.
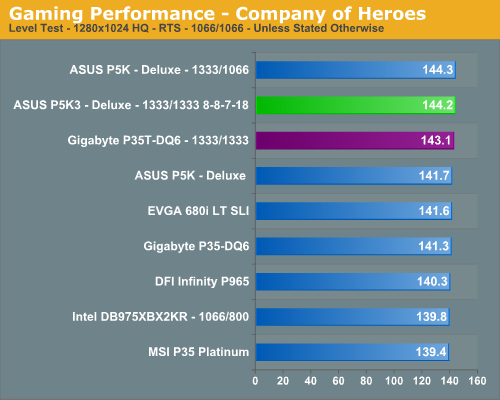
Company of Heroes
Company of Heroes was released last year and is still proving to be a very addictive RTS game around the office. The game is extremely GPU intensive and also requires a hefty CPU at times. The game contains a built-in performance test that utilizes the game engine to generate several different action scenes. We found the performance test gives a good indication of how well your system will perform throughout the game on average. We have found some of the in-game action sequences to be more demanding than the performance test and are working on game play benchmark that is repeatable. We generally found the game to be enjoyable with an average frame rate above 35fps.
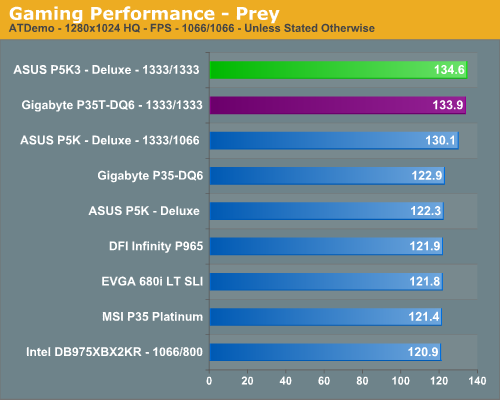
Prey
Prey offers some superb action sequences, unique weapons and characters, and is a visually stunning game at times. It still requires a very good GPU to run it with all of the eye candy turned on. We set all graphic settings to their maximum except for AA/AF and utilize a custom timedemo that takes place during one of the more action oriented sequences. We generally found the game to be enjoyable with an average frame rate above 35fps.
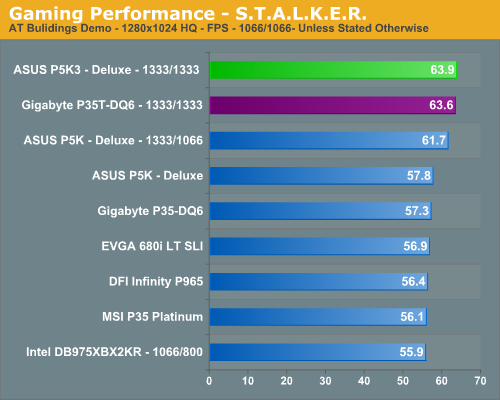
S.T.A.L.K.E.R.
S.T.A.L.K.E.R. is one of the favorite first person shooter games around the office as it continues to provide a great deal of replay value and the graphics are very good once the eye candy is turned on. What we especially like about the game is the atmosphere and the fact that it makes for a great system benchmark.
Gaming Summary
We see the ASUS DDR3 board struggling slightly in the Battlefield 2 test while the Gigabyte DDR3 offers very good performance. The improved memory latencies and bandwidth of the Gigabyte DDR3 board makes the difference over the ASUS DDR3 system in this benchmark that is both CPU and memory sensitive. Our Serious Sam 2 benchmark is CPU/memory sensitive and the increased bandwidth offered by the 1333FSB boards allows them to shine with the Gigabyte DDR3 board on top.
Our P35 DDR3 boards lead the pack in Prey and S.T.A.L.K.E.R. as both games are memory bandwidth sensitive. In our Company of Heroes test, the two DDR3 boards are once again at the top but trail our ASUS P5K DDR2 board operating at 1333FSB. Gaming continues to be driven by the GPU, especially in the latest titles, but every extra bit of performance always helps.
First Thoughts
Looking at the initial results from the Gigabyte GA-P35T-DQ6, it is clear we can answer one important question about the board: it does offer performance on par with the ASUS P5K3 Deluxe. In memory bandwidth or latency sensitive applications, it is every bit equal to or better than the ASUS board and any differences are minor. However, when we utilize an application that is clearly CPU limited, we find the ASUS performing slightly better.
We found the feature set on the Gigabyte board to be very competitive with the ASUS board although we would give the edge to ASUS for including eSATA, an additional Gigabit Ethernet port, and we still consider the ADI 1988B HD codec to be superior to the Realtek ALC-889A in gaming, though under Vista they seem to be equals now in preliminary testing. The enthusiast level BIOS options included in the ASUS P5K3 offer a higher degree of fine tuning compared to the Gigabyte P35T-DQ6. However, we have to say that except for memory overclocking we were able to extract the same or better performance with the Gigabyte board.
That brings us to our main concern about this board. We just had a very difficult time getting the board to overclock our current, albeit small, supply of DDR3 memory. The board generated excellent memory performance at or near the stock 1333 memory speeds. However, any chance at overclocking our memory in the same fashion we have on the ASUS board was generally met with frustration or failure. We know Gigabyte is addressing this issue and we expect a new BIOS spin in the next day or so to try. This issue will be chalked up to an early BIOS design unless it lingers on in the final BIOS release before general public availability of the board. For now the ASUS P5K3 is generally more polished in its implementation of memory ratios and overclocking capability.
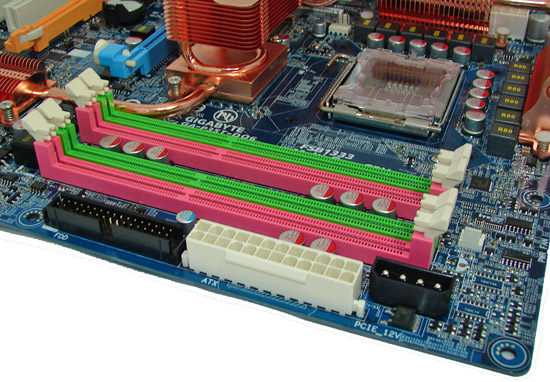
Besides the memory performance problem when overclocking we did have a couple of niggles with the board. Gigabyte utilizes ICH9 firmware for RAID that appears to be a couple of releases down from the current version and the board is slower than normal in our opinion to POST if AHCI or RAID is enabled. We still do not like the Crtl-F1 sequence for the expanding the BIOS options in the performance section. While we are at it, you cannot change out memory without first removing the video card, the CPU area cooling backplate will have to be removed or modifications made to most coolers that require backplate mounting, and the color scheme is getting a little old (though the pink memory slots will grab your attention). You will not, however, be disappointed in any other aspect of the Gigabyte's P35T-DQ6 performance or features.
With that said, BIOS tuning is paramount to extracting the best possible performance from this board - as it is with the other P35 offerings and most other chipsets. The P35T-DQ6 provides excellent performance and rock solid stability for a new system, performing better than just about any board we have tested to date. We are still learning a lot about the board, chipset straps, timings, DDR3 memory, and how they all interact with each other during overclocking. However, our initial glimpse of the board shows it be a winner right now if DDR3 support is your goal.
That brings us to the $64,000 question: is DDR3 worth the additional 2x cost premium over DDR2 in current market prices? Based on our performance results, the answer would be a qualified no for the time being. This very well could change in the near future as DDR3 pricing falls and performance further improves, but for now DDR3 is probably best suited for those who have a love for new technology. If this is you, then Gigabyte has a board that you just might want to take home today.


