Original Link: https://www.anandtech.com/show/17276/amd-ryzen-9-6900hs-rembrandt-benchmark-zen3-plus-scaling
AMD's Ryzen 9 6900HS Rembrandt Benchmarked: Zen3+ Power and Performance Scaling
by Dr. Ian Cutress on March 1, 2022 9:30 AM EST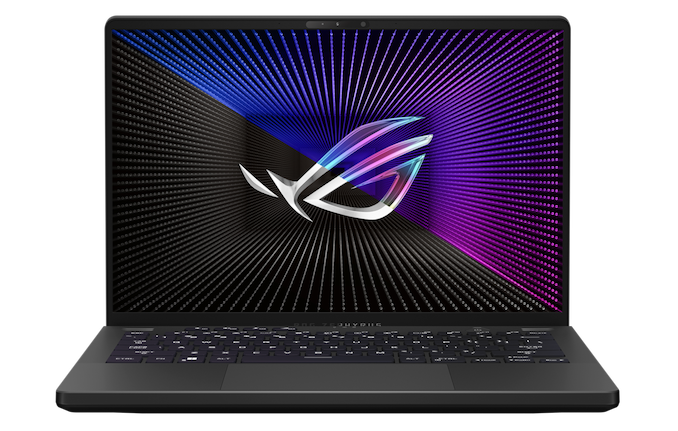
Earlier this year, AMD announced an update to its mobile processor line that we weren’t expecting quite so soon. The company updated its Ryzen 5000 Mobile processors, which are based around Zen3 and Vega cores, to Ryzen 6000 Mobile, which use Zen3+ and RDNA2 cores. The jump from Vega to RDNA2 on the graphics side was an element we had been expecting at some point, but the emergence of a Zen3+ core was very intriguing. AMD gave us a small pre-brief, saying that the core is very similar to Zen3, but with ~50 new power management features and techniques inside. With the first laptops based on these chips now shipping, we were sent one of the flagship models for a quick test.
AMD Ryzen 6000 Mobile
Zen3+ and RDNA2 Equals Rembrandt
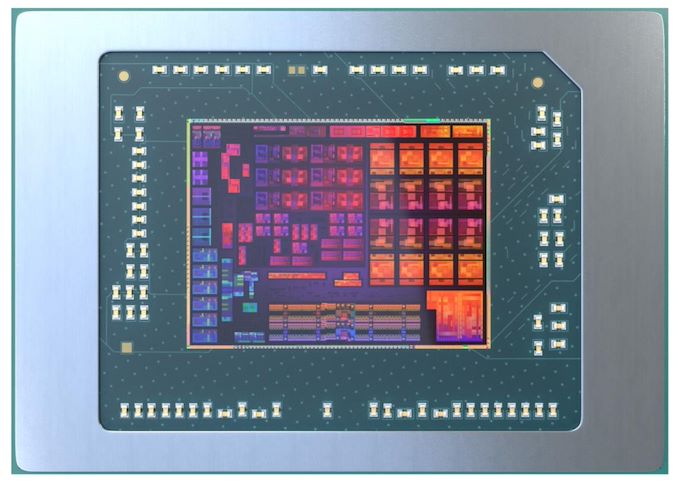
Everyone loves a good codename, and the silicon behind these new mobile processors is called Rembrandt, following AMD’s cadence of naming its mobile processors after painters. Built on the TSMC N6 process node, Rembrandt is one of the first products to use this node enhancement and get some additional voltage/frequency benefits of the updated process. Featuring 8 Zen3+ compute cores and up to 12 RDNA2 compute units for graphics, the monolithic Rembrandt die is designed to scale all the way across AMD’s notebook portfolio, from thin-and-light notebooks down at 15 W all the way up to mobile workstation-level performance at 65 W.
| AMD Ryzen 6000 Mobile CPUs 'Rembrandt' on 6nm |
||||||
| AnandTech | C/T | Base Freq |
Turbo Freq |
GPU CUs |
GPU MHz |
TDP |
| H-Series 35W+ | ||||||
| Ryzen 9 6980HX | 8/16 | 3300 | 5000 | 12 | 2400 | 45W+ |
| Ryzen 9 6980HS | 8/16 | 3300 | 5000 | 12 | 2400 | 35W |
| Ryzen 9 6900HX | 8/16 | 3300 | 4900 | 12 | 2400 | 45W+ |
| Ryzen 9 6900HS | 8/16 | 3300 | 4900 | 12 | 2400 | 35W |
| Ryzen 7 6800H | 8/16 | 3200 | 4700 | 12 | 2200 | 45W |
| Ryzen 7 6800HS | 8/16 | 3200 | 4700 | 12 | 2200 | 35W |
| Ryzen 5 6600H | 6/12 | 3300 | 4500 | 6 | 1900 | 45W |
| Ryzen 5 6600HS | 6/12 | 3300 | 4500 | 6 | 1900 | 35W |
| U-Series 15W-28W | ||||||
| Ryzen 7 6800U | 8/16 | 2700 | 4700 | 12 | 2200 | 15-28W |
| Ryzen 5 6600U | 6/12 | 2900 | 4500 | 6 | 1900 | 15-28W |
| 12 CU RDNA2 Graphics is marketed as Radeon 680M 6 CU RDNA2 Graphics is marketed as Radeon 660M |
||||||
For our testing today, we have the Ryzen 9 6900HS, which is in the top tier product line but designed to be a power-optimized product that AMD uses with select partners based on a collaborative design approach. Anything with the HS at the end means that AMD has been involved in the planning, design, and optimization – the goal here is that AMD wants the HS parts, which have been selected from production with the best performance-to-power ratio, as showcasing the Ryzen brand at its best.
New Features
For this new core to move from 7nm Zen3 to 6nm Zen3+, a number of new additions to the microarchitecture have been made. Normally we consider this to be either a simple manufacturing optimization due to the process node change, or something more fundamental to the core when there’s a microarchitectural change. In this case, AMD hasn’t really discussed any specific improvements coming from the smaller process node, instead focusing on improvements made to the SoC as a whole. At the announcement of the hardware, the headline was ’50 improvements relating to power’, and with the hardware launched we now have insight into what a number of these are.
Fundamentally, the base CPU core is the same Zen3 microarchitecture as the previous generation. Clock for clock, AMD is expecting Zen3+ to behave the same as Zen3 in raw performance output/IPC, with the changes being solely at the power level. Fundamentally AMD is saying that a number of the libraries used in the design were power-optimized, while still keeping a high-frequency capability. Normally a power-optimized design kit offers low power and low area at the expense of frequency, so in reality AMD is finding what it considers to be a more optimal point in that spectrum.
AMD highlighted the following as ‘microarchitecture’ enhancements:
- Per-Thread Power/Clock Control: Rather than being per core, each thread can carry requirements
- Leakage: Optimized process and design elements updated for better efficiency
- Delayed L3 Initialization: Removes the need to wait for L3 to fully wake from an idle state, making it asynchronous
- Peak Current Control: Better control of power ramp from idle to peak to reduce stress and save power
- Cache Dirtiness Counter: If cache misses are high (workload is bigger than L3), stay in a high power state even when low power is requested to reduce overall power use
- CPPC Per Thread: Previously the OS was only aware of workloads per core, now is aware per-thread for finer control
- PC6 Restore: Hardware-assisted wake-from-sleep for quick response
- Selective SCFCTP Save: Before waking up cores, refer to utilization before PC6 sleep
- Enhanced CC1 State: Better sleep control when core is idle
With this being a mobile chip, a lot of context here is on power saving and responsiveness when in-and-out of sleep. The concept of keeping cores at a low idle power, or moving to sleep when idle, is all in aid of enabling a device with a long(er) battery life. For example, if a core is idle for a few seconds, would it be better to put in a sleep state? This isn’t just idle frequency, but actually turning parts of the core off in a specific order – and then how and when those parts are turned back on, which has a power cost all of its own – ultimately leading to working smarter in order to conserve power usage.
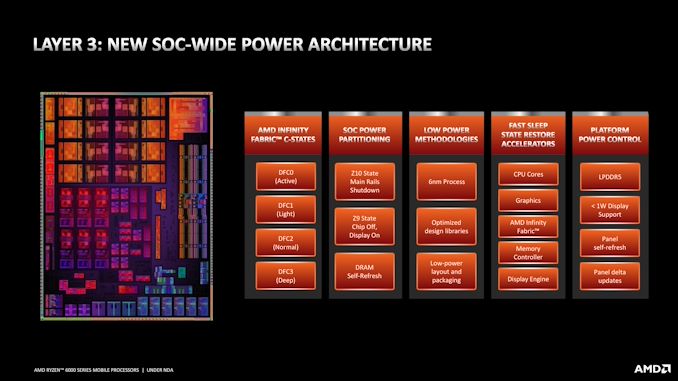
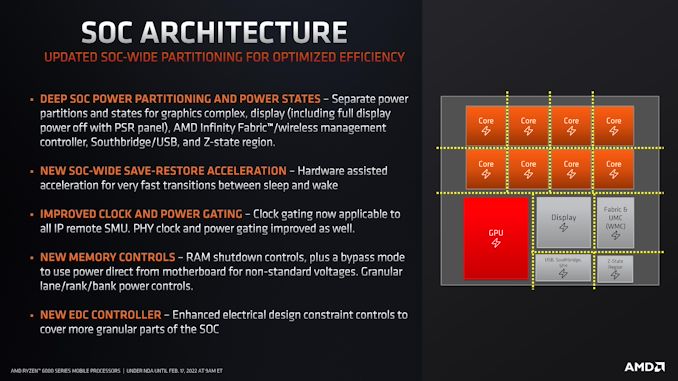
On the SoC side of power matters, AMD is showcasing that Rembrandt has better control over the internal Infinity Fabric power states, better global ‘almost off’ power states, support for LPDDR5, DRAM self-refresh, panel self refresh support, support for sub-1W panels, and accelerators to help come back out of sleep states, some of which we’ve mentioned.
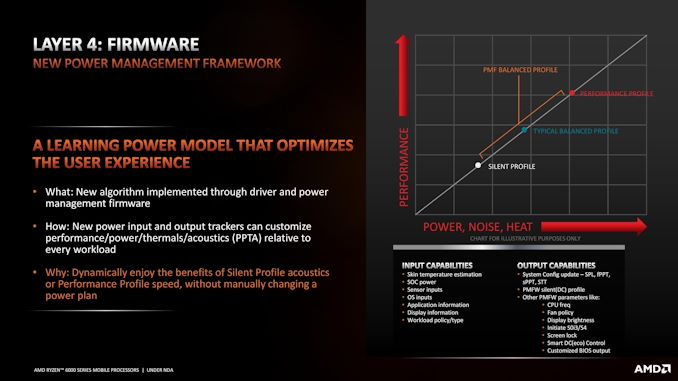
On the firmware and software side, AMD is aiming to make Rembrandt a better transitional experience from being connected to power to being a mobile platform. Normally Windows relies on internal power plans for ‘Balanced’, ‘High Performance’, or ‘Battery Saver’ – sometimes OEMs even have their own unique power plans on top of their own software. From AMD’s perspective, they want users to have the benefits of both High Performance and Battery Saver without having to manually adjust these power plans. Which brings us to AMD’s new Power Management Framework, or PMF.
PMF is an extension of a lot of previous notebook inputs, outputs, and controls – taking data from sensors such as skin temperature, but also SoC power, OS workloads, display information, noise profiles, then converting that into a ramping power profile that can offer anything from battery saver to high performance on a sliding scale.
The key here is that graph – normal Windows offerings have those individual three points, whereas AMD Rembrandt, on select optimized systems, will enable by default a scalable profile that will move up and down the graph depending on external factors. When speaking to AMD, they said that this would be baked into the firmware and automatically enabled when running in the Windows-standard Balanced Profile. User can manually select other profiles to force into those modes, but Balanced Profile will be the PMF sliding scale.
Users will not be able to disable PMF, but more than that, AMD states that it is up to the system vendor to announce if they are using PMF or not. Given that it's likely that few (if any) of them will bother to make that disclosure, I think this is somewhat of a frustrating decision – we can’t test this without a lever to disable it, whereas end-users won’t know if their system even has it or not.
Finally, AMD lists its updates for Rembrandt in the display power section of the chip. As we move to more efficient processors coupled with high-resolution, high refresh rate panels, the power consumption of the panel is becoming a major factor. But part of it is down to the SoC inside.
We’ve already mentioned Panel Self Refresh, the ability for a panel to update only the section that has actually changed from frame to frame, but AMD is saying that they can also do this with Freesync enabled. On top of this, Freesync allows the refresh rate during video fullscreen playback to be reduced to the native framerate of the video (e.g. 23.976Hz), thus saving power. The sub 1-watt panel support means that AMD has a list of validated panel vendors that can provide lower power panels (typically 1080p at 300 nits) for long battery life designs. Physically the new chip also implements new SVI3 regulators, which AMD claims provides a faster and more discrete control over the voltage required from the chip.
On top of this is the graphics engine itself, Rembrant moves from a Vega 8 solution to an RDNA2 solution, offering more performance and better efficiency. This extends to AMD A+A Advantage support as well, offering advanced power control when paired with an AMD discrete graphics solution.
In short, everything about the new chip is about control: going to sleep, and waking from sleep as quickly as possible.
15W vs 28W
Overall, we’re getting to a point in the laptop space where the vendors are now competing against each other on actual power consumption. Historically we would talk about U-series mobile processors at 15-28 watts, and then H-series at 45-65+ watts. In 2022, Intel has introduced P-series at 28 watts instead, and both companies are stating that due to improvements in design, the chassis that used to fit a 15-watt processor can now enable a 28-watt version.
As a result, we’re seeing some really awkward comparisons if you go by official numbers. Both AMD and Intel are comparing last-generation 15-watt solutions to current-generation 28-watt solutions, or comparing 28 watt systems today against equivalent designs that housed other processors before. Be careful when reading those first-party data points. That being said, both companies also want to exhibit their notebook processors at their best, so we end up with the higher-powered H series anyway in some nice chonky designs. It won’t be until reviewers can get their hands on the regular, run-of-the-mill U/P series hardware that they'll be able test like-for-like in the same way.
Our Review Unit
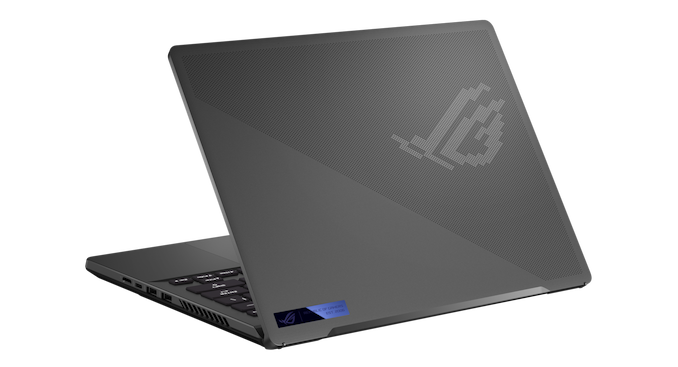
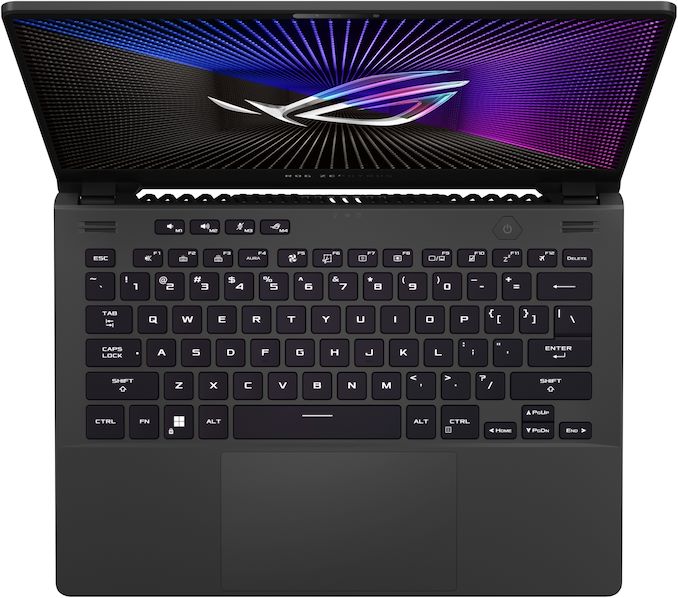
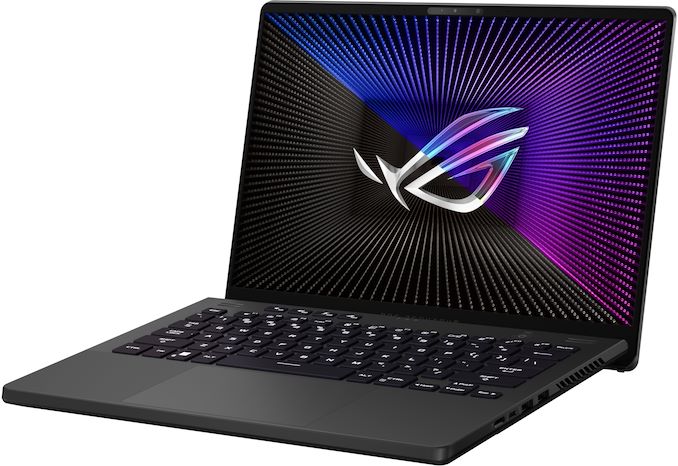
For the initial review, AMD shipped us the ASUS Zephyrus G14, one of the recent generation flagship models that are updated year-on-year with the latest hardware. We still have the G14 that was shipped with the Ryzen 4000 Mobile (Zen 2) series, although for the Ryzen 5000, AMD went with the ASUS Flow X13, which is a more ultraportable design. The G14 is still in that bracket with a slightly larger screen, slightly beefier discrete graphics, and a bit more battery. There’s even an AniMe Matrix display on the back.
AMD has paired each of these designs with the HS-branded processors. The HS models are tuned and optimized parts that AMD co-calibrates inside flagship notebook designs with its partners, so it becomes the obvious choice for AMD to sample laptops based on these chips for each launch for review. Not only that, depending on the thermal design of the laptop, the actual power setting provided by the vendor can change based on the design. We’ve had the following in for test:
- Ryzen 9 6900HS in an ASUS Zephyrus G14 (45W Default, 65W Turbo) + RX 6800S GPU
- Ryzen 9 5980HS in an ASUS Flow X13 (15W Default, 35W Turbo) + GTX 1650
- Ryzen 9 4900HS in an ASUS Zephyrus G14 (35W Turbo) + GTX 2060 GPU
As with most laptop processor launches, despite the rated TDP on the official processor listing, it’s up to the OEMs to configure and tune the exact performance to the cooling on each unit. This makes comparisons, aside from simply ‘chip vs chip’, quite difficult, as simply adjusting the processor frequency (rather than any other frequencies) has a direct impact on any IPC or performance-per-watt comparison. As a result, we rely on end-performance numbers based on the CPUs as shipped – but we’ve also tested the 6900HS in 35W mode just to see the difference.
The other big factor in our ASUS Zephryus G15 is going to be the DDR5 memory. As we’ve seen on other platforms, moving to DDR5 can cause a variety of changes in performance for both CPU and gaming – it depends how memory bandwidth dependent the tests were. This is even more true for AMD, given that the memory frequency is also tied into the infinity fabric frequencies inside the processor. Over time AMD has disaggregated the two, but there’s still a level of synchronicity involved with additional dividers, meaning that memory frequency is still an important factor.
Core-to-Core, Cache Latency, Ramp
For some of our standard tests, we look at how the CPU performs in a series of synthetic workloads to example any microarchitectural changes or differences. This includes our core-to-core latency test, a cache latency sweep across the memory space, and a ramp test to see how quick a system runs from idle to load.
Core-to-Core
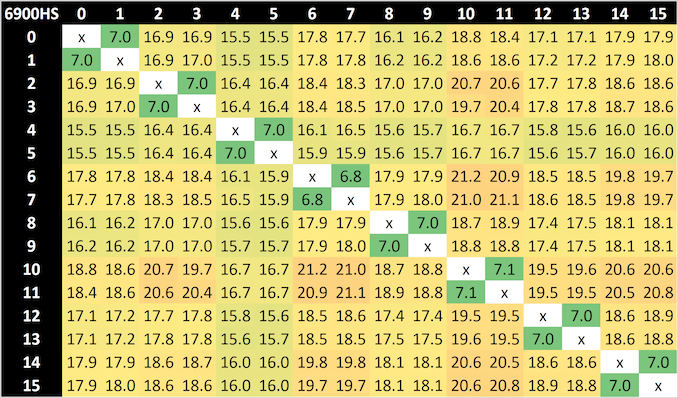
Inside the chip are eight cores connected through a bi-directional ring, each direction capable of transmitting 32 bytes per cycle. In this test we test how long it takes to probe an L3 cache line from a different core on the chip and return the result.
For two threads on the same core, we’re seeing a 7 nanosecond difference, whereas for two separate cores we’re seeing a latency from 15.5 nanoseconds up to 21.2 nanoseconds, which is a wide gap. Finding out exactly how much each jump takes is a bit tricky, as the overall time is reliant on the frequency of the core, of the cache, and of the fabric over the time of the test. It also doesn’t tell us if there is anything else on the ring aside from the cores, as there is also going to be some form of external connectivity to other elements of the SoC.
However, compared to the Zen3 numbers we saw on the Ryzen 9 5980HS, they are practically the same.
Cache Latency Ramp
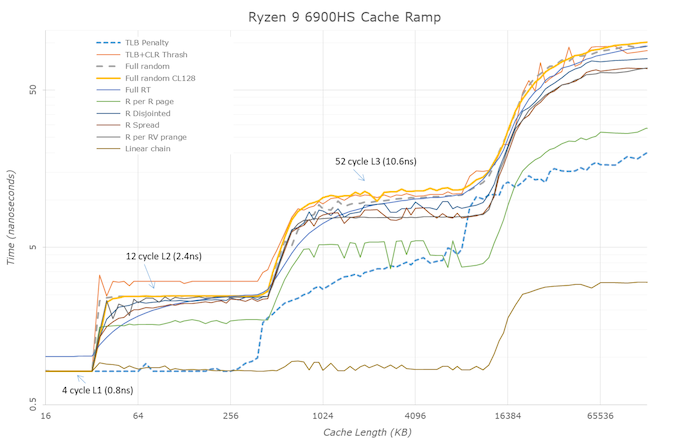
This test showcases the access latency at all the points in the cache hierarchy for a single core. We start at 2 KiB, and probe the latency all the way through to 256 MB, which for most CPUs sits inside the DRAM.
Part of this test helps us understand the range of latencies for accessing a given level of cache, but also the transition between the cache levels gives insight into how different parts of the cache microarchitecture work, such as TLBs. As CPU microarchitects look at interesting and novel ways to design caches upon caches inside caches, this basic test proves to be very valuable.
The data here again mirrors exactly what we saw with the previous generation on Zen3.
Frequency Ramp
Both AMD and Intel over the past few years have introduced features to their processors that speed up the time from when a CPU moves from idle into a high-powered state. The effect of this means that users can get peak performance quicker, but the biggest knock-on effect for this is with battery life in mobile devices, especially if a system can turbo up quick and turbo down quick, ensuring that it stays in the lowest and most efficient power state for as long as possible.
Intel’s technology is called SpeedShift, although SpeedShift was not enabled until Skylake.
One of the issues though with this technology is that sometimes the adjustments in frequency can be so fast, software cannot detect them. If the frequency is changing on the order of microseconds, but your software is only probing frequency in milliseconds (or seconds), then quick changes will be missed. Not only that, as an observer probing the frequency, you could be affecting the actual turbo performance. When the CPU is changing frequency, it essentially has to pause all compute while it aligns the frequency rate of the whole core.
We wrote an extensive review analysis piece on this, called ‘Reaching for Turbo: Aligning Perception with AMD’s Frequency Metrics’, due to an issue where users were not observing the peak turbo speeds for AMD’s processors.
We got around the issue by making the frequency probing the workload causing the turbo. The software is able to detect frequency adjustments on a microsecond scale, so we can see how well a system can get to those boost frequencies. Our Frequency Ramp tool has already been in use in a number of reviews.
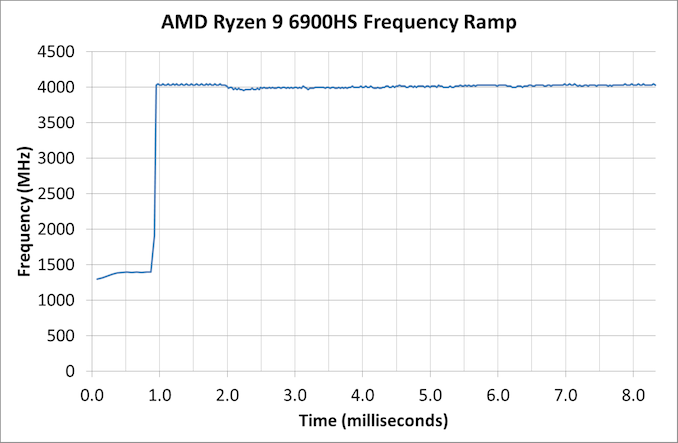
A ramp time of within one millisecond is as expected for modern AMD platforms, although we didn’t see the high 4.9 GHz that AMD has listed this processor as being able to obtain. We saw it hit that frequency in a number of tests, but not this one. AMD’s previous generation took a couple of milliseconds to hit around the 4.0 GHz mark, but then another 16 milliseconds to go full speed. We didn’t see it in this test, perhaps due to some of the new measurements AMD is doing on core workload and power. We will have to try this on a different AMD Ryzen 6000 Mobile system to see if we get the same result.
Power Consumption
On AMD’s official specifications for the Ryzen 9 6900HS, it lists the TDP as 35 W: the same specifications as the 6900HX, but at an optimized TDP. The HS means that it can only be used in AMD-approved and codesigned systems that can get the best out of the unit: i.e. it is an ultraportable premium device. That being said, laptop vendors can customize the actual final power limit as high as 80W, with the idea that because they are using an optimized voltage/frequency binned processor, the laptop design that can dissipate that much can extract more sustained performance from the processor, this usually translates into a higher all-core frequency.
For our ASUS Zephryus G14, the standard default power profile, known as ‘Performance’, is meant to conform to AMD’s Power Management Framework, i.e. scale from Energy Saving to Performance as required. In this mode, the system has a sustained 45 W power draw.
Performance: 45W
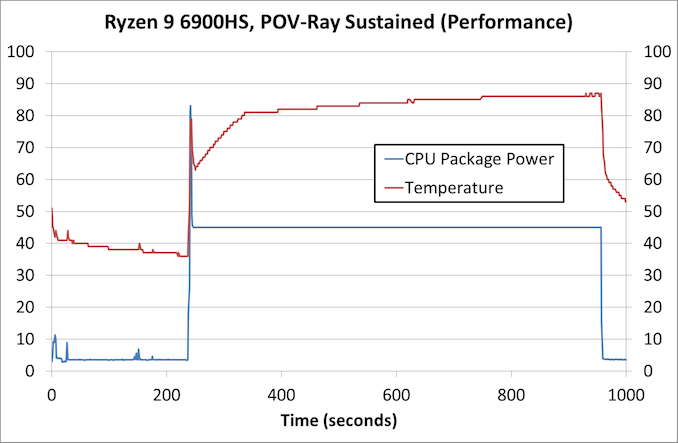
Loading up a render like POV-Ray, the system spikes the CPU package power to 83 W and 80ºC, before very quickly coming down to 45 W and a slowly rising temperature to equilibrium at 87ºC.
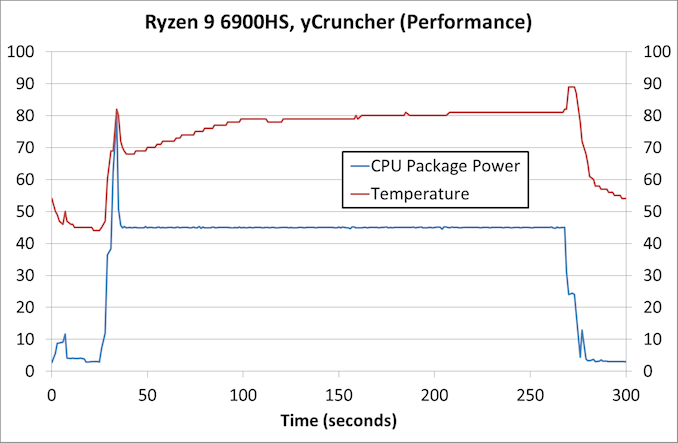
With something a bit more memory heavy, such as yCruncher, the same power profile is shown, this time with the power around about 81ºC for most of the test because it spends more time on memory access than raw throughput.
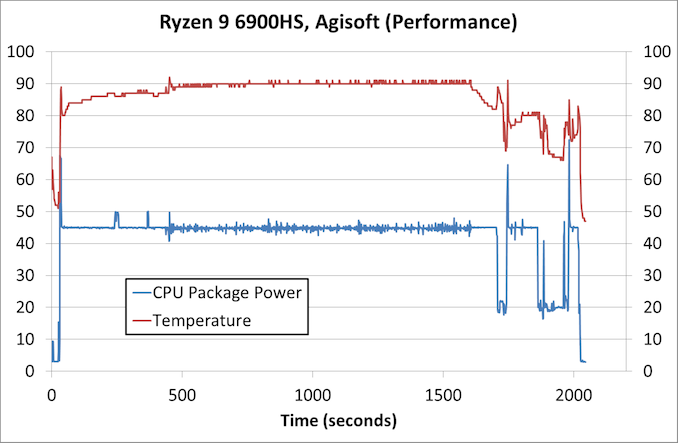
For a real-world scenario, Agisoft also spikes up very high initially, before reaching a plateau at 45 W and 90ºC.
Turbo: 65W
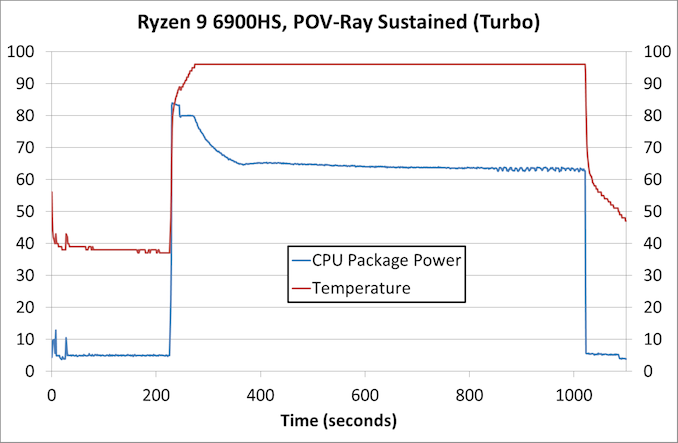
The other option on offer for this system is the ‘Turbo’ Mode, which jacks everything up to 65 W sustained.
This means we hit the peak temperature limits quite quickly, and the system ramps down over time to the 65 W average power.
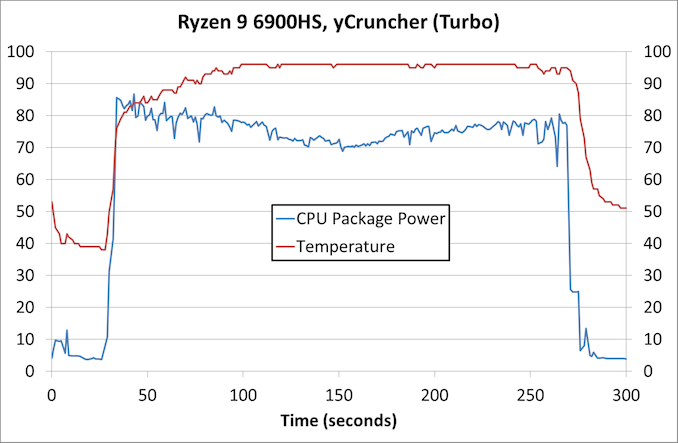
The yCruncher profile is a bit more varied due to the CPU performance going further while the memory performance staying the same, but we still see temperatures in the mid 90s and power hovering more around 75 W.
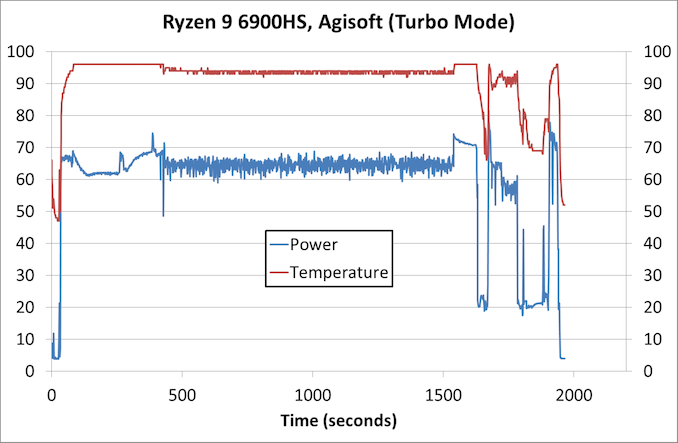
Agisoft’s Turbo profile is all about being temperature limited in this case, and we still end up in the sustained parts of the test around that 65 W value.
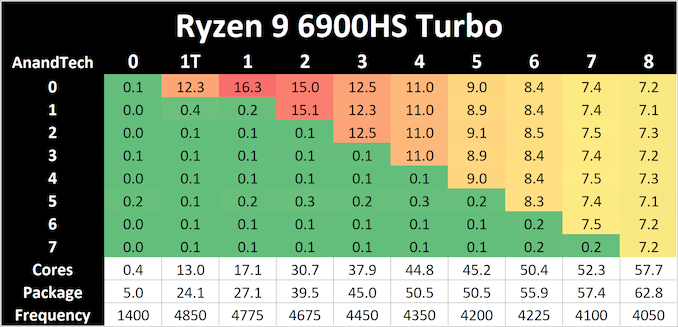
If we were to look at how the power was distributed in each mode:
In performance mode, we see 16.0 watts when one core is loaded, going down to 5.2 watts per core when all cores are loaded and a frequency of 3775 MHz.
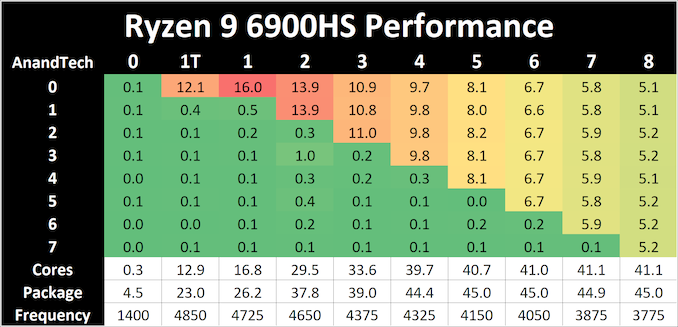
Compare that to the Turbo Mode:
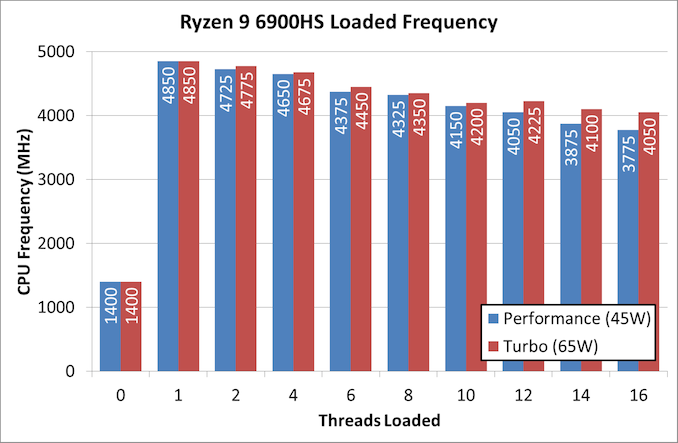
The single-core data is the same, nothing changes there, but we’re now up to 7.2 watts per core when fully loaded, and a much higher frequency at 4050 MHz. But this means we’re using 17 watts more power (or 38% more power) for only 275 MHz (a 7% gain).
Looking at the frequencies in this format, you can see a slight difference in performance, but seemingly not that much to justify the power difference. Then again, I suspect Turbo is only really for when you are fully charged and plugged into mains power anyway.
For the following benchmarks, we’re going to be using both Performance and Turbo modes, but also I put the CPU in a 35W power mode. As the 1 core and 2 core loading is below this, it shouldn’t affect the single-core performance that much, but it might give us an understanding of where it compares to previous generations.
Performance Per Watt
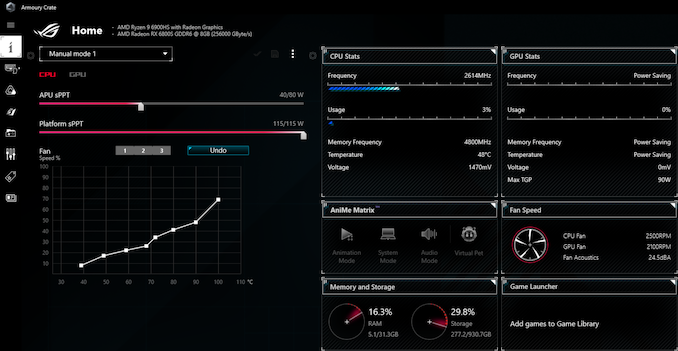
With the ASUS Zephyrus G14, it comes with some fancy ASUS software called the Armo(u)ry Crate. Inside is the usual array of options for a modern laptop when it comes to performance profiles, fans, special RGB effects and lighting, information about voltages, frequencies, fan speeds, fan profiles, and all that jazz. However inside the software there is also an interface that allows the user to cap how much APU/SoC power can be put through the processor or the whole platform.
With this option, we took advantage of the fact that the after we select a given SoC wattage, the system will automatically migrate to the required voltage and frequency under load while only ever going up to the power limits - or as much as the system would be allowed to. Using this tool, we ran a spectrum of performance data against power options to see how the POV-Ray benchmark would scale, as it is one of the benchmarks that drives core use very high and very hard.
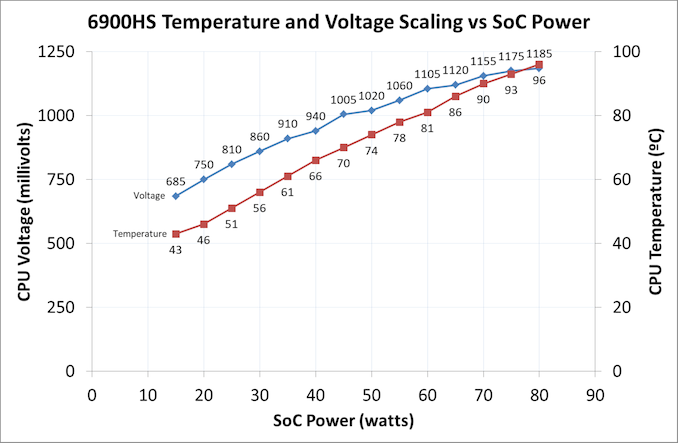
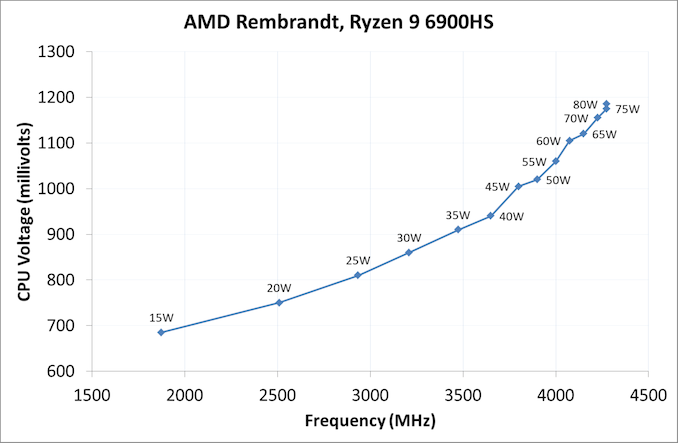
In this first graph, we monitor how the CPU voltage increases by raising the power, as well as the at-load temperature of the processor. The voltage increments start off around the 60-65 mW per 5W of SoC power, eventually becoming 15-25 W due to the way that voltage and power scales. The temperature was a very constant rise, showing 96ºC with the full 80 W selected.
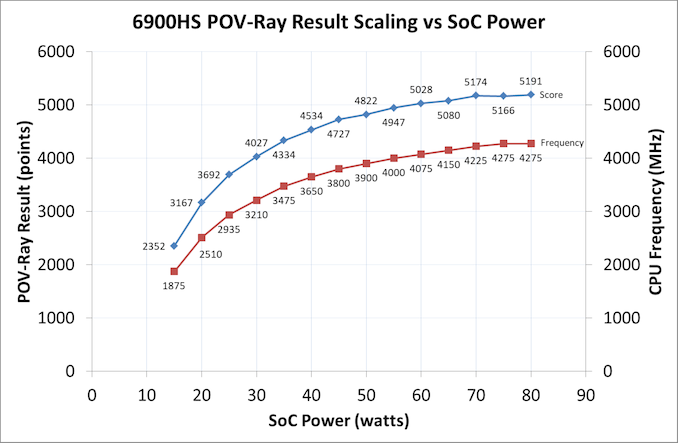
Now if we transition this to the benchmark results, as we plot this with the all-core frequency as well:
These two lines follow a similar pattern, as the score doesn't increase if the frequency doesn't increase. The biggest jumps are in the 15-35W mark, which is where most modern processors are the most efficient. However as the power is added in, the processor moves away from that ideal efficiency point, and going from 50 W to 80 W is a 60% power increase for only +375 MHz and only +7.7% increased score in the benchmark.
We can pivot this data into something a bit more familiar:
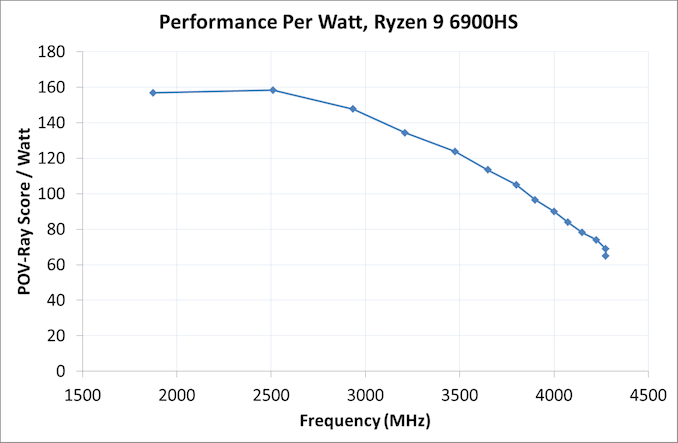
Here we can see the voltage required for all-core frequencies and how the voltage scales up. With all this data, we can actually do a performance per watt graph for Rembrandt:
In this graph we're plotting Score per watt against Frequency, and it showcases that beyond 2.5 GHz, the Rembrandt CPU design becomes less efficient. Most modern processors end up being most efficient around this frequency, so it isn't perhaps all that surprising.
Now all of this is also subject to binning - not only are chips binned by the designation (6900HS vs 6800H for example), but also within an individual SKU, there will be better bins than others. We see this in some mobile processors that can have 10+ bins with different voltage/frequency characteristics, but all still called the same, because they perform at a shared guaranteed minimum. With smartphones, this testing is a lot easier, as that voltage/frequency table is often part of the hardware mechanism. But for notebooks and desktops, we're often at the mercy of the motherboard manufacturer or OEM, who can use their own settings, overriding anything that Intel or AMD suggest. Hopefully in the future we will get more control and be able to determine what is manufacturer based and what is motherboard based.
CPU Tests: SPEC Performance
SPEC2017 is a series of standardized tests used to probe the overall performance between different systems, different architectures, different microarchitectures, and setups. The code has to be compiled, and then the results can be submitted to an online database for comparison. It covers a range of integer and floating point workloads, and can be very optimized for each CPU, so it is important to check how the benchmarks are being compiled and run.
For compilers, we use LLVM both for C/C++ and Fortran tests, and for Fortran we’re using the Flang compiler. The rationale of using LLVM over GCC is better cross-platform comparisons to platforms that have only have LLVM support and future articles where we’ll investigate this aspect more. We’re not considering closed-sourced compilers such as MSVC or ICC.
clang version 10.0.0
clang version 7.0.1 (ssh://[email protected]/flang-compiler/flang-driver.git
24bd54da5c41af04838bbe7b68f830840d47fc03)-Ofast -fomit-frame-pointer
-march=x86-64
-mtune=core-avx2
-mfma -mavx -mavx2
Our compiler flags are straightforward, with basic –Ofast and relevant ISA switches to allow for AVX2 instructions. We decided to build our SPEC binaries on AVX2, which puts a limit on Haswell as how old we can go before the testing will fall over. This also means we don’t have AVX512 binaries, primarily because in order to get the best performance, the AVX-512 intrinsic should be packed by a proper expert, as with our AVX-512 benchmark. All of the major vendors, AMD, Intel, and Arm, all support the way in which we are testing SPEC.
To note, the requirements for the SPEC licence state that any benchmark results from SPEC have to be labeled ‘estimated’ until they are verified on the SPEC website as a meaningful representation of the expected performance. This is most often done by the big companies and OEMs to showcase performance to customers, however is quite over the top for what we do as reviewers.
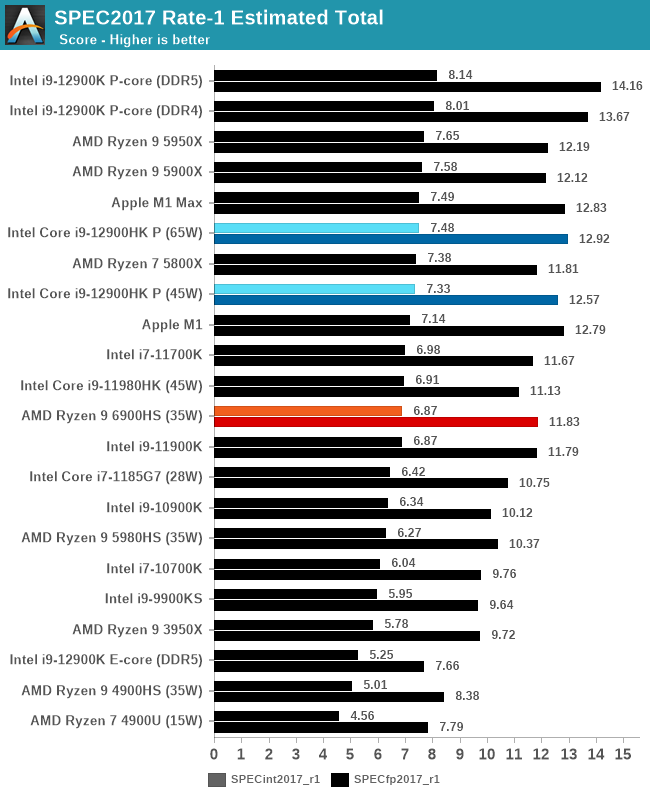
In the single threaded test, the jump over the regular Zen 3 Ryzen mobile variant (5980HS) at the same power is quite substantial: +9.6% on integer performance and +14.1% on floating point. The move from DDR4 to DDR5 is quite substantial in that regard, and it’s seen in a lot of our upcoming benchmarks.
We didn’t see any change from 35 W to 45 W to 65 W in our AMD testing as the power consumption of the chip in single threaded workloads did not exceed 24 W, however we did see performance difference in Intel’s Alder Lake going from 45 W to 65 W, showcasing how much power the core can consume.
But if we compared that to Intel’s latest Alder Lake offerings, there’s a deficit in both categories – even though our lowest data here is at 45 W, we can see that the 45 W testing of the previous generation Intel also beats the 6900HS at SPECint (but AMD wins in SPECfp). This is something that carries through to multi-threaded performance.
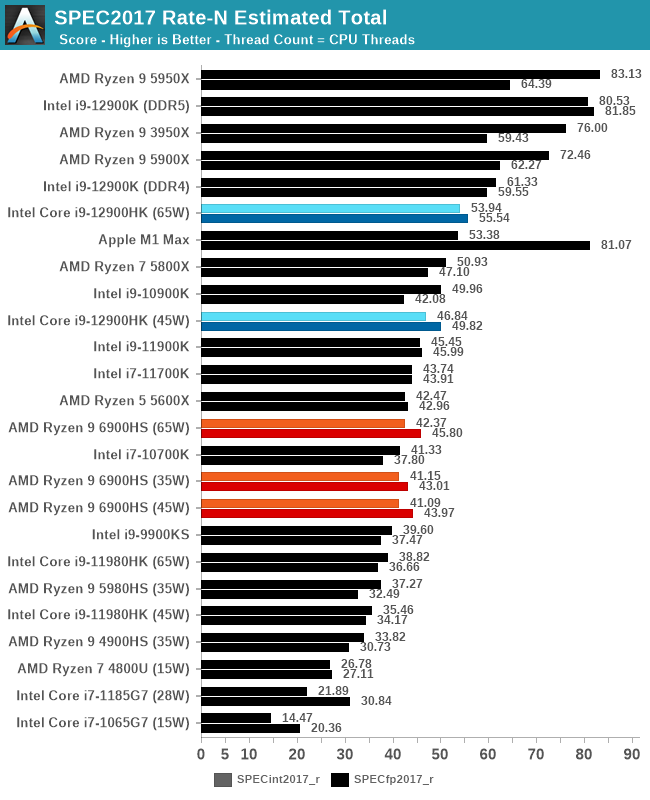
For Multi-Threaded performance, we only saw the slightest improvement from AMD moving up to 65 W, perhaps showcasing that the hardware is limited in other ways than just power and the uplift from DDR4 to DDR5. In any event, at 35 W, AMD still surpasses what the previous generation Intel i9-11980HK can provide at 65 W.
But if we compare it to Intel’s latest Alder Lake processors, featuring 6 performance cores and 8 efficiency cores, we now have 20 threads up against AMD’s 16 threads. If we compare 45 W to 45 W, Intel has a +14.0% lead in integer and a +13.3% lead in floating point, despite the 20% increase in threads. With Intel introducing this dual tier performance with hybrid SoCs, multi-threaded performance is going to be a combination of fast+slow and it all comes down to how the system can divide up the work.
Office and Science
In this version of our test suite, all the science focused tests that aren’t ‘simulation’ work are now in our science section. This includes Brownian Motion, calculating digits of Pi, molecular dynamics, and for the first time, we’re trialing an artificial intelligence benchmark, both inference and training, that works under Windows using python and TensorFlow. Where possible these benchmarks have been optimized with the latest in vector instructions, except for the AI test – we were told that while it uses Intel’s Math Kernel Libraries, they’re optimized more for Linux than for Windows, and so it gives an interesting result when unoptimized software is used.
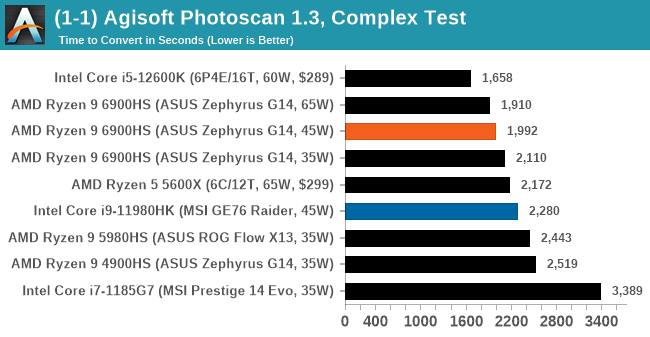
Agisoft Photoscan 1.3.3: link
The concept of Photoscan is about translating many 2D images into a 3D model - so the more detailed the images, and the more you have, the better the final 3D model in both spatial accuracy and texturing accuracy. The algorithm has four stages, with some parts of the stages being single-threaded and others multi-threaded, along with some cache/memory dependency in there as well. For some of the more variable threaded workload, features such as Speed Shift and XFR will be able to take advantage of CPU stalls or downtime, giving sizeable speedups on newer microarchitectures.
For the update to version 1.3.3, the Agisoft software now supports command line operation. Agisoft provided us with a set of new images for this version of the test, and a python script to run it. We’ve modified the script slightly by changing some quality settings for the sake of the benchmark suite length, as well as adjusting how the final timing data is recorded. The python script dumps the results file in the format of our choosing. For our test we obtain the time for each stage of the benchmark, as well as the overall time.
GeekBench 5: Link
As a common tool for cross-platform testing between mobile, PC, and Mac, GeekBench is an ultimate exercise in synthetic testing across a range of algorithms looking for peak throughput. Tests include encryption, compression, fast Fourier transform, memory operations, n-body physics, matrix operations, histogram manipulation, and HTML parsing.
I’m including this test due to popular demand, although the results do come across as overly synthetic, and a lot of users often put a lot of weight behind the test due to the fact that it is compiled across different platforms (although with different compilers).
We have both GB5 and GB4 results in our benchmark database. GB5 was introduced to our test suite after already having tested ~25 CPUs, and so the results are a little sporadic by comparison. These spots will be filled in when we retest any of the CPUs.
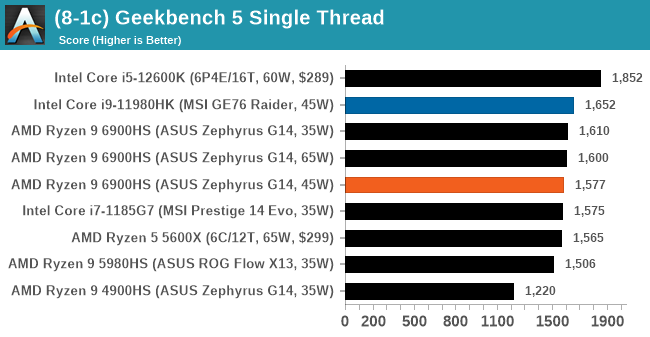
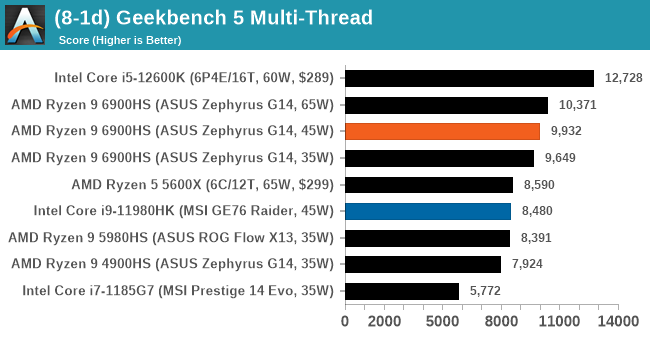
We saw a few instances where the 35W/45W results were almost identical, with the margin that the 35W would come out ahead in single threaded tasks. This may be because 35W was a fixed setting in the software options, whereas 45W was the power management framework in action.
NAMD 2.13 (ApoA1): Molecular Dynamics
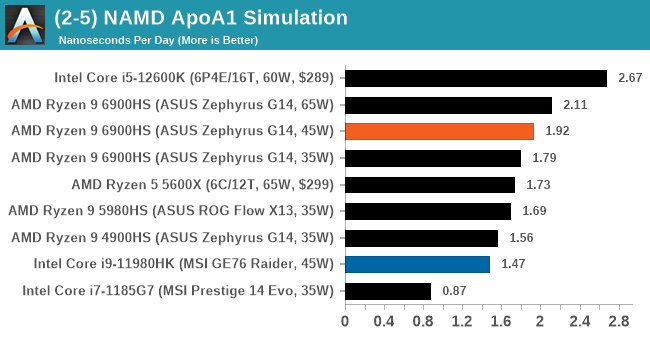
One of the popular science fields is modeling the dynamics of proteins. By looking at how the energy of active sites within a large protein structure over time, scientists behind the research can calculate required activation energies for potential interactions. This becomes very important in drug discovery. Molecular dynamics also plays a large role in protein folding, and in understanding what happens when proteins misfold, and what can be done to prevent it. Two of the most popular molecular dynamics packages in use today are NAMD and GROMACS.
NAMD, or Nanoscale Molecular Dynamics, has already been used in extensive Coronavirus research on the Frontier supercomputer. Typical simulations using the package are measured in how many nanoseconds per day can be calculated with the given hardware, and the ApoA1 protein (92,224 atoms) has been the standard model for molecular dynamics simulation.
Luckily the compute can home in on a typical ‘nanoseconds-per-day’ rate after only 60 seconds of simulation, however we stretch that out to 10 minutes to take a more sustained value, as by that time most turbo limits should be surpassed. The simulation itself works with 2 femtosecond timesteps. We use version 2.13 as this was the recommended version at the time of integrating this benchmark into our suite. The latest nightly builds we’re aware have started to enable support for AVX-512, however due to consistency in our benchmark suite, we are retaining with 2.13. Other software that we test with has AVX-512 acceleration.
AI Benchmark 0.1.2 using TensorFlow: Link
Finding an appropriate artificial intelligence benchmark for Windows has been a holy grail of mine for quite a while. The problem is that AI is such a fast moving, fast paced word that whatever I compute this quarter will no longer be relevant in the next, and one of the key metrics in this benchmarking suite is being able to keep data over a long period of time. We’ve had AI benchmarks on smartphones for a while, given that smartphones are a better target for AI workloads, but it also makes some sense that everything on PC is geared towards Linux as well.
Thankfully however, the good folks over at ETH Zurich in Switzerland have converted their smartphone AI benchmark into something that’s useable in Windows. It uses TensorFlow, and for our benchmark purposes we’ve locked our testing down to TensorFlow 2.10, AI Benchmark 0.1.2, while using Python 3.7.6.
The benchmark runs through 19 different networks including MobileNet-V2, ResNet-V2, VGG-19 Super-Res, NVIDIA-SPADE, PSPNet, DeepLab, Pixel-RNN, and GNMT-Translation. All the tests probe both the inference and the training at various input sizes and batch sizes, except the translation that only does inference. It measures the time taken to do a given amount of work, and spits out a value at the end.
There is one big caveat for all of this, however. Speaking with the folks over at ETH, they use Intel’s Math Kernel Libraries (MKL) for Windows, and they’re seeing some incredible drawbacks. I was told that MKL for Windows doesn’t play well with multiple threads, and as a result any Windows results are going to perform a lot worse than Linux results. On top of that, after a given number of threads (~16), MKL kind of gives up and performance drops of quite substantially.
So why test it at all? Firstly, because we need an AI benchmark, and a bad one is still better than not having one at all. Secondly, if MKL on Windows is the problem, then by publicizing the test, it might just put a boot somewhere for MKL to get fixed. To that end, we’ll stay with the benchmark as long as it remains feasible.
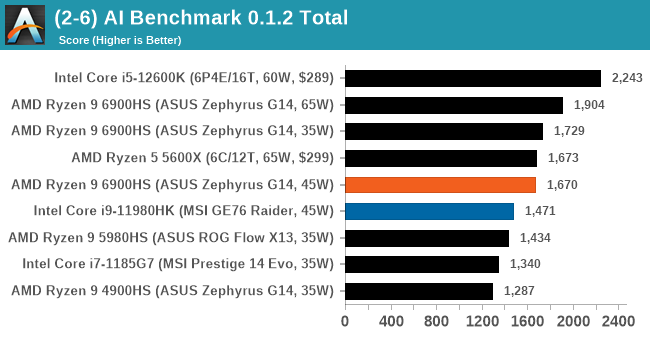
We saw a few instances where the 35W/45W results were almost identical, with the margin that the 35W would come out ahead in single threaded tasks. This may be because 35W was a fixed setting in the software options, whereas 45W was the power management framework in action.
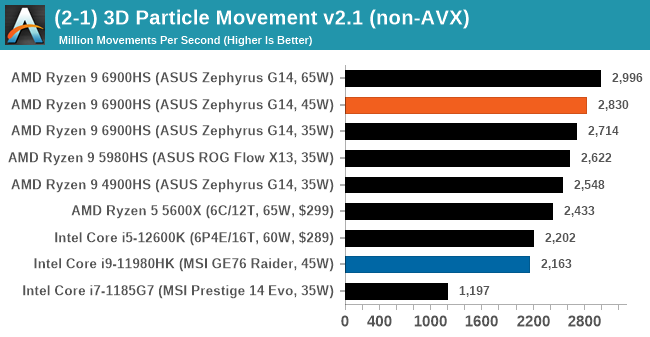
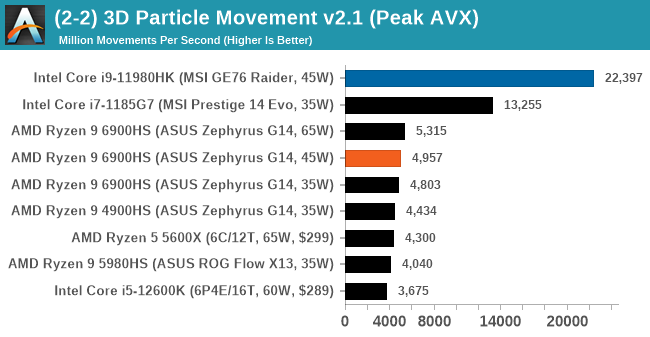
3D Particle Movement v2.1: Non-AVX and AVX2/AVX512
This is the latest version of this benchmark designed to simulate semi-optimized scientific algorithms taken directly from my doctorate thesis. This involves randomly moving particles in a 3D space using a set of algorithms that define random movement. Version 2.1 improves over 2.0 by passing the main particle structs by reference rather than by value, and decreasing the amount of double->float->double recasts the compiler was adding in.
The initial version of v2.1 is a custom C++ binary of my own code, and flags are in place to allow for multiple loops of the code with a custom benchmark length. By default this version runs six times and outputs the average score to the console, which we capture with a redirection operator that writes to file.
For v2.1, we also have a fully optimized AVX2/AVX512 version, which uses intrinsics to get the best performance out of the software. This was done by a former Intel AVX-512 engineer who now works elsewhere. According to Jim Keller, there are only a couple dozen or so people who understand how to extract the best performance out of a CPU, and this guy is one of them. To keep things honest, AMD also has a copy of the code, but has not proposed any changes.
The 3DPM test is set to output millions of movements per second, rather than time to complete a fixed number of movements.
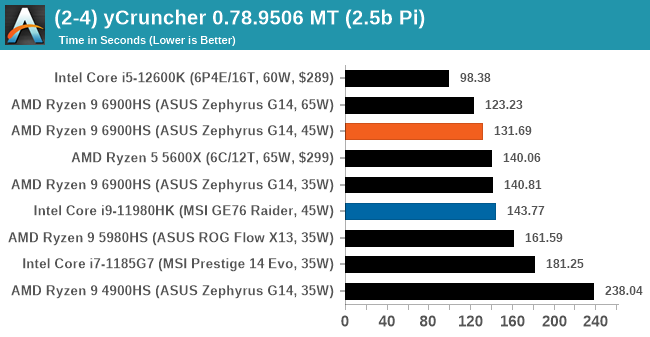
y-Cruncher 0.78.9506: www.numberworld.org/y-cruncher
If you ask anyone what sort of computer holds the world record for calculating the most digits of pi, I can guarantee that a good portion of those answers might point to some colossus super computer built into a mountain by a super-villain. Fortunately nothing could be further from the truth – the computer with the record is a quad socket Ivy Bridge server with 300 TB of storage. The software that was run to get that was y-cruncher.
Built by Alex Yee over the last part of a decade and some more, y-Cruncher is the software of choice for calculating billions and trillions of digits of the most popular mathematical constants. The software has held the world record for Pi since August 2010, and has broken the record a total of 7 times since. It also holds records for e, the Golden Ratio, and others. According to Alex, the program runs around 500,000 lines of code, and he has multiple binaries each optimized for different families of processors, such as Zen, Ice Lake, Sky Lake, all the way back to Nehalem, using the latest SSE/AVX2/AVX512 instructions where they fit in, and then further optimized for how each core is built.
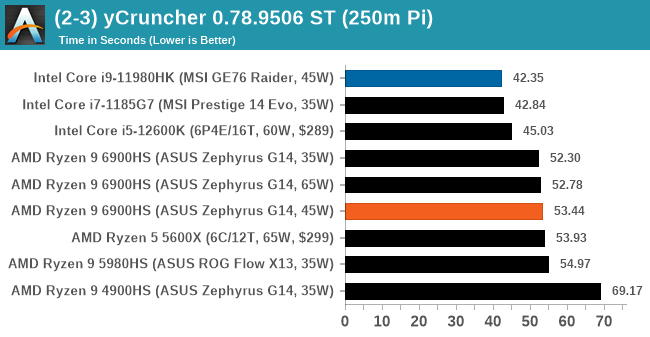
For our purposes, we’re calculating Pi, as it is more compute bound than memory bound. In single thread mode we calculate 250 million digits, while in multithreaded mode we go for 2.5 billion digits. That 2.5 billion digit value requires ~12 GB of DRAM, and so is limited to systems with at least 16 GB.
Simulation
Simulation and Science have a lot of overlap in the benchmarking world, however for this distinction we’re separating into two segments mostly based on the utility of the resulting data. The benchmarks that fall under Science have a distinct use for the data they output – in our Simulation section, these act more like synthetics but at some level are still trying to simulate a given environment.
DigiCortex v1.35: link
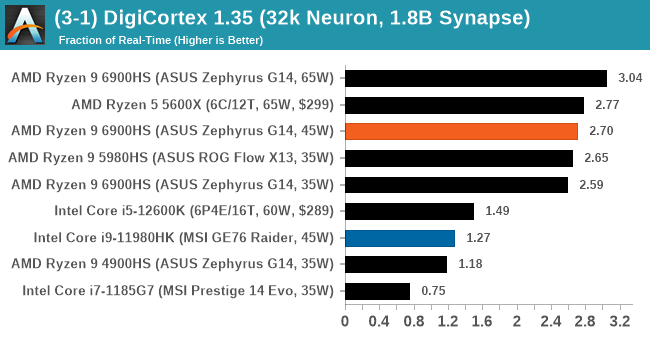
DigiCortex is a pet project for the visualization of neuron and synapse activity in the brain. The software comes with a variety of benchmark modes, and we take the small benchmark which runs a 32k neuron/1.8B synapse simulation, similar to a small slug.
The results on the output are given as a fraction of whether the system can simulate in real-time, so anything above a value of one is suitable for real-time work. The benchmark offers a 'no firing synapse' mode, which in essence detects DRAM and bus speed, however we take the firing mode which adds CPU work with every firing.
The software originally shipped with a benchmark that recorded the first few cycles and output a result. So while fast multi-threaded processors this made the benchmark last less than a few seconds, slow dual-core processors could be running for almost an hour. There is also the issue of DigiCortex starting with a base neuron/synapse map in ‘off mode’, giving a high result in the first few cycles as none of the nodes are currently active. We found that the performance settles down into a steady state after a while (when the model is actively in use), so we asked the author to allow for a ‘warm-up’ phase and for the benchmark to be the average over a second sample time.
For our test, we give the benchmark 20000 cycles to warm up and then take the data over the next 10000 cycles seconds for the test – on a modern processor this takes 30 seconds and 150 seconds respectively. This is then repeated a minimum of 10 times, with the first three results rejected. Results are shown as a multiple of real-time calculation.
Dwarf Fortress 0.44.12: Link
Another long standing request for our benchmark suite has been Dwarf Fortress, a popular management/roguelike indie video game, first launched in 2006 and still being regularly updated today, aiming for a Steam launch sometime in the future.
Emulating the ASCII interfaces of old, this title is a rather complex beast, which can generate environments subject to millennia of rule, famous faces, peasants, and key historical figures and events. The further you get into the game, depending on the size of the world, the slower it becomes as it has to simulate more famous people, more world events, and the natural way that humanoid creatures take over an environment. Like some kind of virus.
For our test we’re using DFMark. DFMark is a benchmark built by vorsgren on the Bay12Forums that gives two different modes built on DFHack: world generation and embark. These tests can be configured, but range anywhere from 3 minutes to several hours. After analyzing the test, we ended up going for
- A Medium World, 127x127, with 550 years, 10 civilizations and 4 megabeasts
DFMark outputs the time to run any given test, so this is what we use for the output. We loop the test for as many times possible in 30 minutes.
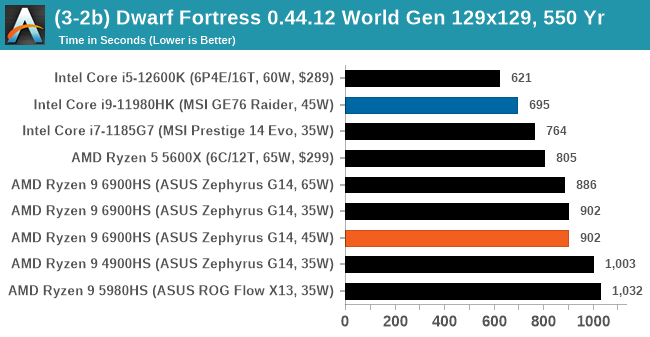
We saw a few instances where the 35W/45W results were almost identical, with the margin that the 35W would come out ahead in single threaded tasks. This may be because 35W was a fixed setting in the software options, whereas 45W was the power management framework in action.
Dolphin v5.0 Emulation: Link
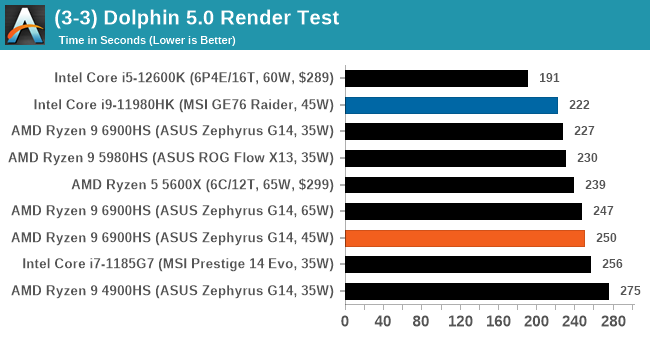
Many emulators are often bound by single thread CPU performance, and general reports tended to suggest that Haswell provided a significant boost to emulator performance. This benchmark runs a Wii program that ray traces a complex 3D scene inside the Dolphin Wii emulator. Performance on this benchmark is a good proxy of the speed of Dolphin CPU emulation, which is an intensive single core task using most aspects of a CPU. Results are given in seconds, where the Wii itself scores 1051 seconds.
Rendering
Rendering tests, compared to others, are often a little more simple to digest and automate. All the tests put out some sort of score or time, usually in an obtainable way that makes it fairly easy to extract. These tests are some of the most strenuous in our list, due to the highly threaded nature of rendering and ray-tracing, and can draw a lot of power. If a system is not properly configured to deal with the thermal requirements of the processor, the rendering benchmarks is where it would show most easily as the frequency drops over a sustained period of time. Most benchmarks in this case are re-run several times, and the key to this is having an appropriate idle/wait time between benchmarks to allow for temperatures to normalize from the last test.
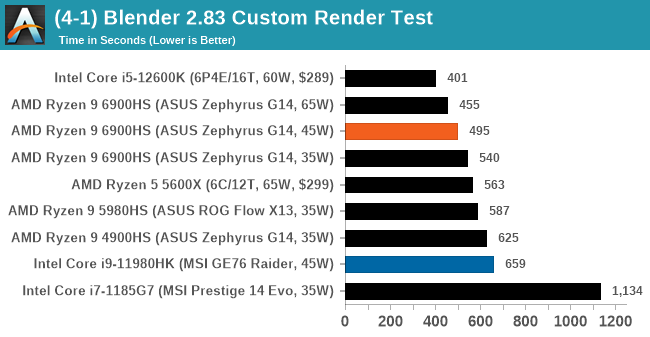
Blender 2.83 LTS: Link
One of the popular tools for rendering is Blender, with it being a public open source project that anyone in the animation industry can get involved in. This extends to conferences, use in films and VR, with a dedicated Blender Institute, and everything you might expect from a professional software package (except perhaps a professional grade support package). With it being open-source, studios can customize it in as many ways as they need to get the results they require. It ends up being a big optimization target for both Intel and AMD in this regard.
For benchmarking purposes, we fell back to one rendering a frame from a detailed project. Most reviews, as we have done in the past, focus on one of the classic Blender renders, known as BMW_27. It can take anywhere from a few minutes to almost an hour on a regular system. However now that Blender has moved onto a Long Term Support model (LTS) with the latest 2.83 release, we decided to go for something different.
We use this scene, called PartyTug at 6AM by Ian Hubert, which is the official image of Blender 2.83. It is 44.3 MB in size, and uses some of the more modern compute properties of Blender. As it is more complex than the BMW scene, but uses different aspects of the compute model, time to process is roughly similar to before. We loop the scene for at least 10 minutes, taking the average time of the completions taken. Blender offers a command-line tool for batch commands, and we redirect the output into a text file.
Corona 1.3: Link
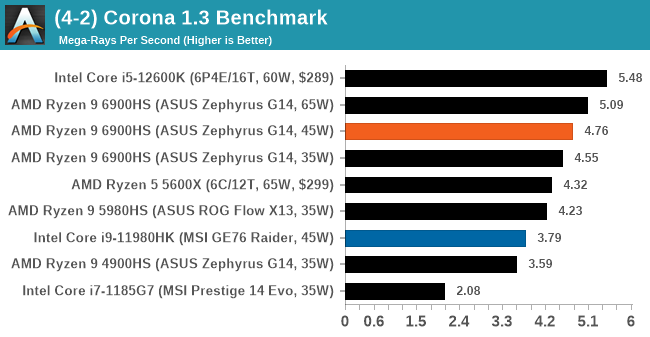
Corona is billed as a popular high-performance photorealistic rendering engine for 3ds Max, with development for Cinema 4D support as well. In order to promote the software, the developers produced a downloadable benchmark on the 1.3 version of the software, with a ray-traced scene involving a military vehicle and a lot of foliage. The software does multiple passes, calculating the scene, geometry, preconditioning and rendering, with performance measured in the time to finish the benchmark (the official metric used on their website) or in rays per second (the metric we use to offer a more linear scale).
The standard benchmark provided by Corona is interface driven: the scene is calculated and displayed in front of the user, with the ability to upload the result to their online database. We got in contact with the developers, who provided us with a non-interface version that allowed for command-line entry and retrieval of the results very easily. We loop around the benchmark five times, waiting 60 seconds between each, and taking an overall average. The time to run this benchmark can be around 10 minutes on a Core i9, up to over an hour on a quad-core 2014 AMD processor or dual-core Pentium.
POV-Ray 3.7.1: Link
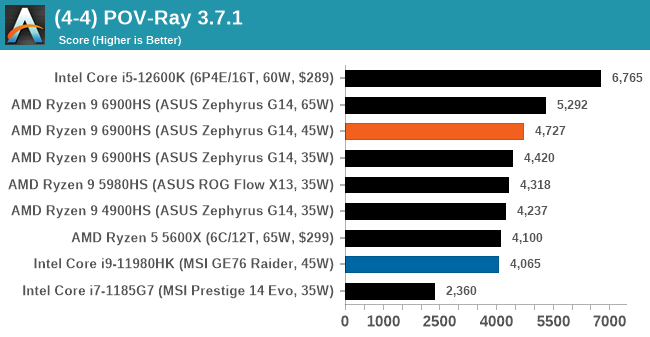
A long time benchmark staple, POV-Ray is another rendering program that is well known to load up every single thread in a system, regardless of cache and memory levels. After a long period of POV-Ray 3.7 being the latest official release, when AMD launched Ryzen the POV-Ray codebase suddenly saw a range of activity from both AMD and Intel, knowing that the software (with the built-in benchmark) would be an optimization tool for the hardware.
We had to stick a flag in the sand when it came to selecting the version that was fair to both AMD and Intel, and still relevant to end-users. Version 3.7.1 fixes a significant bug in the early 2017 code that was advised against in both Intel and AMD manuals regarding to write-after-read, leading to a nice performance boost.
The benchmark can take over 20 minutes on a slow system with few cores, or around a minute or two on a fast system, or seconds with a dual high-core count EPYC. Because POV-Ray draws a large amount of power and current, it is important to make sure the cooling is sufficient here and the system stays in its high-power state. Using a motherboard with a poor power-delivery and low airflow could create an issue that won’t be obvious in some CPU positioning if the power limit only causes a 100 MHz drop as it changes P-states.
V-Ray: Link
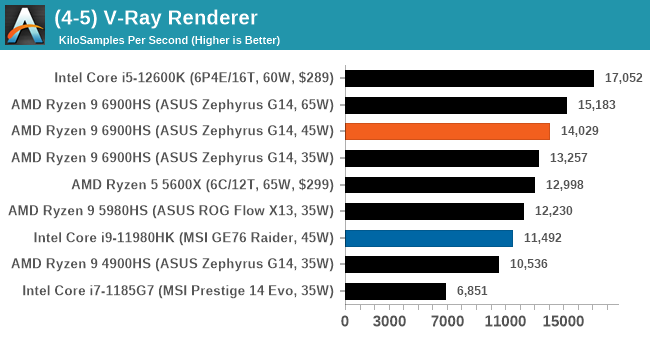
We have a couple of renderers and ray tracers in our suite already, however V-Ray’s benchmark came through for a requested benchmark enough for us to roll it into our suite. Built by ChaosGroup, V-Ray is a 3D rendering package compatible with a number of popular commercial imaging applications, such as 3ds Max, Maya, Undreal, Cinema 4D, and Blender.
We run the standard standalone benchmark application, but in an automated fashion to pull out the result in the form of kilosamples/second. We run the test six times and take an average of the valid results.
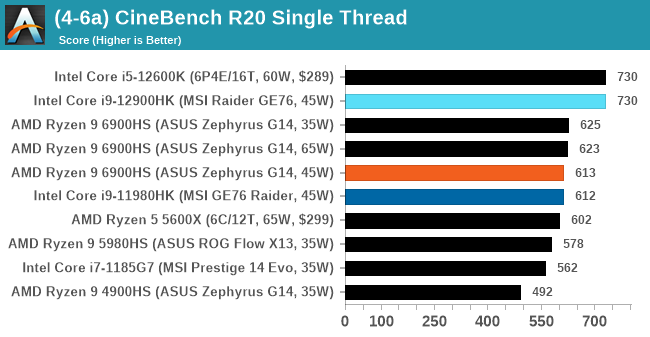
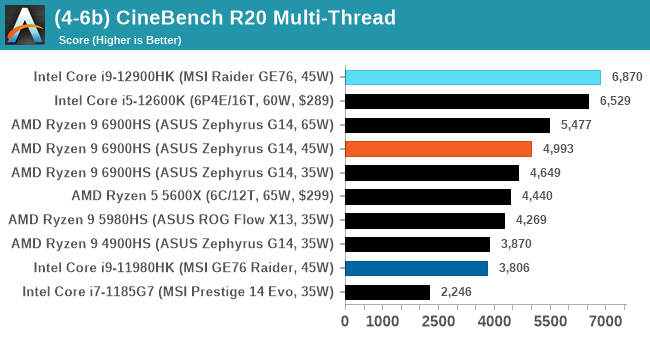
Cinebench R20: Link
Another common stable of a benchmark suite is Cinebench. Based on Cinema4D, Cinebench is a purpose built benchmark machine that renders a scene with both single and multi-threaded options. The scene is identical in both cases. The R20 version means that it targets Cinema 4D R20, a slightly older version of the software which is currently on version R21. Cinebench R20 was launched given that the R15 version had been out a long time, and despite the difference between the benchmark and the latest version of the software on which it is based, Cinebench results are often quoted a lot in marketing materials.
Results for Cinebench R20 are not comparable to R15 or older, because both the scene being used is different, but also the updates in the code bath. The results are output as a score from the software, which is directly proportional to the time taken. Using the benchmark flags for single CPU and multi-CPU workloads, we run the software from the command line which opens the test, runs it, and dumps the result into the console which is redirected to a text file. The test is repeated for a minimum of 10 minutes for both ST and MT, and then the runs averaged.
Encoding
One of the interesting elements on modern processors is encoding performance. This covers two main areas: encryption/decryption for secure data transfer, and video transcoding from one video format to another.
In the encrypt/decrypt scenario, how data is transferred and by what mechanism is pertinent to on-the-fly encryption of sensitive data - a process by which more modern devices are leaning to for software security.
Video transcoding as a tool to adjust the quality, file size and resolution of a video file has boomed in recent years, such as providing the optimum video for devices before consumption, or for game streamers who are wanting to upload the output from their video camera in real-time. As we move into live 3D video, this task will only get more strenuous, and it turns out that the performance of certain algorithms is a function of the input/output of the content.
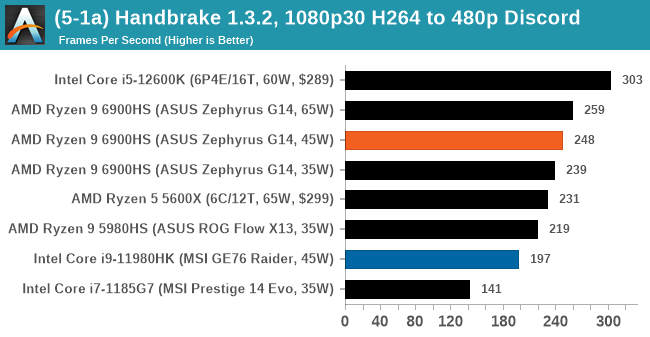
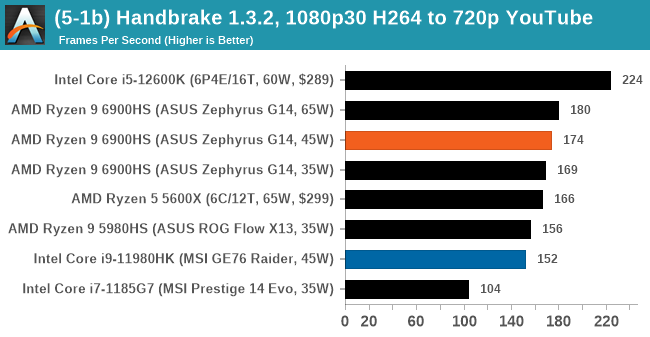
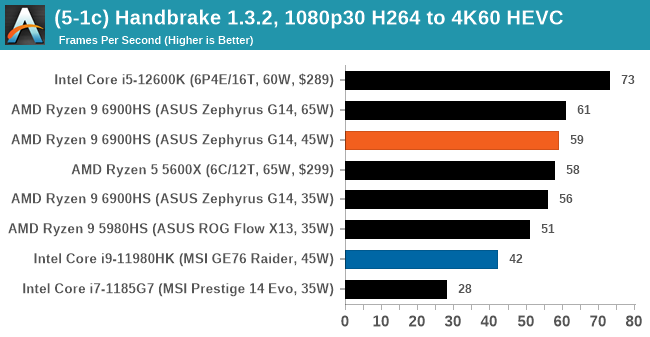
HandBrake 1.32: Link
Video transcoding (both encode and decode) is a hot topic in performance metrics as more and more content is being created. First consideration is the standard in which the video is encoded, which can be lossless or lossy, trade performance for file-size, trade quality for file-size, or all of the above can increase encoding rates to help accelerate decoding rates. Alongside Google's favorite codecs, VP9 and AV1, there are others that are prominent: H264, the older codec, is practically everywhere and is designed to be optimized for 1080p video, and HEVC (or H.265) that is aimed to provide the same quality as H264 but at a lower file-size (or better quality for the same size). HEVC is important as 4K is streamed over the air, meaning less bits need to be transferred for the same quality content. There are other codecs coming to market designed for specific use cases all the time.
Handbrake is a favored tool for transcoding, with the later versions using copious amounts of newer APIs to take advantage of co-processors, like GPUs. It is available on Windows via an interface or can be accessed through the command-line, with the latter making our testing easier, with a redirection operator for the console output.
We take the compiled version of this 16-minute YouTube video about Russian CPUs at 1080p30 h264 and convert into three different files: (1) 480p30 ‘Discord’, (2) 720p30 ‘YouTube’, and (3) 4K60 HEVC.
7-Zip 1900: Link
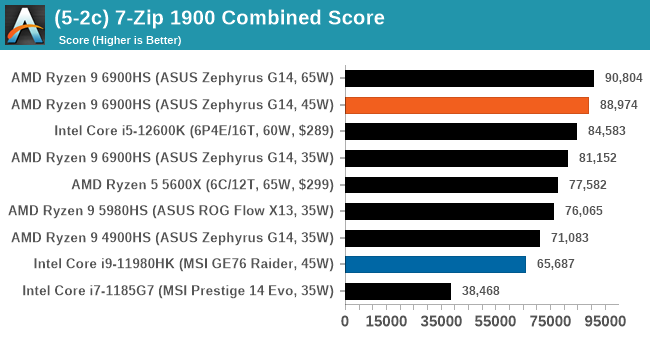
The first compression benchmark tool we use is the open-source 7-zip, which typically offers good scaling across multiple cores. 7-zip is the compression tool most cited by readers as one they would rather see benchmarks on, and the program includes a built-in benchmark tool for both compression and decompression.
The tool can either be run from inside the software or through the command line. We take the latter route as it is easier to automate, obtain results, and put through our process. The command line flags available offer an option for repeated runs, and the output provides the average automatically through the console. We direct this output into a text file and regex the required values for compression, decompression, and a combined score.
AES Encoding
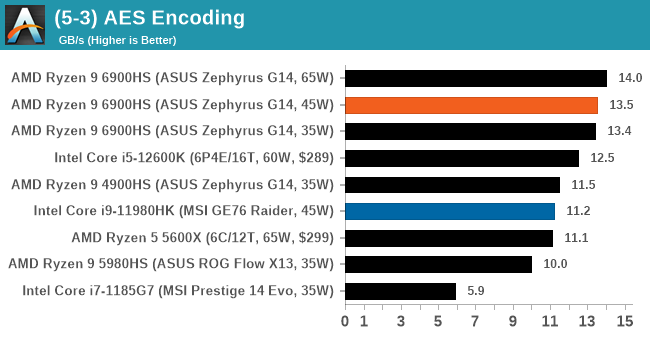
Algorithms using AES coding have spread far and wide as a ubiquitous tool for encryption. Again, this is another CPU limited test, and modern CPUs have special AES pathways to accelerate their performance. We often see scaling in both frequency and cores with this benchmark. We use the latest version of TrueCrypt and run its benchmark mode over 1GB of in-DRAM data. Results shown are the GB/s average of encryption and decryption.
WinRAR 5.90: Link
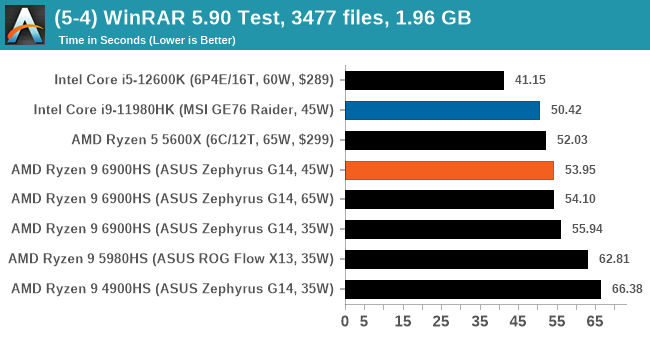
For the 2020 test suite, we move to the latest version of WinRAR in our compression test. WinRAR in some quarters is more user friendly that 7-Zip, hence its inclusion. Rather than use a benchmark mode as we did with 7-Zip, here we take a set of files representative of a generic stack
- 33 video files , each 30 seconds, in 1.37 GB,
- 2834 smaller website files in 370 folders in 150 MB,
- 100 Beat Saber music tracks and input files, for 451 MB
This is a mixture of compressible and incompressible formats. The results shown are the time taken to encode the file. Due to DRAM caching, we run the test for 20 minutes times and take the average of the last five runs when the benchmark is in a steady state.
For automation, we use AHK’s internal timing tools from initiating the workload until the window closes signifying the end. This means the results are contained within AHK, with an average of the last 5 results being easy enough to calculate.
Conclusion
When AMD announced the new Ryzen 6000 Mobile series, codename Rembrandt, we saw a number of distinct upgrades over the previous generation: moving from TSMC 7nm to TSMC 6nm should provide a small efficiency boost, and then coupled with the move from DDR4 to DDR5 should greatly improve any memory-bound workloads. Instead of Vega graphics we now move to RDNA2 graphics, which should provide a much better gaming experience, coupled with that increased memory bandwidth. On top of that all, we were told about AMD’s 50+ updates to the SoC focused on power management, wake from sleep, and race to sleep. The one thing that we knew didn’t change was the CPU core: despite being called Zen3+, there is no difference in the microarchitecture compared to Zen3 – the reason why it gets a plus is due to the power management techniques, improved memory, and new manufacturing process.
But the fact of the matter is, CPU performance is more than just the microarchitecture and frequency. Beyond that, it’s the memory subsystem, which also contributes directly to IPC or performance per clock. This is why I’ve gone off iso-frequency testing for this sort of comparison, because each product is built with optimization points in mind, and moving simply the core frequency causes a different balance of resources compared to the ‘as built’ and ‘as sold’ metrics. This is why when we put Zen3+ up against Zen3 at a similar power level, we’re seeing a sizable uptick in performance.
In our industry standard SPEC tests, this translates to an +11.9% average increase for Zen3+ across integer and floating point in single threaded mode compared to Zen3. In multi-threaded mode at 35 W, this was a +10.4% for integer, but +32.4% for floating point. We saw a similar size jump in our multi-threaded floating point SPEC tests when Intel’s Alder Lake moved from DDR4 to DDR5, showcasing that there are key industry standard workloads for which DRAM memory bandwidth is still the limiting factor.
So while it’s a great move to see AMD jump into DDR5 with this new platform, the elephant in the room is still the performance against similar power hardware from Intel. Unfortunately we don’t have too many data points, as Brett in Canada tested the performance-focused 12900HK, and I’m the UK where I tested the efficiency-focused 6900HS, but suffice to say that in raw performance at least, comparing P cores to Zen3+ and multi-threaded workloads, Intel still has an advantage. Intel’s advantage increases when we increase the power, as it seemingly has more frequency to give, whereas AMD’s Rembrandt is already near peak all-core frequency at modest 35-45W power levels. This is showcasing one difference between the two manufacturing processes: AMD on TSMC N6, and Intel on Intel 7.
If we take something as simple as CineBench R20 (everyone’s favorite), the Intel CPU in 45 W mode scores 730, while the AMD CPU in 45 W mode scores 613, only matching Intel’s previous generation. That’s partly due to the single threaded power consumption on both platforms – while AMD is using 12.9 W on the cores (23 W package) to reach one thread at 4850 MHz, and doesn’t improve single thread performance in higher power modes, Intel does gets a performance uplift going from 45 W to 65 W, suggesting that the single thread power consumption is up in that region.
The same applies for multi-threading – in a lot of our benchmarks we see that AMD scores minor gains going from 35 W to 45 W to 65 W, indicating that the efficiency point is really around that 35 W metric. But when we scale that up to the multi-threaded tests, Intel can scale power for additional performance a lot more, but also wins as it has a total of 20 threads, compared to AMD’s sixteen. This means at the end of the day Intel can get +40% performance at the same power in benchmarks that can take advantage of its core structure, but only +14% in other tests (like SPEC) despite having +25% more cores.
While we haven’t touched battery life or graphics in this article, instead looking at CPU performance, we can see that realistically AMD is finding a good optimization point around that 35 W mark with this new Rembrandt chip. Pushing for more power gives minor performance uplifts, suggesting it isn’t really that scalable, but when we combine the new updated SoC with the move to DDR5, it’s still a great performer. In fact, both Intel and AMD chips seem to be amazing this generation, and if you’re in the market for a flagship, CPU performance is everywhere. But right now, Intel seems ahead at the high-end.
What’s going to be interesting here is testing the 15 W versions of the latest platforms. AMD still has 8 core processors, with all 8 cores being big cores, whereas Intel has moved down to 2 big cores paired with 8 efficient cores. We might see the tides shift the other direction allowing AMD to be more scalable, pushing 15 W or higher modes with more performance, while Intel relies on the efficient cores to pick up the rest of the workload. Ultimately this is where the battle really matters, as this is at the price points where most notebooks are going to be sold.

